
2
The Epidemiology of Childhood Cancer
INCIDENCE AND SURVIVAL1
An estimated 12,400 American children and adolescents under age 20 were diagnosed with cancer in 2000. Childhood cancer is rare, and the rate at which new cases develop among children (incidence) is 15.3 per 100,000 per year, which corresponds roughly to 1 in 6,500 children and adolescents under age 20 (Ries et al., 2002). The risk of any individual child developing cancer between birth and 20 years of age is about 1 in 300. There were an estimated 2,300 deaths in 2000 due to cancer in this age group, representing about 8 percent of all deaths (American Cancer Society, 2000). Cancer is the third leading cause of death among children age 1 to 4, and the second leading cause of death among children age 5 to 14 (Minino and Smith, 2001) (Table 2.1).
Genetic factors and certain prenatal (e.g., radiation, diethylstilbestrol [DES]) and postnatal exposures (radiation, viruses) are known to increase the risk of developing some childhood cancers, but for most cases of childhood cancer, the cause remains unknown. Childhood cancers are classified primarily by histology into 12 major categories using the International Classification of Childhood Cancers (ICCC). The distribution of childhood cancer by ICCC category for children and young adults under age 20 is shown in Figure 2.1.
A brief description follows of the characteristics of these 12 categories of childhood cancer (defined as cancer occurring before age 20) including their associated pathology, epidemiology, and relative survival rates.2,3 Treatment of childhood cancer and late effects associated with disease and treatment are discussed in Chapters 3 and 4.
1. Leukemia Leukemia is the most common childhood cancer, accounting for 25 percent of all cancer occurring before age 20. There are two main types of childhood leukemia—acute lymphoblastic leukemia (ALL), accounting for about three-fourths of leukemias, and acute myeloid leukemia (AML) accounting for much of the remainder of leukemia cases. ALL is a disease of the blood-forming tissues of the bone marrow and is characterized by the overproduction of immature lymphocytes (a type of white blood cell). ALL occurs at all ages, from birth to adulthood, but the peak incidence is between 2 and 6 years of age. In the United States, there is a preponderance of whites and males among children and young adults with ALL. Improvements in treatment have led to remarkable gains in survival, estimated at 79 percent at 5 years. Acute myeloid leukemia, a cancer of the myeloid lineage of white blood cells, occurs at all ages of childhood. The outcome is poorer for AML than for ALL, with a 5-year survival rate of 41 percent.
2. Central nervous system tumors (cancers) and miscellaneous intracranial and intraspinal neoplasms. Central nervous system (CNS) tumors make up the second largest category of neoplasms in children, accounting for 17 percent of childhood cancers. More than half of all CNS malignancies in children and adolescents are a type of brain tumor known as astrocytomas (tumors that arise from star-shaped brain cells call astroctyes). Other common pediatric brain tumors include medulloblastomas (fast-growing tumors usually located in the cerebellum), brain stem gliomas, ependymomas, and optic nerve gliomas. The highest incidence rates of CNS tumors occur among infants and children through age seven. Five-year relative survival rates have improved over time to 67 percent.
3. Lymphomas and other reticuloendothelial neoplasms. Lymphomas (cancers of the lymphatic system) and other reticuloendothelial neoplasms account for 16 percent of childhood cancers. The risks of Hodgkin’s disease and non-Hodgkin’s lymphoma, the major types of cancer in this cat-
TABLE 2.1 Number of Deaths and Death Rates for the 10 Leading Causes of Death in Specified Age Groups, United States, 2000
|
|
Age 1-4 years |
||
|
Cause of Deatha |
Rankb |
Number |
Rate |
|
All causes |
— |
4,942 |
32.6 |
|
Accidents |
1 |
1,780 |
11.7 |
|
Motor vehicle accidents |
|
630 |
4.2 |
|
All other accidents |
|
1,150 |
7.6 |
|
Congenital malformations, deformations, and chromosomal abnormalities |
2 |
471 |
3.1 |
|
Malignant neoplasms |
3 |
393 |
2.6 |
|
Assault (homicide) |
4 |
318 |
2.1 |
|
Diseases of the heart |
5 |
169 |
1.1 |
|
Influenza and pneumonia |
6 |
96 |
0.6 |
|
Septicemia |
7 |
91 |
0.6 |
|
Certain conditions originating in the perinatal period |
8 |
84 |
0.6 |
|
In situ neoplasm, benign neoplasms, and neoplasms of uncertain or unknown behavior |
9 |
56 |
0.4 |
|
Cerebrovascular diseases |
10 |
45 |
0.3 |
|
Chronic lower respiratory diseases |
— |
— |
— |
|
Human immunodeficiency virus (HIV) disease |
— |
— |
— |
|
Intentional self-harm |
— |
— |
— |
|
All other causes |
— |
1,439 |
9.5 |
|
NOTE: Data are based on continuous file of records received from the states. Rates per 100,000 population in specified group. Figures are based on weighted data rounded to the nearest individual, so categories may not add to totals. Mortality data are not published on the age group 0 to 19 or 15 to 19. |
|||
|
Age 5-14 years |
Age 15-24 years |
||||
|
Rankb |
Number |
Rate |
Rankb |
Number |
Rate |
|
— |
7,340 |
18.5 |
— |
30,959 |
80.7 |
|
1 |
2,878 |
7.3 |
1 |
13,616 |
35.5 |
|
|
1,716 |
4.3 |
|
10,357 |
27.0 |
|
|
1,163 |
2.9 |
|
3,259 |
8.5 |
|
3 |
387 |
1.0 |
6 |
425 |
1.1 |
|
2 |
1,017 |
2.6 |
4 |
1,668 |
4.3 |
|
4 |
364 |
0.9 |
2 |
4,796 |
12.5 |
|
6 |
236 |
0.6 |
5 |
931 |
2.4 |
|
9 |
83 |
0.2 |
8 |
188 |
0.5 |
|
— |
— |
— |
— |
— |
— |
|
— |
— |
— |
— |
— |
— |
|
8 |
106 |
0.3 |
— |
— |
— |
|
10 |
78 |
0.2 |
7 |
193 |
0.5 |
|
7 |
130 |
0.3 |
9 |
180 |
0.5 |
|
— |
— |
— |
10 |
178 |
0.5 |
|
5 |
297 |
0.7 |
3 |
3,877 |
10.1 |
|
— |
1,764 |
4.4 |
— |
4,907 |
12.8 |
|
aBased on the Tenth Revision, International Classification of Diseases, 1992. bRank based on number of deaths. SOURCE: Minino and Smith, 2001. |
|||||
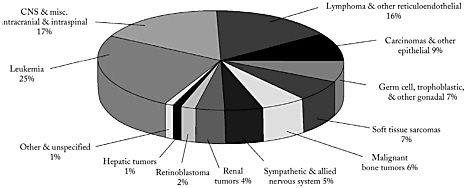
FIGURE 2.1 Distribution of childhood cancers (age 0-19), by ICCC category, 1975-1995.
SOURCES: ACS, 2000; Ries et al., 1999. Data from the Surveillance, Epidemiology, and End Results Program (SEER), Division of Cancer Control and Population Sciences, National Cancer Institute.
egory, rise throughout childhood. Non-Hodgkin’s lymphoma includes T-cell lymphoma, usually found in preadolescent or adolescent males, large cell lymphoma, usually found in children over 5, and small cell lymphoma (Burkitt’s or non-Burkitts’s). The five-year relative survival rate has risen to 92 percent for Hodgkin’s disease, and 73 percent for non-Hodgkin’s lymphoma.
4. Carcinomas and other malignant epithelial neoplasms. Two malignancies in this category—thyroid cancer and melanoma—account for 9 percent of childhood cancers. Five-year survival rate is 99 percent for thyroid cancer and 92 percent for melanoma.
5. Germ cell, trophoblastic, and other gonadal neoplasms. This category accounts for 7 percent of childhood cancers. Germ cell tumors develop from testicular or ovarian cells. Sometimes these cells travel to the chest or abdomen where they may turn into a rare type of cancer called extragonadal germ cell tumor. Incidence rates and survival duration for these cancers has increased between 1975 and 1997; the 5-year survival rate now ranges between 75 and 94 percent for germ cell tumors.
6. Soft tissue sarcomas. Soft tissue sarcomas account for about 7 percent of childhood cancers. Rhabdomyosarcoma, a disease in which malignant cells arise from muscle tissue, is the most common soft tissue tumor among children under age 15. Other sarcomas are more common among those ages 15 to 19. The 5-year survival rate for soft tissue sarcomas is 71 percent, a rate that has not changed much since the 1975-1984 decade.
7. Malignant bone tumors. Malignant bone tumors account for 6
percent of childhood cancers. Peak incidence is at age 15, a trend that coincides with adolescent growth spurts. Osteosarcoma is the most common cancer in this category, which in children often occurs in the bones around the knee. Ewing’s sarcoma is a rare bone cancer that usually occurs in adolescence and is more common in girls than boys. Five-year survival rates have improved substantially over time, to 65 percent for osteosarcoma and 59 percent for Ewing’s sarcoma.
8. Sympathetic and allied nervous system tumors. Cancers in this category account for 5 percent of childhood cancers and are the most common cancers diagnosed in the first year of life. Neuroblastoma accounts for virtually all cases of cancer in this category. Neuroblastoma is a solid cancerous tumor that begins in nerve tissue in the neck, chest, abdomen, or pelvis, but usually originates in the abdomen in the tissues of the adrenal gland. By the time it is diagnosed, the cancer usually has metastasized, most commonly to the lymph nodes, liver, lungs, bones, and bone marrow. Two- thirds of children with neuroblastoma are diagnosed when they are younger than 5 years of age. Although neuroblastoma may be present at birth, it does not always proceed to become an invasive malignancy, a circumstance unique to neuroblastoma. In contrast with CNS malignancies, survival is highest among infants under 1 year of age, and declines with increasing age. Overall, the 5-year survival rate for children with sympathetic and allied nervous system tumors has improved to 66 percent.
9. Renal tumors. Renal tumors account for 4 percent of childhood cancers. Wilms’ tumors account for more than 90 percent of malignancies of the kidney among children and adolescents, usually affecting those under age 5. Wilms’ tumor may involve one or both kidneys. Between 1975 and 1997, 5-year survival rates improved for Wilm’s tumor, rising from 81 percent to 91 percent
10. Retinoblastoma. Accounting for 2 percent of childhood cancers, retinoblastoma is a rare tumor involving the retina of the eye, or sometimes the pineal gland. Although retinoblastoma may occur at any age, it most often occurs in younger children, usually before the age of 5 years. The tumor may be in one or both eyes. Retinoblastoma is usually confined to the eye and does not spread to nearby tissue or other parts of the body. Retinoblastoma may be hereditary or nonhereditary. The hereditary form may occur in one or both eyes, and generally affects younger children. Most cases of retinoblastoma that occur in only one eye are not hereditary and are found more often in older children. When the disease occurs in both eyes, it is always hereditary. Five-year survival rate is about 94 percent and has not changed over the past two decades.
11. Hepatic tumors. A rare malignancy in childhood, liver tumors account for just over 1 percent of childhood cancers. More than two-thirds
of hepatic tumors in children are hepatoblastomas, most of which appear during the first 18 months of life and may be caused by an abnormal gene. The remaining cases of hepatic tumors consist mostly of hepatocellular carcinoma, which does not usually occur before age 15. Children infected with hepatitis B or C are more likely than other children to develop hepatocellular cancer. Immunization against hepatitis B may decrease the risk of hepatocellular cancer. Five-year survival rates are 54 percent for all hepatic tumors, but somewhat higher (63 percent) for hepatoblastoma.
12. Other and unspecified. Less than 1 percent of childhood cancers fall into this category.
Improvements in survival from the period 1975-1984 to 1985-1994 by type of cancer are illustrated in Figure 2.2. Survival improved from 1975 to 1994 for almost all categories of childhood cancer.
A child or adolescent diagnosed with cancer in 1994 had a 78 percent chance of surviving 5 years, while the overall 5-year relative survival rate was 56 percent for those diagnosed in 1975 (Ries et al., 2002). The largest impact on these trends has been the result of dramatic improvement in survival from leukemia, which accounts for one-quarter of cancers in individuals under age 20. The advent of newer, more effective chemotherapy treatments is the principal cause of improved survival among childhood cancer patients. Figure 2.3 shows improvements in childhood cancer survival by race from 1974 to 1998. There have been improvements in survival overall, but by 1983 a survival gap had emerged between white and blacks, which by 1998 had not closed (Figure 2.3). An analysis of overall survival, by race and treatment era, of patients treated at the St. Jude Children’s Research Hospital concluded that black children with cancer fare as well as white children when treated with protocol-based therapy at a pediatric oncology research center (Pui et al., 1995). In a more recent study, however, significant racial and ethnic differences in overall survival were found among patients with ALL receiving contemporary therapy at Children’s Cancer Group institutions (Bhatia et al., 2002). Relative to white patients, black and Hispanic children had poorer outcomes and Asian children had better outcomes.
The incidence rate of all childhood cancers combined increased from the early 1970s—when rates were first measured by the Surveillance, Epidemiology, and End Results (SEER) program of the National Cancer Institute—until 1991 and then leveled off and declined slightly through 1999 (Figure 2.4). Some of the increase in incidence has been attributed to improvements in diagnosis and better case identification. Mortality rates from all childhood cancers combined decreased steadily from 1975 to 1999 (Figure 2.4).
Incidence and mortality rates by race and sex are shown for the period
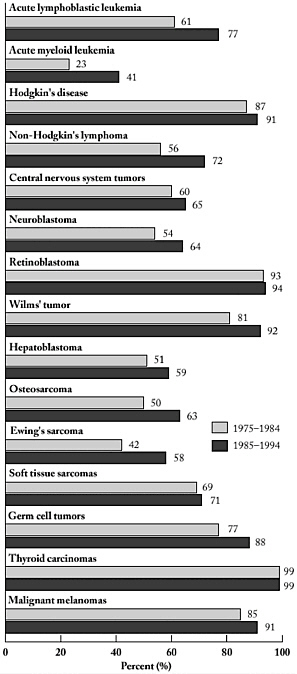
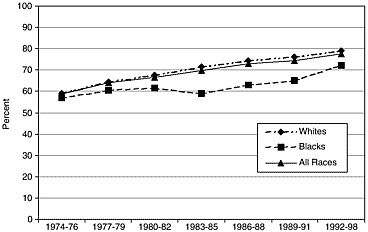
FIGURE 2.3 Five-year relative cancer survival rates (age 0-19), 1974-1998.
SOURCE: Ries et al., 2002.
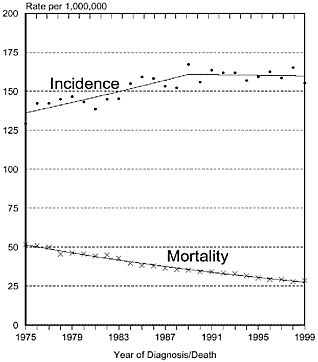
FIGURE 2.4 Age-adjusted cancer incidence and mortality rates (age 0-19), 1975-1999.
NOTE: SEER nine areas and NCHS public use data file. Rates are age-adjusted to the 2000 U.S. standard million population by 5-year age groups. Regression lines are calculated using the Joinpoint Regression Program.
SOURCE: Ries et al., 2002.
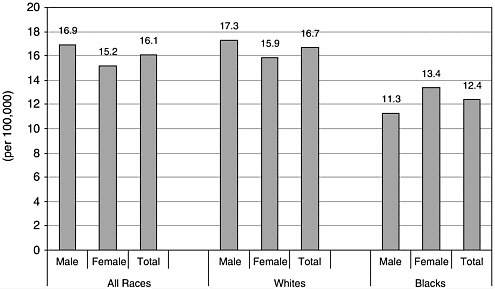
FIGURE 2.5 Age-adjusted cancer incidence rates (age 0-19), by race and sex, 1995-1999.
SOURCE: Ries et al., 2002.
1993 to 1999, the latest figures available from the NCI SEER program. Incidence rates are higher among whites than blacks (Figure 2.5) and mortality rates are higher among males than females (Figure 2.6).
Newly diagnosed cancer cases occur in roughly equal share among three age groups: younger than age 5, ages 5 to 14, and ages 15 to 19 (Figure 2.7).
Childhood cancer incidence rates are shown by diagnosis and age in Figure 2.8. Lymphocytic leukemia and CNS tumors are the predominant cancers among children under age 15. Hodgkin’s disease, epithelial and other unspecified cancers, germ cell, trophoblastic, and other gonadal neoplasms are the predominant cancers among those age 15 to 19 (Figure 2.8).
THE PREVALENCE OF CHILDHOOD CANCER
The Prevalence of Cancer Among Children and Young Adults
In 1997 there were an estimated 94,800 U.S. children and young adults under age 20 who had ever been diagnosed with cancer. The prevalence of cancer among this age group was 1.24 per 1,000 (94,799/76,753,000). In other words, an estimated 1 in 810 individuals under age 20 alive in 1997 had a history of cancer (Table 2.2).
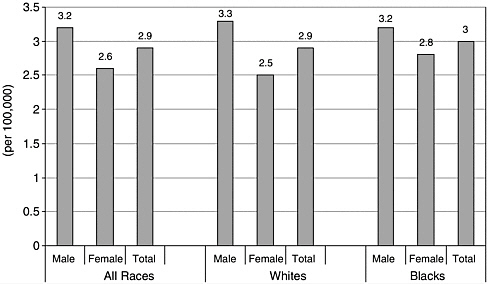
FIGURE 2.6 Age-adjusted cancer mortality rates (age 0-19), by race and sex, 1995-1999.
SOURCE: Ries et al., 2002.
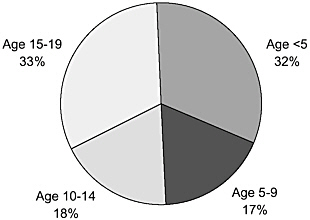
FIGURE 2.7 Age distribution of incident childhood cancers, SEER, 1975-1995.
SOURCE: Ries et al., 1999.
Estimates of prevalence for other chronic health problems among children are difficult to obtain because there are few other national disease-specific, population-based registration systems. Estimates from the 2000 National Health Interview Survey of the number of children under age 18 with selected relatively common impairments and health conditions are
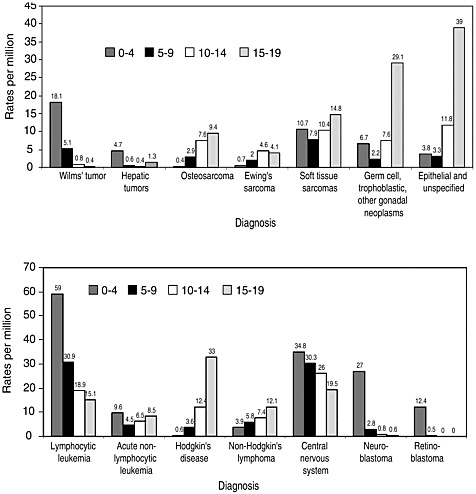
FIGURE 2.8 Childhood cancer incidence rates, by age, 1991-1995.
SOURCE: Adapted from American Cancer Society, 2000, based on data from Cancer in North America, 1991-1995, North American Association of Central Cancer Registries.
shown in Table 2.3, which helps put childhood cancer survivorship into perspective relative to other populations with special health care needs.
The Prevalence of Survivors of Childhood Cancer in the General Population
In 1997, there were an estimated 269,700 individuals of any age who had survived childhood cancer. Among the total U.S. population in 1997,
TABLE 2.2 Cancer Prevalence Estimates, by Current Age, U.S., 1997
|
Age |
Number |
Percent |
Population (in 1,000s) |
Prevalence (per 1,000) |
Prevalence (1 per x) |
|
All ages |
8,917,906 |
100.0% |
266,467 |
33.47 |
30 |
|
0-19 |
94,799 |
— |
76,753 |
1.24 |
810 |
|
0-4 |
11,177 |
0.1% |
19,193 |
0.58 |
1,717 |
|
5-9 |
21,026 |
0.2% |
19,592 |
1.07 |
932 |
|
10-14 |
25,460 |
0.3% |
19,046 |
1.34 |
748 |
|
15-19 |
37,136 |
0.4% |
18,922 |
1.96 |
51 |
|
20-24 |
50,787 |
0.6% |
17,493 |
2.90 |
34 |
|
25-29 |
91,716 |
1.0% |
18,870 |
4.86 |
206 |
|
30-34 |
138,403 |
1.6% |
21,020 |
6.58 |
152 |
|
35-39 |
216,990 |
2.4% |
22,589 |
9.61 |
104 |
|
40-44 |
314,717 |
3.5% |
21,092 |
14.92 |
67 |
|
45-49 |
466,974 |
5.2% |
18,466 |
25.32 |
40 |
|
50-54 |
558,276 |
6.3% |
14,542 |
38.39 |
26 |
|
55-59 |
667,347 |
7.5% |
11,555 |
57.75 |
17 |
|
60-64 |
884,211 |
9.9% |
10,029 |
88.17 |
11 |
|
65-69 |
1,192,635 |
13.4% |
9,838 |
121.23 |
8 |
|
70-74 |
1,388,930 |
15.6% |
8,771 |
158.35 |
6 |
|
75-79 |
1,239,461 |
13.9% |
6,989 |
177.35 |
6 |
|
80-84 |
897,765 |
10.1% |
4,620 |
194.34 |
5 |
|
85+ |
714,895 |
8.0% |
3,860 |
185.23 |
5 |
|
NOTE: Cancer prevalence estimates are for January 1, 1997, from NCI’s Canques program based on the Connecticut historical cancer registry (http://srab.cancer.gov/prevalence/index.html, accessed March 8, 2003.). The January 1, 1997, population estimate is a 2-year average of mid-Census estimates for July 1, 1996, and July 1, 1997. The 1997 population estimates will be revised in 2002 using Census 2000 data and overall prevalence estimates will likely decline somewhat because evidence suggests that population estimates made mid-Census were too low. Cancer prevalence refers to the number and distribution of individuals alive today with a current or prior diagnosis of cancer. |
|||||
about 1 individual in 1,000 was a childhood cancer survivor. Among young adults age 20 to 39, the prevalence of childhood cancer survivors is 1.56 per 1,000, or an estimated 1 in 640 individuals (Table 2.4).
DIFFERENCES BETWEEN CHILDHOOD AND ADULT CANCERS
Five-year survival rates among children with cancer exceed those observed among adults (78 percent vs. 62 percent) (Ries et al., 2002). Greater success in treating childhood cancer can, in part, be explained by biological differences between adult and childhood cancers (Simone and Lyons, 1998). About 90 percent of adult cancers are carcinomas derived from epithelial
TABLE 2.3 Prevalence of Selected Impairments and Health Conditions Among Children Under Age 18, National Health Interview Survey, United States, 2000
|
Impairment/Health conditiona |
Population (in 1,000s)b |
95% confidence interval |
|
Cognitive impairments |
||
|
Learning disabilityc |
4,755 |
4,364-5,147 |
|
Attention deficit hyperactivity disorder (ADHD/ADD)d |
4,005 |
3,657-4,352 |
|
Developmental delay |
2,225 |
1,949-2,500 |
|
Mental retardation |
525 |
398-652 |
|
Autism |
206 |
127-285 |
|
Sensory impairments |
||
|
Blind, trouble seeing even when wearing glasses or contact lenses |
1,390 |
1,184-1,596 |
|
Deaf, lot of trouble hearing (without a hearing aid) |
309 |
210-406 |
|
Conditions |
||
|
Asthma, ever |
8,918 |
8,385-9,452 |
|
Asthma episode past 12 months |
3,998 |
3,662-4,334 |
|
Congenital heart disease, other heart condition |
953 |
770-1,136 |
|
Seizure past 12 months |
467 |
360-573 |
|
Cerebral palsy |
463 |
308-617 |
|
Sickle cell anemia |
174 |
102-246 |
|
Functional limitations |
||
|
Limited mobility due to impairment/health problem (expected to last year or more) |
1,151 |
965-1,338 |
|
Need special equipment due to impairment/health problemd |
651 |
513-789 |
|
aCategories are not mutually exclusive and should not be added. bThe total estimated population of children under age 18 in 2000 was 72,326,000. These estimates are based on the sample child component of the National Health Interview Survey (n = 13,376). For specific health conditions (e.g., cerebral palsy), respondents were asked if a doctor or health professional had ever told them that the child had the condition. For learning disabilities, the respondent was asked if a school representative or health professional had told them of the disability. cAsked if child was age 2 to 17. dAsked if child was age 3 to 17. dRespondents were asked “Does . . . have any impairment or health problem that requires (him/her) to use special equipment, such as a brace, a wheelchair, or a hearing aid (excluding ordinary eyeglasses or corrective shoes)?” SOURCE: National Center for Health Statistics, 2002, National Health Interview Survey, 2000 (machine readable data file and documentation). National Center for Health Statistics, Hyattsville, Maryland, special tabulations, NCPB staff. |
||
TABLE 2.4 Cancer Prevalence Estimates for Survivors of Childhood Cancer (Diagnosed at Ages 0 to 19) by Current Age, U.S., 1997
|
Age |
Number |
Percent |
Population (in 1,000s) |
Prevalence (per 1,000) |
Prevalence (1 per x) |
|
All ages |
269,679 |
100.0% |
266,467 |
1.01 |
988 |
|
0-4 |
11,249 |
4.2% |
19,193 |
0.59 |
1,706 |
|
5-9 |
21,279 |
7.9% |
19,592 |
1.09 |
921 |
|
10-14 |
25,987 |
9.6% |
19,046 |
1.36 |
733 |
|
15-19 |
38,203 |
14.2% |
18,922 |
2.02 |
495 |
|
20-24 |
36,345 |
13.5% |
17,493 |
2.08 |
481 |
|
25-29 |
37,937 |
14.1% |
18,870 |
2.01 |
497 |
|
30-34 |
26,883 |
10.0% |
21,020 |
1.28 |
782 |
|
35-39 |
23,720 |
8.8% |
22,589 |
1.05 |
952 |
|
40-44 |
15,607 |
5.8% |
21,092 |
0.74 |
1,351 |
|
45-49 |
15,109 |
5.6% |
18,466 |
0.82 |
1,221 |
|
50-54 |
8,520 |
3.2% |
14,542 |
0.59 |
1,707 |
|
55+ |
8,840 |
3.3% |
55,661 |
— |
— |
|
NOTE: Cancer prevalence estimates are for January 1, 1997, from NCI’s Canques program based on the Connecticut historical cancer registry (http://srab.cancer.gov/prevalence/index.html). The January 1, 1997, population estimate is a 2-year average of mid-Census estimates for July 1, 1996, and July 1, 1997. The 1997 population estimates will be revised in 2002 using Census 2000 data and overall prevalence estimates will likely decline somewhat because evidence suggests that population estimates made mid-Census were too low. Above age 54 estimates are unreliable because registry data are available only from 1940. Some survivors of childhood cancer could have been diagnosed before 1940 and still alive in 1997. Such individuals are not included in these estimates. |
|||||
tissue. The more common adult cancers of the prostate, breast, lung, colorectum, uterus, and ovary all arise from cells that line cavities or glands. In contrast, childhood cancers are almost entirely leukemias, lymphomas, sarcomas, and cancers of the central nervous system, primarily neoplasms that arise from non-ectodermal tissue such as bone marrow, lymph glands, bone, and muscle. This difference in microscopic type affects tumor development and response to therapy. The latency period for progression to invasive, metastatic cancer is relatively long for carcinomas, perhaps 10 to 30 years. Childhood cancers have a latency period of 1 to 10 years and many appear to derive from embryonic “accidents.” Histologically, Wilms’ tumor of the kidney resembles fetal kidney tissue that normally evolves into normal mature kidney tissue by birth or early infancy. Clinical experience has demonstrated that carcinomas are more resistant to radiotherapy and chemotherapy as compared with other types of cancers, especially those with embryonic features common in childhood.
The therapeutic outcomes of microscopically identical cancers in adults and children are often different. Childhood ALL has a 5-year survival rate of about 83 percent. In adults under age 65, the “same” leukemia has a much lower 5-year survival rate, from 20 to 30 percent (Ries et al., 2002). Better outcomes among children relative to adults are likely due to significant differences in the molecular, cytogenetic, and immunologic features of ALL in adults and children. For example, the Philadelphia chromosome, a cytogenetic feature associated with a very low survival, is present in 30 to 40 percent of adults, but less than 5 percent of children (Look and Kirsch, 2002).
The fact that childhood cancer occurs in the context of rapid and dramatic growth and development also distinguishes it from adult cancers.
SUMMARY AND CONCLUSIONS
Childhood cancer is rare, but with improvements in treatment there has been a dramatic growth in the population of survivors. In 1997, there were an estimated 270,000 survivors of childhood cancer; 95,000 of them were under age 20 and the balance were adults. This translates to about 1 in 810 individuals under age 20 having a history of cancer, and 1 in 640 adults ages 20 to 39 having such a history.
Childhood cancers are a diverse set of conditions, but three predominant types make up the majority of diagnosed cases: leukemia; CNS and brain tumors; and lymphomas. Five-year survival rates vary by type of childhood cancer, but overall, 78 percent of children diagnosed with cancer will be alive in 5 years. Gains in survival have occurred for most types of childhood cancer, but the greatest strides have been made in children treated for leukemia. Even though mortality rates have declined steadily since 1975, cancer remains a leading cause of death among children.
REFERENCES
American Cancer Society. 2000. Cancer Facts and Figures, 2000. Atlanta, GA: American Cancer Society.
Bhatia S, Sather HN, Heerema NA, Trigg ME, Gaynon PS, Robison LL. 2002. Racial and ethnic differences in survival of children with acute lymphoblastic leukemia. Blood 100(6):1957-64.
Look A. T., Kirsch I.R. 2002. Molecular Basis of Childhood Cancer. Pizzo PA, Poplack DG In: Principles and Practice of Pediatric Oncology. Fourth ed. Philadelphia: Lippincott Williams & Wilkins. Pp. 45-88.
Minino AM, Smith BL. 2001. Deaths: preliminary data for 2000. Natl Vital Stat Rep 49(12):1-40.
Pui CH, Boyett JM, Hancock ML, Pratt CB, Meyer WH, Crist WM. 1995. Outcome of treatment for childhood cancer in black as compared with white children. The St Jude Children’s Research Hospital experience, 1962 through 1992. JAMA 273(8):633-7.
Ries LAG, Eisner MP, Kosary CL, Hankey BF, Miller BA, Clegg L, Edwards BK, Editors. 2002. SEER Cancer Statistics Review, 1973-1999. Bethesda, MD: National Cancer Institute.
Ries LAG, Smith MA, Gurney JG, Linet M, Tamra T, Young JL, Bunin GR, Editors. 1999. Cancer Incidence and Survival Among Children and Adolescents: United States SEER Program 1975-1995. Bethesda, MD: National Cancer Institute, SEER Program.
Simone JV, Lyons J. 1998. The evolution of cancer care for children and adults. J Clin Oncol 16(9):2904-5.


