
CLOSING SESSION
The final session of the workshop was devoted to open discussion among all of the participants, and it focused on identifying critical issues that emerged from the previous sessions. The participants generally agreed that there have been significant developments in our understanding on a number of relevant fronts, and it is encouraging that all of the recent model estimates are within the same range of each other and within that of empirically derived values. However, participants also identified a number of challenges that inhibit further progress in quantifying and understanding climate sensitivity. The following is a brief summary of some key points raised in these discussions. Although often more than one person expressed many of the ideas listed below, they are presented as a record of the discussion and are not intended to be consensus conclusions (which were neither possible, nor desirable, given the workshop format used for this meeting).
CLIMATE SENSITIVITY CAN BE DEFINED IN NUMEROUS WAYS
-
Not all researchers define sensitivity in the same way. In some contexts, it is treated strictly as an input coefficient for a parameterized model or as a model’s response to a doubling of CO2. In this case, there are a limited number of degrees of freedom or feedbacks allowed. In the most restrictive sense, sensitivity includes only the feedbacks on tropospheric water vapor and clouds. In other approaches, sensitivity is more broadly defined as a measure of the sensitivity of the whole earth system, including ecosystem and CO2 feedbacks that result from a specific external forcing (e.g., orbital changes, solar, or volcanoes).
-
In essence, the definition of climate sensitivity depends upon what processes in a model are treated as exogenous and are thus viewed as forcings, and what processes are treated as endogenous and are thus viewed as feedbacks (see earlier discussions about whether indirect aerosol effects should be treated as a forcing or a feedback). Even when two models include the same feedbacks, they may handle such processes very differently (see earlier discussion of GCM cloud parameterizations)
-
There may be inherent limitations in our ability to quantify climate sensitivity.
-
Some uncertainties that currently limit our ability to quantify climate sensitivity could be removed if we were able to obtain better temperature records and better estimates of past radiative forcing, but it must be acknowledged that some uncertainties (including the internally generated noise of the climate system) will never be removed.
-
It may be unrealistic to focus on developing a perfect projection of future changes or a perfect re-creation of the historical climate record. The earth’s climate system is not deterministic on longer time scales and since the historical record is just one realization out of many that could have occurred, it thus may not be a “stable platform” for projecting future changes.
-
The chaos of the system may preclude the kinds of specific projections about local or regional climate that decision makers really want, but the general magnitude and rates of change may be predictable with knowledge of the forcings and feedbacks and with knowledge of the low frequency natural variability acting within the changing climate.
A REMAINING CHALLENGE IS CONSTRAINING THE HIGH END OF THE PDF FOR CLIMATE SENSITIVITY
-
Statistical approaches have been useful for constraining the low end of the PDF for climate sensitivity, but this approach seems to fail in constraining the high end (the “tail”) of the distribution curve.
-
Further studies will have to explore whether the distribution tail can be better constrained using observational data, both from the modern record and from paleo-records. There may be physical constraints or GCM diagnostic tests that can be used to assess the plausibility of the high-end sensitivity values (i.e., tests that
-
would allow us to reject some high-end estimates as unrealistic by finding clear inconsistencies between models and observations.)
-
Currently, we rely on global average temperature as the primary observational constraint. With greater use of all available observational data (e.g., information about regional precipitation patterns), we may be able to define additional constraints. However, our progress in constraining the high end of the distribution may remain limited until we can better quantify aerosol radiative forcing.
-
With climate models there is a computational trade-off because going further out on the distribution tail can require a prohibitive number of computer runs. On the other hand, simple models allow an essentially unlimited number of runs, but the output is often highly sensitive to small changes in the input values, which results in an inherent uncertainty.
-
There may be some important gaps in our understanding of basic physical processes in the climate system, which limits our ability to credibly project high-consequence, low-probability events. There also seem to be problems in our statistical approaches for predicting such events (which may be why we find that some areas are hit with a “500-year” flood multiple times within a few decades). Such problems deserve attention because high-risk, low-probability events are often of great interest to policy makers.
FURTHER PROGRESS WILL REQUIRE A VARIETY OF MODELING APPROACHES
-
It would be useful to policy makers if we could provide other, more complex indicators of climate response that are tied more directly to regional-scale changes in temperature, precipitation, and other critical parameters. Perhaps we should consider new approaches to interpreting global climate model results that would allow us to calculate how important variables (such as precipitation and sea ice cover) change in direct relation to radiative forcing, rather than just scaling everything with the global average temperature estimated by a climate model.
-
Improving the understanding of how climate sensitivity evolves over time could be achieved by developing models that include more regional scale information about anthropogenically driven changes in the climate system, such as human influences on land surface characteristics and hydrological and biogeochemical cycles, as well as aerosol radiative forcing changes from biomass-burning aerosols.
-
Model comparison studies are valuable for helping people understand the effects of particular feedbacks on sensitivity. For instance, the recent NCAR-GFDL-Hadley intercomparison studies confirmed the essential role of cloud feedbacks. Such studies are most useful if they focus on evaluating those aspects that differ most among models, and against observations, and use this to improve the models. The goal should not be to look for one “best” modeling approach or to get the same answers from all models; if that were the case, we would have a tendency to believe the models, even if there is no real basis for doing so.
-
Probabilistic estimates of uncertainty will continue to have an important role in advancing understanding. The output of a model is inherently statistical, and there is no escaping the need for PDFs and for ensemble modeling. The scientific community has previously advised that an assessment requires the use of at least three models and three realizations from each model. Otherwise, you cannot know whether the difference between two models is significant relative to the difference between ensemble runs from the same model.
-
There is reason to hope that we can further narrow the range of sensitivity estimates through a combination of climate model results and PDFs derived from simple models. These approaches are complementary for a variety of reasons. GCMs are crucial for getting the regional details correct, but simple models are needed for probabilistic studies of global mean changes. Simple modeling approaches can indicate areas of interest that can be explored in greater detail with GCMs. Finally, PDFs from simple models could perhaps be added as a new type of routine diagnostic to understand the statistics of GCMs.
OTHER ISSUES EXIST FOR THE SCIENTIFIC COMMUNITY
-
Current approaches focus primarily on the simple 2*CO2 scenario. Interpretation of model output will be most useful if it focuses more explicitly on the role of other radiative forcing agents, including the recognition that climate sensitivity may vary somewhat, depending on the type of forcing
-
El Niño-Southern Oscillation (ENSO) cycle realizations provide an opportunity to evaluate the role of some climate feedbacks associated with model sensitivity, perhaps most notably variations in cloudiness and other aspects of global hydrology.
-
Narrowing the range of forcings associated with aerosols is likely to aid in constraining the high end of the PDF for climate sensitivity. Moreover, if radiative forcing from aerosol-induced changes to ice clouds were included in climate models, it could change our understanding of the future projected temperature change associated with a given climate sensitivity.
-
Continued interaction between modelers and observational specialists is important. Modeling studies can be used to determine what types of observational data are needed (relative to what we have) and to explore the potential “information content” of proposed new observational networks.
-
In addition to improved technical modeling capabilities there is the question of how to use this information. Currently, our capability to translate climate model results into useful information about local and regional impacts is limited. The sophistication of climate impact research is rapidly improving, but more interaction with the modeling community could improve the way model results are used and help define the metrics of local and regional change.
-
As the workshop concluded, participants talked in general about how scientists might continue to improve their ability to communicate about uncertainties. Concern was raised that scientists (particularly in the realm of climate change research) have a tendency to emphasize uncertainties so much that it can appear to policy makers and others that nothing is known. More careful and creative communication could help so that policy makers are told clearly what is known, what progress has been made, and what remains to be learned.
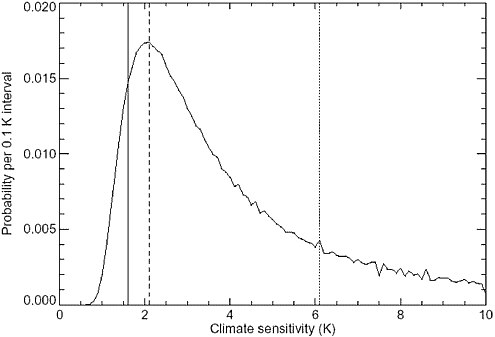
Figure 3. Probability distribution for the effective climate sensitivity, computed assuming ΔT, ocean heat uptake, and radiative forcing to be normally distributed. The bin width is 0.1 K. The vertical solid line marks the lower bound of the 90 percent confidence interval (fifth percentile); the vertical dashed line, the modal value of sensitivity; and the vertical dotted line, the median. Although the distribution is shown here only up to 10 K, the probability of higher values was accounted for in deriving the statistics and confidence interval.
SOURCE: Gregory et al., 2002.
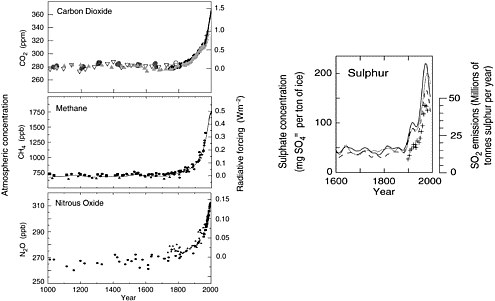
Figure 4. left: Records of changes in atmospheric concentrations of CO2, CH4, and N2O over the past 1000 years. Ice core and firn data for several sites in Antarctica and Greenland are supplemented with data from direct atmospheric samples over the past few decades. The estimated radiative forcing from these gases is indicated in the right-hand scale. right: Sulphate concentration in several Greenland ice cores (lines); and total SO2 emissions from sources in the U1nited States and Europe (crosses). SOURCE: Adapted from IPCC, 2001.
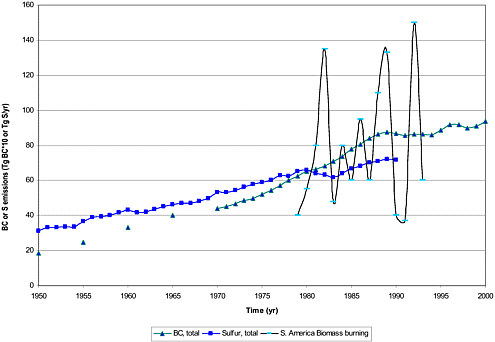
Figure 5. Time history of black carbon (BC), sulfur, and biomass-burning aerosol emissions. Sulfur emission data are from LeFohn et al., (1999). BC emission data are from Cooke et al., (1999). The biomass-burning data (from Torres et al., 2002) are shown in units of annual peak optical depth (x100) inferred from the TOMS (Total Ozone Mapping Spectrometer) satellite instrument over Brazil. SOURCE: Figure compiled by J. Penner.
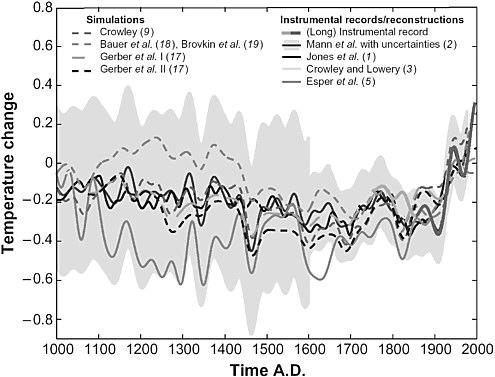
Figure 6. Northern hemisphere (NH) temperature histories. Comparison of multiproxy reconstructions of the NH annual mean temperature (1-3) with model simulations (9, 17-19). Gerber I, 1.5°C for CO2 doubling; Gerber II, 2.5°C for CO2 doubling. Also shown is a reconstruction of summer extratropical continental NH temperatures (5). All reconstructions have been scaled to the NH instrumental record (20) over the 1856 to 1980 period and have been smoothed on time scales of >40 years to highlight the long-term variations. Source: Mann, 2002.


