
5
Maximizing Workforce Capability
Monitoring patient health status, performing therapeutic treatments, and integrating patient care to avoid gaps in health care are nursing functions that directly affect patient safety. Accomplishing these activities requires an adequate number of nursing staff with the clinical knowledge and skills needed to carry out these interventions, and with the ability to effectively communicate findings and coordinate care with the interventions of other members of the patient’s health care team. The committee finds strong evidence that nurse staffing levels, the knowledge and skill levels of nursing staff, and the extent to which workers collaborate in sharing their knowledge and skills affect patient outcomes and safety. The committee also finds that staffing levels in hospitals and long-term care facilities are uneven, posing risks to patient safety. Further, the knowledge base for effective clinical care and new health care technologies are advancing rapidly, making it impossible for nurses (and other clinicians) without organizational support to incorporate this information and these technologies into their clinical decision making and practice. Finally, there is evidence of inconsistent interprofessional collaboration among nursing staff and other health care providers.
Health care organizations (HCOs) need to address all three of these barriers to workforce capability and patient safety by taking action to promote safe staffing levels, support nurses’ ongoing knowledge and skill acquisition and clinical decision making at the point of care, and foster interdisciplinary collaboration. The federal government can assist by revising outdated regulations regarding staffing in long-term care facilities and implementing a system for collecting and managing accurate and reliable data on hospital and nursing home staffing.
PROMOTING SAFE STAFFING LEVELS
I knew it was going to be a busy shift. After all, it was Wednesday—that meant elective surgery admissions from PACU [postanesthesia care unit], direct admissions from the clinic, and anything else the emergency room sent us. Each of us already had five patients apiece, some of them needing a lot of nursing care. There was no secretary available to put charts together and the nurse manager had already said that there was “no nurse in the system” to send to help us.
When the ER called to report on my second admission for the shift, I asked if they could please hold the patient until I finished a blood transfusion on one patient and completed the admission on the patient I had gotten from the recovery room. The nurse from the ER told me the patient would be up in five minutes and before I could say another word, she hung up the phone. I called my supervisor and explained that we were overwhelmed with all of the activity on the unit and asked if she could send another nurse to help us get settled or assign the admission to another unit. She told me that she would “look around” but that she had no one she could send right away. I asked her if she could delay the admission for a while until I could stabilize my other patients. She responded that the ER was “backed up” and that I had to take the patient right now or she would have to “write me up.”
When the patient came, I had to leave a new mastectomy patient who was crying each time she looked at her surgical dressing and whose PCA [patient-controlled analgesia] pump was alarming. I left her with a promise to get back as soon as I could and went to check the ER admission. The shift ended and I never got back to her except to check her IV fluid totals for the shift.
It was only after I got home that I remembered that I had not put the allergy band for seafood and penicillin on the ER admission. I called back to the unit just as the patient was being sent down to the operating room and asked them to put the allergy band on the patient and note on the front of the chart.
I could not rest. Every time I closed my eyes I thought about the fact that she could have been prepped using an iodine scrub and/or that they might have given her penicillin as a peri-operative antibiotic. A reaction from either of them could have been fatal.
An Adequate Number of Nurses: Essential to Patient Safety
The number of nursing staff available to provide in-patient nursing care is linked to patient safety by a substantial and growing number of research studies. Although there have been no experimental controlled studies of interventions that increased or decreased nurse staffing levels and measured the subsequent effect on patients, substantial evidence on the relationship between nurse staffing levels and patient outcomes has been produced by observational studies. This research has been conducted separately for acute care hospital and nursing home care.
Acute Care Hospitals
Because of the substantial changes that have occurred in the environment of acute care hospitals (see Chapter 1), studies based on older data are not the most useful for understanding staffing effects. Rather, the strongest evidence comes from studies published in the last 15 years (Aiken et al., 1999, 2002; Amaravadi et al., 2000; Blegen and Vaughn, 1998; Blegen et al., 1998; Bolton et al., 2001; Bond et al., 1999; Dimick et al., 2001; Flood and Diers, 1988; Hartz et al., 1989; Hunt and Hagen, 1998; Kovner and Gergen, 1998; Kovner et al., 2002; Lichtig et al., 1999; Needleman et al., 2002; Pronovost et al., 2001; Shortell et al., 1994). All of these are cross-sectional studies that explored correlations between measures of nurse staffing levels and rates of adverse occurrences. They examined in-hospital deaths and nonfatal adverse outcomes, including various types of nosocomial infections, decubitus ulcers, and falls. A variety of acute care hospital settings were examined, including intensive care units (ICUs), general medical–surgical units, and various specialty units. In some studies, process errors were measured, including medication errors.
The amount of nursing service (staffing level) in a given unit or hospital typically is expressed administratively as nursing hours per patient per day (hppd). It is also expressed as a nurse-to-patient ratio, or the average number of patients for each nurse; for example, 1:4 or 1:6 represents one nurse for every four or six patients, respectively. Higher levels of hppd indicate higher nurse-to-patient ratios.1
An important methodological issue in studies of hospital staffing is the unit of analysis. Sometimes staffing-level data are obtained for individual nursing units within hospitals; at other times, staffing data are aggregated across the entire hospital. Measures of outcomes similarly are aggregated across individual patients to the unit or hospital level to produce an incidence rate of adverse events. A problem with hospital-level aggregation is that heterogeneous nursing units, such as pediatric units, labor and delivery units, adult medical and surgical units, and ICUs, are combined. As a result, data on hospital-wide staffing levels may not well represent the staffing levels experienced by patients in a given nursing unit or of interest to poten-
tial patients. These data can also sometimes cloud the findings of research (Seago, 2001). This issue is less significant in nursing homes, where heterogeneous nursing units are much less likely to exist, the resident population is more homogeneous, and variation in patients can be addressed for research studies as needed through case-mix adjustment.
A number of studies of the effect of nurse staffing levels on patient outcomes have attempted to use patient mortality as an outcome measure. However, patient mortality is a problematic nurse-staffing outcome for several reasons. First, patient death is not common; its low frequency makes detecting statistically significant differences difficult (Hartz et al., 1989). Second, while some patients die as a result of injuries related to health care, others die as a result of overwhelming disease. While some studies evaluating the quality of hospital care have used methods to assess the reasons for in-hospital deaths (Brennan et al., 1991; Thomas et al., 2000), studies of nurse staffing that have used patient mortality as an outcome measure have lacked methods for attributing the cause of death to preventable or non-preventable causes. Thus, it is not surprising that these studies do not agree on whether lower nurse-to-patient ratios (i.e., fewer nurses per patient) are associated with higher patient mortality (measured as either in-hospital mortality or death within 30 days of admission). The strongest evidence supporting such a mortality relationship was derived from a study of patients with AIDS (Aiken et al., 1999). This study was conducted in 20 hospitals, aggregated data at the nursing unit level, and had good case-mix controls. Other diagnosis-specific studies have not been able to demonstrate a relationship between nurse staffing levels and patient mortality.
Studies in which patients were not selected by diagnosis also have yielded inconsistent findings about the effect of staffing levels on mortality. Two nationwide studies that aggregated data at the hospital level (Aiken et al., 2002; Bond et al., 1999) found that lower nurse-to-patient ratios were associated with higher patient mortality. This association was not found, however, in other studies examining multiple ICUs (Amaravadi et al., 2000; Shortell et al., 1994) and hospital-level staffing ratios (Hunt and Hagen, 1998; Needleman et al., 2002).
Nonfatal adverse events, such as nosocomial infections and decubitus ulcers, are thought to have a more plausible direct relationship to the availability of hospital nursing staff. A consistent finding across multiple recent studies is that lower nurse-to-patient staffing ratios are associated with higher rates of nonfatal adverse events, including nosocomial infections, pressure ulcers, and cardiac and respiratory failure (Aiken et al., 2002; Cho et al., 2003; Kovner et al., 2002; Needleman et al., 2002). Similarly, a review of evidence pertaining to acute care hospital staffing published in the health professions literature from 1990 to 2001 revealed that of 16 hospital-based studies of the relationship between levels of nursing staff and pa-
tient outcomes,2 11 found a positive effect on patient outcomes from higher levels of nurse staffing. The 5 studies that did not detect such an association tended to be older, and/or used smaller samples or less sophisticated methods for controlling for confounding variables. This evidence review concludes that “there is strong evidence that leaner nurse staffing is associated with increased length of stay, nosocomial infection (urinary tract infection, postoperative infection, and pneumonia), and pressure ulcers.” It concludes further that “these studies had various types and acuities of patients and, taken together, provide substantial evidence that richer nurse staffing is associated with better patient outcomes” (Seago, 2001:430).
Nursing Homes
The relationship between nurse staffing levels and patient outcomes in nursing homes has also been shown in numerous studies (Gustafson et al., 1990; Kayser-Jones et al., 1989; Nyman, 1988). Higher levels of registered nurse (RN) hours per patient have been significantly associated with patient survival, improved functional status, and discharge from the nursing home (Linn et al., 1977). Higher staff levels and lower turnover among RNs also have been found to be related to functional improvement in residents (Spector and Takada, 1991). Increased RN hours have been associated with improved mortality and the probability of discharge (Braun, 1991); with fewer pressure ulcers, catheterized residents, and urinary tract infections; and with lower rates of antibiotic use (Cherry, 1991). Higher staffing also has been related to fewer pressure sores (but more use of physical restraints) (Aaronson et al., 1994).
In addition, higher RN levels, adjusted for case mix, have been shown to be associated with lower mortality rates. An economic analysis using 1987 data from the National Medical Expenditure Survey found that an increase of 0.5 full-time equivalent (FTE) RNs per 100 residents (an approximately 10 percent increase in average RN staffing at that time) would have reduced the probability of dying by about 1 percent. Although this percentage may appear small, the researchers point out that it translates to an estimated 3,000 fewer deaths annually for nursing home residents. Moreover, a higher level of licensed practical nurse/licensed vocational nurse (LPN/LVN) staffing was found to be related to improved functional status as measured by activities of daily living (ADL) dependency (Cohen and Spector, 1996). Inadequate nurse staffing has been shown to be associated
with malnutrition, starvation, and dehydration in nursing home residents (Kayser-Jones, 1996, 1997; Kayser-Jones and Schell, 1997; Kayser-Jones et al., 1999). Licensed nursing hours (but not unlicensed hours) have been found to be significantly related to improved functional ability, increased probability of discharge to home, and reduced mortality in the first year after admission (Bliesmer et al., 1998). And higher total nurse staffing hours, particularly higher RN hours, were shown to be associated with fewer facility deficiencies in a study of all U.S. nursing homes (Harrington et al., 2000b). Other studies have found that gerontological nurse specialists and geriatric nurse practitioners also contribute to improved quality outcomes in nursing homes (Buchanan et al., 1990; Kane et al., 1988; Mezey and Lynaugh, 1989).
These and other studies are reviewed in two Institute of Medicine (IOM) reports (IOM, 1996, 2001b) that confirm the important relationship between staffing and quality. The 1996 IOM report Nursing Staff in Hospitals and Nursing Homes: Is It Adequate, found that “the preponderance of evidence from a number of studies using different types of quality measures has shown a positive relationship between nursing staff levels and quality of nursing home care.” Based on this evidence, “a relationship between RN-to-resident staffing and quality of care in nursing facilities has been established” (IOM, 1996:153).
Subsequent, additional strong evidence of the effect of nurse staffing on nursing home resident outcomes is provided by a congressionally mandated study on the Appropriateness of Minimum Nurse Staffing Ratios in Nursing Homes carried out under the auspices of the U.S. Department of Health and Humans Services’ (DHHS) Centers for Medicare and Medicaid Services (CMS) between 1998 and 2002. This study was conducted in two phases, with a Phase I report being provided in July 2000 (CMS, 2000) and a Phase II report in December 2001 (CMS, 2001). The Phase I study involved the development of methodologies and a preliminary assessment of relationships between patient (resident) outcomes and staffing levels using 1996 and 1997 data from three states and over 3,000 facilities. The Phase I report provides a discussion of relevant policy issues, including trends in payment and staffing levels in nursing homes; a discussion of how current federal regulatory staffing requirements are implemented; stakeholder perspectives; a literature review; and an analysis of different staffing data sources. The report also includes two other approaches to determining staffing needs: a time-motion study and use of operations research models.
The Phase II report provides further analysis of staffing–outcome associations using 1999 data from almost 9,000 facilities in 10 states. This report includes a refinement of the previous operations research estimates, studies of nursing staff turnover and retention, case studies of the relationship between care outcomes and nurse staffing issues beyond staffing levels,
an assessment of training and education for certified nurse assistants (CNAs), discussion of the adequacy of the nursing workforce to meet higher minimum nurse staffing standards, the development of improved nurse staffing data collection approaches, and an examination of payment options for improving nurse staffing. In combination, these reports provide a comprehensive assessment of staffing-related issues in long-term care and the policy context for addressing these issues. However, the core of this research was empirical work that demonstrated consistent associations between staffing levels and quality of care.
The Phase II empirical study included two separate samples of nursing home residents and facilities (CMS, 2001). The first was a Medicare admission sample designed to evaluate the relationship between staffing and outcomes of postacute nursing home care—care for those residents with acute conditions who are admitted to skilled nursing facilities (SNFs) generally for a relatively short stay. This short-stay sample included all SNF nursing homes from the 10 study states and used claims data linked to data from the federal government’s nursing home minimum data set (MDS), which contains information on each resident’s diagnoses, physical functioning, and other health conditions, as well as demographic and additional health status information.3 Outcome measures for this sample related to patient safety were rehospitalizations within 30 days of admission for potentially avoidable causes, including congestive heart failure, electrolyte imbalance, respiratory infection, urinary tract infection (UTI), and sepsis. These resident-level measures were aggregated to the facility level to obtain a nursing home rate4 for each outcome measure.
The second sample, of long-stay residents, was used to examine the relationship between staffing and care outcomes for nursing home residents. This sample included all residents with two MDS assessments 90 days apart. Outcome measures relevant to patient safety included incidents of pressure ulcers, skin trauma, and weight loss, which were then aggregated to the nursing home level. These outcome measures were selected because they were likely to be affected by nurse staffing, had sufficient incidence for stable estimates, had a measurable set of risk adjustors that could be used to control for differences in risk, and were based on accurate secondary data elements.
A much larger set of measures was evaluated initially. Data sources for hospital-transfer outcome measures were hospital claims, whereas long-stay outcome measures utilized MDS data. Risk factors were obtained from both
|
3 |
Further information on the MDS is available at the CMS website: http://cms.hhs.gov/medicaid/mds20/man-form.asp [accessed September 26, 2003]. |
|
4 |
Facilities with fewer than 25 admissions were excluded. |
data sets. Staffing data were obtained from Medicaid cost reports for the 10 states, which were found to have a higher correlation with payroll data than the Medicaid On-line Survey and Certification Report (OSCAR) data that are provided to state survey agencies and the federal government by facilities.
Analysis involved the generation of resident-level risk models for each outcome, which were then used to estimate resident-level risk scores, calculate a facility average risk score, and assess the association between staffing levels and rate of adverse events, adjusting for the facility average risk score. Facilities in the worst 10th percentile were considered to have an inappropriately high level of untoward events, which generally reflected a rate that was three or more times the mean rate for the outcome (e.g. overall UTI hospitalization mean = 0.03; 10th percentile mean = 0.09). Consistently, associations were found between different staffing levels and whether facilities were in the worst 10th percentile. These significant associations persisted until a staffing threshold was reached, above which there was no further detectable benefit from additional staffing. These findings occurred for all three types of nursing staff separately (nursing assistant [NA], licensed [LPN/LVN and RN combined], and RN). The thresholds occurred at staffing levels that exceeded the current levels of 75–90 percent of facilities, depending on the type of staff and the measure. Thus, most facilities fell considerably below the staffing thresholds. These thresholds were between 2.4 and 2.8 hours per resident day for NAs, between 1.1 and 1.3 hours per resident day for licensed staff, and between 0.55 and 0.75 hours per resident day for RNs. However, incremental improvements in quality occurred at all levels until these staffing thresholds were reached.
This study also found (based on an analysis of 631 facilities in California for which information on staff turnover and retention was available) a strong relationship between staff retention and outcomes related to patient safety. For example, improved annual retention of nursing staff up to a threshold of about 51 percent (i.e., half the staff stay for a full year) was associated with a substantially higher likelihood (odds ratio 3.66) that a nursing home would not be in the worst 10 percent of facilities. However, retention of less than 51 percent was associated with a high risk of adverse events, such as hospitalizations for UTIs and pressure ulcers.
Explanations for the Causal Relationship Between Staffing Levels and Patient Outcomes
Several studies have attempted to explain the relationship between higher levels of nurse staffing and improved patient outcomes. The results of these studies support the position that as the numbers of nursing staff increase, the staff are proportionately able to provide increasing amounts of
necessary care. Once necessary care is provided, one would expect to see no additional improvement in health outcomes from greater numbers of staff. This point is supported by the above-referenced CMS study of nursing home staffing, which identified a threshold level of nurse staffing above which no further improvements in patient outcomes were detected (CMS, 2001).
An HCO’s staffing level is traditionally considered a structural measure of quality that can affect the processes and outcomes of care (Donabedian, 1980; IOM, 1996). In nursing homes, the processes of care include a range of nursing activities, such as assistance with ADLs and monitoring of health status; therapeutic services, such as dressing changes and administration of medications; and other nursing activities, such as the management of incontinence. The outcomes of care can be measured as weight loss, pressure ulcers, incontinence, or other markers of physical decline (Zimmerman et al., l995).
In long-term care, higher staff levels and lower RN turnover have been shown to be related to better care processes, such as lower urinary catheter use, better skin care, and better resident participation rates (Spector and Takada, 1991). Inadequate nurse staffing is correlated with inadequate feeding assistance and poor oral health (Kayser-Jones, 1996, 1997; Kayser-Jones and Schell, 1997; Kayser-Jones et al., 1999). NAs with inadequate time to provide care have been documented to cut corners in order to manage their workloads (Bowers and Becker, 1992).
Schnelle et al. (2002) conducted a blinded study to determine whether there were differences in the quality of care processes among 34 randomly selected California long-term care facilities with different staffing levels. Three groups of homes were identified in the sample. Group 1 (nine homes at the 0 to 25th percentile of staffing levels) reported 2.7 mean total (RNs, LVNs, and NAs) direct-care hours per resident/day (hprd). Group 2 (six homes in the 75th to 90th percentile) reported 3.4 hprd; and Group 3 (six homes in the 91st to 100th percentile) reported 4.9 hprd. During a 3-day on-site visit, research staff used standardized protocols for direct observation, resident assessment, resident interview, and medical record review to assess 16 care processes delivered by NAs and 11 care processes delivered by licensed nurses. NAs in Group 3 homes reported significantly lower resident care loads across the day and evening shifts in 2001–2002 (7.6 residents per NA) compared with NAs in all of the remaining homes. Group 3 homes also performed significantly better on 12 of 16 care processes implemented by NAs compared with all other remaining homes combined. Residents in the Group 3, or highest-staffed, homes were significantly more likely to be out of bed and engaged in activities during the day and to receive more feeding assistance and incontinence care. The researchers concluded that there is a relationship between nursing home reports of total staffing, NA reports of resident care load, and the quality of implementa-
tion of care processes. Comparing these findings with those of studies of eight separate quality indicators (weight loss, bedfast, physical restraints, pressure ulcers, incontinence, loss of physical activity, pain, and depression), the researchers concluded that staffing levels are a better predictor of high-quality care processes than the eight quality indicators (Schnelle et al., 2002).
For acute hospital care, the relationship between licensed nurse staffing levels and patient outcomes also has been attributed in part to the surveillance function of nursing described in Chapters 1 and 3. As the staffing level rises, so does the availability of nurses to spend more time in surveillance (monitoring) of patients for changes in their condition, which in turn enables quicker detection of changes in health status and more prompt rescue activities by the health care team. When this does not happen, “failure to rescue” is said to occur. The concept of failure to rescue has been tested and validated as an indicator of the quality of acute hospital care for surgical patients (Silber et al., 1992). When higher levels of nurse staffing are present in hospitals, failure to rescue is reduced (Aiken et al., 2002; Needleman et al., 2002).
Other attempts to understand how overall staffing affects patient safety in acute care hospitals have examined ratios of RNs to nonlicensed nursing personnel. Two studies found that higher ratios of RNs to unlicensed nurses are associated with lower rates of both medication errors and decubiti (Blegen et al., 1998) and with lower mortality rates (Hartz et al., 1989). However, one study that did not include case-mix adjustment found no association between the ratio of RNs to unlicensed nurses and nonfatal complications (Bolton et al., 2001).
Variation in Hospital and Nursing Home Staffing Levels
Acute Care Hospital Staffing
There is no national database on hospital nurse staffing levels that (1) reports staffing levels by type of patient care unit; (2) distinguishes direct-care nursing staff from nursing staff in administrative, managerial, educational, or other non–direct patient care positions; or (3) distinguishes inpatient nurses from those delivering outpatient care in hospitals. However, a few studies and state hospital data sets show that staffing levels vary considerably from hospital to hospital and across inpatient units within hospitals.
Variation in hospital staffing is illustrated by 1998–2000 data from the California Nursing Outcomes Coalition (CalNOC), which maintains a statewide database of nurse staffing levels submitted directly by California hospitals (see also Chapter 3). Although these data constitute a convenience
sample of 52 California hospitals voluntarily contributing staffing data to the initiative, the data are useful because they are collected at the level of the nursing unit (as opposed to the aggregate hospital level), use common data definitions and reporting, and have ongoing verification to ensure accuracy. Data reported on the 330 critical care, medical–surgical, and step-down units across nine calendar quarters in these hospitals revealed averages and ranges of RN-to-patient staffing ratios across these facilities:
-
ICUs—a range of one RN for every 0.5–5.3 patients (average = one RN for every 1.6 patients)
-
Step-down units—a range of one RN for every 1.5–11.6 patients (average = one RN for every 4.2 patients)
-
Medical–surgical units—a range of one RN for every 2.7–13.8 patients (average = one RN for every 5.9 patients)
These findings did not vary over the nine quarters or by the size of the hospital (Donaldson et al., 2001).
As discussed in Chapter 3, data from a fiscal year 2002 national convenience sample survey of hospitals on staffing, scheduling, and workforce management of nursing department employees show similar variation. The 135 hospitals responding varied in nurse staffing levels even with the shift and type of patient care unit being held constant. Although the average RN-to-patient ratio in medical–surgical units on the day shift was 1:6, the range was from 1:3 to 1:12. Twenty-three percent of hospitals reported that nurses in their medical–surgical units on the day shift were each responsible for caring for between 7 and 12 patients. On the night shift, 7 patients on average were assigned to each nurse, but 34 percent of hospitals reported between 8 and 12 patients assigned to each nurse. For critical care units, the average number of patients assigned to each nurse was 2 for both the day and the night shifts, but 7.4 percent of hospitals reported having nurses care for 3 or 4 ICU patients during the day shift, and 11 percent reported nurses caring for 3 or 4 ICU patients during the night shift (Cavouras and Suby, 2003).
A 1999 survey (Aiken et al., 2002) of a 50 percent random sample of Pennsylvania hospital RNs working in all hospital units who held staff positions involving direct patient care similarly reported variable nurse-to-patient ratios (see Table 5-1).
Unfortunately, studies that distinguish type of nursing unit or separate direct-care nurses from nurses in administrative positions are rare. Most studies measuring nurse staffing levels collect staffing data aggregated across all hospital units, such as ICUs, general medical–surgical units, emergency rooms, and labor and delivery units (Aiken et al., 1999, 2002; Bolton et al., 2001; Bond et al., 1999; Cho et al., 2003; Flood and Diers, 1988; Kovner
TABLE 5-1 Variations in Nurse-to-Patient Ratios in Pennsylvania Hospitals, 1999
|
Patients per Nurse |
Percent of Respondents Reporting |
|
≤ 4 |
7.1 |
|
5 |
47.3 |
|
6 |
20.8 |
|
7 |
10.9 |
|
≥ 8 |
4.0 |
|
SOURCE: Aiken et al. (2002). |
|
and Gergen, 1998; Kovner et al., 2002; Lichtig et al., 1999; Needleman et al., 2002; Sochalski, 2001). Some studies specific to ICU staffing have been conducted; information on staffing levels in other hospital units, including medical–surgical units, is sparse.
Overall hospital staffing As stated above, a problem with hospital-level aggregation is that when heterogeneous nursing units, such as pediatric units, labor and delivery units, adult medical–surgical units, and ICUs, are combined, hospital-wide staffing levels may not well represent the levels experienced by patients in a given nursing unit, and the findings of research can be clouded. Table 3-3 in Chapter 3 (replicated here as Table 5-2) indi-
TABLE 5-2 Types of Work Units in Which Hospital-Employed RNs Spend More Than Half of Their Direct Patient Care Time
|
Type of Work Unit |
Percent of RNs Employed |
|
General/specialty bed unit |
30.9 |
|
Intensive care unit |
16.9 |
|
Operating room |
9.0 |
|
Labor/delivery |
8.2 |
|
Emergency department |
7.9 |
|
Step-down/transition from ICU |
5.9 |
|
Outpatient department |
5.8 |
|
Postanesthesia recovery room |
3.1 |
|
Other area |
2.5 |
|
No specific area |
1.8 |
|
Not known |
8.0 |
|
TOTAL |
100 |
|
SOURCE: Spratley et al. (2000). |
|
cates that general medical–surgical nurses would likely contribute much of the data on hospital-wide nurse staffing; together, however, ICU, operating room (OR), and labor and delivery nurses could also reasonably be expected to exert significant influence on reported aggregate, hospital-wide nurse staffing levels.
This is an important point because the only source of staffing data on all types of inpatient hospital units (i.e., the California Office of Statewide Health Planning and Development [OSHPD])5 shows that ICU, labor and delivery (apart from other obstetrics), and step-down/transition units have considerably higher average nurse staffing levels than medical–surgical and other hospital nursing units (Spetz et al., 2000). These data are presented later in this chapter.
When staffing levels are based on hppd estimates6 from staffing studies that combine nurses in direct patient care positions with those in administrative or other non–direct care positions and are aggregated across multiple hospital units, nurse staffing levels such as those in Table 5-3 are produced.
The high nurse staffing levels suggested by these estimates are in contrast to the unit-specific data and direct patient care nurse-specific data produced by the Donaldson, Cavouras, and Aiken studies cited above. The higher nurse staffing levels in Table 5-3 also reflect the limitations of the available data sources on nurse staffing. The American Hospital Association (AHA) data used in several of the studies included in Table 5-3 aggregate all nursing staff (direct-care nurses and nurses in administrative positions) across all inpatient and outpatient care units, thereby producing higher levels of nurse staffing. State data sets often can distinguish nursing staff by cost center (and thereby by nursing unit), but may suffer from incomplete data. For example, in the Lichtig et al. (1999) study cited above, seven California hospitals did not submit cost reports, 26 submitted reports but did not include data on nursing hours, and 8 reported unrealistic nursing hours. Better understanding of actual nurse staffing levels is provided by studies that have examined staffing levels within specific types of patient care units.
TABLE 5-3 Nurse Staffing Estimates Derived from Staffing Studiesa
|
Estimated RN:Patient Ratio |
Source of Estimates |
Source |
|
1.0:4.0–4.5 |
Estimates derived from authors’ report of average hppd for all nursing staff and % RN nursing staff. Data from 1994 New York and California state databases. Authors note poor quality of these data. |
Lichtig et al. (1999) |
|
1.0:3.9 |
Authors estimated 6.2 RN hppd (adjusted)b from national 1996 American Hospital Association (AHA) data. |
Kovner et al. (2000) |
|
1.0:3.7 |
Authors estimated 6.56 RN hppd (adjusted) from 1996 AHA data for hospitals in 13 states. |
Kovner et al. (2002) |
|
1.0:3.1 |
Authors estimated average RN (administrative and direct-care) hppd of 7.8 from 11 states that collected 1997 nurse staffing data from state hospital data sets across all hospital inpatient units. |
Needleman et al. (2002) |
|
1.0:3.8 |
Authors estimated 6.3 RN hppd across medical–surgical, ICU, and coronary care units in 232 California hospitals. |
Cho et al. (2003) |
|
aEstimates calculated by dividing 24 hours by the number of hppd. bAHA data were adjusted to account for differences between hospital inpatient and outpatient services. |
||
Intensive care units A 1988–1990 study of 42 hospital ICUs, including a combination of volunteer hospitals and a geographically stratified random sample of nonfederal U.S. hospitals with at least 200 beds (the vast majority of all hospitals with ICUs), obtained nurse staffing data on each shift from a questionnaire completed by the director of the nursing unit. In that study, the mean number of patients cared for by an ICU nurse was 1.5 (range of 0.7 to 3.3). Hospitals falling one standard deviation below the mean had staffing ratios of one nurse for every 2.1 patients (Shortell et al., 1994). This average of 1.5 patients per nurse is identical to average ICU staffing levels calculated from hours of ICU nursing care (18 hppd) and the proportion of that care delivered by RNs (90 percent) reported in a 2.5-year study (1993–1995) of nurse staffing and adverse events in eight ICUs in 11 hospitals7 (Blegen and Vaughn, 1998), and is similar to that observed more recently in California. OSHPD data for 1998–1999 show average nurse-to-patient ICU staffing levels of 1.0:1.5 (medical–surgical), 1.0:1.8 (coronary), 1.0:1.2 (pediatric), and 1.0:2.1 (neonatal) (Spetz et al., 2000).
A series of studies of ICU outcomes conducted between 1994 and 1996 in all nonfederal, short-stay hospitals in Maryland found that 82 percent of these hospitals had day-shift ICU nurse staffing levels of one nurse for every one to two patients. Lower staffing levels—i.e., nurses caring for three or more ICU patients—were reported for 18 percent of hospitals. After adjusting for patient characteristics and for hospital and surgeon volume, patients who had abdominal aortic surgery in hospitals with fewer ICU nurses (i.e., each nurse caring for three or more patients) on the day shift were more likely to have postoperative complications, particularly pulmonary insufficiency and reintubation (Pronovost et al., 2001).
A second analysis of these data examined ICU direct-care nurse staffing on day and night shifts. Nurse staffing was coded as either low intensity (1:3 or greater nurse-to-patient ratio on the day and night shifts); medium intensity (1:3 or greater on either the day or night shifts, but not both), or high intensity (1:2 or lower on both day and night shifts). The majority of hospitals (63 percent) were staffed at a high-intensity level; 21 percent were staffed at a mixed-intensity level; and 16 percent had low-intensity staffing. After controlling for patient and organizational variables, the analysis showed that patients cared for on units with medium-intensity staffing were more likely to have cardiac and other complications than were patients cared for on high-intensity units. Patients cared for on units with low-intensity nurse staffing were more than twice as likely to have respiratory complications as patients on units with high-intensity staffing. Patients were more than five times as likely to develop pulmonary insufficiency and were more than twice as likely to be mechanically ventilated after 96 hours and reintubated when cared for on units with low-intensity staffing as compared with units with high-intensity staffing (Dang et al., 2002).
These sources and others (Amaravadi et al., 2000; Fridkin et al., 1996) indicate that nurse staffing levels of 1:2 or better not only are commonly used by large numbers of ICUs, but also have a protective effect on patients.
Medical–surgical units Information on medical–surgical staffing levels is available from two states and one multihospital, multistate data set. In California, CalNOC data show an average of 5.9 patients assigned to individual medical–surgical nurses across all shifts (Donaldson et al., 2001). California OSHPD data show similar average nurse-to-patient ratios of 1.0:5.2, with a median of 1.0:5.8 (Spetz et al., 2000). An examination of nurse staffing ratios within individual shifts from a convenience sample of representative medical–surgical units from 28 percent of California hospitals showed variation in staffing across shifts and by rural/urban status. This study estimated staffing levels using two methods: (1) computing a nurse staffing ratio based on the hospital-reported number of hours in a shift and the RN hours per patient for the shift, and (2) using staffing ratios
reported directly by the hospital. In general, the hospital-reported ratios were leaner (fewer nurses for the patients) than those computed. These two methods yielded the average nurse-to-patient ratios and ranges of staffing levels by shift and rural/urban hospital status shown in Tables 5-4 and 5-5, respectively. The range of nurse staffing levels is shown by the reported number of patients per RN displayed in quartiles in Table 5-5.
A survey of Pennsylvania RNs working in hospitals in 1999 identified medical–surgical nurses and asked them to provide (for the most recent shift they had worked) information on the type of shift they had worked (i.e., day, evening, or night), the number of patients in their unit during that shift, the number of patients assigned to them, and the number of RNs who had worked in their unit during that shift. The average number of patients assigned to these medical–surgical nurses ranged from six to eight, with
TABLE 5-4 Average Number of Patients per RN, by Shift and Rural/ Nonrural Location, in California
TABLE 5-5 Quartiles of Staffing Data in Medical–Surgical Units, in California
|
|
Reported Number of Patients per RN, by Shift |
|||
|
Shift |
25% |
50% |
75% |
100% |
|
Day shift |
5 |
6 |
7 |
12 |
|
Evening shift |
5.1 |
7 |
8 |
12 |
|
Night shift |
6 |
8 |
9 |
26 |
|
SOURCE: Spetz et al. (2000). |
||||
progressively higher ratios found on the evening and night shifts compared with the day shift. The number of patients reported by individual nurses as being assigned to them was identical to the average number of patients assigned to nurses as calculated by dividing the total number of patients on the unit by the total number of RNs on the unit (Sochalski, 2001). The higher patient loads reported by the Pennsylvania nurses may be due in part to higher nurse staffing levels in California. AHA data show that California has higher average and median RN hours per adjusted patient day than the nation as a whole. California is ranked 19th among states in median RN and LPN/LVN hppd (Spetz et al., 2000).
Other hospital units Publicly reported data on nurse staffing in other hospital units are scarce. Information on staffing levels in transition (step-down) units is available from the CalNOC data presented above. Additional information on step-down unit and other inpatient unit staffing comes from California OSHPD data. OSHPD data for 1998–1999 indicate the nurse-to-patient ratios shown in Table 5-6, derived from hospital reports of RN hppd across all shifts and based on the assumption that an average patient day is 24 hours in length. OSHPD data also revealed that rural hospitals had higher staffing levels than urban hospitals (Spetz et al., 2000).
Nursing Home Staffing
Nurse staffing levels in nursing homes also are typically reported in terms of hprd. They are calculated by dividing the total nursing hours worked in the facility by the total resident days of care per year. Although staffing levels vary widely across facilities, since 1997 the average nursing
TABLE 5-6 California Hospital Nurse-to-Patient Ratios: Means, Medians, and Quartiles (1998–1999)
|
Type of Unit |
Mean |
Median |
25th Percentile |
75th Percentile |
|
Pediatric acute |
1:3.2 |
1:3.4 |
1:4.9 |
1:2.5 |
|
Obstetrics |
1:4.0 |
1:4.8 |
1:6.5 |
1:3.4 |
|
Newborn nursery |
1:5.7 |
1:6.9 |
1:10.1 |
1:4.3 |
|
Subacute care |
1:11 |
1:14.7 |
1:18.5 |
1:8.7 |
|
Definitive observationa |
1:3.1 |
1:4.6 |
1:5.6 |
1:3.7 |
|
Rehabilitation care |
1:6.3 |
1:6.7 |
1:8.9 |
1:5.0 |
|
Labor and deliveryb |
1:1.3 |
1:1.4 |
1:1.8 |
1:1.1 |
|
aA level of care between intensive and medical–surgical care. This would equate to step-down and transitional units in the CalNOC data. bStaffing level per delivery. |
||||
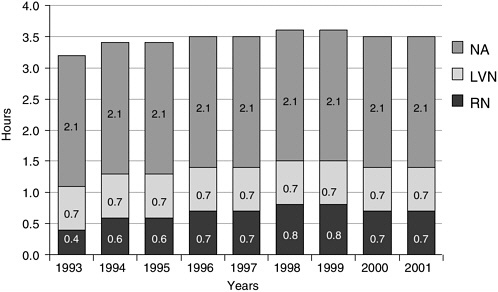
FIGURE 5-1 Total nurse staffing hours per resident in all U.S. nursing facilities, 1993–2001.
SOURCE: Harrington et al. (2002).
home in the United States has provided a combined total of 3.5 to 3.6 hprd of RN, LVN/LPN, NA, and director of nursing time (see Figure 5-1). Most of this time (58 percent or 2.1 hours) is provided by NAs, who on average care for 11 residents. Each RN and LPN/LVN (at 0.7–0.8 hprd) typically oversees care for 32 to 34 residents, although these ratios may vary across shifts and on weekends and holidays (Harrington et al., 2002).
Staffing levels vary widely by facility characteristics. SNFs that admit only Medicare residents have almost double the staffing levels of nonskilled (Medicaid-only) nursing facilities (Harrington et al., 2002). For-profit facilities generally have lower staffing levels than nonprofits, even though there can be high variability in this regard (Aaronson et al., 1994; Harrington et al., 2001). There are also wide variations in staffing levels across states (Harrington et al., 2002).
Federal nursing home regulations require that each facility receiving Medicare or Medicaid payments (the majority of nursing homes) have “sufficient nursing staff to provide nursing and related services to attain or maintain the highest practicable physical, mental, and psychosocial wellbeing of each resident, as determined by resident assessments and individual plans of care.”8 These regulations also require all Medicare- or Medicaid-certified nursing homes to have an RN who is the director of nursing; at
least one RN on duty for 8 hours a day, 7 days a week; and at least one licensed nurse (RN or LVP/LPN) on duty on the other shifts. The director of nursing may also serve as the RN on duty in facilities with 60 or fewer residents. These standards apply regardless of the number of patients in the nursing home; e.g., they apply equally to a facility with 60 patients and a facility with 300 patients. As of April 2001, 25 states had established higher minimum staffing requirements for licensed nurses than those of the federal government, and 15 states had higher RN staffing requirements (Harrington, 2001).
Responding to the Evidence on Staffing and Patient Safety
Given the above evidence, the committee sought to determine what course(s) of action with respect to nurse staffing would be most likely to ensure patient safety. Strategies proposed by consumer, professional, industry, and labor associations and by policy analysts generally include regulatory approaches, adoption of more-effective internal staffing practices by HCOs, and marketplace/consumer-driven approaches. The committee considered the individual merits of these approaches and found that each has both benefits and limitations. We took particular note of the unavailability, incompleteness, and unreliability of nurse staffing data in the United States and the weaknesses of tools for measuring nursing workload and predicting hospital staffing needs. The committee believes the appropriate and coordinated use of all three approaches would have a synergistic effect and be most conducive to achieving safe staffing levels.
Regulatory Approaches
A number of labor, nursing, and consumer advocacy organizations recommend that quantitative ratios of the numbers of nursing staff or nursing hours per patient be mandated, in some form, for nursing homes and/or hospitals to promote safer patient care (Massachusetts Nurses Association, 2003; National Citizens Coalition for Nursing Home Reform, 1998; SEIU, 2001). They point out that minimum personnel standards, expressed as ratios, are used in many other service industries, such as child day care, education, and fire services. In the airline industry, for example, standards require a certain number of personnel on each flight based on the aircraft and number of passengers, and also limit the number of hours personnel can fly without a break. Thus, where safety is a concern, regulatory standards have been deemed appropriate to reduce error. Beyond these minimum standards, organizations compete to provide higher levels of service by using more or better-trained personnel and by exceeding other minimum standards.
The committee believes that, based on currently available evidence, the use of minimum personnel standards is presently and generally more appropriate for nursing homes than for hospitals, for two reasons. First, we find that in general, the evidence for specific numerical staffing standards is stronger for nursing homes (although evidence of the effect of specific ICU staffing levels on patient safety is also strong). The CMS (2001) study on the appropriateness of minimum nurse staffing ratios in nursing homes greatly advanced the knowledge base on the effect of different nursing staff-to-patient ratios on patient outcomes. It identified staffing levels (2.4–2.8 hprd for NAs, 1.1–1.3 hprd for licensed nursing staff, and 0.55–0.75 hprd for RNs) above which no further improvements in patient outcomes were observed, and below which improvements in quality occurred with each incremental increase in staffing.
The purpose of minimum standards for staffing in nursing homes would be to ensure that at least the minimum resources are in place to preserve the safety of nursing home residents. Current requirements for 8 hours of RN and 24 hours of licensed nurse coverage per day are, in fact, minimum standards. Although these minimum standards ensure that long-term care facilities can administer medications 24 hours a day and have an RN available to supervise NAs and respond to issues during 8 hours per day, this minimum is not based on the premise of patient safety. Patient safety requires staff resources that are sufficient to prevent an inappropriately high rate of untoward events that could be avoided with adequate staffing levels. For such a standard to be reasonable, it must at least be based on the number of residents in the nursing home and address NAs, who provide most of the care to nursing home residents. Such minimum staffing standards are not a precise statement of how many staff are required to fully meet the needs of each specific group of residents on each unit, nor are they a quality improvement tool to optimize quality in each nursing home. Rather, a minimum staffing level is one that avoids placing individual residents unnecessarily at risk because of insufficient numbers of staff to provide even the most basic care.
In contrast, with the exception of studies of ICU staffing, the committee identified only one hospital staffing study that measured the effects of different staffing levels within a specific type of hospital patient care unit (i.e., medical–surgical unit [Sochalski, 2001]). In this study, the frequency of adverse events was subjectively reported by nursing staff using a Likert scale, rather than being counted using clinical data sets. The need for hospital unit–specific information is important because, as pointed out previously, the hospital patient population and the nursing units in which they receive care are more heterogeneous than is the case in nursing homes, making hospital-level data more difficult to interpret.
A number of researchers studying hospital staffing levels and patient outcomes have found that evidence does not yet exist to indicate the necessary (minimum) or ideal (optimal) staffing across the various types of hospital inpatient care units (Bolton et al., 2001; Kovner et al., 2002; Spetz et al., 2000). The Agency for Healthcare Research and Quality (AHRQ) evidence report Making Health Care Safer: A Critical Analysis of Patient Safety Practices also finds that, for acute hospital care, “… there is no definitive evidence as to specific thresholds for RN or total nursing staff hours per patient day, or nursing skill mix for various patient populations or nursing unit types” (Seago, 2001:429). The committee agrees that generalizing the results of studies of the effects of hospital-wide staffing on patient safety to specific types of hospital units is inappropriate. We believe nurse staffing regulations should be based on evidence that demonstrates the effect of specific staffing levels (including skill mix) on patient safety within specific patient care units.
Second, federal and state governments already regulate nursing home staffing levels, as described previously. Although a few states regulate hospital nurse staffing levels for specific types of patient care units (e.g., ICUs and labor and delivery units), none currently regulate all the different types of patient care units found in hospitals. California has proposed regulating hospital staffing for all patient care units; the nurse staffing ratios that California hospitals will be required to meet are scheduled to take effect in January 2004. These standards call for certain licensed nurse staffing levels in all hospital patient care units (the state already has hospital staffing requirements for some patient care units, such as ICUs, ORs, and nursery units). However, the regulations do not require the nurses to be RNs as opposed to LPNs/LVNs. California’s regulations allow “sufficient flexibility in the type of nurse to be used … determined by nursing scope of practice and patient acuity” (Office of the Governor, 2002).
Based on the above considerations, the committee makes the following recommendation:
Recommendation 5-1. The U.S. Department of Health and Human Services (DHHS) should update existing regulations established in 1990 that specify minimum standards for registered and licensed nurse staffing in nursing homes. Updated minimum standards should:
-
Require the presence of at least one RN within the facility at all times.
-
Specify staffing levels that increase as the number of patients increase, and that are based on the findings and recommendations of the DHHS report to Congress, Appropriateness of Mini-
-
mum Nurse Staffing Ratios in Nursing Homes—Phase II Final Report.
-
Address staffing levels for nurse assistants, who provide the majority of patient care.
With respect to requiring the presence of at least one RN in each nursing home at all times, two previous IOM studies made this same recommendation to achieve better patient outcomes (IOM, 1996, 2001b). This committee additionally calls attention to this minimal staffing requirement as essential to patient safety.
With respect to the recommendation that DHHS specify staffing standards in regulations that would increase with the number of patients and be based on the findings and recommendations of the Phase II DHHS report to Congress on the appropriateness of minimum staffing ratios in nursing homes (CMS, 2001), the committee notes that the thresholds identified in that study above which no further benefit from staffing ratios could be identified are above the staffing levels of 75–90 percent of facilities, depending on the type of staff. However, a minimum standard set by DHHS need not approach the threshold level above which there is no further benefit. In fact, such a standard would go beyond the expectation for a minimum, which is intended to identify situations in which facilities unequivocally place residents at an unacceptable level of risk. The challenge is that there is no absolute minimum level of risk for untoward events that is considered acceptable.
If every single resident in a nursing home experienced an avoidable untoward event, that would clearly be considered unacceptable. But there is no absolute rate of pressure ulcers, weight loss, or hospitalization for infection that is considered unacceptable. Even if one were assured that every event counted was due to a care error (i.e., avoidable), one would still tolerate some errors and would have to choose an acceptable rate. Thus, it is most defensible to set an unacceptable rate based on relative standards using the distribution of rates across facilities and identifying outliers. In the Phase II CMS study, the worst 10 percent of facilities is used as the relative standard, recognizing that an argument could be made for other standards. Facilities in the worst decile, however, were generally three or more times more likely than those at the mean to have untoward events. The study does not propose a specific minimum standard for RNs, licensed nurses, and NAs because agreement must first be reached about what is an unacceptable level of risk. However, data exist from this national study with which to determine the staffing levels for each type of staff that are associated with any level of risk for untoward events.
The committee believes it is feasible to establish a minimum staffing level for each type of staff based on the consensus of experts about unac-
ceptable levels of risks for untoward events. These standards could be phased in over time such that a greater level of risk would be tolerated in the first year, requiring somewhat lower minimum standards, with decreasing tolerance for errors and hence increasing minimum staffing levels in subsequent years. Any such strategy should be accompanied by an evaluation of the number of facilities affected, the staffing changes that occur in these facilities, and the changes in the rates of untoward events.
At the same time, a number of nursing organizations, policy experts, and HCOs point out the limitations of staffing ratios. While they may help ensure a baseline level of staffing in HCOs that may be outliers, they are poor instruments for achieving optimal staffing. Depending on the skill mix and expertise of nursing staff and patient acuity (defined below), minimum ratios may still not provide the needed levels of safety. Moreover, counts of patients needed to calculate nurse staffing levels consistent with a ratio must be taken at a point or points in time. Yet patient admissions, transfers, and discharges are frequent; therefore, an adequate nurse-to-patient ratio at 7 A.M. may be inadequate at 10 A.M., and an organization that has satisfied a nurse-to-staffing ratio at one point in time may still have inadequate staffing at another point. Thus, while staffing ratios can help protect against the most egregious staffing deficiencies, HCOs will need to employ more sensitive approaches internally to fine-tune staffing levels.
More-Effective Internal Staffing Practices by HCOs
Problems in the application of widely used tools to predict hospital staffing Many hospitals determine the amount of nursing staff they need to provide care on individual patient care units and shifts through the use of staffing tools collectively referred to as patient classification systems (PCSs). PCSs are quantitative formulas that measure patient acuity, translate this measure into projections of actions that need to be performed and the time it will take to perform them (nurse workload), and use those projections to estimate nurse staffing needs. Acuity in PCSs refers to the amount of nursing time required to care for an individual patient given that patient’s care needs (which may or may not correspond to the severity of the person’s medical illness) (Norrish and Rundall, 2001).
In PCSs, the nursing care requirements of individual patients are summed to estimate the total patient care needs for a particular nursing unit. Staffing projections are then based on predetermined time standards for each type of patient or patient-care task. These time standards are intended to be either derived empirically and uniquely for each institution based on work sampling measures, or adopted from standards inherent in a particular PCS.
During the 1980s, the emphasis on PCSs increased as a result of Joint
Commission on Accreditation of Healthcare Organizations (JCAHO) accreditation standards that required nursing departments to have a system for determining nursing care requirements based on patient needs (Norrish and Rundall, 2001). Today, PCSs are widely used by hospitals (but not nursing homes) despite their frequently noted shortcomings. These shortcomings pertain not as much to how patient acuity is measured as to how corresponding work is measured, the extent to which the PCS methodology accommodates variations in staff expertise and work environment, and how HCOs implement the PCS.
PCSs lack desired sensitivity to variations in patient acuity levels. PCS models identify discrete levels of patient acuity and translate them into estimates of the amount of care individuals at that level typically require. However, patient acuity varies within classification levels. When HCOs fail to appreciate this fact, they can become locked into average PCS predictions and fail to acknowledge the need for flexibility that is an intrinsic characteristic of PCSs (DeGroot, 1994).
Workload estimates for various patient classification levels may be inaccurate and unreliable. Measurements of workload are the product of three factors: (1) product and service (i.e., patient care) classifications (described above), (2) forecasts of volume demand for each classification, and (3) the standard times for each service (Bayiz, 2003). To translate patient acuity into workload estimates, the work performed by nurses when caring for such patients needs to be sampled (DeGroot, 1994). Work sampling involves identifying the activities that are performed and the average time required for each.
HCOs’ use of PCSs has been criticized in several areas pertaining to work sampling. First, work sampling and time estimates are often not derived from the institution using the PCS. Instead, HCOs often use work sampling estimates produced by external PCS vendors or other facilities. To the extent that these external work estimates were derived from work samplings for patient care units that differ from those of the institution using the PCS—in terms of the experience level or skill mix of nursing staff, the availability of support staff, the way patient care is organized and delivered across units, and/or the physical layout of the nursing units and hospital—or are rationally derived using educated “best estimates,” they will likely be inaccurate and unreliable estimates of how long it takes nursing staff within that particular institution to perform certain activities or care for a given level of patients. There is no “one size fits all” set of standard times that can be used across hospitals (Bayiz, 2003; DeGroot, 1994). Accordingly, some have pointed to PCSs as contributing to the perception that “a nurse is a nurse is a nurse,” that all nurses are equal and interchangeable. This perception is inconsistent with the evidence presented in Chapter 3 that nurses vary in their level of knowledge and expertise. It has also been identified as
contributing to decreased confidence in the validity and reliability of PCSs and the staff allocations that result from their use (Malloch and Conovaloff, 1999).
Workload estimates used in PCSs also are criticized as not taking into account other factors, such as the frequent interruptions encountered by nurses in performing certain tasks (Malloch and Conovaloff, 1999) or the need for multitasking by nurses—often in the performance of the invisible, cognitive work of nurses described in Chapter 3. For example, while a nurse may be changing intravenous tubing, he or she may also be observing the patient’s physical status and pain level and providing patient education (Malloch and Conovaloff, 1999). Workload estimates also are criticized for being derived from measurements of care that is delivered, which is often constrained by staffing limits and therefore is not an accurate predictor of the care that is actually needed (Jennings et al., 1989).
One study compared PCS predictions with the care actually delivered, as measured by the same classification tool administered retrospectively by nurses who had received intensive training on the use of the PCS tool and had scored high on interrater reliability. This study found significant differences in the average prospective and retrospective classification scores in two of the three nursing units in which the study was conducted. For all three units, the retrospective PSC scores were higher than the prospective scores. The times associated with these differences would result in staffing deficits of 0.24 FTEs, 0.72 FTEs, and 2.99 FTEs in the three units (Hlusko and Nichols, 1996). An earlier study comparing the application of four different PCSs for the same patient population found large statistically and clinically significant differences in hours of care needed by the patients according to those four tools (O’Brien-Pallas et al., 1992).
Such concerns point to the need to validate and evaluate PCSs during their actual implementation (DeGroot, 1994). However, although there are reports in the literature regarding the validity and reliability of a system during its initial implementation (efficacy), there is “a paucity of published research related to patient classification system validation after implementation” (effectiveness) (Hlusko and Nichols, 1996:40). Moreover, continual changes in personnel, work environments, tools and equipment, and technology in most workplaces result in corresponding changes in the time required to perform the work, necessitating revision of the standard times. As a rule of thumb, experts recommend that work measurement reviews and reevaluations be conducted annually and additionally on an ad hoc basis whenever major work redesigns are undertaken (Bayiz, 2003).
Multiple purposes create incentives for gaming. Although PCSs are used to predict staffing needs, they have other uses as well, such as to estimate long-term staffing requirements for budgeting purposes (Seago, 2002). These multiple purposes of PCSs provide incentives for “gaming” or ma-
nipulation. While nursing staff can consciously or subconsciously manipulate patient classification levels (and thereby project needs for greater staffing—a phenomenon referred to as “acuity creep”), managers can also influence staffing need projections through their selection of the staffing allowances for the various acuity levels (Norrish and Rundall, 2001).
PCSs are time-consuming. Most PCSs require nurses to check off activities, treatments, and procedures according to their frequency of occurrence for each patient several times a day. A survey of California hospitals, for example, revealed that three-fourths of hospitals must complete 36 items for their PCS, while half must complete 20 items; one PCS was found to contain 200 items (Seago, 2002).
As a result of the above concerns, researchers studying patient staffing and PCSs note “widespread distrust” of virtually all these tools (Spetz et al., 2000), and the AHRQ evidence report Making Health Care Safer: A Critical Analysis of Patient Safety Practices (Seago, 2001:427) concludes that “although PCSs are used for multiple purposes, they are an inadequate tool for determining unit staffing on a daily or shift basis. In addition, there are numerous patient classification systems and most are specific to one hospital or one nursing unit. The validity and reliability of PCSs are inconsistent and the systems cannot be compared with one another.” Nonetheless, a number of states mandate the use of PCSs. Five states (Texas, Oregon, Kentucky, Nevada, and Virginia) require hospitals to develop and implement nurse staffing plans, methodologies, or systems (ANA, 2002). The California nurse staffing legislation described above requires hospitals to adhere to both nurse staffing ratios and the results of a hospital-selected PCS, whichever is higher. Some speculate that hospitals will have incentives to readjust their PCS staffing factors to predict staffing levels no higher than the ratios mandated by law (Seago, 2002).
For this reason, many researchers, hospital executives, and policy analysts call for more reliable and valid measures of patient acuity (Reed et al., 1998) or the use of approaches other than PCSs to determine nurse staffing in relation to current patient needs (Kovner et al., 2000). Some urge the development of a formula approach to determining nurse staffing levels that would take into account multiple variables in addition to patient acuity, including RN staff expertise; work intensity; unit physical layout; and availability of NAs, other support staff, and physicians (Seago, 2002).
Failure of methods for predicting patient volume to keep pace with changes in hospital admission practices Compounding the above problems with predicting workload on the basis of patient acuity are problems in predicting daily and hourly patient volume. As discussed above, PCSs document the acuity level of patients at a point in time. If patient volume and acuity are assumed to be stable, acuity, workload, and theoretically staffing are
predictable for the next shift. However, as the environment becomes less stable as a result of patient turnover (patient discharges and new admissions) and changes in patient status, projections become less accurate. To the extent that input (patient admissions) to a unit is not predictable, PCS predictions will be less accurate (Seago, 2002).
Historically, hospitals have predicted patient volume—and thereby staffing levels—based on a daily census, typically taken at midnight. A midnight census, however, underestimates care requirements. The actual number of patients cared for by nurses during a 24-hour period is actually the total of four patient types—those on the unit for the full 24-hour period, patient admissions, patient discharges, and patients admitted and discharged on the same day (often referred to as “observation-only” patients). The midnight census fails to capture two of these four—discharges prior to midnight and observation-only patients (Lawrenz, 1992). The latter patients often are in need of care because of an outpatient surgical or radiological procedure and frequently require the same level of care as other inpatients. Moreover, admissions and discharges are well known to be high-activity, time-demanding processes. Thus when hospitals base predictions on projected patient volume as indicated by the midnight census alone, they fail to accurately measure the true level of patient volume—and nurses’ workload (Budreau et al., 1999; Jacobson et al., 1999).
A 1997 study was conducted at a large midwestern medical center to determine the difference between the midnight census and the actual number of patients receiving nursing care in one unit for a 24-hour period. The midnight census counted 23 patients on the unit, while the unit had actually cared for 35 patients during the day. This study also examined periods of peak activity and found that, contrary to historical patterns of peak activity, the evening shift in today’s environment is just as busy as the day shift in terms of total hours of care required. This situation is attributed to several changes brought about by today’s health care environment, such as the fact that a late discharge maximizes the number of hours a patient is in the hospital while avoiding incurring an additional “day” charged at midnight. Late discharges also occur because family members often prefer to pick up the patient after their workday, when they will be home to monitor the patient more closely. Because discharges are late, admissions are also late, awaiting the availability of a bed (Jacobson et al., 1999).
Staffing principles that can help compensate for these problems As of 2002, five states had laws requiring hospitals to develop and follow internal nurse staffing plans (as opposed to adhering to nurse staffing ratios) (ANA, 2002). A number of nursing organizations have put forth guidance for HCOs to follow when developing such staffing plans. This guidance often speaks to issues broader than patient safety, including nurses’ “degree of
involvement in quality initiatives” and their “immersion … in activities such as nursing research that add to the body of nursing knowledge” (ANA, 1999:7), as well as their professionalism, satisfaction, and personal values and ethics (American Association of Critical Care Nurses, 1999). From work in the behavioral, organizational, engineering, and health sciences, the committee has identified the following staffing practices that can improve patient safety.
Incorporate admissions, discharges, and “less than 24-hour”patients into estimates of daily patient volume. Evidence presented at the beginning of this chapter makes clear that staffing for patient safety requires, in part, staffing proportionate to patient volume. To this end, HCOs must obtain estimates of patient volume for the upcoming shift, day, weeks, and months that are as accurate as possible. These estimates should be developed not solely by measuring patient volume at one point in time (e.g., the midnight census), but also by including admissions, discharges, and observation-only patients in patient volume measurements for each unit.
Involve direct-care nursing staff in selecting, modifying, and evaluating staffing methods. Despite the limitations of PCSs described above, they provide a degree of objectivity in the allocation of staffing resources (American Association of Critical Care Nurses, 1999). Until more-effective methods are developed for predicting staffing needs, estimates of patients’ clinical care needs (patient care workload) and nurse staffing levels are likely to continue to be made using some variant of PCSs. Estimates thus derived ideally should rely on work sampling studies conducted on the unit to which they will be applied, thereby better reflecting variations in the expertise and skill mix of nursing staff, the availability of support staff, the way patient care is organized and delivered across units, and the physical layout of the nursing unit and hospital (Bayiz, 2003; Malloch and Conovaloff, 1999).
Such work sampling can be expensive, however, especially if done individually for multiple nursing units, as well as labor-intensive. HCOs may instead choose to use one of the numerous PCSs that are available commercially or use their own historical nurse staffing models. Further, variables such as the experience and expertise of nursing staff and the availability of support staff frequently change on a shift-to-shift basis. For these reasons, it is important to increase the accuracy of the workload estimates produced by involving direct-care nursing staff in selecting the PCS or other approach (e.g., the HCO’s own historical nurse staffing models) used to estimate staffing. Staff should also be involved in evaluating the assumptions and methods used in the selected PCS (i.e., validating the patient classification methods and identifying threats to the generalizeability of the results derived from the PCS to individual patient care units), in developing and applying remedies to make the projections more accurate, and in monitoring the outcomes of the application of the PCS (Malloch and Conovaloff, 1999).
Furthermore, the workload estimates produced with traditional PCSs should be recognized as just one dimension rather than the sole determinant of staffing. In addition to being involved in evaluating the general approach used to estimate nurse staffing levels, nursing staff need to be directly involved in developing approaches to compensate for the inevitable imprecision of volume and workload estimates. This principle of high involvement of nursing staff in selecting, modifying, and evaluating approaches to estimating nurse staffing is based on evidence presented in Chapter 4 describing the benefits of involving workers in work design and work flow decision making.
Provide for “on-time” staffing or demand elasticity to accommodate unpredicted variations in patient volume and/or acuity and resulting workload. The best PCSs and other workload measurement/staffing methodologies available use measures of past populations to project future workload. Like all predictions, these projections are imperfect, and there is always a variance between the anticipated and actual workload (Bayiz, 2003). It has long been established that when using nurse staffing methodologies based on patient classification and workload estimates, corrective allocations or smoothing techniques are needed to respond to variations in patient volume or acuity not predicted by past events (Bayiz, 2003; Hershey et al., 1980). Meeting these unplanned-for needs for additional staffing can be accomplished either by providing for an increase in nurses or by controlling the demand for nursing services.
Providing for “on-time” increases in nurses can be accomplished in several ways: staffing above predicted estimates, developing pools of cross-trained nurses who are floated among units to smooth demand fluctuations, temporarily reallocating a nurse to a unit other than the one he/she normally works (often called “pulling” a nurse (Hershey et al., 1980), and using nurses obtained from external sources (e.g., temporary employment agencies). While staffing above predicted levels may be costly and difficult because of the existing nursing shortage, this approach offers higher patient safety benefit than floating, pulling, or using nurses from external agencies. Nursing staff are immediately available to accommodate quick changes in patient status or volume—not available in the situation described below:
I was the nurse-in-charge of a 19-bed labor, deliver and recovery unit. Every bed was full and one patient was being cared for in a “room” in the hallway. Normally charge duties would consist of supervising and providing back-up for nursing staff and handling all logistical issues for the unit. On this day, every nurse was caring for as much or more than she could handle. I took on patient triage (determining if pregnant women were ready to be admitted for delivery or sent home) and caring for a patient recovering from a postpartum hemorrhage of about 2000 ccs (blood pressure 54/32 and pulse = 200 at her worst point).
After triaging the first patient, I left her to check again on my patient with the post-partum hemorrhage, leaving the first and a new triage patient under the watchful eye of a wonderful, but not fully trained “scrub tech,” telling the tech to call me if the patient needed anything. No sooner had I got to the postpartum hemorrhage patient, than I had to leave her. I was the only nurse available to assist with a patient in active labor (she delivered in less than 20 minutes) while still (in theory) monitoring the post-partum hemorrhage patient (fortunately her husband was an emergency medical technician and I pressed him into monitoring her condition) and two triage patients.
On another shift, only luck and great teamwork kept a disaster from happening when we admitted an emergency C-section for abruption with hemorrhaging. I and several other nurses (all also responsible for two patients apiece) went to assist. Once the case was underway, the other nurses returned to care for their patients. I reminded my charge nurse that one of my patients was on Pitocin (a drug that causes contractions) and had earlier had fetal distress. She gave a worried laugh and said that there as no one else to watch them but that she would try. When I came out of the OR to get drugs for anesthesia, I glanced at the fetal monitor and saw my patient back in fetal distress. I dropped off the drugs, ran out of the OR leaving the other nurse on her own with the C-section, turned off the Pitocin, and went to notify my patient’s doctor. If anesthesia has not needed the drugs, the distress would have continued because every other nurse was going as fast as they could caring for other patients.
Staffing above predicted levels follows the principle of redundancy that is employed by high-reliability organizations (Roberts, 1990). Such redundancy is not wasteful. Determining optimal workforce size by considering the trade-offs between the costs of excess demand and excess capacity is a well-studied area of operations research. Statistical modeling incorporating the costs of both undersupply and oversupply of personnel is often employed to calculate a critical ratio that is used to determine how many extra employees should be maintained (Bayiz, 2003). Moreover, this redundancy or “slack” is necessary for learning and training to occur. Studies of effective learning environments (see Chapter 4) have revealed that staff must have sufficient time for reflection and analysis to assess current work systems and devise new work processes. Learning is difficult when employees are harried or rushed; it tends to be driven out by the pressures of the moment. Only if management allows employees time for the purpose does learning occur with any frequency (Garvin, 1993). High-reliability organizations also illustrate this principle by regularly freeing up workers’ time for ongoing training.
However, staffing above projected need for each nursing unit will result in additional supply and higher labor costs. When staffing above predicted levels for each unit is not possible, additional staff will need to be obtained in other ways. Use of internal HCO employees is preferred to use of temporary employees from outside sources. As described in Chapter 3, the latter
employees are less familiar with an organization’s information systems, patient care technology, facility layout, critical pathways, work components’ interdependency, ways of coordinating and managing work, and other work processes. Consequently, the use of temporary nursing staff from external sources can pose a threat to patient safety. Use of external temporary employees also decreases continuity of care.
Moreover, work systems with high worker involvement as described in Chapter 4 are more difficult to implement where there is extensive use of such labor because of the lesser quality of communication between management and temporary workers and lower trust levels. Firms that rely on temporary staff (e.g., registry or travel nurses) are less likely to have high-involvement work practices because of lower levels of shared information and common experience (Rousseau and Libuser, 1997; Wells et al., 1991).
A pool of internal HCO “float nurses,” having received the training necessary to provide care to patients with diverse clinical needs in different patient care units, can meet the need for additional staff (Barry-Walker et al., 1994). Use of cross-trained float nurses is safer than pulling nurses from the units in which they work because the cross-trained float pool will have the knowledge and expertise to function in a variety of nursing units. Use of a float pool reduces the number of extra staff in a facility, in contrast to staffing each unit above projections. It is cost-efficient because variation in staffing needs is often more dramatic on a unit-by-unit basis than for the institution as a whole. However, it does have some limitations. Float nurses need to be cross-trained, requiring investments in their education on the part of the HCO. Second, unless these positions are well designed and supported, they can be a source of job dissatisfaction. Having no single work group with which to identify can be isolating, and performance evaluation is made difficult by the frequent changes in job assignment and different clinical supervisors on each unit. Frequent changes in assignment may also affect quality of care (Bayiz, 2003).
An alternative to decreasing workload by increasing the supply side of personnel is to moderate the demand side. Advocates of work sampling tools to reengineer nurses’ work assert that achieving optimum nursing work distribution requires empowered nursing staff who are allowed to use their creativity and search for more efficient ways to delivery quality patient care (Upenieks, 1998). Allowing staff to regulate work flow will reduce the need for a float pool (Bayiz, 2003). This point is illustrated by the approach used by Luther Midelfort hospital in Wisconsin, which regulates patient flow through a unit assessment tool administered by nursing staff. Nursing staff have the authority to limit new admissions, even when there are empty beds, when in their judgment the number of available staff (number and experience level of RNs and other factors, such as support staff) is insuffi-
cient for the workload, and patient safety is endangered (Rozich and Resar, 2002). A similar approach has been used elsewhere (Knaus et al., 1986).
Minimize staff turnover and use of nursing staff from external agencies. As discussed in Chapter 3, high turnover of nursing staff and the use of temporary staff from external agencies threaten patient safety by decreasing the continuity of patient care and introducing personnel with less knowledge of nursing unit policies and practices. All of the above observations regarding the use of temporary external staff apply as well to situations of high staff turnover. Both reducing staff turnover and limiting use of registry personnel are priority strategies for achieving adequate staffing.
Continually assess staffing methodologies and their relationship to patient safety. HCOs should not assume that their staffing work is done once they have complied with state and federal staffing regulations, purchased a proprietary PCS, or successfully negotiated staffing standards with their labor partners. Ongoing research is producing better information about the relationship between staffing and patient outcomes, and the science of measuring workload and estimating staffing is still evolving. Moreover, the costs of implementing sophisticated staffing technologies for application across every nursing unit may be prohibitive for many HCOs, and the nurse workforce (as discussed in Chapter 3) is characterized by high rates of turnover. For these reasons, HCOs need to continually assess the effectiveness of their approach to staffing and its effect on patient safety. This precept is similar to that contained in JCAHO’s accreditation standards, which require hospitals to use data on clinical services in combination with personnel resource data to assess their own staffing effectiveness and identify and implement strategies for improvement (JCAHO, 2003). The JCAHO standards became effective for hospitals in July 2002 and are currently being tested in nonhospital programs (e.g., nursing facilities).
The committee believes that, in addition to evaluating the effect of staffing on certain clinical and human resource outcomes, HCOs need to frequently evaluate the overall process used for determining staffing levels. Doing so is important because studies of health care quality have well documented that the outcomes measured by a subset of clinical quality indicators cannot be generalized to health care quality overall (Brook et al., 1996). It is possible for an HCO to score highly on its chosen clinical indicators and still have staffing that contributes to poor outcomes as measured by other indicators.
In sum, the committee strongly believes that safe patient care requires frequent and ongoing review of staffing methods and patient care outcomes and efficient use of staff. Regardless of the approach used by hospitals (and nursing homes, for which there is no comparable literature describing the methods used to predict staffing needs), the committee recommends that all
hospitals and nursing homes take the following actions to increase the safety of their staffing levels:
Recommendation 5-2. Hospitals and nursing homes should employ nurse staffing practices that identify needed nurse staffing for each patient care unit per shift. These practices should:
-
Incorporate estimates of patient volume that count admissions, discharges, and “less than full-day” patients in addition to a census of patients at a point in time.
-
Involve direct-care nursing staff in determining and evaluating the approaches used to determine appropriate unit staffing levels for each shift.
-
Provide for staffing “elasticity” or “slack” within each shift’s scheduling to accommodate unpredicted variations in patient volume and acuity and resulting workload. Methods used to provide slack should give preference to scheduling excess staff and creating cross-trained float pools within the HCO. Use of nurses from external agencies should be avoided.
-
Empower nursing unit staff to regulate unit work flow and set criteria for unit closures to new admissions and transfers as nursing workload and staffing necessitate.
-
Involve direct-care nursing staff in identifying the causes of nursing staff turnover and in developing methods to improve nursing staff retention.
Recommendation 5-3. Hospitals and nursing homes should perform ongoing evaluation of the effectiveness of their nurse staffing practices with respect to patient safety, and increase internal oversight of their staffing methods, levels, and effects on patient safety whenever staffing falls below the following levels for a 24-hour day:
-
In hospital ICUs—one licensed nurse for every 2 patients (12 hours of licensed nursing staff per patient day).
-
In nursing homes, for long-stay residents—one RN for every 32 patients (0.75 hours per resident day), one licensed nurse for every 18 patients (1.3 hours per resident day), and one nurse assistant for every 8.5 patients (2.8 hours per resident day).
The staffing thresholds identified in recommendation 5.3 for nursing homes are those identified in the CMS (2001) study of the appropriateness of minimum nurse staffing ratios in nursing homes discussed at the begin-
ning of this chapter. The ICU thresholds were taken from published studies cited previously that found that ICUs in which individual nurses are responsible for more than two patients are associated with specific types of patient complications, including respiratory problems, cardiac arrest, and infections.
The committee was disappointed that, although higher levels of nurse staffing are clearly strongly related to better patient outcomes and reduced adverse events, the research that has produced this evidence has not yet included sufficient studies of staffing levels within specific types of patient care units (e.g., medical–surgical units and labor and deliver units). As a result, with the exception of studies of ICU care, the committee was not able to identify quantitative staffing levels that could be used by hospitals in evaluating the appropriateness of their staffing levels for medical–surgical units, labor and delivery units, or other types of hospital patient care units.
The committee strongly recommends that researchers studying the effects of staffing on patient safety take the next step of conducting research for specific types of patient care units. We note that such research will be challenging because the smaller numbers of patients found in individual patient care units will make statistical analysis more difficult. Moreover, the lack of a standardized approach to classifying patients by their level of nursing care acuity will confound interpretation of the findings of such research. The different acuity levels of patients found in, for example, medical–surgical units or step-down/transition units heightens the importance of being able to adjust for the acuity level of patients. Thus a strong, standardized approach for classifying patient care acuity in terms of nursing care is needed. The committee calls this need to the attention of researchers and those who fund health services research.
With respect to the recommendation that hospitals and nursing homes perform ongoing evaluation of the effectiveness of their nurse staffing practices with respect to patient safety and increase their internal oversight of their staffing methods, levels, and effects on patient safety whenever staffing levels fall below the identified levels, we wish to offer the following clarification: these staffing levels are not intended to be rules that should never be violated, but to serve as yardsticks against which each hospital and nursing home can compare the results of the methods it uses to predict its staffing needs on a daily basis, across all shifts in the aggregate. Because of the very strong evidence linking staffing levels to patient safety, we believe that all hospitals and nursing homes should examine trends in their staffing levels and the daily patterns that emerge when their staffing levels are compared against these standards. For example, if a facility found that it routinely met the standards but infrequently did not, it would want to examine what happened on those days when staffing diverged from the norm. Was it because of staff absences, higher-than-predicted patient volume, or some
other reason? How had the HCO planned to deal with such variations, and were those plans effective? This is the rationale behind the committee’s recommendation that all HCOs provide for staffing elasticity or slack within each shift’s scheduling to accommodate unpredicted variations in patient volume and acuity and resulting workload.
Alternatively, if an HCO’s staffing were consistently below these levels, it might want to pay particular attention to the recommendation to involve direct-care nursing staff in determining and evaluating approaches used to calculate appropriate unit staffing levels for each shift. If nursing staff believe the HCO’s methodology is producing safe staffing levels, the HCO can be assured that it is using its nursing staff safely as well as efficiently (i.e., not valuing efficiency and productivity over safety, as discussed in Chapter 4). If nursing staff express that the methodology is not routinely providing safe staffing levels, the HCO should reexamine its staffing methodology, assumptions, and underlying data.
Marketplace/Consumer-Driven Approaches
Hospital and nursing home report cards Providing consumers with information about health care quality is widely identified as a means of enabling them to make better health care choices and leverage the power of the marketplace to encourage all HCOs to take the sometimes difficult actions needed to improve health care quality (Hibbard et al., 2002). Report cards on performance have been used primarily for hospitals, health plans, and physician groups (Corrigan, 1995; Luft et al., 1990; Mukamel and Mushlin, 1998; Simon and Monroe, 2001). Many researchers have examined whether these efforts are effective and how to make report cards more useful to consumers (Goldstein and Fyock, 2001; Hibbard et al., 2000, 2002). Because staffing levels in hospitals and long-term care facilities are important components of patient safety (a dimension of quality), information about staffing levels could be made available to the public. Several organizations are providing such information with respect to nursing homes, but such has not been the case for acute care hospitals.
Nursing home report cards CMS began publishing information on nurse staffing on its website in 1999.9 This website provides comparative data for all nursing homes in the United States that are certified to provide services to Medicare and Medicaid beneficiaries. The data are collected at the time of the annual nursing home survey conducted by states and reflect
|
9 |
This website also includes other basic information about nursing homes, such as location, bed size, occupancy, complaints and deficiencies, and quality indicators. See www.Medicare.gov/NHCompare/home.asp [accessed September 26, 2003]. |
a 2-week period. Nurse staffing levels are typically reported in terms of average hprd of care for each type of nursing staff (RN, LPN/LVN, NA) and the director of nursing (CMS, 2003a).
Nursing home report cards are also produced by state governments. As of 2002, 24 states and the District of Columbia had created websites making a variety of information from these report cards available to users. A review of these sites found that they varied in scope and detail, and four contained very limited information. While most offered information on facility characteristics, only seven provided data on nurse staffing, and none had data on staff turnover rates (Harrington et al., 2003). California Nursing Home Search (Calnhs) is a comprehensive consumer nursing home website launched by the California HealthCare Foundation in October 2002.10 Calnhs indicators include staffing data, as well as facility characteristics and ownership; resident characteristics and case mix; measures of quality performance; data on deficiencies, complaints, and enforcement actions; and financial indicators. The website interprets the data and offers nursing home ratings and guidance to assist consumers in comparing and selecting facilities.
Calnhs staffing indicators provide information on hprd for total nursing staff and by type of staff. Each nursing home is then rated based on its staffing levels. Total nurse staffing levels are compared against the California minimum staffing requirement (set at 3.2 hprd in 1999, excluding directors of nursing). Nursing homes that do not meet the minimum standard are given a one-star rating, while facilities that meet the standard are given two stars. To receive a three-star rating (the highest level), a nursing home is required to meet a staffing goal of 4.1 hprd, which is based on the CMS (2001) study on the appropriateness of minimum nurse staffing ratios in nursing homes. Calnhs uses resident assessment data to categorize facilities based on resident case mix. Facilities receive a three-star rating if those with low resident needs have 4.1 hprd, if those with average resident needs have 4.3 hprd, and if those with high resident needs have 4.5 hprd. Calnhs also presents information on the type of staff in each nursing home (RNs, LPNs, and NAs) and compares the facility’s hprd with that in the CMS study (0.75 RN hprd, 0.55 LVN/LPN hprd, and 2.8–3.2 NA hprd). Also presented on the website are detailed guides to understanding staffing levels for consumers, as well as information on staff turnover rates and wages paid to NAs. As discussed in Chapter 3, both high turnover rates and very low wages pose threats to patient safety.
Hospital report cards The federal government has announced plans to publish a hospital report card on its website. The report card will include
|
10 |
See www.calnhs.org [accessed September 26, 2003]. |
10 measures of basic procedures used to treat patients with heart attacks, congestive heart failure, or pneumonia. Nurse staffing levels are not one of the 10 measures. The website will also show how patients responded to an experience-with-care survey they will be asked to fill out when they are discharged (Brown, 2002). A draft of this Hospital Patient Perspectives on Care instrument is currently being tested by CMS in a voluntary pilot project. Although the draft does not ask about nurse staffing levels, it does contain questions about patients’ care from nurses that could be indicative of staffing adequacy (e.g., “How often did nurses spend enough time with you?”). However, the survey instrument does not define “nurse,” and is not expected, at present, to generate nursing unit–level data (CMS, 2003b). These omissions will limit the interpretability of the data by consumers.
Most states also publish hospital report cards; 37 states are required to provide some data on the quality of their hospitals. However, state hospital report cards typically do not include data on nurse staffing levels, in spite of this being identified by consumers as one of the three most important features of high-quality hospital care (in addition to good systems for coordinating care and experience in treating specific medical conditions) (Consumers Union, 2003a,b). A number of private-sector consumer organizations and purchasing coalitions also sponsor consumer report cards on HCOs—most often hospitals and health plans.
Establishing quantitative measures of nurse staffing levels for hospitals will be more difficult than for nursing homes. As discussed at the beginning of this chapter, hospitals have a large number of heterogeneous nursing units (e.g., labor and delivery, oncology, ICU, pediatrics). Nursing homes typically have a comparatively small number of heterogeneous units; many have none. For this reason, as discussed previously, a hospital-wide numerical measure of nurse staffing will not well represent the nurse staffing on a particular unit. For example, tertiary hospitals with multiple ICUs (which tend to have greater staffing relative to other units) may appear to have higher staffing levels than a community hospital without ICUs, even though the community hospital may have higher staffing on a general medical floor. Developing staffing measures for hospital report cards will likely be complex. Patients’ reports of their perceptions of the sufficiency of nursing services on an experience-of-care survey may be a useful measure.
Need for more accurate and reliable staffing data to inform these efforts and research on staffing At present, staffing data from both hospitals and long-term care facilities are widely noted as unreliable.
Nursing home staffing data Staffing data for nursing homes collected by the Medicare and Medicaid programs are widely acknowledged to be limited and unreliable. For this reason, the CMS (2000) study on the appro-
priateness of minimum nurse staffing ratios in nursing homes had to use payroll records and invoices for contract nurses to measure staffing accurately. The only electronic sources of nursing home staffing data currently and routinely available are Medicaid Cost Reports and CMS’ OSCAR.
Medicaid Cost Reports are financial reports of all nursing home facility costs, including those for staffing, submitted annually by all nursing facilities to their state Medicaid agencies for reimbursement and accounting purposes. Cost Report data are not available for all states or for facilities that are not Medicaid certified (CMS, 2001). The OSCAR database contains staffing and other information on every nursing home in the United States certified by Medicare and/or Medicaid. The data are collected as part of the process for certifying each nursing home initially and annually for Medicare and/or Medicaid reimbursement, but represent only facility-reported staff positions for the 2-week period immediately prior to annual certification. While some edit checks of these data are performed by CMS, the staffing data are currently not audited, and concerns have been expressed about their accuracy and validity.
The Phase I report of the CMS (2000) study on the appropriateness of minimum nurse staffing ratios in nursing homes states that a new staffing reporting and auditing system is needed for nursing facilities. During this phase of the study, payroll data were collected from nursing facilities in one state to assess the validity and reliability of staffing data from the Medicaid Cost Reports and OSCAR. The analysis found that both were limited in their ability to provide an accurate depiction of staffing levels over multiple, distinct time periods. The Medicaid Cost Reports contained more-accurate staffing data than did OSCAR, but did not include staffing definitions or report consistent staffing measures across states. In addition, there is a considerable time lag from the reporting period to data availability (CMS, 2000). CMS currently is funding a project to develop and test a more accurate reporting form for nursing homes and a mechanism for auditing what is reported, as well as to determine the most efficient method of transmitting staffing data for public reporting (CMS, 2001).
To improve the staffing data in OSCAR, CMS could develop a methodology for conducting payroll audits at the time of the annual survey or develop a new staffing reporting system, or both (CMS, 2000, 2001). Advocates suggest that a new staffing report should be developed so facilities would submit a uniform, standardized, and computerized data report on all nursing staff (by numbers and types of staff and residents) for each day on a quarterly basis—at the same time they submit their resident assessment data from the MDS each quarter. Use of such a standardized quarterly report would provide staffing data that would be more accurate and current, which could then be audited on a regular basis by state surveyors.
Legislation is being considered that would require more-detailed reporting on staffing.
Hospital staffing data A lack of uniform, reliable, and readily available data on hospital staffing similarly is widely cited as preventing better understanding of nurse staffing (Kovner et al., 2000; Needleman et al., 2001; Sochalski, 2001; Unruh, 2002). Researchers who want to examine national patterns of staffing frequently use data collected by AHA’s Annual Survey of Hospitals. However, this survey does not ask for staffing data by hospital unit; it collects aggregate staffing data at the level of the hospital, combining all different types of inpatient units (e.g., ICUs, labor and delivery, pediatrics), outpatient units, and any hospital-based long-term care units (Kovner et al., 2000; Spetz et al., 2000). It further collects data on all nurses and does not distinguish nurses providing direct patient care from those in purely administrative or managerial positions (Kovner et al., 2002). Moreover, while the survey asks hospitals to report full-time and part-time licensed nurses, it does not define “full-time” RNs and assumes that part-time licensed nurses work 20 hours per week on average. This assumption is inconsistent with data from the National Sample Survey of RNs, which indicate that part-time nurses work closer to 30 hours per week. The AHA staffing numbers are thereby likely to underestimate the hours worked by nursing personnel (Spetz et al., 2000). Furthermore, when hospitals do not respond to the survey, the AHA “imputes” a response. Therefore, some of the data are estimates rather than true self-reports, which may substantially reduce their accuracy (Spetz et al., 2000). Because of these limitations, some researchers use staffing data obtained from states (Lichtig et al., 1999; Needleman et al., 2002). However, not all states collect these data, and those that do often receive data that are incomplete and unreliable (Lichtig et al., 1999).
Specific ways of improving data on hospital nurse staffing include (1) counting all nursing staff (RNs, LVNs/LPNs, and NAs) in nurse staffing reports, (2) developing universal definitions of nurse categories and procedures for calculating full-time and part-time nursing staff, and (3) separately reporting staffing for inpatient and outpatient care and for specific nursing units (Needleman et al., 2001; Sovie and Jawad, 2001). Based on the importance of nurse staffing levels to patient safety, the role of the health care marketplace in promoting patient safety, and the current poor quality of nurse staffing data, the committee makes the following recommendation:
Recommendation 5-4. DHHS should implement a nationwide, publicly accessible system for collecting and managing valid and reli-
able staffing and turnover data from hospitals and nursing homes. Information on individual hospital and nursing home staffing at the level of individual nursing units and the facility in the aggregate should be disclosed routinely to the public.
-
Federal and state nursing home report cards should include standardized, case-mix–adjusted information on the average hours per patient day of RN, licensed, and nurse assistant care provided to residents and a comparison with federal and state standards.
-
During the next 3 years, public and private sponsors of the new hospital report card to be located on the federal government website should undertake an initiative—in collaboration with experts in acute hospital care, nurse staffing, and consumer information—to develop, test, and implement measures of hospital nurse staffing levels for the public.
The creation of such a system for collecting staffing data from hospitals and nursing homes should remedy the lack of a national database on hospital nurse staffing levels that, as previously cited, (1) reports staffing levels by type of patient care unit; (2) distinguishes direct-care nursing staff from nursing staff in administrative, managerial, educational, or other non–direct patient care positions; and (3) distinguishes inpatient nurses from those delivering outpatient care in hospitals. These problems have thwarted researchers’ and managers’ attempts to better understand the role of nurse staffing in patient care and the more efficient and effective deployment of nursing staff.
SUPPORTING KNOWLEDGE AND SKILL ACQUISITION AND CLINICAL DECISION MAKING11
The IOM (2001a) report Crossing the Quality Chasm cites the growing complexity of science and technology as one of the four main attributes of the U.S. health system affecting health care quality. This tremendous expansion of clinical knowledge, drugs, medical devices, and technologies continues unabated, and likely provides ongoing benefits to patients. In a study of hospital organizational and structural features associated with patient
mortality, the presence of high technology or its proxies was consistently found to be associated with lower mortality (Mitchell and Shortell, 1997).
Crossing the Quality Chasm also calls attention to the threats to patient safety posed by this expansion in knowledge, noting, “Today, no one clinician can retain all the information necessary for sound, evidence-based practice. No unaided human being can read, recall and act effectively on the volume of clinically relevant scientific literature” (IOM, 2001a:25). This observation has implications for the work environment of nurses and patient safety. As advances in science and technology emerge, nurses—like all health care providers—will need to adopt and implement those that have proven beneficial to patients. Doing so will require that nurses continually acquire new knowledge and skills and apply them in the clinical decisions they make at the point of care.
If, however, human beings cannot without assistance identify, incorporate into their personal knowledge base, and recall when needed all clinical information pertinent to the care of a patient at a given point in time, where are they to obtain such assistance? Evidence presented in Chapter 4 indicates that the ongoing acquisition and management of knowledge is an essential responsibility of high-performing organizations in today’s society. The discussion in that chapter highlights the important role that employer organizations play in actively managing the learning process of their organization and transferring knowledge quickly and efficiently throughout the organization. This role of HCOs is critical to supporting nurses’ knowledge and skills. While many nurses pursue continuing education activities as a matter of professional commitment and/or at the behest of state licensing boards, studies of research-based innovation in nursing indicate that practicing nurses are often not aware of new knowledge that is applicable to their practice; if they are aware, they can be hampered in integrating that knowledge into their practice because targeted adoption of certain practice innovations may involve multiple disciplines, departments, and processes within the HCO (Donaldson and Rutledge, 1998). Moreover, because many NAs live at or below the poverty level (see Chapter 3), they frequently lack the resources to pursue continuing education on their own. Thus while the individual nurse is responsible for her or his own continuing education and training, all HCOs need to provide actively for their nursing staff’s ongoing acquisition of new knowledge and skills, and to support the application of this knowledge and offer other decision support at the point of care delivery.
Need to Strengthen Ongoing Assistance in Knowledge and Skill Acquisition
Knowledge and skills are the fundamental building blocks of worker capability (Rousseau and Libuser, 1997). However, it is not reasonable to
expect that all nurses (especially those newly licensed) will come to a place of employment possessing the knowledge and skills needed to practice at a high level of expertise. Dreyfus and Dreyfus’ (1986) careful studies of the skill acquisition process across a wide range of learners and workers (e.g., airline pilots, chess players, auto drivers, and adult learners of a second language) show that individuals usually pass through at least five stages of qualitatively different perceptions of work tasks and decision making as skill improves through the cumulative effects of substantial experience. Learners progress along a pathway from novice to advanced beginner, competence, proficiency, and finally expert (Benner, 1984; Dreyfus and Dreyfus, 1986).
Prelicensure or pre-employment education cannot provide sufficient frequency and diversity of experiences (and sometimes offer no experience) in the performance of every clinical nursing intervention needed for every clinical condition found in patients, especially as the breadth of knowledge and technology expands. Nurses, therefore, like physicians, come to their initial place of employment as novices without certain skills and knowledge—their limited skill and expertise reflecting the limitations of time and experience in their academic education.
Furthermore, after licensure, nurses may practice clinically in a certain area, such as general medical–surgical nursing, for a number of years and gain high levels of expertise. They may then desire to practice in a more clinically specialized area, such as oncology or ICU, in which they have less expertise, necessitating the acquisition of new knowledge and skills. Finally, it will always be impossible for prelicensure education of nurses and pre-employment education of NAs to teach students about diagnostic and therapeutic advances that have not yet been invented. Both the medical and nursing professions are grappling with the need to ensure the continuing competency of licensed health professions in the face of the growing base of new knowledge and technology.
In 1996, the National Advisory Council on Nurse Education and Practice (NACNEP) noted that advances in medical therapeutics and technology had led to increasing complexity for nurses caring for individuals with a variety of health conditions and that a large portion of existing RNs had not been adequately prepared to meet the health care needs of their patients in the face of the rapidly expanding base of knowledge. NACNEP (1996) determined that actions were needed to upgrade the knowledge, skills, and abilities of the existing RN workforce. This position is echoed by organizations employing nurses, organizations concerned with patient safety and quality of care, and nurses themselves.
Likewise, in a statement before the Senate Committee on Health, Education, Labor and Pensions, JCAHO (2001) called attention to nurses’ lack of appropriate education, orientation, and training to manage increasingly
sophisticated care. And in a national, stratified, representative sample survey of nursing administrators from acute care hospitals and long-term care facilities conducted in 2001 by the National Council of State Boards of Nursing, fewer than half of nursing administrators evaluated newly licensed nurses as possessing the overall educational preparation to provide safe, effective care. RNs were viewed as particularly lacking skills in recognizing abnormal physical and diagnostic findings and responding to emergencies (Smith and Crawford, 2002a). These findings were quite similar to the responses of a nationally representative survey of newly graduated nurses conducted by the same organization in 2001. These nurses also reported needing better educational preparation or work orientation in recognizing abnormal laboratory findings and responding to emergency situations (Smith and Crawford, 2002b).
This lack of knowledge is not just a result of the inability of prelicensure programs to provide education on all therapies needed for all clinical conditions. At present, a number of state boards of nursing have no mechanisms in place to promote ongoing acquisition of knowledge and skills to maintain clinical competency. As of March 2001, 24 of the 56 U.S. states and jurisdictions required RNs to engage in continuing education, and 4 required competency examinations (National Council of State Boards of Nursing, 2001). Moreover, both AHA and JCAHO have stated that many hospitals have scaled back their orientation programs for newly hired nurses and ongoing in-service training and continuing education programs for nurses as a result of financial pressures (Berens, 2000; JCAHO, 2002). Inadequate training of hospital nurses has been cited as a key contributor to medical errors (Berens, 2000). Table 5-7 shows the types of orientation programs
TABLE 5-7 Types and Average Length of Orientation Programs for Newly Licensed RNs
|
Type of Program |
Percent |
Average Length (in weeks) |
|
No formal orientation |
5.5 |
— |
|
Classroom instruction/skills lab only |
0.7 |
3.7 |
|
Classroom instruction and/or skills lab plus supervised work with patients |
13.1 |
7.1 |
|
Work with an assigned preceptor with or without additional classroom instruction or skills lab work |
72.1 |
8.0 |
|
Formal internship with or without additional classroom instruction or skills lab work |
6.1 |
12.3 |
|
Other |
2.5 |
7.5 |
|
SOURCE: Smith and Crawford (2003). |
||
provided to newly licensed RNs and the average duration of each according to a 2002 national, stratified random sample survey of 4,000 newly licensed RNs practicing in all settings of care (84 percent in hospitals).
The need for ongoing training of NAs in hospitals (Hurley, 2000) and nursing homes has also been documented. The CMS (2001) Phase II final report on the appropriateness of minimum nurse staffing ratios in nursing homes includes a review of the training and education of NAs in nursing homes. NAs working in Medicare- or Medicaid-certified nursing homes (the majority of facilities) are required to have a minimum of 75 hours of initial training (including at least 16 hours of supervised practical training in performing hands-on care of individuals) and/or to pass a certification and skills test prior to employment, and must receive 12 hours per year of in-service education. The report notes that while the acuity level of nursing home residents has increased over the 13 years since these training regulations were established, the requirements for training have not. Further, NAs themselves identify the training they receive as inadequate. Continuing education is in the form of in-service education—taking place in the nursing home while the NAs are on the job, sometimes being interrupted for patient care. Education usually is presented in 1-hour segments, allowing little time for reflection. Educational material is typically presented in lecture or videotape form (CMS, 2001).
The report notes further that most NAs and NA educators agree that current initial certification education is insufficient, and that in-service education should be enhanced and tailored to the needs of staff members, with more advanced topics being covered for more experienced workers (CMS, 2001). A study of training methods in health care settings identifies the following key components of successful NA in-service programs: (1) didactic instruction presented in writing and verbally, followed by modeling by the trainer, demonstration by the trainee, and immediate feedback by the trainer; (2) further assessment of skill performance in a prototype situation, allowing for additional feedback on performance; and (3) assessment of trainees’ performance on the job (Burgio and Burgio, 1990).
Ongoing training is an especially important issue in nursing homes because of the extremely high turnover rates cited in Chapter 3. HCOs with high turnover rates must provide more training than those with low turnover rates because they have higher levels of new employees.
Training also is especially important when work is being reengineered or redesigned. In a study of 14 hospitals reengineering their work processes, it was found that many hospitals underestimated the amount of initial training and retraining needed by NAs to perform such tasks as electrocardiograms and phlebotomies. In interviews, researchers were told that new workers were often assigned patient responsibilities after initial, short train-
ing periods (some as brief as 3 days) only to function very inadequately, so that much of the rework fell back on nursing staff. The researchers note that training costs are high when addressed comprehensively. One 500-bed hospital spent $700,000 on its training in the first 2 years of its reengineering initiative. This hospital also performed a gap analysis to identify those roles not being performed adequately and to evaluate what additional training was needed. The reviewers conclude that such continual evaluation of training needs is important to implementing new roles and responsibilities effectively (Walston and Kimberly, 1997). As noted in Chapter 3, unlike NAs working in nursing homes, there are no federal requirements for the amount of training NAs working in hospitals must receive.
Benchmark Training Practices in Other Industries and Health Care
Worker training is not an issue unique to the health care industry. Many technology-dependent industries, safety-conscious industries, and industries that simply find themselves in a competitive marketplace understand ongoing worker training to be an essential part of doing business. Developing and managing human skills and intellect—more than managing physical and capital assets—is increasingly recognized as a dominant concern of managers in successful companies (Quinn, 1992).
High-reliability organizations spend more money than other organizations on training workers to recognize and respond to problems. Operators at Diablo Canyon Nuclear Power Plant, for example, work their regular shifts 3 weeks of every month. During the fourth week, they train for a wide range of unusual and potentially dangerous situations. This training keeps them alert to all the things that can go wrong. It also reinforces the idea that the organization is taking seriously the likelihood of errors, and the need for ongoing vigilance and action on the part of employees to detect errors before they result in adverse events (Roberts and Bea, 2001). Likewise, the International Atomic Energy Agency cites employee training as key to an organization’s safety culture (Carnino, undated). And findings from the aviation industry indicate that training needs to be ongoing and tailored to conditions and the experience within organizations. In the absence of recurrent training, attitudes and practices decay (Helmreich, 2000).
The American Society for Training and Development (ASTD) provides a voluntary benchmarking service for organizations across all industries to report their training practices and commitment of resources. In 2001, 270 public and private employers submitted data to the service showing an average training budget of 1.9 percent of payroll (“payroll” is defined as including wages and salaries but not benefits). The average for HCOs using the service was 1.4 percent. The range across all industries from 1996 to 2001 was 1.5 to 2.0. Organizations considered “leaders in training invest-
ment” dedicated an average of 3.2–3.6 percent of payroll to training between 1998 and 2001 (Thompson et al., 2002).
In health care, studies of magnet hospitals have found them to be characterized by high levels of training and education among nursing staff, beginning with orientation and lasting several weeks to months. Nursing staff in these hospitals also were frequently assigned preceptors who served as role models and mentors. Once orientation had been completed, continuing education was viewed as essential and supplied in sufficient quantity and quality. Magnet hospitals also typically provided further support for formal education through tuition reimbursement, flexible scheduling, and leaves of absence (McClure and Hinshaw, 2002).
Strategies to Support Nursing Staff in Ongoing Acquisition of Knowledge and Skills
Continuing and in-service education using formal and informal classroom-style group lectures traditionally has been used to provide ongoing knowledge and skill acquisition in health care. However, traditional methods of continuing education, such as conferences and dissemination of written materials, have been shown to have little effect in changing clinical practice (IOM, 2001a). Additional strategies that can be employed to help nursing staff acquire new knowledge and skills are described below.
Preceptorships and Residencies for New Nurses
Nurse residencies or internships are used by some hospitals to transition new nurse graduates into clinical practice. Residencies are usually described in formal contracts between the employer and the new graduate that specify the clinical activities to be performed by the nurse in exchange for further education and experience to advance the individual’s professional development. A survey of chief nursing officers of the University HealthSystem Consortium revealed that 85 percent reported having an extended program of orientation for new graduates (AACN, 2002). This finding is consistent with practices observed in other industries. A large proportion of employers (81 percent) reporting to the ASTD education and training benchmarking service cited the use of mentoring/coaching programs (Thompson et al., 2002).
The University HealthSystem Consortium and the American Association of Colleges of Nursing recently undertook a joint initiative to develop a standardized postbaccalaureate residency program to support new baccalaureate-prepared nursing graduates as they transition into their first professional position in direct-care nursing. Designed for academic acute care hospitals, the 1-year residency program consists of a series of learning and
work experiences addressing resource management, communication, patient safety, pain management, evidence-based care, emergency responses, end-of-life care, and critical thinking, among other knowledge and skill competencies. The residency program was implemented at six medical centers in 2002, with 259 nursing residents being enrolled under the guidance of assigned, individual preceptors and resident facilitators within each institution.12
Individualized Training
Research shows that not everyone learns the same way. While many individuals learn well through reading, some learn better through auditory mechanisms, such as lectures. Others learn better through approaches that allow them to use their motor skills. Teaching adult learners therefore requires different styles of education and training or supplements to lecture-style continuing education (Lazear, 1991), and nursing staff can benefit from being helped to learn individually, rather than as group learners, at a pace suited to their particular learning styles. CD-ROM-based and individualized text-based programs can be used to provide this individualized learning (Rauen, 2001). Peer support groups also are helpful to NAs in nursing homes in internalizing new knowledge (CMS, 2000).
Simulation
Simulation is the use of an artificially created, “practice” event or situation constructed to resemble an actual event or situation that an individual is likely to encounter and that requires critical decision making and/or physical skills. Simulation exercises often emphasize the application and integration of knowledge, skills, and critical thinking (Rauen, 2001). Simulation training allows workers to practice dealing with error-inducing situations without jeopardy to themselves or patients and to receive feedback on both individual and team performance (Helmreich, 2000). Use of simulation training has been cited by 23 percent of employers reporting to the ASTD education and training benchmarking service (Thompson et al., 2002).
In nursing, simulations of clinical practice using varying degrees of technological sophistication can be used to teach clinical assessment skills, nursing procedures, and use of technology. Body-part simulators allow the practice of such skills as inserting catheters and tracheostomy care and suctioning. Computers have greatly aided the use of simulation as an education
tool. They can be used, for example, to simulate electrocardiograms and hemodynamic body functions. Full-body, computer-integrated, physiologically accurate simulators, originally created for anesthesia training, can be used for critical care nursing education, although they require additional expenditures, space, computer literacy, and technical support (Rauen, 2001).
Decision Support at the Point of Care Delivery
Nurses also need mechanisms to help identify new sources of knowledge and integrate them into their ongoing practice at the point of care delivery. At a June 2002 invitational conference on Using Innovative Technology to Enhance Patient Care Delivery, sponsored by the American Academy of Nursing, attendees representing national health care associations, health care provider organizations, clinicians, and health care technology vendors identified minimal decision support for nurses within HCOs as a deficiency in their work environments (Bolton, 2002).
Such supports can be both low-tech and high-tech. Health care literature on decision support has addressed primarily high-tech, computer-assisted support for physicians in making diagnostic and treatment decisions (Brailer et al., 1996). Deploying informatics to develop and maintain databases and providing health care practitioners with such information as clinical practice guidelines when they need it at the point of care are recommended ways of assisting practitioners in acquiring new knowledge (Eisenberg, 2000).
Crossing the Quality Chasm (IOM, 2001a) also highlights the importance of using information technology to improve access to information and support clinical decision making. It calls attention to software that integrates information on individual patients with a computerized knowledge base to generate patient-specific assessments or recommendations, thereby helping clinicians or patients make clinical decisions. Decision supports for nurses are described less frequently; publications most often address the use of clinical pathways and automated support for medication administration. Other low-tech decision supports include using memory/ cognition aids, such as protocols and checklists, and providing access to clinical information at the point of care delivery. The use of clinical pathways can also provide support to nurses in integrating evidence-based knowledge.
Clinical pathways Clinical pathways are disease- or procedure-specific blueprints for clinical care specifying actions that need to be performed by nurses and other members of a patient’s health care team, and in what sequence. They frequently map the expected course of an illness or proce-
dure and provide prompts to clinicians that identify appropriate clinical interventions in response to individualized patient characteristics or clinical developments. Clinical pathways are often evidence-based and are typically multidisciplinary—specifying the responsibilities of nurses, physicians, and other members of the health care team. They sometimes are a component of or replace documentation in the chart and may be paper-based or automated. Most clinical pathways are locally developed—frequently within a hospital—serving both cost-containment and quality assurance purposes (Trowbridge and Weingarten, 2001a). There is evidence that they are increasingly being used to manage and standardize both nursing care processes and interdisciplinary care in hospitals (Anonymous, 2001; Bridgeman et al., 1997; Helfrich Jones et al., 1999; Schriefer and Botter, 2001).
The AHRQ evidence-based report Making Health Care Safer: A Critical Analysis of Patient Safety Practices cites conflicting evidence on the efficacy of clinical pathways in influencing provider behavior and patient safety (Trowbridge and Weingarten, 2001a). However, experts on mechanisms for promoting interdisciplinary collaboration point out that such care delivery protocols and care maps equate to the use of standard operating procedures that are useful in other high-risk environments. These prewritten documents assist team members in providing consistent quality care while ensuring that other team members know what is occurring with the patient. They also facilitate the assumption of care by team members if the lead person is unable to carry out his or her responsibilities (Ingersoll and Schmitt, 2003).
Computer-supported clinical decision support systems Clinical decision support systems (CDSSs) assist clinicians in applying new information to patient care through the analysis of patient-specific clinical variables. They vary in complexity, function, and application. Some but not all are computer-based. Crossing the Quality Chasm (IOM, 2001a) highlights the potential of automated CDSSs—software that integrates information on the characteristics of individual patients with a computerized knowledge base for the purpose of generating patient-specific assessments or recommendations designed to aid clinicians or patients in making clinical decisions. The AHRQ evidence-based report Making Health Care Safer: A Critical Analysis of Patient Safety Practices notes that the preponderance of evidence suggests that CDSSs are at least somewhat effective, especially with respect to the prevention of medical errors (Trowbridge and Weingarten, 2001b). CDSSs are widely implemented and evaluated with respect to physician practice, but less so in nursing.
Point-of-care decision support devices can be mobile, stationary, or hand-held. They allow nurses to gather patient information (e.g., on allergies, intake restrictions) automatically from patient records or from data
repositories that can be Internet-based or accessed from another source. Point-of-care decision support systems for medication administration are an example. These systems can support nurses in medication administration by providing information on drug actions, dosages, interactions, and side effects at the point of medication administration. When integrated with an automated medication administration record, they allow nurses to verify the five “rights” of medication administration—the right patient, medication, dose, route, and time (Ball et al., 2003).
An automated integrated clinical information system used by Our Lady of the Lake (OLOL) Regional Medical Center in Louisiana illustrates the potential of such advanced systems to provide decision support to nurses. This system provides online access to patient charts and the ability to capture vital signs at the point of care, as well as intake and output, weights, and alerts of medical orders. Rules for care are embedded in system components that capture nursing documentation, results of laboratory tests, and medication orders. The system is accessed through wireless laptop devices used by nurses for input of care documentation; it includes a clinical repository for access to the patient’s electronic medical record, and a pharmacy system with a reference database that enables checking for drug–drug interactions and adverse drug event rules. Additional rules built into the system identify patients at risk for falls, pressure ulcers, and other medical errors. When one of these rules is triggered, the system sends an alert from the clinical documentation that produces care protocols with simultaneous orders to all the departments involved in the response (e.g., nursing, physicians, dietary, supplies). During a 12-month study of the use of the system, falls decreased from 4.45. to 3.70 per 1000 inpatient days, and the risk of pressure sore development decreased from 9 to 1 percent. Two years after implementation, the medical center took advantage of planned system down time to measure the differences in documentation time with and without the system. This evaluation revealed time savings gained through use of the system; moreover, nurses complained about the loss of reminders for work organization when the system was available (Ball et al., 2003).
Given the career-long need for nursing staff to maintain competency through the acquisition of new knowledge and skills, and the essential role of HCOs in helping to meet this need, the committee makes the following recommendation:
Recommendation 5-5. HCOs should dedicate budgetary resources equal to a defined percentage of nursing payroll to support nursing staff in their ongoing acquisition and maintenance of knowledge and skills. These resources should be sufficient for and used to implement policies and practices that:
-
Assign experienced nursing staff to precept nurses newly practicing in a clinical area to address knowledge and skill gaps.
-
Annually ensure that each licensed nurse and nurse assistant has an individualized plan and resources for educational development within health care.
-
Provide education and training of staff as new technology or changes in the workplace are introduced.
-
Provide decision support technology identified with the active involvement of direct-care nursing staff to enable point-of-care learning.
-
Disseminate to individual staff organizational learning as captured in clinical tools, algorithms, and pathways.
Although the committee does not specify in recommendation 5.5 a particular percentage of nursing payroll that HCOs should dedicate to ongoing knowledge and skill acquisition by nursing staff, we call attention to ASTD data showing average training budgets across all industries of 1.9 percent of payroll and an average for HCOs of 1.4 percent. These numbers can serve as initial benchmarks for HCOs in assessing their own level of commitment to employee education and training. As HCOs begin to prospectively set aside a certain percentage of payroll for staff education and training, they are encouraged to report this information to organizations providing benchmarking services.
FOSTERING INTERDISCIPLINARY COLLABORATION
Because of the increasing acuity of their health care needs, individual patients are often attended to by an array of different health care providers with whom nursing staff must interact, including physicians, pharmacists, allied health providers, social workers, and unlicensed health care technicians. Sometime nurses interact with these providers as members of a formal interdisciplinary team of health care providers, such as in the OR or emergency department. In such cases, promoting more effective team functioning is a key strategy that HCOs should undertake to improve patient safety (IOM, 2000).
However, not all nurses function as part of a single team with fixed membership and defined roles. More often, nurses interact with an array of providers that changes from day to day and often is different for each patient in their care as shift and patient assignments change; attending physicians, resident physicians, and NAs change or rotate; and float nurses and temporary workers are brought in as short-term fixes for nursing shortages. Thus a nurse caring for four patients on a single shift is likely to be involved with four different groups of health care providers as residents, attending
physicians, specialty physicians, social workers, family members, and community agencies vary for each patient. And a float nurse may find himself or herself interacting with different configurations of providers on a daily basis. Hence, the paradigm of highly functioning teams may not be the best model for all nurse–provider interactions (Ingersoll and Schmitt, 2003; Thomas and Helmeich, 2002). Rather, interdisciplinary collaboration may be a more widely applicable model for effective nurse–provider interactions and strategies for achieving safe and effective health care.
As part of this study, the committee commissioned a review of published research on the effectiveness of team functioning and interdisciplinary collaboration in achieving patient safety and related outcomes. The evidence analyzed in this review (see Appendix B) generally supports the effectiveness of both teams and interdisciplinary collaboration in improving patient outcomes. Although findings concerning the relationship between the existence and performance of health care teams and patient outcomes are mixed, evidence suggests that the relationship is positive when measured carefully and with clear indication of team processes and interactions. Moreover, the concept of collaboration within and apart from prescribed teams appears to be an important dimension of what makes teams (and individuals, dyads, or small groups) successful.
Hallmarks of Effective Interdisciplinary Collaboration
Health services researchers note that interdisciplinary collaboration, like team care, has not yet been well conceptualized. Further, “Team care is not a single homogeneous treatment variable. Teams, as work groups, vary in the quality of their functioning … collaboration is not a dichotomous variable, simply present or absent, but present to varying degrees” (Schmitt, 2001:51). There is, however, agreement among health services researchers, as well as researchers in organizational and psychological sciences, that collaboration is multidimensional and typically characterized by necessary precursors and distinct behaviors.
Necessary Precursors to Collaboration
Individual clinical competence Clinical competence was first identified as an essential precursor for collaborative practice between nurses and physicians by a National Joint Practice Commission convened in 1981 (Baggs and Schmitt, 1988). Clinical competence as a component of effective interaction and coordination of medical and nursing staff has been associated with lower risk-adjusted length of stay (Shortell et al., 1994), lower nurse turnover, higher professionally evaluated technical quality of care (Mitchell et al., 1996; Shortell et al., 1994), and greater professionally evaluated abil-
ity to meet family member needs (Shortell et al., 1994). Findings from a study of nurse–physician collaboration in a medical ICU reinforce that nurses and physicians are more likely to collaborate with each other when they perceive the other as having the knowledge necessary for good clinical care (Baggs and Schmitt, 1997). The theme of respect for one another’s capabilities is present throughout almost all of the writings on interdisciplinary collaboration (Rice, 2000).
Mutual trust and respect Respect has been described as being manifested by politeness, manners, and being diplomatic and pleasant (Baggs and Schmitt, 1988, 1997; Rice, 2000). At the same time, personal respect and trust are intertwined with respect for and trust in clinical competence.
Characteristics of Collaboration
Collaboration is frequently described as the aggregation of several behaviors, including those described below.
Shared understanding of goals and roles Collaboration is enhanced by shared understanding of an agreed-upon collective goal (Gittell et al., 2000). Role confusion and role conflict are a frequent barrier to interdisciplinary collaboration (Rice, 2000).
Effective communication Multiple studies identify effective communication as a key feature of collaboration (Baggs and Schmitt, 1988; Knaus et al., 1986; Schmitt, 2001; Shortell et al., 1994). “Effective” communication is described variously as frequent, timely, understandable, accurate, and satisfying (Gittell et al., 2000; Shortell et al., 1994). It is characterized by discussion with contributions by all parties, active listening, openness, a willingness to consider other ideas and ask for opinions, questioning (Baggs and Schmitt, 1997; Shortell et al., 1994), and the free flow of information among participants who feel they are able to speak out. It is also characterized as nonhierarchical.
Shared decision making In shared decision making, problems and strategies are discussed openly (Baggs and Schmitt, 1997; Baggs et al., 1999; Rice, 2000; Schmitt, 2001). Moreover, consensus is often used to arrive at a decision.
Conflict management Disagreements over treatment approaches and philosophies, roles and responsibilities, and ethical questions are commonplace in health care settings. Positive ways of addressing these inevitable differ-
ences are identified as a key component of effective caregiver interactions (Shortell et al., 1994).
Inconsistent Collaboration Between Nursing Staff and Other Health Care Providers
While the literature on interdisciplinary teams has focused on a broad array of disciplines involved in health care delivery, the literature concerning collaboration has focused primarily on nurse–physician interactions (Ingersoll and Schmitt, 2003). The limited existing evidence indicates that most nurses experience positive relationships with their physician colleagues. However, the extent to which a “positive relationship” is indicative of collaboration is unknown. There are also indications that positive relationships with physicians are not experienced by all nurses.
There are numerous anecdotal and historical reports of poor nurse–physician relationships, including reports of generally poor communication (Greenfield, 1999; Schmitt, 2001), hierarchical communication patterns (Disch et al., 2001), unilateral decision making by physicians (Schmitt, 2001), and verbal abuse of nurses by physicians (Manderino and Berkey, 1997; Rosenstein, 2002). These problems are sometimes attributed to differences in power, sex, class, economics, and education (McMahan and Hoffman, 1994). However, interpretation of these reports is impeded by the absence of any representative survey of practicing nurses across health care delivery settings regarding the levels of collaboration they experience with physicians and other health care providers. Studies that have attempted to measure nurse–physician interactions are often convenience samples without controls for sampling bias. Further, surveys that have attempted to measure the incidence of verbal abuse of nurses have not used physicians as the unit of analysis, so it is not known whether abusive behavior characterizes a small minority of physicians or is more widely practiced.
In two representative samples of nurses, large majorities reported “good” working relationships with physicians. In 2002–2003, a random sample survey of nurses licensed to work in Illinois and North Carolina13 was conducted as part of a longitudinal study of nurses’ worklife and health funded by the National Institute for Occupational Safety and Health (NIOSH) of the U.S. Centers for Disease Control and Prevention (CDC). Of the 674 RN respondents to this survey who were currently employed as full-time hospital or nursing home general-duty staff, 82.4 percent agreed or agreed strongly with the statement, “In my job, doctors and nurses have
good working relationships.”14 Likewise, in a survey of 50 percent of RNs living in Pennsylvania, 83.4 percent of nurses working in hospitals reported that “physicians and nurses have good working relationships” (Aiken et al., 2001). Positive and collaborative relationships between nurses and physicians are also characteristically found in magnet hospitals (Kramer and Schmalenberg, 2002).
The use of agency staff, high turnover rates among nursing staff (Disch et al., 2001), and short rotation periods for medical residents (Baggs and Schmitt, 1997) also threaten collaborative relationships. Building collaborative relationships takes time, and these phenomena have been cited as making it difficult to form the sustained relationships that are essential for the development of trust and a precursor to collaboration.
Heavy workloads are also cited as interfering with the formation of collaborative relationships. When staff are overwhelmed with caregiving responsibilities, they may not take the time to collaborate. Yet while unilateral decision making is easier in the short run, collaborative relationships are viewed as saving time in the long run (Baggs and Schmitt, 1997; Disch et al., 2001).
Building and Nurturing Collaboration
There is some evidence that collaboration can be facilitated by supportive organizational structures and processes including the following:
-
Leadership modeling of collaborative behaviors—This approach can help other medical staff improve their relationships with nursing staff (Disch et al., 2001).
-
Commitment of resources to build nurse expertise—The strong evidence cited above that individual clinical competency is an essential precursor to collaborative practice is further reinforcement for recommendation 5.5 regarding the actions HCOs should take to support nursing staff in their ongoing acquisition and maintenance of knowledge and skills.
-
Design of work and workspace to facilitate collaboration—Collaboration is facilitated by providing workspaces that encourage physical proximity among those performing the work and by ensuring that staff have the time to participate in collaborative activities, such as conducting interdisciplinary patient rounds (Baggs and Schmitt, 1997). Hospital unit design and staffing approaches should reflect attention to whether they will promote or discourage interdisciplinary collaboration. This observation further sup-
-
ports the staffing recommendations made earlier in this chapter. A discussion of workspace design is presented in Chapter 6.
-
Interdisciplinary practice mechanisms—There is some evidence that using structured interdisciplinary forums, such as interdisciplinary rounds, can be effective in improving patient care (Curley et al., 1998). Regularly scheduled interdisciplinary meetings also can be held at the patient care unit level. During these meetings, nursing, medical, pharmacy, and other clinical providers can work together to address issues pertaining to the running of the unit and patient care. Small work groups can be formed to address specific concerns and report back to the larger group (Disch et al., 2001). Interdisciplinary practice can also be facilitated by patient record and documentation practices that promote interdisciplinary information sharing, such as the use of interdisciplinary clinical pathways (Lange et al., 1998).
-
Training—Training and development may be needed in collaborative practice behaviors, such as effective communication and conflict resolution (Disch et al., 2001).
-
Human resource policies—Human resource policies that identify verbal abuse and other hostile behaviors as unacceptable, along with procedures for addressing such behaviors, may be helpful (Manderino and Berkey, 1997). Some have suggested identifying interpersonal components of organizational practice expectations for clinicians. Such components might include, for example, expectations that all health care providers involved in clinical services within the organization cooperate and communicate with other providers while displaying regard for their dignity; refrain from foul language, shouting, and rudeness; and use conflict management skills in handling disagreements (Pfifferling, 1999). Performance evaluation also can include measures of the extent to which health care providers are viewed as collaborators by those in other disciplines.
HCOs can act on this information to build and nurture collaboration across health care providers. Many strategies to this end have already been addressed in the committee’s recommendations pertaining to evidence-based management, staffing, and the acquisition of new knowledge and skills by nursing staff. In addition, the committee makes the following recommendation:
Recommendation 5-6. HCOs should take action to support interdisciplinary collaboration by adopting such interdisciplinary practice mechanisms as interdisciplinary rounds, and by providing ongoing formal education and training in interdisciplinary collaboration for all health care providers on a regularly scheduled, continuous basis (e.g., monthly, quarterly, or semiannually).
REFERENCES
AACN (American Association of Colleges of Nursing). 2002. Hallmarks of the Professional Nursing Practice Environment. Washington, DC: AACN.
Aaronson W, Zinn J, Rosko M. 1994. Do for-profit and not-for-profit nursing homes behave differently? Gerontologist 34(6):775–786.
Aiken L, Sloane D, Lake E, Sochalski J, Weber A. 1999. Organization and outcomes of inpatient AIDS care. Medical Care 37(8):760–772.
Aiken L, Clarke S, Sloane D, Sochalski J, Busse R, Clarke H, Giovannetti P, Hunt J, Rafferty A, Shamian J. 2001. Nurses’ reports on hospital care in five countries. Health Affairs 20(3):43–53.
Aiken L, Clarke S, Sloane D, Sochalski J, Silber J. 2002. Hospital nurse staffing and patient mortality, nurse burnout, and job dissatisfaction. Journal of the American Medical Association 288:1987–1993.
Amaravadi R, Dimick J, Pronovost P, Lipsett P. 2000. ICU nurse-to-patient ratio is associated with complications and resource use after esophagectomy. Intensive Care Medicine 26:1857–1862.
American Association of Critical Care Nurses. 1999. Medina J, ed. Staffing Blueprint: Constructing Your Staffing Solutions. AlisoViejo, CA: AACCN.
ANA (American Nurses Association). 1999. Principles for Nurse Staffing. Washington, DC: American Nurses Publishing.
ANA. 2000. Nurse Staffing and Patient Outcomes in the Inpatient Hospital Setting. Washington, DC: American Nurses Publishing.
ANA. 2002. State Legislative Trends and Analysis. Washington, DC: ANA.
Anonymous. 2001. Clinical pathways: A special report. Hospital Case Management 9(4):49–63.
Baggs J, Schmitt M. 1988. Collaboration between nurses and physicians. IMAGE: Journal of Nursing Scholarship 20(3):145–149.
Baggs J, Schmitt M. 1997. Nurses’ and resident physicians’ perceptions of the process of collaboration in an MICU. Research in Nursing & Health 20(1):71–80.
Baggs J, Schmitt M, Mushlin A, Mitchell P, Eldredge D, Oakes D, Hutson A. 1999. Association between nurse–physician collaboration and patient outcomes in three intensive care units. Critical Care Medicine 27(9):1991–1998.
Ball M, Weaver C, Abbott P. 2003. Enabling technologies promise to revitalize the role of nursing in an era of patient safety. International Journal of Medical Informatics 69:29–38 .
Barry-Walker J, Bulechek G, McCloskey J. 1994. A description of medical–surgical nursing. MEDSURG Nursing 3(4):261–268.
Bayiz M. 2003. The Anderson School of Management, UCLA. Work and Workload Measurement in Nurse Staffing. Paper commissioned by the Institute of Medicine Committee on the Work Environment for Nurses and Patient Safety.
Benner P. 1984. From Novice to Expert: Excellence and Power in Clinical Nursing Practice. Menlo Park, CA: Addison-Wesley Publishing Company.
Berens M. 2000 (September 11). Training often takes a back seat; budget pressures, lack of state laws aggravate trend. Chicago Tribune. News. p. 7.
Blegen M, Vaughn T. 1998. A multisite study of nurse staffing and patient occurrences. Nursing Economics 16(4):196–203.
Blegen M, Goode C, Reed L. 1998. Nurse staffing and patient outcomes. Nursing Research 47(1):43–50.
Bliesmer M, Smayling M, Kane R, Shannon I. 1998. The relationship between nursing staffing levels and nursing home outcomes. Journal of Aging and Health 10(3):351–371.
Bolton L, American Academy of Nursing. 2002. Statement to the Committee on the Work Environment for Nurses and Patient Safety. Testimony presented on September 24, 2002, at IOM committee meeting in Washington, DC.
Bolton L, Jones D, Aydin C, Donaldson N, Brown D, Lowe M, McFarland P, Harms D. 2001. A response to California’s mandated nursing ratios. Journal of Nursing Scholarship 33:179–184.
Bond C, Raehl C, Pitterle M, Franke T. 1999. Health care professional staffing, hospital characteristics, and hospital mortality rates. Pharmacotherapy 19:130–138.
Bowers B, Becker M. 1992. Nurse’s aides in nursing homes: The relationship between organization and quality. The Gerontologist 32(3):360–366.
Brailer D, Goldfarb S, Horgan M, Katz F, Paulus R, Zakrewski K. 1996. Improving performance with clinical decision support. Joint Commission Journal on Quality Improvement 22(7):443–456.
Braun B. 1991. The effect of nursing home quality on patient outcome. Journal of the American Geriatrics Society 39(4):329–338.
Brennan T, Leape L, Laird NHL, Loaclio R, Lawthers A, Newhouse J, Weiler P, Hiatt H. 1991. Incidence of adverse events and negligence in hospitalized patients: Results of the Harvard Medical Practice Study. The New England Journal of Medicine 324:370–376.
Bridgeman T, Flores M, Rosenbluth J, Pierog J. 1997. One emergency department’s experience: Clinical algorithms and documentation. Journal of Emergency Nursing 23(4):316–325.
Brook R, McGlynn E, Cleary P. 1996. Quality of health care part 2: Measuring quality of care. The New England Journal of Medicine 335(13):966–970.
Brown D. 2002 (December 13). Hospitals Will Be Rated on Their Performance. The Washington Post. p. A1, A32–A33.
Buchanan J, Bell R, Arnold S, Witsberger C, Kane R, Garrard J. 1990. Assessing cost effects of nursing-home-based geriatric nurse practitioners. Health Care Financing Review 11(3):67–78.
Budreau G, Balakrishnan R, Titler M, Hafner M. 1999. Caregiver–patient ratio: Capturing census and staffing variability. Nursing Economics 17(6):317–324.
Burgio L, Burgio K. 1990. Institutional staff training and management: A review of the literature and a model for geriatric, long-term-care facilities. International Journal of Aging and Human Development 30(4):287–302.
Carnino A, Director, Division of Nuclear Installation Safety, International Atomic Energy Agency. Undated. Management of Safety, Safety Culture and Self Assessment. [Online]. Available: http://www.iaea.org/ns/nusafe/publish/papers/mng_safe.htm [accessed January 15, 2003].
Cavouras C, Suby C. 2003. 2003 Survey of Hours Report: Direct and Total Hours per Patient Day (HPPD) by Patient Care Units. Phoenix, AZ: Labor Management Institute.
Cherry R. 1991. Agents of nursing home quality of care: Ombudsmen and staff ratios revisited. The Gerontologist 21(2):302–308.
Cho S, Ketefian S, Barkauskas V, Smith D. 2003. The effects of nurse staffing on adverse events, morbidity, mortality, and medical costs. Nursing Research 52(2):71–79.
CMS (Centers for Medicare and Medicaid Services). 2000. Report to Congress: Appropriateness of Minimum Nurse Staffing Ratios in Nursing Homes—Phase I Report. [Online]. Available: www.cms.gov/medicaid [accessed April 22, 2002].
CMS. 2001. Report to Congress: Appropriateness of Minimum Nurse Staffing Ratios in Nursing Homes—Phase II Final Report. [Online]. Available: www.cms.gov/medicaid/reports/rp1201home.asp [accessed June 25, 2002]. Site stated, “last modified on Wednesday June 12, 2002.”
CMS. 2003a. Nursing Home Compare. [Online]. Available: http://www.medicare.gov/NHCompare/Home.asp [accessed on June 7, 2003].
CMS. 2003b. Hospital CAHPS: CMS Pilot Test Questionnaire. January 15, 2003, draft.
Cohen J, Spector W. 1996. The effect of Medicaid reimbursement on quality of care in nursing homes. Journal of Health Economics 15:23–28.
Consumers Union. 2003a. Hospitals: Your right to know. Consumer Reports 68(1):6.
Consumers Union. 2003b. How safe is your hospital? Consumer Reports 68(1):12–18.
Corrigan J. 1995. How do purchasers develop and use performance measures? Medical Care 33:JS18–JS24.
Curley C, McEachern JE, Speroff T. 1998. A firm trial of interdisciplinary rounds on the inpatient medical wards: An intervention designed using continuous quality improvement. Medical Care 36(8 Supplement):AS4–AS12.
Dang D, Johantgen M, Pronovost P, Jenckes M, Bass E. 2002. Postoperative complications: Does intensive care unit staff nursing make a difference? Heart & Lung: Journal of Acute & Critical Care 31(3):219–228.
DeGroot H. 1994. Patient Classification Systems: Part 1, Problems and Promise. Journal of Nursing Administration 24(9):43–51.
Dimick J, Swoboda S, Pronovost P, Lipsett P. 2001. Effect of nurse-to-patient ratio in the intensive care unit on pulmonary complications and resource use after hepatectomy. American Journal of Critical Care 10:376–382.
Disch J, Beilmann G, Ingbar D. 2001. Medical directors as partners in creating healthy work environments. AACN Clinical Issues 12(3):366–377.
Donabedian A. 1980. The Definitions of Quality and Approaches to Its Assessment. Volume 1: Explorations in Quality Assessment and Monitoring. Ann Arbor, MI: Health Administration Press.
Donaldson N, Rutledge D. 1998. Expediting the harvest and transfer of knowledge for practice in nursing: Catalyst for a journal. The Online Journal of Clinical Innovations 1(2):1–25.
Donaldson N, Brown D, Aydin C, Bolton L. 2001. Nurse staffing in California hospitals 1998–2000: Findings from the California Nursing Outcomes Coalition Database Project. Policy, Politics, & Nursing Practice 2(1):19–28.
Dreyfus H, Dreyfus S. 1986. Mind Over Machine. New York, NY: The Free Press, a Division of Macmillan, Inc.
Eisenberg J. 2000. Continuing education meets the learning organization: The challenge of a systems approach to patient safety. The Journal of Continuing Education in the Health Professions 20:197–207.
Flood S, Diers D. 1988. Nurse staffing, patient outcome and cost. Nursing Management 19:34–35, 38–39, 42–43.
Fridkin S, Pear S, Williamson T, Galgiani J, Jarvis W. 1996. The role of understaffing in central venous catheter–associated bloodstream infections. Infection Control Hospital Epidemiology 17:150–158.
Garvin D. 1993. Building a learning organization. Harvard Business Review July–August:78–91.
Gittell J, Fairfield K, Bierbaum B, Head W, Jackson R, Kelly M, Laskin R, Lipson S, Siliski J, Thornhill T, Zuckerman J. 2000. Impact of relational coordination on quality of care, postoperative pain and functioning, and length of stay. Medical Care 38(8):807–819.
Goldstein E, Fyock J. 2001. Reporting of CAHPS® Quality Information to Medicare Beneficiaries. Health Services Research 36(3):478–488.
Greenfield L. 1999. Doctors and nurses: A troubled partnership. Annals of Surgery 230(3):279–288.
Gustafson D, Sainfort F, Van Konigsveld R, Zimmerman D. 1990. The Quality Assessment Index (QAI) for Measuring Nursing Home Quality. Health Services Research 25(1):97–127.
Harrington C. 2001. Nursing Home Staffing Standards in State Statutes and Regulations. Washington, DC: National Citizens Coalition for Nursing Home Reform.
Harrington C, Zimmerman D, Karon SL, Robinson J, Beutel P. 2000. Nursing home staffing and its relationship to deficiencies. Journal of Gerontology: Social Sciences 55B (5):S278–S287.
Harrington C, Woolhandler S, Mullan J, Carrillo H, Himmelstein D. 2001. Does investorownership of nursing homes compromise the quality of care. American Journal of Public Health 91(9):1452–1455.
Harrington C, Carrillo H, Wellin V, Shemirani B. 2002. Nursing Facilities, Staffing, Residents, and Facility Deficiencies, 1995-2001. San Francisco, CA: University of California. [Online]. Available: http://www.nccnhr.org/public/50_155_3801.cfm [accessed June 1, 2003].
Harrington C, Collier E, O’Meara J, Kitchener M, Simon L, Schnelle J. 2003. Federal and state nursing facility websites: Just what the consumer needs? American Journal of Medical Quality 18(1):21–37.
Hartz A, Kranauer H, Kuhn E, Young H, Jacobsen S, Gay G, Muenz L, Katzoff M, Bailey R, Rimm A. 1989. Hospital characteristics and mortality rates. The New England Journal of Medicine 321(25):1720–1725.
Helfrich Jones M, Day S, Creeley J, Woodland M, Gerdes J. 1999. Implementation of a clinical pathway system in maternal newborn care. Journal of Perinatal and Neonatal Nursing 13(3):1–20.
Helmreich R. 2000. On error management: Lessons from aviation. British Medical Journal 320:781–785.
Hershey J, Pierskalla W, Wandel S. 1980. Nurse staffing management. In: Boldy D, ed. Operational Research Applied to Health Services. London: Ctroom-Helm Ltd. Pp. 189–220.
Hibbard J, Harris-Kojetin L, Mullin P, Lubalin J, Garfinkel S. 2000. Increasing the impact of health plan report cards by addressing consumers’ concerns. Health Affairs 19(5):138–143.
Hibbard J, Slovic P, Peters E, Finucane M. 2002. Strategies for reporting health plan performance information to consumers: Evidence from controlled studies. Health Services Research 37(2):291–313.
Hlusko D, Nichols B. 1996. Can you depend on your patient classification system? Journal of Nursing Administration 26(4):39–44.
Hunt J, Hagen S. 1998. Nurse to patient ratios and patient outcomes. Nursing Times 94:63–66.
Hurley M. 2000. Workload, UAPs, and you. RN 63(12):47–49.
Ingersoll G, Schmitt M, University of Rochester Medical Center. 2003. Work Groups and Patient Safety. Paper commissioned by the Institute of Medicine Committee on the Work Environment for Nurses and Patient Safety.
IOM (Institute of Medicine). 1996. Wunderlich G, Sloan F, Davis C, eds. Nursing Staff in Hospitals and Nursing Homes: Is It Adequate? Washington, DC: National Academy Press.
IOM. 2000. To Err Is Human: Building a Safer Health System. Washington, DC: National Academy Press.
IOM. 2001a. Crossing the Quality Chasm: A New Health System for the 21st Century. Washington, DC: National Academy Press.
IOM. 2001b. Improving the Quality of Long-Term Care. Wunderlich G, Kohler P, eds. Washington, DC: National Academy Press.
IOM. 2003. Greiner A, Knebel E, eds. Health Professions Education: A Bridge to Quality. Washington, DC: The National Academies Press.
Jacobson A, Seltzer J, Dam E. 1999. New methodology for analyzing fluctuating unit activity. Nursing Economics 17(1):55–59.
JCAHO (Joint Commission on Accreditation of Healthcare Organizations). 2001. Statement on Direct Care Staffing Shortages. Statement before the Senate Committee on Health, Education, Labor and Pensions on May 17, 2001, at a hearing on Addressing Direct Care Staffing Shortages.
JCAHO. 2002. Health Care at the Crossroads: Strategies for Addressing the Evolving Nursing Crisis. JCAHO.
JCAHO. 2003. 2003 Hospital Accreditation Standards. Oakbrook Terrace, IL: Joint Commission Resources.
Jennings B, Rea R, Antopol B, Carty J. 1989. Selecting, implementing, and evaluating patient classification systems: A measure of productivity. Nursing Administration Quarterly 14(1):24–35.
Kane R, Kane R, Arnold S, Garrard J, McDermott S, Kepferle L. 1988. Geriatric nurse practitioners as nursing home employees: Implementing the role. The Gerontologist 28(4):469–477.
Kayser-Jones J. 1996. Mealtime in nursing homes: The importance of individualized care. Journal of Gerontological Nursing 22(3):26–31.
Kayser-Jones J. 1997. Inadequate staffing at mealtime: Implications for nursing and health policy. Journal of Gerontological Nursing 23(8):14–21.
Kayser-Jones J, Schell E. 1997. The effect of staffing on the quality of care at mealtime. Nursing Outlook 45(2):64–72.
Kayser-Jones J, Wiener C, Barbaccia J. 1989. Factors contributing to the hospitalization of nursing home residents. The Gerontologist 290:1502–1510.
Kayser-Jones J, Schell E, Porter C, Barbaccia J, Shaw H. 1999. Factors contributing to dehydration in nursing homes: Inadequate staffing and lack of professional supervision. Journal of the American Geriatrics Society 47(10):1187–1194.
Knaus W, Draper E, Wagner D, Zimmerman J. 1986. An evaluation of outcome from intensive care in major medical centers. Annals of Internal Medicine 104(3):410–418.
Kovner C, Gergen P. 1998. Nurse staffing levels and adverse events following surgery in U.S. hospitals. Image: The Journal of Nursing Scholarship 30(4):315–321.
Kovner C, Jones C, Gergen P. 2000. Nurse staffing in acute care hospitals, 1990–1996. Policy, Politics, & Nursing Practice 1(3):194–204.
Kovner C, Jones C, Zhan C, Gergen P, Basu J. 2002. Nurse staffing and postsurgical adverse events: An analysis of administrative data from a sample of U.S. hospitals, 1990–1996. Health Services Research 37(3):611–629.
Kramer M, Schmalenberg C. 2002. Staff nurses identify essentials of magnetism. In: McClure M, Hinshaw A, eds. Magnet Hospitals Revisited: Attraction and Retention of Professional Nurses. Washington, DC: American Nurses Publishing. Pp. 25–59.
Lange L, Mengwasser M, Kretzinger C, Michaelis L. 1998. Preparing for automation: Integrating standards of care and documentation in surgical services. Surgical Services Management 4(11):36–38, 40–41.
Lawrenz E. 1992. Are patient classification systems still the best way to measure workload? Perspectives on Staffing and Scheduling XI(5):1–4.
Lazear D. 1991. Seven Ways of Knowing: Teaching to Multiple Intelligences. Palatine, IL: Skylight Publishing.
Lichtig L, Knauf R, Milholland D. 1999. Some impacts of nursing on acute care hospital outcomes. Journal of Nursing Administration 29:25–33.
Linn M, Gurel L, Linn B. 1977. Patient outcome as a measure of quality of nursing home care. American Journal of Public Health 67:337–344.
Luft H, Garnick D, Mark D, Peltzman D, Phibbs C, Lichtenberg E, McPhee S. 1990. Does quality influence choice of hospital? Journal of the American Medical Association 263(21):2899–2906.
Malloch K, Conovaloff A. 1999. Patient classification systems, Part 1. The third generation. Journal of Nursing Administration 29(7-8):49–56.
Manderino M, Berkey N. 1997. Verbal abuse of staff nurses by physicians. Journal of Professional Nursing 13(1):48–55.
Massachusetts Nurses Association. 2003. MNA Files Quality Patient Care/Safe RN Staffing Bill to Regulate RN-Patient Ratios in Massachusetts Hospitals. [Online]. Available: http://www.massnurses.org/news/safestaff/200212BillFiled.htm [accessed June 2, 2003].
McClure M, Hinshaw A, eds. 2002. Magnet Hospitals Revisted: Attraction and Retention of Professional Nurses. Washington, DC: American Nurses Publishing.
McMahan E, Hoffman K. 1994. Physician–nurse relationships in clinical settings: A review and critique of the literature, 1966–1992. Medical Care Review 51(1):83–112.
Mezey M, Lynaugh J. 1989. The teaching nursing home program: Outcomes of care. Nursing Clinics of North America 24(3):769–780.
Mitchell P, Shortell S. 1997. Adverse outcomes and variations in organization of care delivery. Medical Care 35(Supplement 11):NS19–NS32.
Mitchell P, Shannon S, Cain K, Hegyvary S. 1996. Critical care outcomes: Linking structures, processes, and organizational and clinical outcomes. American Journal of Critical Care 5(5):353–363.
Mukamel D, Mushlin A. 1998. Quality of care information makes a difference: An analysis of market share and price changes after publication of the New York State Cardiac Surgery Mortality Reports. Medical Care 36:945–954.
NACNEP (National Advisory Council on Nurse Education and Practice). Report to the Secretary of the U.S. Department of Health and Human Services. 1996. Report on the Basic Registered Nurse Workforce. Washington, DC: U.S. Government Printing Office.
National Citizens Coalition for Nursing Home Reform. 1998. NCCNHR Minimum Staffing Standards. [Online]. Available: www.nchnccnhr.org/govpolicy/51_162_472.cfm [accessed January 25, 2003].
National Council of State Boards of Nursing. 2001. Profiles of Member Boards—2000. Chicago, IL: National Council of State Boards of Nursing, Inc.
Needleman J, Buerhaus P, Mattke S, Stewart M, Zelevinsky K. 2001. Nurse Staffing and Patient Outcomes in Hospitals. Final Report for Health Resources Services Administration 1–457.
Needleman J, Buerhaus P, Mattke S, Stewart M, Zelevinsky K. 2002. Nurse-staffing levels and the quality of care in hospitals. The New England Journal of Medicine 346(22):1715–1722.
Norrish B, Rundall T. 2001. Hospital restructuring and the work of registered nurses. Milbank Quarterly 79(1):55.
Nyman J. 1988. Improving the quality of nursing home outcomes: Are adequacy- or incentive-oriented policies more effective. Medical Care 12:1158–1171.
O’Brien-Pallas L, Cockerill R, Leatt P. 1992. Different systems, different costs? An examination of the comparability of workload measurement systems. Journal of Nursing Administration 22(12):17–22.
Office of the Governor. 2002. Governor Davis Moves to Improve Nursing Care: California Department of Health Services. Press release dated September 29, 2002. [Online]. Available: http://www.governor.ca.gov/state/govsite/gov [accessed August 27, 2003].
Pfifferling J. 1999. The disruptive physician: A quality of professional life factor. The Physician Executive 25(2):56–61.
Pronovost P, Dang D, Dorman T, Lipsett P, Garrett E, Jenckes M, Bass E. 2001. Intensive care unit nurse staffing and the risk for complications after abdominal aortic surgery. Effective Clinical Practice 4(5):199–206.
Quinn J. 1992. Intelligent Enterprise: A Knowledge and Service Based Paradigm for Industry. New York, NY: The Free Press, a division of Macmillan, Inc.
Rauen C. 2001. Using simulation to teach critical thinking skills: You can’t just throw the book at them. Critical Care Nursing Clinics of North America 13(1):93–103.
Reed L, Blegen M, Goode C. 1998. Adverse patient occurrences as a measure of nursing care quality. Journal of Nursing Administration 28(5):62–69.
Rice A. 2000. Interdisciplinary collaboration in health care: Education, practice, and research. National Academies of Practice Forum: Issues in Interdisciplinary Care 2(1):59–73.
Roberts K. 1990. Managing high reliability organizations. California Managment Review 32:101–113.
Roberts K, Bea R. 2001. Must accidents happen? Lessons from high-reliability organizations. Academy of Management Executive 15(3):70–78.
Rosenstein A. 2002. Nurse–physician relationships: Impact on nurse satisfaction and retention. American Journal of Nursing 102(6):26–34.
Rousseau D, Libuser C. 1997. Contingent workers in high risk organizations. California Management Review 39(2):103–123.
Rozich J, Resar R. 2002. Using a unit assessment tool to optimize patient flow and staffing in a community hospital. Journal on Quality Improvement 28(1):31–41.
Schmitt M. 2001. Collaboration improves the quality of care: Methodological challenges and evidence from U.S. health care research. Journal of Interprofessional Care 15(1):47–66.
Schnelle J, Simmons S, Harrington C, Cadogan M, Garcia E, Bates-Jensen B. 2002. University of California Los Angeles Borun Center for Gerontological Research and the Los Angeles Jewish Home for the Aging. Nursing Home Staffing Information: Does It Reflect Differences in Quality of Care? Los Angeles, CA: California HealthCare Foundation.
Schriefer J, Botter M. 2001. Tools and systems for improved outcomes. Outcomes Management for Nursing Practice 5(3).
Seago J. 2001. Nurse staffing, models of care delivery, and interventions. In: Shojania K, Duncan B, McDonald K, Wachter R, eds. Making Health Care Safer: A Critical Analysis of Patient Safety Practices. Evidence Report/Technology Assessment No. 43. Rockville, MD: AHRQ.
Seago J. 2002. The California experiment: Alternatives for minimum nurse-to-patient ratios. Journal of Nursing Administration 32(1):48–58.
Seago J, Spetz J, Coffman J, Rosenoff E, O’Neil E. 2003. Minimum staffing ratios: The California Workforce Initiative Survey. Nursing Economics 21(2):65–70.
SEIU (Service Employees International Union). 2001. The Shortage of Care: A Study by the SEIU Nurse Alliance. Washington, DC: SEIO, AFL-CIO, CLC.
Shortell S, Zimmerman J, Rousseau D, Gillies R, Wagner D, Draper E, Knaus W, Duffy J. 1994. The performance of intensive care units: Does good management make a difference? Medical Care 32(5):508–525.
Silber J, Williams S, Krakauer H, Schwartz S. 1992. Hospital and patient characteristics associated with death after surgery: A study of adverse occurrence and failure to rescue. Medical Care 30(7):615–627.
Simon L, Monroe A. 2001. California provider group report cards: What do they tell us? American Journal of Medical Quality 16(2):61–70.
Smith J, Crawford L. 2002a. Report of Findings from the 2001 Employers Survey. NCSBN Research Brief. 3. Chicago, IL: National Council of State Boards of Nursing, Inc.
Smith J, Crawford L. 2002b. Report of Findings from the Practice and Professional Issues Survey—Spring 2001. NCSBN Research Brief. 2. Chicago, IL: National Council of State Boards of Nursing, Inc.
Smith J, Crawford L. 2003. Report of Findings from the 2002 RN Practice Analysis. NCSBN Research Brief. 9. Chicago, IL: National Council of State Boards of Nursing, Inc.
Sochalski J. 2001. Quality of care, nurse staffing, and patient outcomes. Policy, Politics, & Nursing Practice 2(1):9–18.
Sovie M, Jawad A. 2001. Hospital restructuring and its impact on outcomes. Journal of Nursing Administration 31(12):588–600.
Spector W, Takada H. 1991. Characteristics of nursing facilities that affect resident outcomes. Journal of Aging and Health 3(4):427–454.
Spetz J, Seago J, Coffman J, Rosenoff E, O-Neil E, California Workforce Initiative. 2000. Minimum Nurse Staffing Ratios in California Acute Care Hospitals. Oakland, CA: California HealthCare Foundation.
Spratley E, Johnson A, Sochalski J, Fritz M, Spencer W. 2000. The Registered Nurse Population: Findings from the National Sample Survey of Registered Nurses. DHHS, HRSA. [Online]. Available: http://bhpr.hrsa.gov/healthworkforce/reports/rnsurvey/rnss1.htmm [accessed October 4, 2003].
Thomas E, Studdert D, Burstin H, Orav E, Zeena T, Willimas E, Howard K, Weiler P, Brennan T. 2000. Incidence and types of adverse events and negligent care in Utah and Colorado. Medical Care 38:261–271.
Thomas E, Helmeich R. 2002. Will airline safety models work in medicine? In: Rosenthal M, Sutcliffe K, eds. Medical Error: What Do We Know? What Do We Do? San Francisco, CA: Jossey-Bass.
Thompson C, Koon E, Woodwell W, Beauvais J. 2002. Training for the Next Economy: An ASTD State of the Industry Report on Trends in Employer-Provided Training in the United States . Alexandria, VA: American Society of Training and Development.
Trowbridge R, Weingarten S. 2001a. Clinical pathways. In: Shojania K, Duncan B, McDonald K, Wachter R, eds. Making Health Care Safer: A Critical Analysis of Patient Safety Practices. Evidence Report/Technology Assessment Number 43. AHRQ Publication No. 01-E058. Rockville, MD: AHRQ.
Trowbridge R, Weingarten S. 2001b. Clinical decision support systems. In: Shojania K, Duncan B, McDonald K, Wachter R, eds. Making Health Care Safer: A Critical Analysis of Patient Safety Practices. Evidence Report/Technology Assessment Number 43. AHRQ Publication No. 01-E058. Rockville, MD: AHRQ.
Unruh L. 2002. Nursing staff reductions in Pennsylvania hospitals: Exploring the discrepancy between perceptions and data. Medical Care Research and Review 59(2):197–214.
Upenieks V. 1998. Work sampling: Assessing nursing efficiency. Nursing Management 29(4): 27–29.
Walston S, Kimberly J. 1997. Reengineering hospitals: Evidence from the field. Hospital and Health Services Administration 42(2):143-163.
Wells J, Kochan T, Smith M. 1991. Managing Workforce Safety and Health: The Case of Contract Labor in the U.S. Petrochemical Industry. Beaumont, TX: John Gray Institute.
Zimmerman D, Karon S, Arling G. l995. Development and testing of nursing home quality indicators. Health Care Financing Review 16(4):107–127.


