
3
Patterns of Firearm-Related Violence
In any given year, firearms accounted for over half of all known suicides, two-thirds of all reported homicides,1 and less than 1 percent of known accidental fatalities. But firearms do not always cause injury and death. In fact, the vast majority of firearms uses do not result in personal injury and are highly valued by many citizens. Any effort to assess the overall costs and benefits of firearms needs to address the prevalence of the different circumstances in which firearms are used and not just focus on those uses that result in death or injury.
This chapter begins by placing firearm deaths in the United States in the context of how they compare with other countries and how firearm-related deaths in the United States compare to other causes of death. We then turn to data on the availability and ownership of firearms in the United States. Subsequent sections present some basic facts about firearms involvement in violent crime, self-harm and suicide, and unintentional injury in the United States.2 Because homicides and suicides are not randomly distributed in the population, we describe the variations in these behaviors by gender and race. These variations further demonstrate the need for refined studies and explanations of the role of firearms in violence.
|
1 |
We use the term homicide for the phrase criminal homicide. Criminal homicide is defined as the willful killing of one human being by another and the killing of another person through gross negligence (excluding traffic fatalities). |
|
2 |
In Chapter 2 we discussed the strength and weaknesses of some of the data systems we use to describe the patterns of firearm violence. For now we attempt to carefully use the data and to not overinterpret them, without reconsidering the strengths and weaknesses of the data. |
HOMICIDE RATES BY COUNTRY
Using international crime data the committee has attempted to compare per capita homicide rates and rates of firearm homicides in the United States with those in other countries. While we recognize that the measurement of these events is not entirely consistent, these data do provide rough but useful comparisons.
International Comparisons
Table 3-1 displays the data on homicides, firearm-related homicides, and firearm availability for 36 countries. Krug et al. (1998) collected these data by surveying ministries of health or national statistical centers in each of these countries. Review of these data indicate that while the United States does not have the highest rate of homicide or firearm-related homicide, it does have the highest rates for these among industrialized democracies. Homicide rates in the United States are two to four times higher than they are in countries that are economically and politically similar to it. Higher rates are found in developing countries and those with political instability. The same is true for firearm-related homicides, but the differences are even greater. The firearm-related homicide rate in the United States is more like that of Argentina, Mexico, and Northern Ireland than England or Canada. While certainly not the highest homicide or firearm-related homicide rate in the world, these rates in the United States are in the upper quartile in each case.
Some researchers have used data like those summarized above to assess the relationship between firearm-related homicides and firearms availability. For the most part this research focuses on industrialized nations and uses various proxies for the measure of firearms availability. While the vast majority of these studies conclude that homicides and availability are closely associated (Lester, 1990; Killias, 1993a, 1993b; Hemenway and Miller, 2000), the methodological problems in this research (measurement of key variables is of questionable validity, the use of nation-states as the unit of analysis may mask subnational variability, and models tested are poorly specified) do not encourage us to place much weight on this research. However, as noted earlier, the level of nongun homicide is much higher in the United States than it is in other countries. A high level of violence may be a cause of a high level of firearms availability instead of the other way around. Further work with better measures and more complete samples might be useful; for now this literature can be considered suggestive but not conclusive.
TABLE 3-1 International Firearms Homicide and Suicide Rates
|
Country |
Year |
Total Homicides (per 100,000) |
Firearm Homicides (per 100,000) |
Total Suicides (per 100,000) |
Firearm Suicides (per 100,000) |
Percentage Households with Firearms |
|
Estonia |
1994 |
28.21 |
8.07 |
40.95 |
3.13 |
9 (UN) |
|
Brazil |
1993 |
19.04 |
10.58 |
3.46 |
.73 |
4.35 (UN) |
|
Mexico |
1994 |
17.58 |
9.88 |
2.89 |
.91 |
N/A |
|
United States |
1993 |
9.93 |
7.07 |
12.06 |
6.3 |
39 |
|
Northern Ireland |
1994 |
6.09 |
5.24 |
8.41 |
1.34 |
8.4 (1989) |
|
Argentina |
1994 |
4.51 |
2.11 |
6.71 |
2.89 |
3 |
|
Hungary |
1994 |
3.53 |
.23 |
35.38 |
.88 |
N/A |
|
Finland |
1994 |
3.24 |
.86 |
27.26 |
5.78 |
25.2 (1992) |
|
Portugal |
1994 |
2.98 |
1.28 |
14.83 |
1.28 |
N/A |
|
Mauritius |
1993 |
2.35 |
.00 |
12.98 |
.09 |
N/A |
|
Israel |
1993 |
2.32 |
.72 |
7.05 |
1.84 |
N/A |
|
Italy |
1992 |
2.25 |
1.66 |
12.65 |
1.11 |
16 |
|
Scotland |
1994 |
2.24 |
.19 |
12.16 |
.33 |
4.7 (1989) |
|
Canada |
1992 |
2.16 |
.76 |
13.19 |
3.72 |
24.2 (1992) |
|
Slovenia |
1994 |
2.01 |
.35 |
31.16 |
2.51 |
N/A |
|
Australia |
1994 |
1.79 |
.44 |
12.65 |
2.35 |
15.1 (1992) |
|
Taiwan |
1994 |
1.78 |
.15 |
6.88 |
.12 |
N/A |
|
South Korea |
1994 |
1.62 |
.04 |
9.48 |
.02 |
N/A |
|
New Zealand |
1993 |
1.47 |
.17 |
12.81 |
2.14 |
22.3 (1992) |
|
Belgium |
1990 |
1.41 |
.60 |
19.04 |
2.56 |
16.5 (1992) |
|
Switzerland |
1994 |
1.32 |
.58 |
21.28 |
5.61 |
27.2 (1989) |
|
Sweden |
1993 |
1.30 |
.18 |
15.75 |
2.09 |
15.1 (1992) |
|
Hong Kong |
1993 |
1.23 |
.12 |
10.29 |
.07 |
N/A |
|
Denmark |
1993 |
1.21 |
.23 |
22.33 |
2.25 |
N/A |
|
Austria |
1994 |
1.17 |
.42 |
12.12 |
4.06 |
18-20 (1996) |
|
Germany |
1994 |
1.17 |
.22 |
15.64 |
1.17 |
8.9 (1989) |
|
Singapore |
1994 |
1.17 |
.07 |
14.06 |
.17 |
N/A |
|
Greece |
1994 |
1.14 |
.59 |
3.4 |
.84 |
.03 (UN) |
|
France |
1994 |
1.12 |
.44 |
20.79 |
5.14 |
22.6 (1989) |
|
Netherlands |
1994 |
1.11 |
.36 |
10.03 |
.31 |
1.9 (1992) |
|
Kuwait |
1995 |
1.01 |
.36 |
1.66 |
.06 |
N/A |
|
Norway |
1993 |
.97 |
.30 |
13.64 |
3.95 |
32. (1989) |
|
Spain |
1993 |
.95 |
.21 |
7.77 |
.43 |
13.1 (1989) |
|
Ireland |
1991 |
.62 |
.03 |
9.81 |
.94 |
N/A |
|
Japan |
1994 |
.62 |
.02 |
16.72 |
.04 |
.57 (UN) |
|
England and Wales |
1992 |
.55 |
.07 |
7.68 |
.33 |
4.4 |
|
SOURCES: Krug et al. (1998); United Nations (2000). |
||||||
U.S. Rates
Across the population as a whole, neither homicide nor suicide is one of the 10 leading causes of death in the United States. However, for 15- to 24-year-olds, homicide is the second leading cause of death, and suicide is the third. The rankings are reversed for 25- to 34-year-olds. Considering these data by race, homicide is the leading cause of death for blacks ages 15 to 24 and 25 to 34. And it is the sixth leading cause of death for blacks at all ages.
FIREARM AVAILABILITY AND OWNERSHIP
To understand the relationship between gun violence and gun availability, it is important to have accurate information about gun ownership. How many firearms are there in the United States? How many households own firearms? How many handguns are there in the United States?
Because most states do not require registration or licensing of firearms and therefore have incomplete record-keeping, inaccessible data, and unobserved levels of illegal firearm ownership (Azrael et al., 2004), most firearm research must make use of alternative measures. The two principal methods for directly measuring the U.S. civilian stock of guns are (1) production-based estimates calculated from domestic manufacturing, export, and import data and (2) nationally representative surveys that ask respondents about gun ownership (Kleck, 1997).
Scholars have also used a varied list of indirect measures or proxies to measure firearms availability and ownership patterns, including the percentage of suicides or homicides committed with a firearm, the fatal firearm accident rate, gun magazine subscription rates, the National Rifle Association membership rate, the hunting license rate, and the number of federal firearm licenses (Miller et al., 2002; Azrael et al., 2004; Duggan, 2001; Corzine et al., 2000; Kleck, 1997). While all of these measures shed light on the relationship between gun ownership and violence, they also all suffer from measurement errors that are difficult to estimate.3 In Chapter 2, the committee recommends a program of research to improve the ability to measure gun ownership. For this section we use production and sales data to give the reader a rough idea of gun ownership in the United States.
Production-Based Estimates
Firearm production statistics are derived from reports of firearms manufacture, import, and export made to the Bureau of Alcohol, Tobacco, and Firearms. Estimates of firearm availability are derived by adding the net growth in the number of firearms (manufactures plus imports minus ex-
|
3 |
For a thorough discussion of the limitations of these measures, see Chapter 7. |
TABLE 3-2 Estimated Number and Per Capita Ownership (rate per 1,000) of Firearms in the United States, 1950 to 1999
|
Year |
Total Firearms |
Handguns |
Firearms per 1,000 Persons |
Handguns per 1,000 Persons |
|
1950 |
57,902,081 |
14,083,195 |
381.3 |
93.5 |
|
1960 |
77,501,065 |
18,951,219 |
430.6 |
105.4 |
|
1970 |
111,917,733 |
31,244,813 |
548.7 |
153.2 |
|
1980 |
167,681,587 |
51,707,269 |
737.9 |
227.5 |
|
1990 |
212,823,547 |
72,499,181 |
853.3 |
290.7 |
|
1999 |
258,322,465 |
93,742,357 |
925.8 |
336.0 |
|
SOURCES: Data for 1950 to 1990 are from Kleck (1997: Table 3.1). The 1999 estimate was derived by adding the annual net increase in the stock of total firearms and handguns (manufactures + imports – exports) to the 1990 estimate using data from U.S. Bureau of Alcohol, Tobacco, and Firearms (2002: Exhibits 1, 2, and 3). |
||||
ports) to a base measure of the firearms stock.4Table 3-2 presents production-based estimates of the size of the civilian firearms stock based on a cumulated total since 1999. As the table shows, in 1999 there were more than 258 million firearms in the United States, 36 percent of them handguns. For every 1,000 people in the United States in 1999 there were nearly 926 firearms, 336 of which were handguns.
From 1950 to 1999, the per capita rate of overall firearms availability increased 143 percent, while handguns alone increased 259 percent. These data suggest that in recent years the rate of increase has slowed: the annual number of new handguns introduced to market has declined since 1994, while annual introduction of other firearms has remained relatively stable.
Survey-Based Estimates
Although production-based estimates indicate a 25 percent increase in firearms availability since 1980, survey-based estimates indicate an 11 to 33 percent decrease in households reporting ownership. Three often-used surveys are the General Social Survey (GSS), the Gallup Poll, and the Harris Poll.5 According to these surveys, the percentage of respondents reporting
that they have a firearm in the home has been declining since the late 1950s. While the estimates vary from year to year, all three surveys indicate a decline in the percentage of households possessing firearms. From 1980, when the percentage of households owning a firearm was between 45 and 48 percent, ownership has decreased by 5 to 16 percentage points to a prevalence of 30 to 43 percent. In discussion with the committee, Cook has suggested that the decline in ownership per household while individual ownership remains constant may be due to the increase in female-headed households during this period. Despite these overall reductions in household ownership, the relative distribution of firearm ownership across attributes of gender, race, age, education, income, and region has been remarkably consistent over time (Maguire and Pastore, 2002: Table 2.70).
Of households owning a firearm, between 59 and 62 percent reported owning a handgun (Maguire and Pastore, 2002: Tables 2.69, 2.71, and 2.72). All three surveys indicate that gun owners are more likely to be male, white, and middle-aged or older. Furthermore, gun ownership was higher among those who live in the South, had less education than a college degree, and had a higher than average income. Among respondents reporting household gun ownership, the percentage of blacks reporting handgun ownership was 6 to 9 percent higher than for whites, and the percentage of blacks reporting long gun ownership was 11 to 29 percent lower than for whites (Maguire and Pastore, 2002: Tables 2.71 and 2.72).
Aggregation of Individual Survey Responses
Recent research has aggregated the individual survey responses about firearms ownership across U.S. communities (Baumer et al., 2002; Rosenfeld et al., 2001). The GSS is based on a national area probability sample composed of 100 primary sampling units (PSUs) (in the 1990 sampling frame) designed to represent the population of people age 18 and older in the United States. Each PSU is a “self-representing” geographic unit, in the sense that the respondents are representative of the PSU adult population.
Aggregating the individual survey responses to the PSU level permits comparisons of the aggregated items, including firearms ownership, across a representative sample of U.S. geographic areas. Figure 3-1 shows the geographic distribution of household firearm ownership for the 100 PSUs in the 1990 GSS sampling frame, covering the period 1993 to 1998.
The figure shows substantial variability in firearm ownership in the United States. The prevalence of household ownership varies from roughly 10 to 80 percent. Most of the PSUs cluster around the mean ownership level of 43 percent, with fewer PSUs located near the extremes of the distribution.
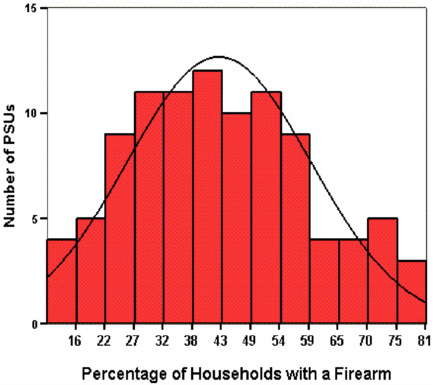
FIGURE 3-1 Distribution of firearms ownership across geographic regions, 1993-1998 (N = 100).
SOURCES: Baumer et al. (2002); Rosenfeld et al. (2001).
FIREARM-RELATED HARM
The majority of firearm-related deaths are the result of murder and suicide, while the majority of nonfatal firearm-related injuries are the result of assaults and accidents. Firearm-related deaths constitute the majority of all homicides and suicides, but firearm-related injuries represent only a minority of nonfatal injuries.6
Table 3-3 shows overall and firearm-related deaths by intent based on National Vital Statistics System (NVSS) data. In 1999, there were 28,874 firearm-related reported deaths in the United States. Suicide and homicide accounted for the majority of these fatalities, representing 57 and 37 percent of total firearm-related deaths, respectively. Furthermore, firearm-
TABLE 3-3 Overall Firearm-Related Deaths, 1999
|
Category |
Firearm-Related |
Total |
% Firearm-Related |
||
|
|
Number |
Rate a |
Number |
Rate a |
Percent |
|
Suicide |
16,599 |
6.09 |
29,199 |
10.71 |
56.85 |
|
Homicide |
10,828 |
3.97 |
16,899 |
6.19 |
64.07 |
|
Accident |
824 |
0.30 |
97,860 |
35.89 |
0.84 |
|
Legal intervention |
299 |
0.11 |
398 |
0.15 |
75.13 |
|
Total |
28,874 |
10.59 |
148,286 |
54.30 |
19.47 |
|
aRate per 100,000 population SOURCE: National Vital Statistics System data compiled using Web-based Injury Statistics Query and Reporting System (WISQARS). National Center for Health Statistics (2002). |
|||||
TABLE 3-4 Number and Rate (per 100,000) of Overall and Firearm-Related Nonfatal Injuries by Intent, 2000
|
|
Firearm-Related |
Total |
||
|
Number |
Rate |
Number |
Rate |
|
|
Assault |
48,570 |
17.64 |
1,672,117 |
607.37 |
|
Legal intervention |
862 |
0.31 |
63,304 |
22.99 |
|
Suicide attempt |
3016 |
1.10 |
264,108 |
95.93 |
|
Accident |
23,237 |
8.44 |
27,550,181 |
10,007.10 |
|
Total |
75,685 |
27.49 |
29,549,710 |
10,733.39 |
|
SOURCE: NEISS data compiled using WISQARS (National Center for Health Statistics, 2002). |
||||
related deaths accounted for the majority of the total number of deaths in each category except accidents. In that case, firearm-related deaths accounted for a tiny fraction of all deaths by accidental means.
Table 3-4 shows overall and firearm-related nonfatal injuries by intent based on National Electronic Injury Surveillance System (NEISS) data. In 2000, there were 75,685 nonfatal firearm-related injuries in the United States. Injuries from violent assault and accidents accounted for the majority of all firearm injuries—64 and 31 percent, respectively. In contrast to completed suicides, firearms account for a small proportion of self-inflicted nonfatal injuries.
How much violent crime involves the use of a firearm?7 This question can be answered with varying degrees of certainty, depending on the crime and the data source consulted. In general, data on homicide are the
most reliably reported and provide greater detail about the circumstances of the offense. Of crimes known to police in 2000, the most recent year for which Uniform Crime Reports (UCR) data are available, firearms were involved in 66 percent of the 15,517 murders, 41 percent of the 406,842 robberies, and 18 percent of the 910,744 aggravated assaults. Data from the National Crime Victimization Survey (NCVS) for 2000 indicate about 3 percent of the 260,950 rapes or sexual assaults involved the use of a firearm, although this estimate is based on 10 or fewer sample cases (Rennison, 2001).
Firearms and Homicide
Weaponry in Homicide
According to the UCR, 10,179 murders were committed with firearms in the United States in 2000, corresponding to a rate of 3.6 per 100,000.8 This count is down from a historic high in 1993 of 17,046 firearm-related murders (6.6 per 100,000). Handguns were used to commit 52 percent of all homicides, and firearms of any kind were used to commit 66 percent of all homicides in that year; 14 percent were committed with knives or other cutting implements, and 7 percent were achieved with hands, feet, or other “personal weapons.”
Trends in weapon-specific homicide rates from 1976 to 2000 are shown in Figure 3-2. Handgun homicides rose until 1993 and then fell, tracking closely the overall homicide rate, while the rates for other firearms, knives, and other weapons fell steadily and closely track each other. Thus, handgun homicides accounted for virtually all of the increase in the overall homicide rate between 1985 and 1993, the year the handgun homicide rate reached its 25-year peak of 5.4 per 100,000 (an estimated 14,005 handgun homicides).
The likely use of firearms varies dramatically from one type of homicide to another. For example, in the year 2000, about 17 percent of homicides were known to have occurred during the commission of other crimes; among these, 73 percent of robbery-related homicides were committed with a firearm, but only 9 percent of rape-related homicides were committed with a firearm.
|
8 |
These UCR statistics differ slightly from those presented in Table 3-3. Since the UCR collects data from police sources and the NVSS from medical examiner records, the disparity between the two systems arises because of data collection differences. Despite these differences, the systems are highly concordant in their estimates of firearm-related murder. Here we present UCR-Supplemental Homicide Report data because they provide information about offenders, weaponry, and circumstances surrounding the offense—information not found in the NVSS. |
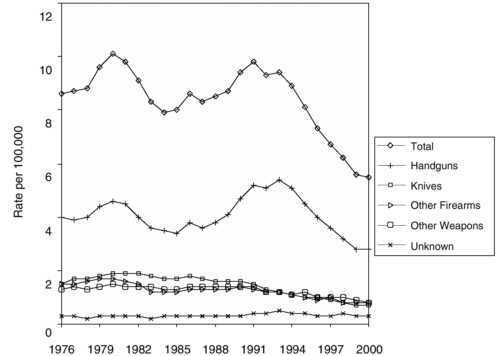
FIGURE 3-2 Murder rates by weapon type.
SOURCES: Fox (2001); U.S. Department of Justice (2001); U.S. Census Bureau (2001a, 2001b, 2002).
Victims
Males are more likely to be victims of homicide than females, and they are even more likely to be killed by firearms. In 1999, male victims accounted for 83 percent of firearm-related homicides and 64 percent of other homicides.9 The male firearm-related homicide victimization rate was 6.71 deaths per 100,000, compared with a female rate of 1.35 (Bureau of Justice Statistics, 2002a, 2002b). From 1981 to 1999, trends in firearm-related homicides of males seem to explain much of the trends in the total homicide rate.
Young adults and adolescents are disproportionately victimized by firearm-related homicide. The rise and decline of the firearm-related homicide rate beginning in the mid-1980s was largely confined to the young adult and adolescent males (Wintemute, 2000). From 1981 to 1999, 20- to 24-year-olds were most likely to be victims of homicide, especially by firearms, but victimization rates among 15- to 19-year-olds rose and fell more dra-
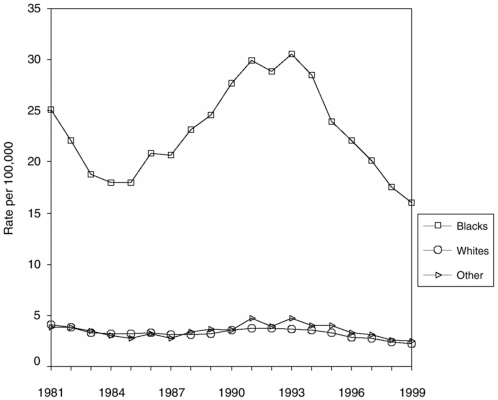
FIGURE 3-3 Firearm-related murder victimization rates by race, 1981-1999.
SOURCE: National Vital Statistics System data compiled using Web-based Injury Statistics Query and Reporting System (WISQARS). National Center for Health Statistics (2002).
matically than other age groups between 1985 and 1999. Adolescent victimization rates surpassed the rates for those 25 and older by 1990 and did not fall back below the rate for persons in their late 20s until 1998.
Blacks have been at high risk of victimization by firearm-related homicide. Figure 3-3 indicates that in 1999, for example, non-Hispanic blacks accounted for 51 percent of the firearm-related homicide victims, while representing only 13 percent of the total population (Bureau of Justice Statistics, 2002a). The firearm-related homicide victimization rate was 16.64 per 100,000 for non-Hispanic blacks, 6.19 for Hispanics, 1.53 for non-Hispanic whites, and 2.60 for other races. Blacks were also disproportionately affected by the rise and fall of firearm homicides in the 1980s and 1990s.10
Offenders
Young males are an even larger percentage of firearm-related homicide offenders than homicide victims. For example, cumulative data from the FBI’s Supplementary Homicide Reports (SHR) for the years 1976 to 1999 reveal that males committed 90 percent of all firearm-related homicides (Bureau of Justice Statistics, 2002a). In 1999, 56 percent of the 10,969 offenders who used firearms to commit murder were between 14 and 24 years old. The rate of handgun murders by persons under age 18 nearly quadrupled from 1985 to 1993, and rates for 18- to 24-year-olds more than doubled, while homicides by persons over 24 declined steadily from 1985 on. The highest concentrations of recent involvement in handgun homicides have been among young blacks; the homicide offense rate among blacks ages 18 to 24 tripled between 1984 and 1993, while the combined offense rates for young whites and Hispanics did not begin to increase until 1987 and even then accounted for a relatively small proportion of the subsequent rise and fall in the handgun homicide rate (Blumstein, 2000).
Historically, firearm homicide rates have been higher than the national average in the southern states, about average in the mid-Atlantic and north central regions, and below average in the New England, mountain, and west north central states (Bureau of Justice Statistics, 2002a). Larger cities (more than 100,000) have had higher homicide and firearm homicide rates than smaller cities, towns, or rural areas.
Firearms and Nonfatal Injuries
Aggravated Assault
Assaults are the most common type of nonfatal firearm injury in the United States, but firearms are not the most common method of nonfatal assault. Figure 3-4 shows trends in the rates of aggravated assault by firearm involvement. According to the UCR, the aggravated assault rate more than quadrupled from 1964 to 1992 and has been declining just as steeply since then.11 Nonfirearm-related assaults accounted for 72 percent of the overall rise from 1964 to 1992 and 57 percent of the overall decline from 1992 to 2000; firearms were involved in only 18 percent of assaults in 2000; and assaults using blunt objects constituted the largest share of offenses.
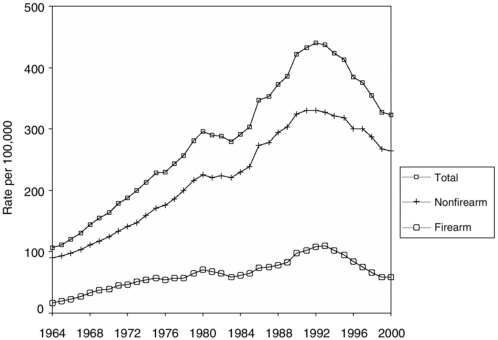
FIGURE 3-4 Rates of aggravated assault by firearm involvement.
SOURCES: Calculated from Zawitz (2001); Maguire and Pastore (2002).
Robberies
In 2000, the NCVS and the UCR provided similar estimates for 157,623 firearm-related robberies in the United States—157,623 (NCVS) and 166,807 (UCR)—remarkably consistent estimates given the methodological and coverage differences between the two data sources. For all weapon categories besides firearms the NCVS reports higher estimates than the UCR. The close correspondence on firearms therefore suggests that most firearm-related robberies are reported to the police. The NCVS data indicate that 90 percent of firearm-related robberies in 2000 were committed with a handgun.
Figure 3-5 presents rates of robbery stratified by firearm involvement for the years 1974 to 2000. The robbery rate rose and fell several times before reaching its peak of 271.9 per 100,000 in 1991; the rate then decreased by nearly half to 144.6 per 100,000 in 2000. Firearms robberies accounted for 24 percent of the rise from 1974 to 1991 and 39 percent of the decline from 1991 to 2000. Like the trends for aggravated assault and in contrast to the trends for murder, the robbery rate was not much influenced by the rates of offenses committed with firearms.
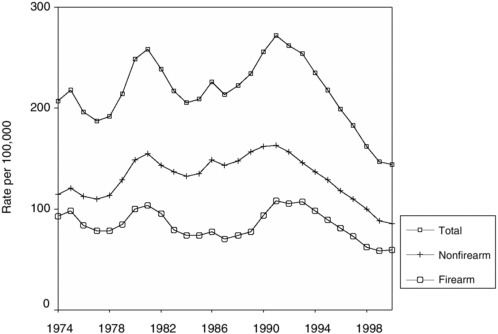
FIGURE 3-5 Rates of robbery by firearm involvement.
SOURCES: Calculated from Zawitz (2001); Maguire and Pastore (2002: Table 3.120); U.S. Census Bureau (2001a, 2001b, 2002).
Rape and Sexual Assaults
According to the NCVS, 84 percent of the rapes and sexual assaults reported in 2000 were committed without a weapon. There were an estimated 6,550 firearm-related rapes or sexual assaults in 2000; these constituted less than 3 percent of NCVS-reported rapes.
Firearms and Self-Harm
Historically, the number of successful suicides in the United States has far exceeded the number of homicides. In 1999, the number of suicides was nearly double the number of murders. In contrast, nonfatal injuries resulting from suicide attempts are much less common than injuries caused by violent assaults, regardless of weapons used. In this section, we describe the patterns and trends for death and nonlethal injuries resulting from self-inflicted, firearm-related harm.
Suicide
In 1999, there were 29,199 suicides in the United States—57 percent of them involving the use of a firearm. Males of all ages are at higher risk of
suicide; in 1999, males committed 14,479 (87 percent) of firearm-related suicides. Whites are at higher risk of suicide than blacks, but the suicide rate for young black males has been rising and by 1999 was nearly the same as the suicide rate for young white males. Figure 3-6 shows the number and rate of firearm-related suicides per 100,000 by five-year age groupings for 1999. As the figure shows, more firearm-related suicides were committed by those 35 to 39 years old than any other five-year age grouping, although those 80 to 84 years old committed suicide at the highest rate, 13.7 per 100,000.
The total suicide rate has remained relatively constant in the United States, but the proportion of suicides committed with a firearm increased steadily from the 1960s to the early 1990s before beginning a moderate decline. The age distribution of suicides over this period also changed, with a rise in suicide among the young and the old and a small decline among working-age adults. Figure 3-7 shows trends in the suicide rate
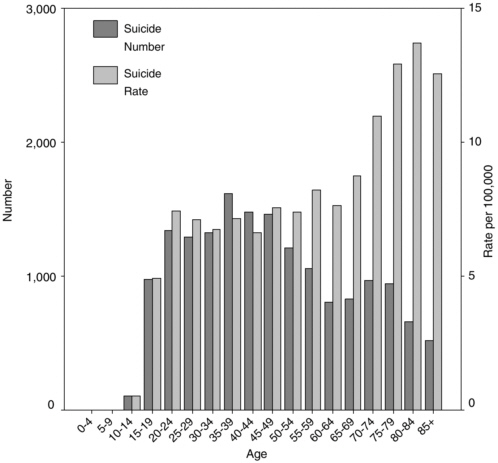
FIGURE 3-6 Number and rate of firearm-related suicides, 1999.
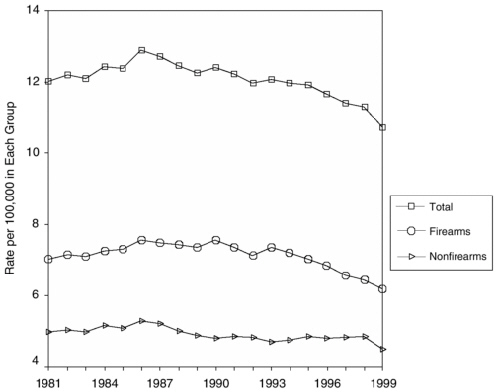
FIGURE 3-7 Suicide rates by firearm involvement.
stratified by firearm involvement from 1981 to 1999. Between 1986 and 1990, the firearm suicide rate plateaued at a rate of about 7.56 per 100,000; since then, firearm suicides have fallen by 18 percent to 6.19 per 100,000 in 1999.
Trends by race are presented in Figure 3-8. As the figure shows, whites have dominated the overall trend in firearm suicides. The firearm-related suicide rate for whites increased 9 percent from 1981 to a two-decade peak in 1990 before declining 19 percent over the past decade. For blacks, a similar pattern occurred, although the peak rate was in 1994. The rate for other races combined was relatively stable until 1994, then declined somewhat.
Trends by age are presented in Figure 3-9. Persons age 75 and older had the highest rates of firearm-related suicide during the previous two decades. The period from 1981 to 1990 saw the greatest change among this age group, increasing 48 percent to 16.37 per 100,000. Then, from 1990 to 1999, the firearm-related suicide rate for this age group decreased 21 percent to 13.05 per 100,000. Trends for
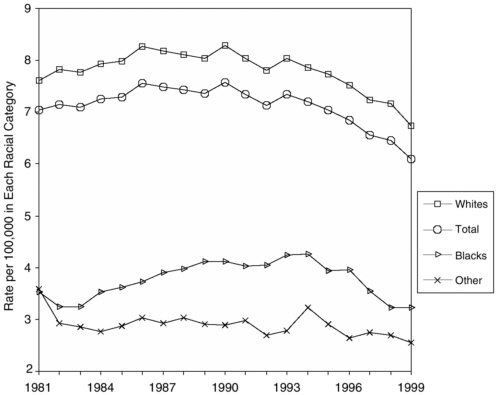
FIGURE 3-8 Suicide rates by race, 1981-1999.
persons ages 15 to 24 showed similar patterns, increasing until 1994, then declining to the present. By contrast, firearm-related suicide rates for those ages 25 to 74 have been declining steadily since the early 1980s. The rates for children ages 0 to 14 have remained relatively stable, increasing slightly from 1981 to 1990, then declining to the 1981 rate by 1999.
Nonfatal Self-Harm
In 2000, there were only 3,016 nonfatal firearm-related injuries recorded by the NEISS—about 4 percent of all reported self-injuries. Because NEISS only records self-injury events that are screened in an emergency department, and because firearm injuries may be more likely to be treated in an emergency department than other kinds of self-injuries, the actual fraction of nonlethal self-injuries that occur by firearm is likely to be even lower. Furthermore, rates of nonfatal firearm-related injuries have been declining since 1993 (Gotsch et al., 2001).
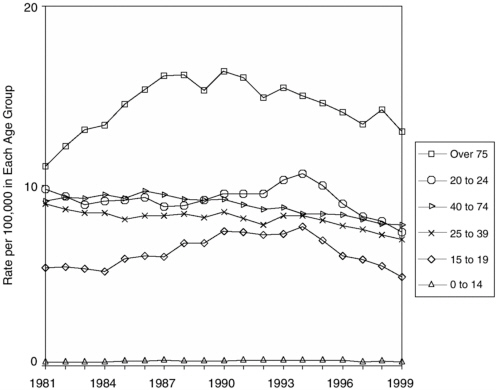
FIGURE 3-9 Firearm-related suicides by selected age groupings, 1981-1999.
Firearms and Accidents
Firearm-related accidental deaths represent a small fraction of all firearm-related deaths, but unintentional injuries represent a sizable proportion of all nonfatal injuries resulting from firearms—behind only the number caused by violent assaults.
In 1999 there were 824 firearm-related accidental deaths—less than 1 percent of the 97,860 total accidental deaths for that year—corresponding to an accidental firearm-related death rate of 0.30 per 100,000.
Rates of firearm-related accidental deaths have been declining since the mid-1960s (Ikeda et al., 1997; Frattaroli et al., 2002). Since 1981, the firearm-related accidental death rate has declined 63 percent from 0.83 to 0.30 per 100,000. The male rate of firearm-related accidental deaths is much higher than the female rate. In 1999, males accounted for 88 percent of accidental firearm-related deaths; however, both males and females have contributed roughly proportionally to the declining trend. In 1999, the fatal
accident rate for blacks (0.47 per 100,000) was somewhat higher than the rate for whites (0.30 per 100,000). There are also substantial differences in trends in the rate firearm-related accidental deaths by age group. Although firearm-related accidental death rates have been on a downward trend for other age groups since the mid-1960s, rates for 15- to 24-year-olds rose from 1987 to 1993 and then declined.


