
CHAPTER 5
Coverage Evaluation: Methods and Background
A KEY GOAL OF THE 2000 CENSUS was to reduce the net undercount of the population and the differences in net undercount rates between historically less-well-counted groups (minorities, children, renters) and others (non-Hispanic whites, adults, owners) compared with the results in 1990. Achieving this goal would also probably reduce differences in net undercount rates among states and local areas. For the 1990 census, the Post-Enumeration Survey (PES) estimated a national net undercount of about 1.6 percent, or a shortfall of 4.0 million people. It also estimated a difference of 3.9 percentage points between the net undercount rate for blacks (4.6 percent) and that for non-Hispanic whites (0.7 percent), and a difference of 4.3 percentage points between the net undercount rate for Hispanics (5.0 percent) and that for non-Hispanic whites.1
For the 2000 census the most recent revision of the Accuracy and Coverage Evaluation (A.C.E.)—Revision II—estimated a slight national net overcount of about 0.5 percent of the household population, or 1.3 million extra people, which is the first estimated net overcount in census history. The A.C.E. Revision II also estimated a difference of 2.9 percentage points between the net undercount rate for blacks (1.8 percent) and the net overcount rate for non-Hispanic whites (1.1 percent) and a difference of 1.8 percentage points between the net undercount rate for Hispanics (0.7 percent) and the net overcount rate for non-Hispanic whites (U.S. Census Bureau, 2003c:Table 1).
The final Revision II A.C.E. estimates appear to tell a story of success in reducing the net undercount and differences in net undercount rates in 2000 compared with 1990. Despite the extensive, imaginative, and high-quality work by Census Bureau staff to develop the Revision II estimates, however, it is difficult to draw clear-cut conclusions from them about undercounts and overcounts in 2000 because of limitations in the available data for reestimation. The evaluations that fed into the Revision II estimates provided more information than previously available about the numbers and sources of erroneous census enumerations and, similarly, more information with which to determine the residency status of the independent A.C.E. sample. They provided little new information, however, about the numbers and sources of census omissions. Because of changes in estimation methodology, the revised 2000 estimates are not comparable with the 1990 PES results.
To set the stage for our assessment of population coverage in the two censuses in Chapter 6, we first describe the two major coverage evaluation methods—dual-systems estimation (5-A) and demographic analysis (5-B). We then review the history of coverage evaluation for 1990 and 2000 (5-C and 5-D, respectively), including decisions about the possible use of coverage estimates to adjust census counts for measured net undercount. In June 1991 the Census Bureau director recommended that PES-based population estimates be used to adjust the 1990 census counts, but the secretary of commerce decided against adjustment. In December 1992, the Bureau director decided that revised PES estimates would not be used to adjust intercensal population estimates. In 2000 the Census Bureau planned to use A.C.E.-based population estimates to adjust the census counts, but on three separate occasions—March 2001, Octo-
ber 2001, and March 2003—the Bureau recommended against such adjustment, and the secretary of commerce accepted the recommendations.
5–A DUAL-SYSTEMS ESTIMATION WITH THE A.C.E.
The 2000 A.C.E., like its predecessors, the 1990 PES and the 1980 Post-Enumeration Program (PEP), was designed to estimate the population of the United States and major population groups by dual-systems estimation (DSE). This method is closely related to a widely used statistical methodology known as capture-recapture, which was first developed for estimating wildlife populations. The methodology requires adaptation for the census context, as described in Fienberg (2000) and Hogan (1992, 2000a,b).
The basic concept of dual-systems estimation is determining how many people counted in one survey are also validly counted in a second, independent survey. In the census context, the initial survey is called the E-sample, which consists of the census enumerations in the A.C.E. sample blocks.2 The subsequent independent survey is the P-sample, which consists of people living at addresses listed independently of the census address list in the sample of census blocks. Not every census enumeration is correct; some are erroneous (e.g., a duplicate), so the process also involves estimating how many of the records in the E-sample represent correct enumerations. This is done by visiting E-sample people who fail to match P-sample records to determine for each individual whether he or she was enumerated in the census despite being missed in the P-sample, or whether the person was enumerated in error, such as a duplicate or a fictitious enumeration.
In general terms, the P-sample and the E-sample are used to estimate two components of the formula for calculating the DSE for each of several hundred population groups, called poststrata. Poststrata are defined by categorizing people on the basis of such variables as age, sex, race, ethnicity, owner or renter, region, and others; about 400 poststrata were used for the original A.C.E. To the extent possible, the intention is to develop poststrata that group
|
2 |
The E-sample does not include every census enumeration in the A.C.E. blocks, for such reasons as subsampling of large blocks (see Appendix E.1). |
people for whom coverage probabilities are as similar as possible within the group and as different as possible from other groups.
The two components estimated for each poststratum are the proportion of the population correctly included in the census, which is estimated by the P-sample match rate, and the proportion of the census records that were correctly included, which is estimated by the E-sample correct enumeration rate:
-
The match rate is the weighted estimate, M, of P-sample persons who match with E-sample or other census persons, divided by the weighted estimate, P, of all valid P-sample persons (including matches and nonmatches).
-
The correct enumeration rate is the weighted estimate, CE, of E-sample persons who were correctly enumerated in the census (including matches and correct nonmatches), divided by the weighted estimate, E, of all E-sample persons (including correct and erroneous enumerations).
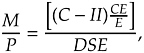
These components are applied in a formula to calculate DSE, the dual-systems estimate for the total population of a poststratum:
(5.1)
where:
-
C–II is the census count, C, minus people requiring imputation and late additions to the census count, II, who are excluded from the E-sample because they cannot be matched to the P-sample;3
-
CE/E is the weighted correct enumeration rate from the E-sample; and
-
P/M is the inverse of the weighted match rate from the P-sample.
For any poststratum, the net undercount rate (UR) is
and the coverage correction factor (CCF) is
where C is the census count, including people requiring imputation and late additions to the count (IIs).
The basic assumption underlying the calculation of the DSE can be stated as follows: Given independence of the P-sample survey from the census, the estimated proportion of P-sample people in a poststratum who match to the census (M/P) is a good estimate of the estimated proportion of all people in the poststratum who were correctly enumerated in the census (CE/DSE). Independence means that the event of being enumerated in the census does not affect the probability of being enumerated in the P-sample (see National Research Council, 1999b:79–80).
Solving for DSE in the following equation,
gives Equation 5.1 above.
Six points are worth noting about dual-systems estimation in the census context. First, the DSE formula (Equation 5.1) includes a factor for IIs; that is, census enumerations that either lacked sufficient information or were added too late to be included in the A.C.E. matching. These enumerations must be assessed to fully understand census coverage estimates (see Section 6-C.1). The total number of IIs in 2000 was about 8.2 million people, including 5.8 million whole-person imputations and 2.4 million people whose records were temporarily removed from the census file as part of the special operation to reduce duplicate Master Address File (MAF) addresses in summer 2000 and reinstated too late to be included in the A.C.E. processing (see Section 4-E). There were no truly late enumerations in 2000. The total number of IIs in 1990 was much smaller—about 2.2 million people, including 1.9 million whole-person imputations and
0.3 million people who were enumerated in coverage improvement programs too late for PES processing.
Second, there is no assumption that the P-sample must be more complete than the E-sample for DSE to work; it is expected that the P-sample will miss some people who were correctly enumerated in the census, and vice versa. What is important is that the information obtained in the P-sample that is needed to determine a match or valid nonmatch be of high quality and satisfy the assumption of independence.
Third, a key assumption in the calculation of the DSE in the census context is that the procedures used to define who is in and who is not in the census are balanced. The E-sample is used to determine how many census enumerations are correctly in the census according to specified criteria (e.g., a college student living in a dormitory should be enumerated at the college and not at his or her parental home). For the DSE model to work, the same criteria must be applied to determine how many P-sample people match to correct census enumerations (whether or not they are in the E-sample). Failure to apply the same criteria will create an error of balancing.
An important dimension of balancing involves geographic correctness. For each person, there is a defined area where he or she should have been enumerated (this is the block cluster in the A.C.E.). In searching for a match for a person in the P-sample, it is important to search all the census enumerations that are in the correct area and only those enumerations in the correct area. Geographic balancing error occurs when the actual search area for P-sample matches is larger or smaller than that used in the E-sample to determine correct enumerations.
Fourth, the DSE is sample based. Consequently, it is important to estimate not only the DSE itself, but also to accurately estimate the variance in the DSE due to sampling error and other sources of variation. In addition, the use of sampling limits the number of individual population groups (poststrata) for which reliable coverage estimates can be developed.
Fifth, if DSE results are to be used to adjust the census for net undercount for geographic areas that are smaller than those used in the poststratification, the process would involve applying the coverage correction factors to the population counted in each geographic area for which adjusted counts are desired, separately for each poststra-
tum. This procedure assumes that the match rate, correct enumeration rate, and other rates involved in the dual-systems computation for a poststratum apply at all lower geographic levels or, alternatively, that the true coverage correction factor for a poststratum applies at all lower geographic levels. This assumption—known as the synthetic assumption—is strong.4
Finally, the design of the A.C.E., similar to the design of the 1990 PES and 1980 PEP, was focused on developing good estimates of net undercount. Given the clustered sampling and other features, the A.C.E. design was not well suited for estimating gross coverage errors or categorizing them by type. For example, the A.C.E. was not designed to identify duplicate census enumerations that involve a household with two or more residences in locations outside the search area for matches (e.g., a household with summer and winter residences in different states). In principle, the A.C.E. process would identify half of such duplicate enumerations as correct and half as erroneous (under the category of “other residence”). However, the balancing assumption might not hold, and, in any case, it would not be possible to identify duplicate enumerations as distinct from other kinds of erroneous enumerations in the “other residence” category. This problem became evident when the original March 2001 A.C.E. coverage estimates were subjected to additional evaluation in summer 2001 (see Section 5-D).
In the preceding discussion of dual-systems estimation, we have referred to several assumptions underlying the method. Statistical assumptions need not be precisely true for a method to be useful and, in fact, such assumptions are rarely precisely true. Determining the sensitivity of results to mild failures of the assumption is an important part of evaluation of a method and of research and development leading to improved methods.
5–B DEMOGRAPHIC ANALYSIS
Beginning in the 1940s, Census Bureau and university researchers have used demographic analysis (DA) methods to develop population estimates for every census year since 1880. Estimates are developed for the total U.S. population and a limited number of groups defined by age, sex, and race (two categories—black and all other). The method uses aggregate data from administrative records, supplemented by census and survey results, for estimation. Since 1970, estimates have been constructed using separate procedures and data sets for people under age 65 and age 65 and older (see Robinson, 2000, 2001a:App. A; National Research Council, 1985:133–139, 148–151).
Estimates of the population under age 65 are constructed for single-year birth cohorts by sex and race. The procedure uses the number of births as the starting point (e.g., estimates of people age 60 in 2000 begin with the number of births in 1940), subtracts deaths, and adds estimates of net immigration in each year to the estimation year. In practice, the DA estimate for a census year (2000) usually begins with the DA estimate for the previous census year (1990), updated with estimates of births, deaths, and net immigration in the decade between the two years.
Birth and death data are from vital statistics records collected by the states in a common format and forwarded to the federal government. (All states and the District of Columbia have been part of the vital statistics registration system since 1932, except that Alaska and Hawaii joined the system later.) Corrections are made for underregistration of births, using the results of birth registration studies adjusted by interpolation and extrapolation (the latest study covered 1964–1968). Administrative data from the Immigration and Naturalization Service are used to estimate legal immigration, but they must be adjusted to fill in gaps for illegal (undocumented) immigration and emigration of legal and illegal residents (tourists and other short-term visitors are not included).
For the population age 65 and over, estimates are constructed from Medicare enrollment statistics. The Medicare data are adjusted for those not enrolled, who were estimated to be 3.7 percent of people age 65 and over in 2000.
Historically, DA estimates have been viewed as a “gold standard” against which to assess the completeness of census coverage when, in fact, the administrative data sources used in the estimates are subject to error, and DA estimates have periodically been revised. For example, upon observing unusually high net undercount rates for black males ages 45–54 in 1990 that had persisted for this cohort since 1960, an investigation determined that the correction for underregistration of births for this group of blacks—and hence their estimated net undercount—was too high (Robinson et al., 1993:1064).
Since 1980, the main area of uncertainty in DA estimates has involved the immigration component, especially the number of undocumented immigrants. The problem of illegal immigrants first became evident when the initial demographic analysis total population estimate for April 1980 was lower than the population enumerated in the census (226.0 and 226.5 million, respectively—National Research Council, 1985:148). Revised DA estimates, which included an allowance for illegal immigrants and incorporated other changes, gave a total population estimate for April 1980 of 229.4 million (National Research Council, 1985:Table 2.1).
Other components of DA estimates, such as emigrants and some categories of legal immigrants, also add to the margin of error. There are no direct, comparative measures for evaluating the net immigration component, especially the undocumented component. At present, a “residual” process is used to estimate the number of undocumented immigrants; that is, an estimate of the expected number of foreign-born people legally residing in the country is derived from reported data on legal immigration, and this figure is compared with the number of foreign-born people reported in the census long-form sample (which included about 17–18 million households in 1990 and 2000) or, more recently, in the Current Population Survey (CPS, which includes about 50,000 households each month). The difference between the two is an estimate of the number of undocumented immigrants included in the census (or CPS), although that estimate is subject to error. The computations are carried out in some detail by country (or region) of birth and year of entry, which is believed to add to the validity to the estimates. Data on country of birth and year of immigration are now included regularly in the CPS so that the computations can be carried out more frequently, perhaps adding some stability in the estimates over time.
5–C COVERAGE EVALUATION AND ADJUSTMENT IN 1990
5–C.1 Preparing for 1990
Building on the experience with DSE-based coverage evaluation methodology in the 1980 census and extensive research and tests conducted in the mid-1980s (see Anderson and Fienberg, 1999:Ch.5), the Census Bureau developed plans for a 1990 Post-Enumeration Survey of 300,000 households. In spring 1987 professional advisory groups and a National Research Council Panel on Decennial Census Methodology endorsed the Bureau’s plans (National Research Council, 1987), which included the possibility that DSE estimates from the PES might be used to adjust the census results for measured net undercount.
In October 1987 the secretary of commerce cancelled the large PES and announced plans for a PES of 150,000 households, which would be used for coverage evaluation only. After a year of controversy, in November 1988, the State and City of New York and a coalition of local governments filed suit in federal court in New York charging that the secretary’s decisions to cancel the large PES and ban a possible adjustment were arbitrary and capricious. In July 1989 when the adjustment lawsuit trial was scheduled to begin, the parties reached a partial settlement. The terms of the settlement included that a 150,000-household PES would be conducted, that the results could be used for adjustment, that a Special Secretarial Advisory Panel of experts would be appointed to advise the secretary (four chosen by the secretary and four by the plaintiffs), and that the secretary would reach a decision on adjustment by July 15, 1991. These provisions ensured that the PES operations and results would receive intense scrutiny.
5–C.2 PES Design and Operations
The final design for the 1990 PES included an area-probability sample of 5,290 census block clusters (comprising one or, in some cases, more than one block) for which an independent address listing was conducted. The P-sample cases from the independent list and the E-sample cases of census enumerations in the PES block clusters totaled about 165,000 households each (slightly larger than the originally planned size of 150,000 households). The two sam-
ples also included people living in most types of noninstitutional group quarters. To produce more reliable coverage estimates for minorities, extensive oversampling was used, which resulted in large variation in the PES sampling weights.
Beginning in July 1990, P-sample cases were interviewed using paper-and-pencil questionnaires. A procedure called PES-B was used in gathering information, in which interviewers listed the current residents and ascertained where they lived (at the P-sample address or another address) on Census Day, April 1, 1990. (See Marks [1978], who also describes a PES-A procedure in which each P-sample address is visited to find out who lived there on Census Day. For this procedure, information must be sought from current residents about people who moved away after Census Day.)
Upon completion of interviewing, the P-sample cases were matched with the E-sample cases, using computerized matching software to process as many cases as possible, followed by clerical matching when the computer algorithm could not determine a match. Matches for P-sample people who moved to the P-sample address after Census Day were sought by searching the census records in the area of their residence on Census Day. If a P-sample case did not match any E-sample case in the PES block cluster, then one, or sometimes two, rings of surrounding blocks were searched for P-sample matches. One or two rings were also searched for E-sample correct enumerations that had been identified as geocoding errors—that is, their addresses were incorrectly assigned to the block cluster.
Following matching operations, unmatched and unresolved P-sample and E-sample cases were followed up in the field to obtain more information to try to determine their status. After using the information from field follow-up to determine a final match and enumeration status for as many P-sample and E-sample cases as possible, statistical imputation techniques were used to assign values for missing characteristics and for unresolved match status (P-sample) and unresolved enumeration status (E-sample). All of these operations were completed by December 1990.
In spring 1991, Bureau statisticians used the PES data to develop DSE-based population estimates for the 1990 census. The P-sample and E-sample cases were categorized into 1,392 prespecified poststrata for which coverage correction factors were calcu-
lated. It turned out that, because of the reduction in sample size from 300,000 to 165,000 households, the poststrata coverage correction factors and their variance estimates exhibited greater variability than anticipated. Hence, a last-minute decision was made to “pre-smooth” the variance estimates. The new variance estimates were then used in a planned procedure to reduce the sampling variability of the coverage correction factors. In this procedure, the factors were smoothed by shrinking them toward a predicted value from a multiple regression model (see Anderson and Fienberg, 1999:Ch.5). The final step was to apply the smoothed coverage correction factors for individual poststrata to the census counts, block by block, to develop adjusted population counts for the United States, states, and small areas.
5–C.3 July 1991 Adjustment Decision
The Census Bureau released preliminary PES results on April 18, 1991, which showed a national net undercount of 2.1 percent, and adifference in net undercount rates between blacks and nonblacks of 3.1 percentage points. These estimates were similar to the demographic analysis estimates of a 1.8 percent net undercount overall and a difference in net undercount rates between blacks and nonblacks of 4.4 percentage points (Anderson and Fienberg, 1999:Tables 6.2 and 6.3). Census Bureau staff prepared 19 reports in the P-series evaluating many facets of the PES operations and results (see Anderson and Fienberg, 1999:App.E). The reports were made available in draft form to members of the Special Secretarial Advisory Panel and within the Bureau. In June the four plaintiff-appointed members of the advisory panel recommended that the PES results be used to adjust the census counts, while the four members appointed by the Commerce Department recommended against adjustment. Also in June, an internal Census Bureau Undercount Steering Committee voted seven to two in favor of adjustment, and the director recommended adjustment to the secretary. On July 15, 1991, the secretary of commerce decided against adjustment and released several volumes of supporting documents.
5–C.4 December 1992 Adjustment Decision
The secretary of commerce in July 1991 announced his intention to consider the use of PES estimates to improve the widely used postcensal population estimates that are developed by using birth, death, and immigration records to update the census counts (see Chapter 2). A decision was anticipated before the next release of estimates, scheduled for July 1, 1992, but the decision was subsequently deferred until December.
An internal Census Bureau Committee on Adjustment of Postcensal Estimates (CAPE) conducted additional evaluations of the PES estimates. Its August 1992 report (Bureau of the Census, 1992) documented a computer processing error in the PES estimation that was detected in late 1991. The error increased the estimate of erroneous enumerations which, through the operation of the DSE formula (see Equation 5.1 above), decreased the DSE estimate of the population and consequently reduced the national net undercount by 0.4 percentage points—from 2.1 to 1.7 percent. The CAPE report also presented the results of a reestimation that used 357 poststrata instead of the original 1,392 strata in response to criticisms about the presmoothing and smoothing models used for the original estimation. The report also presented the results of additional refinements and corrections to the PES estimates. The final revised 1990 PES estimates put the national net undercount at 1.6 percent and the difference in net undercount rates between blacks and nonblacks at 3.2 percentage points. In December the Census Bureau director decided not to use the revised PES estimates to adjust the postcensal population estimates, although, at the request of the Bureau of Labor Statistics and other statistical agencies, the Census Bureau used unpublished adjusted national estimates for age, race, ethnicity, and sex groups to correct major household surveys (e.g., the CPS) for undercoverage relative to the census. The secretary of commerce did not assert a role in these decisions.
5–C.5 1993–1996 Court Decisions
Following the July 15, 1991, decision by the secretary of commerce against adjustment of the 1990 census data, the New York plaintiffs renewed their lawsuit. In April 1993 a federal judge ruled
on narrow grounds that the secretary’s decision was not arbitrary or capricious. This ruling was vacated by a panel of the Second Circuit Court in August 1994, which required further consideration of adjustment on the merits. The states of Oklahoma and Wisconsin appealed to the U.S. Supreme Court, which in March 1996 reversed the Circuit Court decision, allowing the unadjusted census counts to remain the official 1990 census numbers (Wisconsin v. City of New York, 517 U.S. 1, 1996).
5–D COVERAGE EVALUATION AND ADJUSTMENT IN 2000
We described in Chapter 3 how the evidence of an increased net undercount in the 1990 census (which resulted despite a 33 percent increase in costs compared with 1980) fueled efforts by the Census Bureau to develop a more cost-effective design for the 2000 census. The original 2000 design called for a large 700,000-household survey and matching operation conducted on a schedule that would permit integrating DSE-based population estimates into the census counts in time to produce adjusted state totals for reapportionment of Congress by December 31, 2000. The Integrated Coverage Measurement (ICM) sample was designed to produce reliable estimates for individual states, so that each state’s coverage correction factor would be estimated from the sample for that state and not require the use of sample from other states.
The U.S. Supreme Court precluded the use of sample-based estimation for the reapportionment counts, so the Census Bureau planned the 2000 Accuracy and Coverage Evaluation Program with a 300,000-household survey and completion of DSE-based estimates in time to produce adjusted small-area census counts for legislative redistricting by the mandated deadline of April 1, 2001. The smaller sample size for the A.C.E. was made possible because there was no longer a need to produce direct state estimates; instead, estimates could borrow strength across states. In a May 1999 letter report to the Census Bureau director, our panel supported this decision, although it urged the retention of a minimum sample size in each state that could be used to evaluate the assumption that state effects on coverage correction factors are less important than the effects of such characteristics as age, race, sex, and housing tenure (see
Appendix A.4.a). Controversy over the adjustment issue was even more intense for 2000 than had been the case for 1990.
5–D.1 A.C.E. Design and Operations
Although the 2000 A.C.E. was broadly similar to the 1990 PES, the two programs differed in a number of respects (see Hogan, 2000b), and Census Bureau staff expected that changes implemented for the A.C.E. would produce superior results. This section briefly summarizes the major differences (see Appendix E for a description of A.C.E. operations).
Universe
The A.C.E. universe excluded people living in institutions, college dormitories, and other group quarters; the PES universe included most noninstitutional group quarters. The Census Bureau decided to limit the A.C.E. to the household population because of its experience in the 1990 PES in which rates of unresolved match status were much higher for group quarters residents than for household members in the PES because of much higher rates of short-term mobility for people in group quarters (e.g., college students taking and returning from spring break, shelter residents moving from one shelter to another, migrant worker dormitory residents moving from one farm to another). However, this decision necessitated an unrealistic assumption of perfect coverage of the group quarters population.
Sample Size and Design
The 2000 A.C.E. was twice the sample size of the 1990 PES—300,000 households in about 11,000 block clusters compared with 165,000 households in about 5,000 block clusters. Because of its larger overall sample size, the A.C.E. could produce reliable direct estimates for minorities and other groups with less oversampling than was used in the PES. The A.C.E. design also improved on several other features of the PES sample design. Consequently, the A.C.E. weights varied less than the PES weights, which contributed to reducing the variance of the A.C.E. estimates (see Appendix E.1).
Initial Housing Unit Match
The A.C.E. included a new operation to match P-sample and January 2000 MAF housing units prior to interviewing. The purpose of the match was to facilitate such operations as large block subsampling, telephone interviewing, and matching. Although the P-sample and census address lists were linked, independence was maintained because no changes were carried over from one list to the other as a consequence of the match.
P-Sample Interviewing Technology and Schedule
The A.C.E. used computer-assisted telephone and personal interviewing (CATI/CAPI) to facilitate the accuracy of the information collected and the speed of data capture and processing. The PES used paper-and-pencil methods throughout. The first wave of A.C.E. interviewing began in late April 2000, using the telephone to contact mail return households that provided a telephone number on their census questionnaire and for which there was a clear city-style address. Fully 29 percent of the P-sample household interviews were obtained by telephone. The second wave of interviewing was in person; it began in mid-June and was completed in August, well ahead of the timing achieved in 1990.
Matching Technology
The A.C.E. clerical matching operation, which followed a computer match, was conducted by clerks examining computerized P-sample responses and questionnaire images for census cases in the sampled block clusters. The technology was designed to be user-friendly. Because of complete computerization of the operation, all matching could be done at one location, instead of seven as in 1990.
Treatment of Movers
A major change from 1990 was the treatment of movers. The goal of the 1990 PES was to visit each P-sample address and find out where the current residents usually lived as of Census Day (PES-B). The original design for Integrated Coverage Measurement for 2000 ruled out PES-B because of the plan to use sampling for nonresponse
follow-up (see Section 3-B.3). This plan meant that some people in the P-sample who moved to their present residence after Census Day might be falsely coded as not matching to a census enumeration. This could happen if they did not mail back a questionnaire and their Census Day address was not included in the sample for nonresponse follow-up. The decision not to use PES-B was carried over to the A.C.E.
The 2000 A.C.E. had two objectives: (1) to find out who lived at each P-sample address on Census Day and determine whether they were enumerated or missed in the census at that address and (2) to find out who lived at each P-sample address as of the A.C.E. interview day. This procedure is called PES-C; it results in obtaining information not only for nonmovers and inmovers (interview day residents not resident on Census Day), but also for outmovers (Census Day residents not resident on interview day).
The PES-C procedure involved estimating the P-sample match rate for movers by matching outmovers. At the same time, for most poststrata, the A.C.E. estimated the number of matched movers by applying the outmover match rate to inmovers. The underlying assumption is that inmovers would be more completely reported than outmovers. The advantage of PES-C is that a searching operation for the Census Day residence of inmovers is not required. The drawback is that the quality of the information collected to use in the matching for outmovers may be impaired because their information is always supplied by other people. The decision to use the PES-C procedure added complexity to the A.C.E. estimation. Tests of Integrated Coverage Measurement in 1995 and 1996 used PES-A, in which the goal is to find out who lived at each P-sample residence on Census Day and determine whether they were enumerated or missed in the census. PES-C is similar to PES-A except that PES-C applies the match rate for outmovers to the number of inmovers, instead of using both the match rate and number of outmovers in the DSE estimation (see Liu et al., 2001:1).
Targeted Extended Search Procedure
Another important change from the 1990 PES concerned the targeted extended search procedure for searching surrounding blocks if a search in the sampled block cluster did not turn up a match for a
P-sample household and to find out if misgeocoded E-sample cases were located nearby. Such searching could reduce the variance and bias of the DSE estimates. For efficiency reasons, it was decided in the A.C.E. to target the extended search on selected P-sample and E-sample cases and to conduct it for a subsample of the A.C.E. blocks, instead of conducting searches for every block as in 1990.
Definition of Poststrata
The 448 poststrata in the original A.C.E. design (reduced to 416 for developing the original DSE estimates) were similar to the 357 poststrata that were implemented in the reestimation of the 1990 PES in 1992 (see Section 5-C.4). The 2000 poststrata (see Appendix E, Table E.3) included two additional race/ethnicity domains, one for American Indians and Alaska Natives not living on reservations and another for Native Hawaiian and Other Pacific Islanders (who had been combined with Asians in 1990). The 2000 poststrata also categorized non-Hispanic whites and other races, non-Hispanic blacks, and Hispanics by mail return rate (two categories—high and low—calculated separately for each group by housing tenure). Region was dropped as a stratifier except for people in the non-Hispanic white and other race category who owned their homes. Subsequently for the A.C.E. Revision II reestimation in 2002, extensive changes were made to the E-sample poststratification (see Section 6-B.4).
5–D.2 March 2001 Adjustment Decision
In fall 2000, Clinton commerce secretary Norman Mineta delegated authority for the decision on adjustment of the 2000 census to the director of the Census Bureau (65 Federal Register 195, 59713–59716). In the first days of the Bush administration, commerce secretary Donald Evans rescinded the earlier regulation, returning the authority to the secretary (66 Federal Register 37, 11231–11233). The administration also accepted the resignation of director Kenneth Prewitt.
Both versions of the rule on the authority for deciding on adjustment formally established within the Census Bureau an Executive Steering Committee for A.C.E. Policy (ESCAP), which was made up of senior Bureau staff, to recommend to the director whether to
release adjusted or unadjusted block data for redistricting in March 2001. After reviewing the original A.C.E. results and an extensive series of evaluations, ESCAP recommended that unadjusted counts from the enumeration process should be the official data for legislative redistricting. The acting director accepted this recommendation and transmitted it to the secretary of commerce on March 1, 2001. The secretary, after consulting with several outside experts, adopted the Bureau’s recommendation on March 6, and unadjusted census redistricting data (the P.L. 94-171 files—see Chapter 2) were released state-by-state during March.
The Bureau’s decision against adjustment was surprising to many in light of the evolution of the census design over the decade of the 1990s (see Chapter 3) and particularly the more prominent role of the A.C.E. relative to the analogous 1990 PES. Also, public statements by Census Bureau officials before the census was completed stressed the limitations on the ability to count everyone in the nation through field procedures and the likelihood that statistical adjustment would improve the estimates of the population for important purposes. For example, Census Bureau director Kenneth Prewitt wrote: “The Census Bureau has determined that the A.C.E. is operationally and technically feasible and expects, barring unforeseen operational difficulties that would have a significant effect on the quality of the data, that these corrected data will be more accurate than the uncorrected data for their intended purposes” (Prewitt, 2000:2).
Census Bureau’s Decision Process
The Census Bureau reached its conclusion not to adjust after carefully following the decision process it had specified, which was publicly explained at an open workshop held by our panel in October 2000 (see National Research Council, 2001g). All of the evaluations that the Bureau proposed to conduct were completed and reviewed by ESCAP. The ESCAP decision report and the completed A.C.E. evaluations are available at http://www.census.gov/dmd/www/EscapRep.html [1/10/04].
Given the time constraints, these evaluations could not be exhaustive, but they included detailed assessments of A.C.E. operations, supplemented by more limited assessments of census opera-
tions and comparisons of adjusted and unadjusted census counts for different levels of geography (Hogan, 2000c). The A.C.E. evaluations covered rates of noninterviews in the independent P-sample and missing data in the P-sample and E-sample; quality control of the matching process; the extent of imputation required for unresolved residence, match, and enumeration status; inconsistent assignment of sample cases to poststrata in the two samples; and variance due to sampling and imputation error in the DSE estimates. The census evaluations covered mail return rates; quality assurance of enumerators’ field work; results of unduplication operations; and extent of missing data. Comparisons with 1990 census data were included when feasible. It was hoped that these assessments, which largely addressed how well operations were performed, would provide sufficient information to conclude that adjusted counts did or did not improve the counts from the census process. In addition, the Census Bureau planned to take account of population estimates from demographic analysis, which historically had provided a comparison standard for the census.
What, then, were the reasons for the decision not to adjust? An important reason cited by the ESCAP report (Executive Steering Committee for A.C.E. Policy, 2001c) was the inconsistencies between the population estimates from the census, the A.C.E., and demographic analysis; those inconsistencies could not be resolved or explained with the available evaluation data within the time available for the decision.
The A.C.E. estimated as of March 2001 that the overall net undercount was only 1.2 percent of the population in 2000 (see Table 5.1)—a decrease from the revised PES estimate of a 1.6 percent net undercount in 1990. However, demographic analysis suggested that the undercount had been reduced even more than was estimated by the A.C.E. The Census Bureau’s initial demographic analysis estimate (as of January 2001) indicated that the 2000 census resulted in a slight (0.7 percent) net overcount of the population and that the A.C.E. overstated the population by even more. Even when the Bureau adjusted the demographic analysis estimate upward in March 2001 to allow for a larger number of undocumented immigrants than were part of the base estimate, the alternate demographic analysis estimate of the 2000 net undercount was only 0.3 percent of the population (Table 5.1).
Table 5.1 Alternative Estimates of the Population and the Percentage Net Undercount, April 2000 (Original March 2001 A.C.E., Base DA, Alternate DA)
|
Source |
Population (in millions) |
Estimate of Percentage Net Undercount |
|
Census Count |
281.4 |
— |
|
A.C.E. Estimate (Original, March 2001) |
284.7 |
1.15 |
|
Base Demographic Analysisa |
279.6 |
–0.65 |
|
Alternate Demographic Analysisb |
282.3 |
0.32 |
|
NOTES: All estimates include the household population (273.6 million people), the group quarters population (about 7.3 million people), and people enumerated in special operations not included in the A.C.E. (e.g., the remote Alaska enumeration). The percentage net undercount is calculated as the population estimate minus the census count divided by the estimate. Minus sign (–) indicates a net overcount of the population. a The base demographic analysis estimate was made available in January 2001; it assumes about 6.0 million undocumented immigrants living in the United States under age 65 in April 2000—3.3 million from the 1990 DA estimate plus a net increase during the 1990s of 2.7 million. b The alternate demographic analysis estimate was made available in March 2001; it assumes a net increase in illegal immigration during the 1990s of 5.4 million for a total of 8.7 million undocumented immigrants as of April 2000. SOURCE: Robinson (2001a:Table 3). |
||
In addition to the discrepancies between the A.C.E., demographic analysis, and census results, the ESCAP report cited several areas of concern about A.C.E. operations that might have affected dual-systems estimation as reasons for recommending against adjustment for redistricting purposes. It questioned the level of balancing error that may have occurred in the targeted extended search procedure. (Balancing error occurs when different criteria, such as different areas of search, are used in processing the P-sample and E-sample.) It also questioned the level of synthetic error that may have occurred for the poststrata DSE estimates. (Synthetic error occurs when the people included in a poststratum—who are intended to have the same likelihood of being included in the census or the A.C.E.—are in fact not sufficiently similar in this respect.) The report also considered the late additions to the census and cases of people who required whole-person (or whole-household)
imputation. Neither of these groups could be included in the A.C.E. There were substantially more such people in 2000 than in 1990, but the report concluded they probably did not affect the DSE estimates. Census Bureau staff also expressed concern about the relatively low numbers of certain types of erroneous enumerations measured in the A.C.E. compared with the 1990 PES—specifically, the A.C.E. found only about two-fifths the number of duplicates and “other residence” erroneous enumerations as were measured in the PES.
The Census Bureau had always planned a longer-term evaluation program, in addition to the short-term evaluations that were feasible to carry out before March 1, 2001. The Bureau proposed to expedite several evaluations on the longer-term agenda and carry out additional evaluations to help reach a second decision by October 15 on whether to recommend adjustment of census population estimates for such purposes as allocation of federal program funds (Executive Steering Committee for A.C.E. Policy, 2001a).
Panel’s Assessment
The panel, in its second letter report issued November 2000 (National Research Council, 2000b:2, reproduced in Appendix A), commented on the Census Bureau’s evaluation process for the March 2001 decision as follows:
The planned analyses appear to cover all of the evaluations that can reasonably be expected to be completed within the time available. Furthermore, they appear to be sufficiently comprehensive that they will likely provide support for a reasonably confident decision on adjustment in March.
However, since the numbers themselves, which are, of course, critical to the evaluation process, are not yet available, it is not possible at this time to comment on what the adjustment decision should be nor to conclude definitively that the planned short-term evaluations will be adequate to support the decision.
As it turned out, the Bureau concluded that the evaluation studies did not provide sufficient information to decide that adjusted counts would be clearly preferable to unadjusted counts for redistricting. Although not mentioned by the Census Bureau, reaching a conclusion on this point is more difficult when the adjustments to be made for population groups are generally small. A small (or
zero) net undercount for the population as a whole is not a reason for or against adjustment because net undercounts can mask sizable gross errors of omissions and erroneously included enumerations. The issue is how the balance between these components of error differs among population groups and geographic areas, resulting in different net undercount rates.
The panel did not necessarily agree with the weight that the Bureau gave to each factor in its decision: specifically, the panel concluded that demographic analysis estimates were sufficiently uncertain that they should not be used as a definitive standard for evaluation. Nonetheless, the panel agreed that the Bureau followed a reasonable process. It also concluded that the Bureau’s decision not to recommend adjusting the census data in March was justified, given that additional evaluations of the quality of the A.C.E.—and of the census itself—were needed to resolve the Bureau’s concerns.
5–D.3 October 2001 Adjustment Decision
On October 17, 2001, the Census Bureau recommended that unadjusted data from the 2000 census enumeration process should be used for the allocation of federal funds and other purposes. The Bureau released extensive evaluation materials to accompany its decision; the Bureau’s decision document and supporting materials are archived at http://www.census.gov/dmd/www/EscapRep2.html [1/10/04]. Completed evaluations of the A.C.E. covered studies of person duplication, the accuracy of information on which E-sample cases were classified as correct or erroneous enumerations, the accuracy of information on which P-sample cases were classified as matches or nonmatches, the targeted extended search, classifying movers in the P-sample, and imputation for unresolved status. The Census Bureau also released revised demographic analysis estimates for 2000 and 1990 with accompanying documentation (Robinson, 2001b).
Census Bureau’s Basis for Its Decision
The additional evaluations of the A.C.E. conducted by Bureau staff in summer 2001—while not complete—made it clear that there were considerably more errors of overcounting (erroneous enumerations) in the census than were originally estimated by the A.C.E.
The evaluations suggested that because the A.C.E. did not identify a substantial number of these overcounting errors (mostly duplicates), the use of the original A.C.E. data to adjust the census could lead to overstating the population. Therefore the Census Bureau recommended against adjustment of the 2000 complete-count and long-form-sample data used for fund allocation and other purposes (Executive Steering Committee for A.C.E. Policy, 2001b).
Two principal evaluations of the E-sample identified problems with the classification of erroneous enumerations in the A.C.E. The first was the Evaluation Follow-up Study (EFU), in which field staff, using a more detailed interview than in the original A.C.E., revisited a subsample of the E-sample housing units in one-fifth of the A.C.E. block clusters to determine who should have been counted there. The EFU subsample was about 70,000 people; it was subsequently reduced to 17,500 people for a detailed clerical review that focused on unresolved cases (Adams and Krejsa, 2001; Krejsa and Raglin, 2001). The second evaluation was the Person Duplication Studies, which included computer matching of E-sample records by name and date of birth to census enumerations nationwide. This matching could be conducted because optical character recognition technology used by the Bureau for the first time in 2000 to process the questionnaires made it feasible to include names on all of the computerized sample records. The results of the EFU clerical review and the Person Duplication Studies were combined to develop an estimate of 2.9 million duplicates and other erroneous enumerations in the census that were not measured in the original A.C.E. (Fay, 2001). Such cases included college students who were counted both at their college dormitory and at their parents’ household; prisoners who were counted both at prison and at their family’s residence; children in joint custody who were counted in the homes of both parents; and people with more than one house, such as those who lived part of the year in the South or West and the rest of the year in the North or Midwest.
Estimated Effects of Unmeasured Erroneous Enumerations on Net Undercount
The results of Fay (2001) were used by Thompson et al. (2001) to construct revised preliminary estimates of the 2000 net undercount.
Unlike the original A.C.E., the revised figures were not built up from estimates for individual poststrata, but were constructed at an aggregate level for the total population and three race/ethnicity groups—non-Hispanic blacks, Hispanics, and all other.5 The calculations were based on an assumption that a factor for duplicates not detected by the computer matching applied equally to all race/ethnicity groups. They were based on other simplifying assumptions as well, such as that P-sample errors were not likely to affect the dual-systems estimate of the population.
Thompson et al. (2001:1) termed the revised estimates an “early approximation” of the likely effects on the estimated net undercount that might result from a corrected A.C.E. These estimates showed a reduction in the estimated net undercount of the total population in 2000 from 1.2 percent (March estimate) to 0.1 percent (October estimate) and a narrowing of the differences in net undercount rates for blacks and Hispanics compared with all others (Table 5.2).
Revised Demographic Analysis Estimates
The revised demographic analysis estimate of the total net undercount in 2000 (see Table 5.3) was virtually the same as the revised A.C.E. estimate—0.1 percent of the population. The revisions to the demographic analysis estimates incorporated additional information for estimating net immigration (particularly illegal immigration) from the 2000 census itself (the long-form sample) and the Census 2000 Supplementary Survey. It also reflected new assumptions about the extent of undercount of legal immigrants and the completeness of birth registration. Some of these changes increased the DA population estimates; others decreased them (see Robinson, 2001b).
Table 5.2 Alternative Survey-Based Estimates of Percentage Net Undercount of the Population, April 2000 (Original A.C.E. and Preliminary Revised A.C.E.) and April 1990 (Revised PES) (standard error percents in parentheses)
|
|
2000 Estimates |
|
|
|
Category |
Original A.C.E. (March 2001)a |
Revised Early Approximation (October 2001)b |
Revised 1990 PES Estimatec |
|
Total Population |
1.18 (0.13) |
0.06 (0.18) |
1.61 (0.20) |
|
Black, non-Hispanic |
2.17 (0.35) |
0.78 (0.45) |
4.57 (0.55) |
|
Hispanic |
2.85 (0.38) |
1.25 (0.54) |
4.99 (0.82) |
|
All Other |
0.73 (—) |
−0.28 (—) |
0.68 (—) |
|
NOTES: Net undercount rates calculated as the estimate—from the A.C.E. or the PES—minus the census count divided by the estimate. The census count of the population in 2000 was 281.4 million; the census count in 1990 was 248.7 million.—, not available. a Data from Thompson et al. (2001:Table 1, col. 1); see also U.S. Census Bureau (2003c:Table 1). Includes household population. Race/ethnicity defined according to the domain specifications for the A.C.E. (see Appendix E). b Data from Thompson et al. (2001:Table 1, col. 3); see also U.S. Census Bureau (2003c:Table 1). Includes household population. Race/ethnicity defined according to the domain specifications for the A.C.E. (see Appendix E). Takes the A.C.E. estimates of percentage net undercount and subtracts adjustments estimated by Fay (2001:Table 9) for additional unmeasured erroneous enumerations, including an assumption that computer matching was 75.7 percent efficient in identifying duplicates. c Data from Hogan (2001a:Table 2b); see also Hogan (1993:Table 3). Includes household and noninstitutional group quarters population. Race/ethnicity definitions are not strictly comparable with 2000; “all other” is white and some other race, not Hispanic. The “revised” estimate is that developed by the Committee on Adjustment of Postcensal Estimates in August 1992 (published estimates from the committee—see Thompson [1992]—are for the total population and so may differ from the estimates shown). |
|||
Panel’s Assessment
The revised A.C.E. estimates released in October 2001 were based on preliminary analysis of small subsets of the A.C.E. data and incorporated a number of simplifying assumptions. They could not serve as the basis of an adjustment. The original A.C.E. estimates could not serve as the basis of an adjustment either, as they were most likely to overstate the population. It should be noted, however, that the evaluation work focused on identifying additional census erroneous enumerations not measured in the A.C.E. There was no similarly intensive effort to identify additional omissions not
Table 5.3 Alternative Demographic Analysis Estimates of Percentage Net Undercount of the Population, April 2000 (Base, Alternate, and Revised DA) and April 1990 (Base and Revised DA)
|
|
2000 Estimates |
1990 Estimatesa |
|||
|
Category |
Base (1991) |
Revised (Oct. 2001) |
|||
|
Total Population |
−0.65 |
0.32 |
0.12 |
1.85 |
1.65 |
|
Black |
2.80 |
3.51 |
2.78 |
5.68 |
5.52 |
|
All Other |
−1.19 |
−0.17 |
−0.29 |
1.29 |
1.08 |
|
NOTES: Net undercount rates are calculated as the estimate from demographic analysis minus the census count divided by the estimate. The census count of the population in 2000 was 281.4 million; the census count in 1990 was 248.7 million. Minus sign (−) indicates a net overcount of the population. a Data from Robinson (2001b:Table 2). Includes household and group quarters population. Base is the estimate developed following the 1990 census; “revised” is the October 2001 estimate, with revisions to such components as births. b Data from Robinson (2001a:Table 6; 2001b:Table 2). Includes household and group quarters population. The estimates by race are an average of estimates calculated using two different tabulations of the census. “All other” includes Hispanics not classified as black. c “Base” is the original January 2001 estimate, including an allowance for 6 million illegal immigrants—3.3 million from the 1990 demographic analysis estimate and a net increase of 2.7 million over the decade, extrapolated from estimates that mainly reflect changes between 1992 and 1996. d “Alternate” is the March 2001 estimate, including an allowance for 8.7 million illegal immigrants. This estimate was developed as an illustrative alternative to the base estimate when it became apparent that the latter probably underestimated illegal immigration. The alternate estimate reflects an assumed doubling of the net increase in illegal immigrants in the 1990s—from 2.7 to 5.4 million. e “Revised” is the October 2001 estimate, which revises several components, including births and legal and illegal immigration. |
|||||
measured in the A.C.E. An attempt to account for such omissions through the use of sex ratios from demographic analysis was part of the Revision II estimation (see Section 6-B.5).
From the work done for the October 2001 A.C.E. estimates, our panel concluded in its third letter report, issued November 26, 2001 (reprinted in National Research Council, 2001a:3–14), that the Census Bureau’s decision not to adjust the census at that time was justified. The panel urged the Census Bureau to complete the research necessary to develop reliable revised estimates of the net coverage errors in the census, particularly for population groups, in order to determine whether their use would improve the Bureau’s population estimates that are regularly produced during the postcensal
period and are used for many purposes. The Bureau agreed to reestimate the A.C.E. by the end of 2002 and announce a decision about possible adjustment of postcensal estimates shortly thereafter. We describe and evaluate that work, which produced the final Revision II A.C.E. estimates of the population, in Chapter 6.
The panel also commented in its third letter report on the revised demographic population estimates for 2000 (reprinted in National Research Council, 2001a:11):
We commend the Bureau for its work to examine each component of demographic analysis. However, its revised estimates of the immigration component are not independent of the census, and the estimates for births and immigration incorporate assumptions that are based primarily on expert judgment. Such judgments may be reasonable, but they retain sufficient uncertainty so that it is not appropriate to conclude that the revised demographic analysis estimates are more accurate than the census.
In Chapter 6, we comment on the role of demographic analysis and a revised A.C.E.-type coverage evaluation program for assessing coverage of the population in 2010.


