
4
Water
SUMMARY
Water is the largest single constituent of the human body and is essential for cellular homeostasis and life. Total water intake includes drinking water, water in beverages, and water that is part of food. Although a low intake of total water has been associated with some chronic diseases, this evidence is insufficient to establish water intake recommendations as a means to reduce the risk of chronic diseases. Instead, an Adequate Intake (AI) for total water is set to prevent deleterious, primarily acute, effects of dehydration, which include metabolic and functional abnormalities.
The primary indicator of hydration status is plasma or serum osmolality. Because normal hydration can be maintained over a wide range of water intakes, the AI for total water (from a combination of drinking water, beverages, and food) is set based on the median total water intake from U.S. survey data. The AI for total water intake for young men and women (ages 19 to 30 years) is 3.7 L and 2.7 L per day, respectively.1 Fluids (drinking water and beverages) provided 3.0 L (101 fluid oz; ≈ 13 cups) and 2.2 L (74 fluid oz; ≈ 9 cups) per day for 19- to 30-year-old men and women, respectively, representing approximately 81 percent of total water intake in the U.S. survey. Water contained in food provided ap-
proximately 19 percent of total water intake. Canadian survey data indicated somewhat lower levels of total water intake. As with AIs for other nutrients, for a healthy person, daily consumption below the AI may not confer additional risk because a wide range of intakes is compatible with normal hydration. In this setting, the AI should not be interpreted as a specific requirement. Higher intakes of total water will be required for those who are physically active or who are exposed to hot environments.
Over the course of a few hours, body water deficits can occur due to reduced intake or increased water losses from physical activity and environmental (e.g., heat) exposure. However, on a day-to-day basis, fluid intake, driven by the combination of thirst and the consumption of beverages at meals, allows maintenance of hydration status and total body water at normal levels.
Because healthy individuals have considerable ability to excrete excess water and thereby maintain water balance, a Tolerable Upper Intake Level (UL) was not set for water. However, acute water toxicity has been reported due to rapid consumption of large quantities of fluids that greatly exceeded the kidney’s maximal excretion rate of approximately 0.7 to 1.0 L/hour.
BACKGROUND INFORMATION
Water, which is the solvent for biochemical reactions, has unique physical properties (e.g., high specific heat) to absorb metabolic heat within the body. Water is also essential for maintaining vascular volume and serves as the medium for transport within the body by supplying nutrients and removing waste. In addition, cell hydration has been has been suggested to be an important signal to regulate cell metabolism and gene expression (Haussinger et al., 1994). Daily water intake must be balanced with losses in order to maintain total body water. Body water deficits challenge the ability to maintain homeostasis during perturbations (e.g., sickness, physical exercise, and environmental exposure) and can affect function and health. In very unusual circumstances, excess consumption of hypotonic fluids and low sodium intake may lead to excess body water, resulting in hyponatremia and cellular edema.
Despite the importance of adequate water intake, there is confusion among the general public and health care providers on the amount of water that should be consumed (Valtin, 2002), in part because of misinterpretation of previous recommendations (NRC, 1989).
BODY WATER
Fat-Free Mass
Body water volume, as a percentage of fat-free mass, is highest in infants and declines in older children (Fomon, 1967; Van Loan and Boileau, 1996). High body water volume is particularly evident in newborns, whose body water content of fat-free mass may exceed 75 percent (Fomon, 1967). Infants also have a relatively higher water content in the extracellular compartment and a lower water content in the intracellular compartment compared with older children (Van Loan and Boileau, 1996). Figure 4-1 presents total body water as a percentage of fat-free mass and body mass in children through the teenage years. Total body water as percentage of fat-free mass decreases during childhood, albeit more slowly than in infancy.
For adults, fat-free mass is approximately 70 to 75 percent water, and adipose tissue is approximately 10 to 40 percent water. With increasing fatness, the water fraction of adipose tissue decreases (Martin et al., 1994). Figures 4-2 and 4-3 provide the percentage of
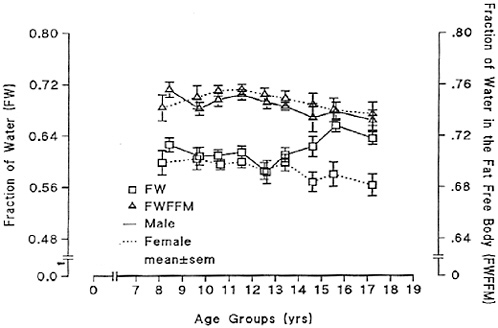
FIGURE 4-1 Total body water as a fraction of body mass (FW) and as a fraction of fat-free mass (FWFFM). Reprinted with permission, from Van Loan and Boileau (1996). Copyright 1996 by CRC Press.
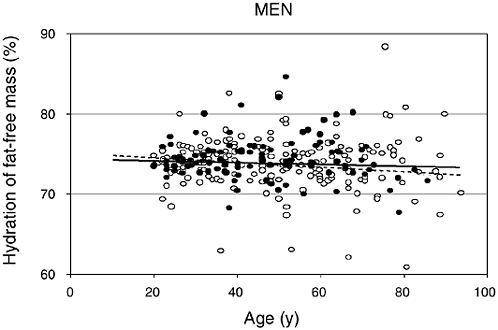
FIGURE 4-2 Hydration of fat-free mass in relation to age for 95 African-American (closed circles) and 204 white (open circles) men. Reprinted with permission, from Visser and Gallagher (1998). Copyright 1998 by John Libbey Eurotext.
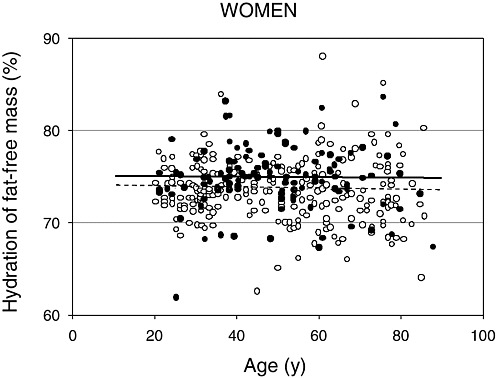
FIGURE 4-3 Hydration of fat-free mass in relation to age for 99 African-American (closed circles) and 270 white (open circles) women. Reprinted with permission, from Visser and Gallagher (1998). Copyright 1998 by John Libbey Eurotext.
water (tritiated water) in fat-free mass measured by dual energy X-ray absorptiometry (DEXA) in relation to age for men and women, respectively (Visser and Gallagher, 1998; Visser et al., 1997). Note that individual variation exists for the hydration of fat-free tissue and values remain relatively stable with increasing age. Neither ethnicity nor gender altered the hydration of fat-free mass. Similar values were reported for whites (men = 74 percent, women = 74 percent) and African Americans (men = 75 percent, women = 75 percent). Other investigators have supported the observation that age and gender do not markedly alter the hydration of fat-free mass in adults (Baumgartner et al., 1995; Goran et al., 1994; Mazariegos et al., 1994).
Total Body Water
Total body water (TBW), comprising extracellular fluid (ECF) and intracellular fluid (ICF), averages approximately 60 percent of body weight, with a range from approximately 45 to 75 percent (Altman, 1961). Variability in TBW is primarily due to differences in body composition. TBW is usually measured by volume distribution of an appropriate indicator (e.g., antipyrine, deuterium oxide, tritium oxide). Table 4-1 provides TBW values for different age and gender groups based upon indicator dilution methods (Altman, 1961). Women and older persons have reduced TBW primarily because of having lower fat-free mass and increased body fat. Gender
TABLE 4-1 Total Body Water (TBW) as a Percentage of Total Body Weight in Various Age and Gender Groups
|
Lifestage |
TBW as a Percentage of Body Weight, Mean (range) |
|
0–6 mo |
74 (64–84) |
|
6 mo–1 yr |
60 (57–64) |
|
1–12 yr |
60 (49–75) |
|
Males, 12–18 yr |
59 (52–66) |
|
Females, 12–18 yr |
56 (49–63) |
|
Males, 19–50 yr |
59 (43–73) |
|
Females, 19–50 yr |
50 (41–60) |
|
Males, 51+ yr |
56 (47–67) |
|
Females, 51+ yr |
47 (39–57) |
|
SOURCE: Altman (1961). |
|
differences in TBW are not observed until after approximately 12 years of age (Novak, 1989), when boys start increasing their fat-free mass at a rate faster than girls do.
Athletes have relatively high TBW values by virtue of having a high fat-free mass, low body fat, and high skeletal muscle glycogen levels. High skeletal muscle glycogen levels increase the water content of fat-free tissue due to osmotic pressure exerted by glycogen granules within the muscle sarcoplasm (Neufer et al., 1991; Olsson and Saltin, 1970).
Distribution
Body water is distributed between the ICF and the ECF, which contain 65 and 35 percent of TBW, respectively. The ECF is further divided into the interstitial and plasma spaces. An average 70-kg man has approximately 42 L of total body water, 28 L of ICF, and 14 L of ECF, with the ECF comprising approximately 3 L of plasma and 11 L of interstitial fluid. These are not static volumes, but represent the net effects of dynamic fluid exchange with varying turnover rates between compartments (Guyton and Hall, 2000). Perturbations such as exercise, heat exposure, fever, diarrhea, trauma, and skin burns will greatly modify the net volumes and water turnover rates between these fluid compartments.
Exchange
Water exchange between the ICF and ECF depends on osmotic gradients. Water passes through membranes from regions of lower to higher solute concentration by osmosis, which attempts to equalize the concentration differences across the membrane. Cell membranes are freely permeable to water, but they are only selectively permeable to solutes. Water thus distributes across cell membranes to equalize the osmotic concentrations of extracellular and intracellular fluids. Although the two compartments contain different individual solute concentrations, the total equilibrium concentration of cations and anions is the same in each compartment as described by the Gibbs-Donnan equilibrium. In the ECF, the most abundant cation is sodium, while chloride and bicarbonate are the primary anions. These ions represent 90 to 95 percent of the osmotically active components of the ECF, and changes in their content alter the ECF volume. In the ICF, the most abundant cations are potassium and magnesium, while proteins are the primary anions. The marked differences in sodium and potassium concentrations be-
tween ICF and ECF are maintained by active transport-mediated ion pumps within cell membranes.
Water exchange between the intravascular and interstitial spaces occurs in the capillaries. Capillaries of different tissues have varied anatomic structures and therefore different permeability to water and solutes. The transcapillary forces that determine if net filtration (i.e., water leaving the vascular space) or net absorption (i.e., water entering the vascular space) will occur are hydrostatic and oncotic pressures. Oncotic pressure is the osmotic pressure attributed to serum protein concentration (e.g., serum albumin levels) differences across the capillary membrane. Generally, filtration occurs at the arterial end of the capillary, while absorption occurs at the venous end.
Incomplete fluid replacement resulting in decreased total body water affects each fluid space as a consequence of free fluid exchange (Costill and Fink, 1974; Durkot et al., 1986; Nose et al., 1983). The distribution of body water loss among the fluid spaces, as well as among different body organs during water deficit (dehydration or hypohydration), was determined in an animal model (Nose et al., 1983). The fluid deficit in rats thermally dehydrated by 10 percent of body weight was apportioned between the intracellular (41 percent) and extracellular (59 percent) spaces. Organ fluid loss was 40 percent coming from muscle, 30 percent from skin, 14 percent from viscera, and 14 percent from bone. Neither the brain nor liver lost significant water content. Various dehydration methods influence the partitioning of water loss from the fluid spaces (Mack and Nadel, 1996).
Determinants of Body Water Balance
Body water balance depends on the net difference between water gain and water loss. Water gain occurs from consumption (liquids and food) and production (metabolic water), while water losses occur from respiratory, skin, renal, and gastrointestinal tract losses. Water is normally consumed by mouth via liquid and food, and this mixture is digested and absorbed within the gastrointestinal tract. Therefore, water intake can be estimated from measured liquid volumes and tables of food composition. Water losses can be estimated from a variety of physiological and biophysical measurements and calculations (Adolph, 1933; Consolazio et al., 1963; Johnson, 1964). Depending upon a person’s age, health, diet, activity level, and environmental exposure, different physiological and biophysical methods can be used to quantify the water balance components. Table
TABLE 4-2 Estimation of Minimum Daily Water Losses and Productiona
4-2 displays estimated minimum losses and production of water (mL/day) in healthy sedentary adults, assuming conditions in which there is minimal water loss from thermoregulatory sweating. The following sections describe each source of water loss or production listed in this table.
Respiratory Water Loss
The amount of respiratory water loss, via evaporation within the lungs, is dependent on both the ventilatory volume and water vapor pressure gradient (Mitchell et al., 1972). Ventilatory volume is increased by physical activity, hypoxia, and hypercapnia, whereas the water vapor pressure is modified by the ambient temperature, humidity, and barometric pressure. Physical activity generally has a greater effect on respiratory water loss than do environmental factors. Daily respiratory water loss averages about 250 to 350 mL/day for sedentary persons, but can increase to 500 to 600 mL/day for active persons living in temperate2 climates at sea level (Hoyt and Honig, 1996). For these conditions, respiratory water loss (y = mL/day) can be predicted from metabolic rate (x = kcal/day) by the equation y = 0.107x + 92.2 (Hoyt and Honig, 1996). High altitude exposure (greater than 4,300 m, 448 mm Hg) can further increase respiratory water losses by approximately 200 mL/day (Hoyt and Honig, 1996).
Ambient air temperature and humidity modify respiratory water losses. Breathing hot, dry air during intense physical exercise can increase respiratory water losses by 120 to 300 mL/day (Mitchell et al., 1972). Breathing cold, dry air during rest and stressful physical exercise (Table 4-3) can increase respiratory water losses by approximately 5 mL/hour and approximately 15 to 45 mL/hour, respectively (Freund and Young, 1996). Freund and Young (1996) have calculated that for a 24-hour military scenario (8 hours of rest, 12 hours of moderate activity, and 4 hours of moderate-heavy activity), the respiratory water losses increase by approximately 340 mL/day when breathing −20°C versus +25°C air.
Urinary and Gastrointestinal Water Loss
The kidneys are responsible for regulating the volume and composition of the ECF via a series of intricate neuroendocrine pathways (Andreoli et al., 2000). Renal fluid output can vary depending upon the specific macronutrient, salt, and water load. However, for persons consuming an average North American diet, some of these effects may not be discernable (Luft et al., 1983). Since there is a limit to how much the kidneys can concentrate urine, the minimal amount of water needed is determined by the quantity of end products that need to be excreted (e.g., creatinine, urea). On typical Western diets, an average of 650 mOsmol of electrolytes and other
TABLE 4-3 Influence of Breathing Cold Air and of Metabolic Rate on Respiratory Water Losses
|
Temperature |
Relative Humidity (%) |
Water Vapor Pressure (mm Hg) |
Metabolic Rate (Watts) |
Respiratory Water Loss (mL/h) |
|
|
°F |
°C |
||||
|
77 |
25 |
65 |
15 |
Rest (100) |
≈ 10 |
|
32 |
0 |
100 |
5 |
Rest (100) |
≈ 13 |
|
−4 |
−20 |
100 |
1 |
Rest (100) |
≈ 15 |
|
77 |
25 |
65 |
15 |
Light-moderate (300) |
≈ 30 |
|
32 |
0 |
100 |
5 |
Light-moderate (300) |
≈ 40 |
|
−4 |
−20 |
100 |
1 |
Light-moderate (300) |
≈ 45 |
|
77 |
25 |
65 |
15 |
Moderate-heavy (600) |
≈ 60 |
|
32 |
0 |
100 |
5 |
Moderate-heavy (600) |
≈ 80 |
|
−4 |
−20 |
100 |
1 |
Moderate-heavy (600) |
≈ 90 |
|
SOURCE: Reprinted with permission, from Freund and Young (1996). Copyright 1996 by CRC Press. |
|||||
solutes must be excreted per day to maintain electrolyte balance; thus, if the urine is maximally concentrated (Uosm approximately 1,200 mOsmol/kg water), the minimum urine output is approximately 500 mL/day. For dehydrated subjects living in hot weather, minimum daily urine outputs can be less than 500 mL/day (Adolph, 1947b).
Urine output generally averages 1 to 2 L/day but can reach 20 L/day in those consuming large quantities of fluid (West, 1990). Healthy older individuals, however, cannot concentrate urine as well as young individuals and thus have a higher minimum urine output. For example, older men and women (mean age 79 years) had lower maximal urine osmolalities of 808 and 843 mOsm/kg, respectively, compared with 1,089 mOsm/kg for young men (mean age 24 years). This corresponds to higher minimum urine outputs of 700 and 1,086 mL/day for the older men and women compared with 392 mL/day for the young men (Dontas et al., 1972).
Urine output varies inversely with body hydration status. Figure 4-4 depicts the hyperbolic relationship between urine output and
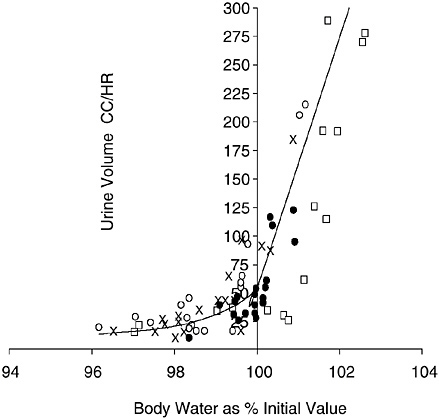
FIGURE 4-4 Relation of urine output to body hydration status. Reprinted with permission, from Lee (1964). Copyright 1964 Handbook of Physiology, Section 4, American Physiological Society.
body hydration status: one asymptote ascends steeply with hyperhydration, while the other descends gradually with dehydration (Lee, 1964). The apex of this hyperbolic relationship approximates a urine output of approximately 50 mL/hour. The extremes depicted in Figure 4-4 can be exceeded. For example, investigators have reported that urine output can transiently increase to approximately 600 to 1,000 mL/hour with water loading (Freund et al., 1995; Noakes et al., 2001; Speedy et al., 2001) and decrease to approximately 15 mL/hour with dehydration (Adolph, 1947b). Urine output can vary widely to maintain total body water; however, there are clearly limits to the amount of conservation and excretion.
Physical activity and climate also affect urine output. Exercise and heat strain will reduce urine output by 20 to 60 percent (Convertino, 1991; Mittleman, 1996; Zambraski, 1996), while cold and hypoxia will increase urine output (Freund and Young, 1996; Hoyt and Honig, 1996).
Gastrointestinal and thus fecal water loss in healthy adults is approximately 100 to 200 mL/day (Newburgh et al., 1930).
Insensible and Sweat Losses
Water loss through the skin occurs via insensible diffusion and secreted sweat. For the average adult, loss of water by insensible diffusion is approximately 450 mL/day (Kuno, 1956). During heat stress, eccrine sweat glands secrete sweat onto the skin surface, which cools the body when water evaporates from the sweat. In hot weather, sweat evaporation provides the primary avenue of heat loss to defend the body’s core temperature. When a gram of sweat water is vaporized at 30°C, 2.43 kJ (0.58 kcal) of heat becomes kinetic energy (latent heat of evaporation) (Wenger, 1972). For a given hot weather condition, the required sweating rate for evaporative cooling is dependent upon the physical activity level (metabolic rate).
The following calculations provide the minimal sweat produced by persons performing moderately heavy (metabolic rate ≈ 600 W) exercise in the heat (Sawka et al., 1996a). If the activity is 20 percent efficient, the remaining 80 percent of metabolic energy produced is converted to heat in the body so that 480 W (0.48 kJ/second, or 28.8 kJ/minute or 6.88 kcal/minute) need to be dissipated to avoid heat storage. The specific heat of body tissue (amount of energy required for 1 kg of tissue to increase temperature by 1°C) approximates 3.5 kJ (0.84 kcal)/kg/°C. For example, a 70-kg man has a heat capacity of 245 kJ (59 kcal)/°C, and a 50-kg woman has a heat capacity of 173
kJ (41 kcal)/°C. If these persons performed exercise in a hot environment that enabled only evaporative heat loss and they did not sweat, their body temperatures would increase by approximately 1.0°C every 8.5 min for the man (245 kJ/°C ÷ 28.8 kJ/minute or 59 kcal/°C ÷ 6.88 kcal/minute) and every 6 minutes for the woman (173 kJ/°C ÷ 28.8 kJ/minute or 41 kcal/°C ÷ 6.88 kcal/minute). Since the latent heat of evaporation is 2.43 kJ/g (0.58 kcal/g), such persons would need to evaporate approximately 12 g of sweat per minute (28.8 kJ/minute ÷ 2.43 kJ/g or 6.88 kcal/minute ÷ 0.58 kcal/ g) or 0.72 L/hour. Because secreted sweat drips from the body and is not evaporated, higher sweat secretions are often needed to achieve these cooling demands. If a person is physically active and exposed to environmental heat stress, sweat losses to avoid heat storage can be substantial over a 24-hour period.
For persons living in hot climates, daily sweat losses often exceed several liters. As described above, daily sweat losses are determined by the evaporative heat loss requirements, which are influenced by the metabolic rate (above example) and environment. The environmental factors that modify sweat losses include clothing worn, ambient temperature, humidity, air motion, and solar load. Therefore, considerable variability will exist for daily sweat losses among different people. Figure 4-5 provides the distribution of daily sweat-
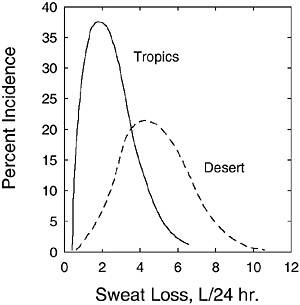
FIGURE 4-5 Distribution of daily sweating rates for active soldiers in desert and tropical climates. Percent incidence refers to the percentage of the subject population achieving the given daily sweat loss.
SOURCE: Molnar (1947). Reprinted with permission from the Papers of Edward Adolph collection at the Edward G. Miner Library, University of Rochester Medical Center.
ing rates for soldiers living in desert and tropical climates (without air conditioning). The average daily sweat loss for 97 men in the desert was 4.9 L; for 26 men in the tropics, it was 2.3 L. The lower daily sweat losses in the tropics were probably due to lower ambient temperatures and lower solar load (both acting to lower the required evaporative cooling), as the precise activity levels of both groups were unknown.
Metabolic Water Production
Metabolic water is formed by oxidation of hydrogen-containing substrates during metabolism or energy-yielding nutrients. Oxidation of carbohydrate, protein, and fat produces metabolic water of approximately 15, 10.5, and 11.1 g/100 kcal of metabolizable energy, respectively (Lloyd et al., 1978). Therefore, metabolic water production is proportional to the energy expenditure with a small adjustment for the substrate oxidized. Figure 4-6 shows the metabolic water production relative to daily energy expenditure for persons eating a mixed diet (Hoyt and Honig, 1996). If the regression line in Figure 4-6 is extrapolated to the daily energy expenditures of ≈ 2,500 kcal/day, the metabolic water production will approximate 250 mL/day. Therefore, a reasonable estimate of daily metabolic
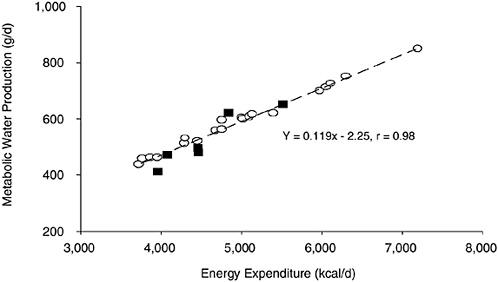
FIGURE 4-6 Metabolic water production relative to daily energy expenditure. Reprinted with permission, from Hoyt and Honig (1996). Copyright 1996 by CRC Press.
water production is an average of approximately 250 to 350 L/day for sedentary persons—but which can increase to 500 to 600 mL/ day for physically active persons (Hoyt and Honig, 1996). Hence, respiratory water losses are roughly equivalent to, or offset by, metabolic water production (Table 4-2; Hoyt and Honig, 1996). Metabolic water, a by-product of metabolizing energy-yielding nutrients from foods into carbon dioxide and energy, does not include the water present in a foodstuff itself. This is considered compositional water, or moisture. It is often determined analytically as the difference in weight of a food item before and after drying to a constant weight.
Consumption
Fluid is consumed in the form of food and beverages, and, regardless of form, is absorbed by the gastrointestinal tract and acts the same physiologically. In one survey of the adult U.S. population (1977–1978 Nationwide Food Consumption Survey), total water intake was approximately 28 percent from foods, 28 percent from drinking water, and 44 percent from other beverages (Ershow and Cantor, 1989). National survey data for adults (Appendix Tables D-1, D-3, and D-4) likewise suggest that approximately 20 percent of water comes from food, and the remaining 80 percent comes from fluids.
Drinking induced by water deprivation is homeostatic (Greenleaf and Morimoto, 1996). Other factors (e.g., social, psychological) that influence drinking behavior are nonregulatory (Rolls and Rolls, 1982). Over an extended period, fluid consumption will match body water needs (if adequate amounts are available). However, mismatches can occur over short periods (Johnson, 1964). The fluid intake for healthy adults can vary markedly depending on activity level, environmental exposure, diet, and social activities; nonetheless, for a given set of conditions, intake is reproducible within persons (Johnson, 1964). Therefore, it is reasonable to assume that for large population studies of apparently healthy individuals, the fluid volume consumed is equal to or greater than body water needs.
METHODS FOR ESTIMATING WATER REQUIREMENTS
Water Balance
Water balance is regulated within ± 0.2 percent of body weight over a 24-hour period for healthy adults at rest (Adolph, 1943).
Adolph (1943) described the rates of water gain and water loss relative to different levels of water deficit and excess. Induced water deficits or water excesses resulted in compensatory changes in water gains and water losses until water balance was reestablished. Likewise, Newburgh and colleagues (1930) demonstrated the accuracy of water balance studies to be within 0.5 percent of the water volume. Therefore, ad libitum water balance studies can be used to estimate daily water requirements, provided the subjects have adequate time for rehydration and physiologic compensation (Adolph, 1943; Newburgh et al., 1930). In both these studies, total water intake was measured.
Table 4-4 presents water balance studies that have estimated daily total water requirements for infants and children. Note that daily total water requirements increase with age from early infancy (approximately 0.6 L) through childhood (approximately 1.7 L). Since infants have rapid growth, some investigators express the daily water needs relative to body mass.
The minimal daily water requirement depends upon the person’s diet, environment, and activity level. After reviewing early water balance studies, Adolph (1933) concluded that for most adult men,
TABLE 4-4 Estimation of Daily Water Requirements of Infants and Children from Water Balance Studies
|
Reference |
Subjects (age) |
Conditions |
Total Volume Intake, L/d (mL/kg/d) |
Total Water Intake, L/d (mL/kg/d) |
|
Goellner et al., 1981 |
|
Normal activity |
|
|
|
15 infants |
10 studies, 0–1 mo |
|
0.66 (184) |
0.56 (156)a |
|
|
9 studies, 1–2 mo |
1.00 (199) |
0.85 (170) |
|
|
14 studies, 2–4 mo |
0.94 (161) |
0.79 (137) |
||
|
18 studies, 4–6 mo |
1.13 (162) |
0.96 (138) |
||
|
39 studies, 6–12 mo |
1.31 (158) |
1.11 (135) |
||
|
24 studies, 12–18 mo |
1.57 (146) |
1.33 (124) |
||
|
21 studies, 18–24 mo |
1.55 (129) |
1.32 (110) |
||
|
15 studies, 24–32 mo |
1.62 (117) |
1.38 (99) |
||
|
Ballauff et al., 1988 |
21 children, 6–11 yr |
Normal activity |
|
≈ 1.7 for boys |
|
≈ 1.5 for girls |
||||
|
a Goellner et al. (1981) estimated that water accounted for 85 percent or more of the determined volume intake. Thus total water intake was calculated as 85 percent of total volume intake. |
||||
the minimal, average, and liberal water requirements approximated 2.1, 3.4, and 5.0 L/day, respectively. In addition, Adolph (1933) concluded that a convenient “liberal standard” for total water intake is 1 mL/kcal expended. Subsequent studies by Johnson (1964) recommended minimum daily water requirements of no less then 0.91 L for survival conditions and 3.0 L for hot weather.
Table 4-5 presents water balance studies that have estimated daily total water requirements for adults. These requirements are above minimal levels because some physical activity (although usually nominal) was allowed and because individuals self-selected the volume of consumed fluids (i.e., ad libitum water consumption). For the prolonged bed-rest studies, greater emphasis was placed on data obtained during the initial week, if available. Water balance studies suggest that the required water intake to maintain water balance for resting adult men is approximately 2.5 L/day (Adolph, 1933; Newburgh et al., 1930). If modest physical activity is performed, the
TABLE 4-5 Estimation of Daily Water Requirements of Adults from Water Balance Studies
|
Reference |
Subjects |
Conditions |
Total Water Intake (L/d) |
|
Women |
|
||
|
Yokozawa et al., 1993 |
3 women |
Temperate, bed-rest |
≈ 1.6 |
|
Men |
|
||
|
Newburgh et al., 1930 |
Repeated studies of men |
Temperate, rest, variety of diets |
≈ 2.6 |
|
Welch et al., 1958 |
53 men |
Active, ambient temperature range of −30°C to +30°C |
≈ 3.0 at −20°C to +20°C ≈ 6.0 at +30°C |
|
Consolazio et al., 1967 |
6 men |
Temperate, rest, starvation study |
≈ 2.5 (1st 4 d; ~ 3.4 if corrected for negative balance) |
|
Consolazio et al., 1968 |
24 men |
Temperate, rest, sea level controls |
≈ 2.5 |
|
Greenleaf et al., 1977 |
7 men |
Temperate, bed-rest with 1 h of exercise/d |
≈ 3.2 |
|
Gunga et al., 1993 |
6 men |
Temperate, hyperbaric (1.5 atmospheres absolute), sedentary |
≈ 3.2 |
water intake requirements increase to approximately 3.2 L/day (Greenleaf et al., 1977; Gunga et al., 1993). Cold exposure did not alter intake, but heat stress increased total daily water intake (Welch et al., 1958).
Limited data were available for women. Women are physically smaller, thus they probably have lower water requirements due to lower metabolic expenditures. A study of three Japanese women (likely smaller than average U.S. adult women) indicated a water intake requirement of approximately 1.6 L/day (Yokozawa et al., 1993).
Water Turnover
Water turnover studies have been conducted to evaluate water needs and assume a balance between influx and efflux (Nagy and Costa, 1980). Rates of body water turnover can be determined by administering a drink with deuterium (D2O) or tritium (3H2O) labeled water and then following the decline (or disappearance) in hydrogen isotope activity over time. The isotope activity declines because of loss of the labeled water via excretion, evaporation, and dilution from intake of unlabeled water. If proper procedures are employed, these measurements will yield values within 10 percent or less of actual water flux (Nagy and Costa, 1980).
Figure 4-7 provides data on the daily water turnover for infants and children (Fusch et al., 1993). Water turnover (when expressed
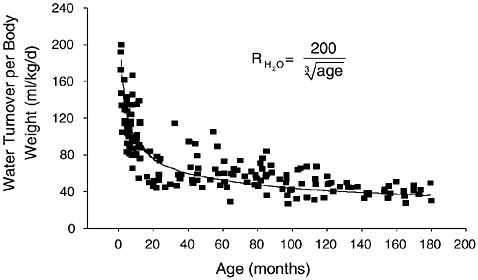
FIGURE 4-7 Daily water turnover per kg of body weight in infants and children. Reprinted with permission, from Fusch et al. (1993). Copyright 1993 by Springer-Verlag.
per kg of body weight) is highest during the first weeks of life and declines by some 40 percent during infancy. It declines further, but at a slower pace during childhood and adolescence. In a German study, mean water turnover at ages 1 to 3 months was 160 mL/kg/ day, compared with 97 mL/kg/day at ages 10 to 12 months, and 40 mL/kg/day at ages 13 to 15 years (Fusch et al., 1993). Daily fluid intake in bottle-fed infants was compared over a 15-day study period using two methods to determine intake (Vio et al., 1986). Water turnover as measured by deuterium tracer was compared with directly measured fluid intake. Daily fluid intakes of 0.71 L/day (153 mL/kg/day) and 0.70 L/day (151 mL/kg/day) were reported for the direct and water turnover methodology (r = 0.98), respectively. Other studies have found close agreement (Butte et al., 1988) or slightly higher (Butte et al., 1991) values for water turnover versus direct measurement of daily fluid intake in infants.
Table 4-6 provides studies examining daily water turnover for adults in a variety of conditions. These values are generally higher than in water balance studies because subjects are often more active and exposed to outside environments. Daily water turnover rates were approximately 3.2 L and 4.5 L for sedentary and active men, respectively. Several studies found daily water turnover rates greater than 5 L; presumably these were more active persons who may have encountered heat stress. Women generally had approximately 0.5 to 1.0 L/day lower daily water turnover rates than their male counterparts.
Water turnover was measured in 458 noninstitutionalized adults (ranging from 40 to 79 years of age) who lived in temperate climates (Raman et al., 2004). Daily turnover averaged 3.6 and 3.0 L in men and women, respectively. The water turnover values were corrected for metabolic water and water absorption from humidity to provide preformed water values. The preformed water values averaged 3.0 L/day (range 1.4 to 7.7 L/day) for men and 2.5 L/day (range 1.2 to 4.6 L/day) for women. The lower values in women were not accounted for by differences in body size.
METHODS FOR ESTIMATING HYDRATION STATUS
Total Body Water Changes
Total body water (TBW) is accurately determined by dilution of a variety of indicators. Repeated measurements are required to assess total body water changes. The technical requirements and cost for
TABLE 4-6 Summary of Daily Water Turnover Studies on Adults
|
Reference |
Subjects |
Conditions |
Water Turnover (L/d) |
|
Schloerb et al., 1950 |
17 men 11 women |
Not reported |
3.4 men 2.3 women |
|
Fusch et al., 1996 |
11 men, 2 women |
Before and after high-altitude trek of 4,900 to 7,600 m |
3.3 before (combined) 5.5 after (combined) |
|
Leiper et al., 1996 |
6 men (sedentary) 6 men (active) |
Temperate |
3.3 (sedentary < 60 min exercise/d) 4.7 (active) |
|
Lane et al., 1997 |
13 male astronauts |
Ground-based period |
3.8 |
|
Blanc et al., 1998 |
8 men |
Sedentary Head-down bed-rest |
3.5 3.2 |
|
Fusch et al., 1998 |
11 men 4 women |
Temperate |
5.7 (combined) |
|
Leiper et al., 2001 |
6 men (sedentary) 6 men (active) |
Temperate |
2.3 (sedentary) 3.5 (active) |
|
Ruby et al., 2002 |
8 men 9 women |
Arduous wildfire suppression activity |
7.3 men 6.7 women |
|
Raman et al., 2004 |
66 men (40–49 yr) 58 men (50–59 yr) 56 men (60–69 yr) 49 women (40–49 yr) 48 women (50–59 yr) |
Temperate |
36 women (60–69 yr) 3.8 (free living) 3.6 3.6 3.3 3.0 2.9 |
repeated measurements with dilution methods make them impractical for routine assessment of TBW changes. Bioelectric impedance analysis (BIA) has recently gained attention because it is simple to use and allows rapid, inexpensive, and noninvasive estimates of TBW. Absolute values derived from this technique correlate well with TBW values obtained by isotope dilution (Kushner and Schoeller, 1986; Kushner et al., 1992; Van Loan et al., 1995). These valida-
tion studies were performed on euhydrated subjects under standardized clinical conditions (e.g., controlled diet, body posture, skin temperature, inactivity).
Studies have indicated that BIA may not have sufficient accuracy to validly detect moderate dehydration (approximately 7 percent TBW) and loses resolution with isotonic fluid loss (O’Brien et al., 1999). Because fluid, electrolyte, and plasma protein concentrations can have independent effects, BIA can provide misleading values regarding dehydration or hyperhydration status (Gudivaka et al., 1999; O’Brien et al., 2002). Fluid and electrolyte concentrations may have independent effects on the BIA signal, thus often providing grossly misleading values regarding dehydration status (O’Brien et al., 2002). The BIA with a 0/∞ − kHz parallel (Cole-Cole) multifrequency model may have promise to measure body hydration changes if corrections are made for changes in plasma protein concentration (Gudivaka et al., 1999). However, recently a multifrequency BIA with Cole-Cole analysis was reported not to be sensitive to hypertonic dehydration (Bartok et al., 2004).
Plasma and Serum Osmolality
Plasma osmolality provides a marker of dehydration levels. Osmolality is closely controlled by homeostatic systems and is the primary physiological signal used to regulate water balance (by hypothalamic and posterior pituitary arginine vasopressin secretion), resulting in changes in urine output and fluid consumption (Andreoli et al., 2000; Knepper et al., 2000). Plasma osmolality rarely varies beyond ± 2 percent and is controlled around a set-point of 280 to 290 mOsmol/kg; this set-point increases with aging and becomes more variable among people. Water deprivation (if it exceeds solute losses) increases the osmolality of plasma and of the ECF and thus fluids bathing the hypothalamus. This causes loss of ICF from osmoreceptor neurons, which then signals the release of arginine vasopressin from the hypothalamus and the posterior pituitary. Arginine vasopressin acts on the renal tubules to increase water reabsorption.
Arginine vasopressin release is proportional to increased plasma osmolality and decreased plasma volume. While body water loss will induce plasma volume reduction and increased plasma osmolality, the influence of body water loss on each depends upon the method of dehydration, physical fitness level, and heat acclimatization status (Sawka, 1988; Sawka and Coyle, 1999).
Many studies have measured plasma osmolality of euhydrated sub-
TABLE 4-7 Plasma Osmolality for Euhydrated Subjects in Carefully Controlled Fluid Balance Studies
|
Reference |
Subjects Mean age ± S.D.a |
Plasma Osmolality (mOsmol/kg) |
|
Sawka et al., 1983a |
Men, 25 ± 4 yr |
284 |
|
Sawka et al., 1983b |
Men, 24 ± 3 yr Women, 26 ± 3 yr |
281 |
|
Sawka et al., 1984a |
Men, 24 ± 3 yr Women, 26 ± 3 yr |
281 |
|
Fish et al., 1985 |
Men and women, 20–37 yr Men and women, 62–88 yr |
281 291 |
|
Sawka et al., 1988 |
Men, 33 ± 3 yr |
283 |
|
Mack et al., 1994 |
Men, 18–28 yr Men, 65–78 yr |
281 287 |
|
Freund et al., 1995 |
Men, 24 ± 2 yr |
287 |
|
Montain et al., 1995 |
Men, 24 ± 6 yr |
281 |
|
Stachenfeld et al., 1996 |
Men and women, 24–33 yr Men and women, 67–76 yr |
282 286 |
|
Latzka et al., 1997 |
Men, 19–36 yr |
282 |
|
Montain et al., 1997 |
Men, 24 ± 6 yr |
281 |
|
Stachenfeld et al., 1997 |
Men and women, 20–28 yr Men and women, 65–76 yr |
285 288 |
|
Latzka et al., 1998 |
Men, 19–36 yr |
283 |
|
O’Brien et al., 1998 |
Men, 24 ± 2 yr |
280 |
|
Noakes et al., 2001 |
Men, 28–44 yr |
279 |
|
Popowski et al., 2001 |
Men, 23 ± 3 yr |
288 |
|
a S.D. ± stardard deviation. |
||
jects in controlled fluid balance studies. Table 4-7 provides results from some of these studies. Note that plasma osmolality ranged from 279 to 291 mOsmol/kg and averaged approximately 284 mOsmol/kg, with slightly higher values for older populations. Elderly persons had approximately 3 to 6 mOsmol/kg higher plasma osmolality than the young adults studied (Mack et al., 1994; Stachenfeld et al., 1996, 1997).
Figure 4-8 provides a compilation of 19 studies (181 subjects) where plasma osmolality was measured at several hydration levels. TBW was either directly measured or calculated based upon body composition information. A strong negative relationship (p < 0.0001) (r = −0.76) was found between TBW changes and plasma osmolality changes. Similar relationships have been reported based on smaller sample sizes of individual data (Sawka et al., 2001; Senay and Christensen,
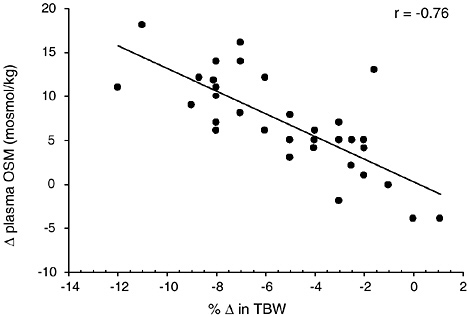
FIGURE 4-8 Relationship of change in plasma osmolality to change in total body water from 19 studies representing 181 subjects (Armstrong et al., 1985, 1997; Cheung and McLellan, 1998; Gonzalez-Alonso et al., 1997; Maresh et al., 2001; Maughan et al., 1996; Miescher and Fortney, 1989; Montain and Coyle, 1992; Montain et al., 1995; Neufer et al., 1989a, 1991; Noakes et al., 2001; O’Brien et al., 1998; Sawka et al., 1983b, 1985, 1988, 1989a, 1989b, 1992). The data points represent mean data reported in these studies. y = 0.2943 − 1.2882x; p = < 0.0001.
1965). Clearly, plasma osmolality provides a good marker for dehydration status if water loss is greater than solute loss. When solute and water are lost proportionately, such as with diarrhea or vomiting, osmolality remains constant and vasopressin release is blunted. However, the resulting ECF loss will stimulate the renin-angiotensin-aldosterone system as a means to increase sodium and hence water retention (Share et al., 1972). This mechanism appears to be less robust in elderly individuals (Dontas et al., 1972).
Table 4-8 provides the serum osmolality for selected deciles of total water intake by gender in the Third National Health and Nutrition Examination Survey (NHANES III). A more complete presentation of NHANES III data can be found in Appendix Table G-1. Serum osmolality concentrations were essentially identical (maximum range 3 mOsmol/kg) for the lowest (1st), middle (5th), and highest (10th) deciles within each age group. These data indicate that persons in the lowest and highest deciles of total water intake were not systematically dehydrated or hyperhydrated. In agreement
TABLE 4-8 Serum Osmolality Concentration for Selected Deciles of Daily Total Water Intake in Men and Women
|
Age |
Decile of Total Water Intake |
Men |
Women |
||
|
Total Water Intake, L/d (mean) |
Mean Serum Osmolality (mOsmol/kg) |
Mean Total Water Intake (L/d) |
Mean Serum Osmolality (mOsmol/kg) |
||
|
12–18 yr |
1st |
1.36 |
278 |
0.94 |
278 |
|
|
5th |
2.79 |
279 |
2.20 |
276 |
|
10th |
6.46 |
281 |
5.52 |
277 |
|
|
19–50 yr |
1st |
1.69 |
279 |
1.25 |
277 |
|
|
5th |
3.31 |
280 |
2.61 |
277 |
|
10th |
7.93 |
280 |
6.16 |
277 |
|
|
51–70 yr |
1st |
1.64 |
280 |
1.32 |
281 |
|
|
5th |
3.17 |
283 |
2.68 |
281 |
|
10th |
7.20 |
281 |
5.81 |
279 |
|
|
71+ yr |
1st |
1.44 |
283 |
1.19 |
282 |
|
|
5th |
2.71 |
283 |
2.38 |
283 |
|
10th |
5.45 |
281 |
4.85 |
282 |
|
|
SOURCE: Third National Health and Nutrition Examination Survey, Appendix Table G-1. |
|||||
with Table 4-8, the oldest persons (greater than 70 years of age) had slightly higher serum osmolality levels. The serum osmolality concentrations observed in NHANES III (Table 4-8) were slightly lower for all age groups than the plasma osmolality levels from the balance studies previously described (Table 4-7). In general, serum and plasma osmolality values are usually nearly identical; however, several handling and analytical factors can cause small differences between them (Tietz, 1995).
Plasma Sodium Concentration
Sodium is the primary cation of the ECF. Any loss of water in greater proportion than electrolyte losses will increase sodium concentrations in ECF compartments. Figure 4-9 provides a compilation of four studies (32 subjects) where plasma sodium concentration was measured at several hydration levels. TBW was either directly measured or calculated based upon body composition information. A moderate negative relationship (r = −0.46) was obtained between the decrease in TBW and increase in plasma sodium levels (p = 0.14). If data are analyzed for only the studies that
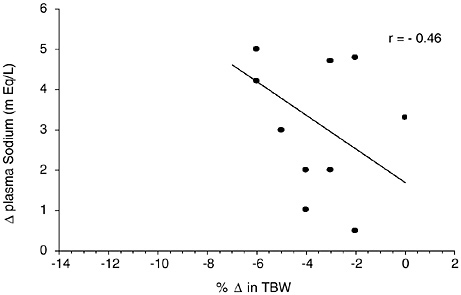
FIGURE 4-9 Relationship of change in plasma sodium to change in total body water from 4 studies representing 32 subjects (Fallowfield et al., 1996; Maughan et al., 1996; McConell et al., 1999; Montain et al., 1995). The data points represent mean data reported in these studies. y = 1.6927 − 0.4175x; p = 0.14.
presented both osmolality (Figure 4-9) and sodium data, then negative correlations of r = −0.82 and r = −0.28 were found between decreases in TBW and increases in osmolality and sodium levels, respectively. A negative relationship of r = −0.71 and r = −0.57 (based on 22 experiments) has been reported between decreases in TBW (as measured by body weight changes) and increases in plasma osmolality and plasma sodium levels, respectively (Senay and Christensen, 1965). Based on this data, plasma sodium changes are not as strongly related to changes in body hydration status as plasma osmolality changes.
Analysis of the data on plasma osmolality and sodium concentrations measured in nine heat acclimated subjects when euhydrated and after thermal dehydration by 3 and 5 percent of their weight indicated strong negative relationships between a decrease in total body water and (1) an increase in osmolality (r = −0.92), and (2) an increase in sodium (r = −0.90) (Montain et al., 1997). Further analysis indicated a relationship (r = 0.56) between the increases in sodium and in osmolality. Figure 4-10 depicts these data; note that the magnitude of increased plasma sodium concentration is markedly less than the increase in plasma osmolality. Therefore, the smaller increase in sodium concentration for a given water deficit may result in a smaller range for interstudy analyses and lead to
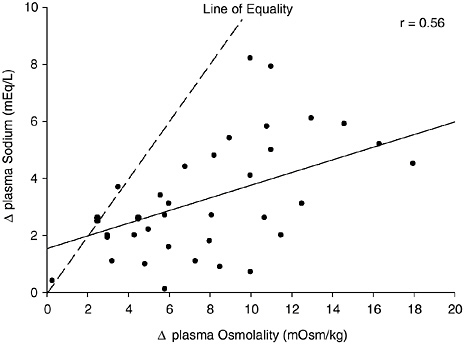
FIGURE 4-10 Relationship of change in plasma osmolality and plasma sodium concentration changes from thermal dehydration. Data from Montain et al. (1997). y = 0.2218x + 1.5461, p = 0.0002.
weaker relationships between change in plasma sodium and change in hydration status.
Plasma Volume Changes
Hyperhydration induces a modest increase in plasma volume (Freund et al., 1995; Latzka et al., 1997). Dehydration will decrease plasma volume, but the magnitude of reduction is variable. For example, heat acclimatized persons have a smaller plasma volume reduction for a given body water deficit than do unacclimatized persons (Sawka et al., 1988). By virtue of having a more dilute sweat, heat acclimatized persons have additional solutes remaining within the extracellular space to exert an osmotic pressure and redistribute fluid from the intracellular space. If an individual dehydrates from diuretic medication, a much greater ratio of plasma loss to total body water loss occurs compared with exercise-heat induced dehydration (O’Brien et al., 1998).
Figure 4-11 provides a compilation of 16 studies (146 subjects) where plasma volume was measured at several hydration levels. TBW was either directly measured or calculated based upon body composition information. A moderate correlation (r = 0.56) was observed
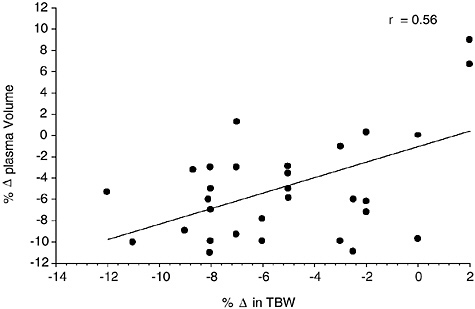
FIGURE 4-11 Relationship of change in plasma volume to change in total body water from 16 studies representing 146 subjects (Armstrong et al., 1985; Cheung and McLellan, 1998; Fallowfield et al., 1996; Gonzalez-Alonso et al., 1997; Kristal-Boneh et al., 1988; McConell et al., 1999; Miescher and Fortney, 1989; Montain and Coyle, 1992; Montain et al., 1995; O’Brien et al., 1998; Sawka et al., 1983b, 1985, 1988, 1989a, 1989b, 1992). The data points represent mean data reported in these studies. y = −1.0466 + 0.7270x, p = 0.0004.
between change in TBW and change in plasma volume. A strong relationship (r = 0.70) between plasma volume reduction and TBW reduction was seen in individual data on heat acclimatized subjects (Sawka et al., 2001). However, since subject status (e.g., heat acclimatization and perhaps physical fitness) and method of dehydration modifies the plasma volume reduction for a given dehydration level (Sawka, 1992), it is probably not a good index of hydration for all populations.
Blood Urea Nitrogen
Although blood urea nitrogen (BUN) is primarily considered an indicator of kidney function, it is also used as an indicator of dehydration in clinical settings. The pattern of high BUN (normal range 8 to 25 mg/dL) and otherwise normal renal function (e.g., normal creatinine or creatinine clearance) is considered an indicator of hypovolemia (a reduction in plasma or blood volume). However, BUN is also directly related to protein intake. Therefore, while BUN
can be an indicator of hydration status, other biochemical values must be considered in order to assess hydration status versus kidney function.
An elevated BUN:creatinine ratio (greater than 25) was seen in 2 of 37 elderly, long-term care patients who experienced no febrile episodes and no documentation of impaired oral intake (Weinberg et al., 1994a). The BUN:creatinine ratio remained relatively constant over a 6-month period in stable male residents (Weinberg et al., 1994b). Still, although the BUN:creatinine ratio, like BUN itself, has been used to assess hydration status, lack of specificity hinders its use as a measure of hydration status.
Urine Indicators
Volume and Color
Urine volume is often used as an indicator of hydration status. If healthy individuals have urine outputs of approximately 100 mL/ hour, they are probably well hydrated (see Figure 4-4). Higher urine outputs (300 to 600 mL/hour) are probably indicative of fluid excess (Freund et al., 1995; Lee, 1964). If urine output falls to less than 30 mL/hour for extended periods with an average diet, the person is probably dehydrated (see Figure 4-4).
The color of urine darkens or lightens with low or high output levels (because the solute load is either concentrated or diluted, respectively). Thus urine color has been used as an indicator of hydration status (Wakefield et al., 2002). However, no precise relationship between urine color and hydration level exists. Furthermore, diet, medications, and vitamin use can affect urine color. Nonetheless, urine color can provide a good educational tool for dehydration or overhydration (Casa et al., 2000). A urine color chart for athletes to teach them about proper hydration is available (Casa et al., 2000). Although not nearly as precise as biochemical measures, urine color can give a crude indication of hydration status.
Urine Specific Gravity and Urine Osmolality
Because urine becomes more concentrated with dehydration, both urine specific gravity and urine osmolality have been used as indicators of hydration status. Urine specific gravity and urine osmolality increase with dehydration and are strongly correlated (r = 0.82−0.97) with each other (Armstrong et al., 1994; Popowski et al., 2001). It should be noted that the validity of the urine specific gravity and
urine osmolality as indices in assessing hydration status is improved when the first morning urine, rather than a random collection, is used due to a more uniform volume and concentration (Sanford and Wells, 1962; Shirreffs and Maughan, 1998). Many studies have used these urine indices to access fluid balance and found poor (Armstrong et al., 1994; Francesconi et al., 1987; Hackney et al., 1995; O’Brien et al., 1996) or moderate (Adolph, 1947b; Shirreffs and Maughn, 1998) relationships with different indicators of dehydration status. For example, nonsignificant relationships between plasma osmolality with urine specific gravity (r = 0.46) and with urine osmolality (r = 0.43) were found in a well-controlled study of thermally dehydrated subjects (Popowski et al., 2001).
For “normally” hydrated (euhydrated) persons, urine specific gravity values range from 1.010 to 1.030 (Armstrong et al., 1994; Popowski et al., 2001; Sanford and Wells, 1962; Zambraski et al., 1974). It has generally been accepted that a urine specific gravity of less than or equal to 1.02 represents euhydration (Armstrong et al., 1994; Popowski et al., 2001), and a urine specific gravity greater than 1.03 represents dehydration (Armstrong et al., 1994; Francesconi et al., 1987; Popowski et al., 2001). Adolph (1947b) published individual data regarding urine specific gravity at different levels of water deficit (Figure 4-12). Urine specific gravity increases with water deficit; however, considerable individual variability exists. Although a urine specific gravity greater than 1.03 indicates probable dehydration, the magnitude of the water deficit cannot be determined.
Normal values for urine osmolality vary from 50 to 1,200 mOsmol/L (Tilkian et al., 1995). Therefore, in the setting of such variability, there may be no single threshold for urine osmolality and hydration status. However, individual increases in urine osmolality can provide an approximation of a person’s water deficit, assuming the solute load remains constant (Armstrong et al., 1994; Shirreffs and Maughan, 1998). In addition, urine osmolality is increased when osmotically active solutes are excreted, such as glucose in patients with uncontrolled diabetes mellitus (Tilkian et al., 1995). For these reasons (i.e., high variability and its dependence on solute excretion), urine osmolality is not considered a good indicator of hydration status.
Saliva Specific Gravity
Saliva specific gravity is slightly higher than water (Shannon and Segreto, 1968). Several studies have examined dehydration and sali-
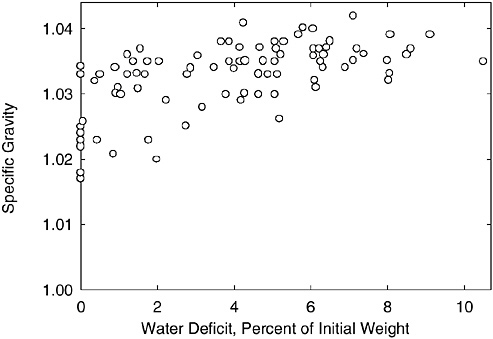
FIGURE 4-12 Individual urine specific gravity values at a range of water deficit levels.
SOURCE: Adolph (1947b). Reprinted with permission from the Papers of Edward Adolph collection at the Edward G. Miner Library, University of Rochester Medical Center.
vary specific gravity. Salivary flow was shown to decrease after a water deficit exceeding 2 percent of body weight, but there was considerable variability in response (Adolph and Wills, 1947). Significant decreases in saliva flow rate were found during dehydration of 2 to 3 percent body weight using 24-hour water deprivation studies (Ship and Fischer, 1997, 1999). One study determined that salivary osmolality increases during exercise in the heat accompanied by modest (2.9 percent body weight loss) dehydration (Walsh et al., 2004).
Body Weight Changes
Body weight changes are frequently used to estimate sweating rates and therefore changes in total body water (e.g., Gosselin, 1947). This approach is usually used to estimate changes over a relatively short duration when food and fluid intakes and excretions are carefully controlled. The validity of this estimate depends upon body weight measurements not being confounded by other nonfluid factors that can influence body weight changes. If proper controls are made, body weight changes can provide a more sensi-
tive estimate of total body water changes than repeat measurements by dilution methods (Gudivaka et al., 1999).
Potential confounding effects of urine loss, fluid intake, respiratory water loss, metabolic mass loss, water trapped perspiration in clothing on sweat loss, and therefore total body water change estimates for individuals performing exercise in hot and cool conditions have been examined (Cheuvront et al., 2002). Significant errors in estimating sweating rate are introduced unless nonperspiration fluid losses are factored into the body weight changes (Cheuvront et al., 2002). Likewise, carbohydrate loading in athletes will result in elevated baseline body weights that do not reflect euhydration, as the muscle glycogen will osmotically hold water. Overall, body weight changes provide an effective index of body water changes if other factors influencing body weight are carefully controlled.
Thirst
Thirst is “the desire to drink by both physiological and behavioral cues, resulting from deficit of water” (Greenleaf, 1992), through which people replenish their fluid losses during short-term periods (several hours) (Adolph and Wills, 1947; Eichna et al., 1945). Various scales have been developed over the years to quantify thirst by rating the sensation of, for example, dry mouth or dry throat. However, the most practical and commonly used approach in animal and human studies has been to document the volume of ad libitum (voluntary) drinking as a surrogate measurement of thirst. Despite ad libitum drinking, humans tend to under-replace their fluid needs over the short term (Johnson, 1964).
Triggering of thirst occurs through perceptual and physiological mechanisms (Fitzsimons, 1976; Greenleaf and Morimoto, 1996; Rolls and Rolls, 1982). For example, increases in plasma osmolality, plasma volume reduction, and several thirst sensations all made substantial contributions to predicting ad libitum fluid replacement following water deficits of 3, 5, and 7 percent of body weight loss (Engell et al., 1987).
Perceptual Factors
Voluntary drinking of a beverage is affected by its palatability, which is determined by its color, flavor, odor, and temperature (Boulze et al., 1983; Hubbard et al., 1984; Meyer et al., 1994; Szlyk et al., 1989; Wilk and Bar-Or, 1996; Zellner et al., 1991). These factors
are greatly influenced by cultural preferences; therefore, broad generalizations are difficult. In a study on the effect of water temperature on voluntary drinking, dehydrated men drank the highest amounts when the water temperature was 15°C (59°F). Higher and lower temperatures resulted in a smaller drinking volume, even though the cooler drinks were rated more “pleasurable” (Boulze et al., 1983). In another study, water at 15°C (59°F) was consumed at greater volumes than water at 40°C (104°F) (Szlyk et al., 1989). When children were exposed to 3 hours of intermittent exercise at 35°C (95°F) and 45 to 50 percent relative humidity, their ad libitum consumption of flavored water was 45 percent greater than with unflavored water (Figure 4-13) (Wilk and Bar-Or, 1996). Likewise, adults who performed desert-simulated walks at 40°C (104°F) drank approximately 50 percent more flavored water than unflavored water (Hubbard et al., 1984).
The sweetness of a drink is a major factor in its palatability, but people differ in their preferred flavor. Flavor preference depends on various factors, including ethnic and cultural backgrounds. For example, in one study with Canadian children, most preferred grape to orange or apple flavors and drank more when presented with a
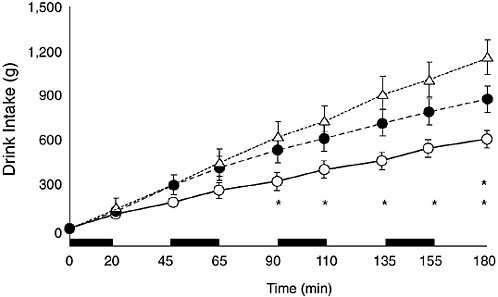
FIGURE 4-13 Cumulative voluntary drink intake of unflavored water (open circles), flavored water (black circles), and flavored sodium chloride (18 mmol/L) plus carbohydrate (6 percent) solution (triangles). Twelve 9- to 12-year-old boys cycled intermittently (black bars) at 35°C, 45 to 50% relative humidity. Reprinted with permission, from Wilk and Bar-Or (1996). Copyright 1996 by the American Physiological Society.
grape-flavored beverage (Meyer et al., 1994). In contrast, children in Puerto Rico had no preference for any single flavor (Rivera-Brown et al., 1999).
Physiological Triggers
Based on studies of various animal species, including humans, there seems to be three main physiological triggers for thirst: cerebral osmoreceptors, extra-cerebral osmoreceptors, and volume receptors (Fitzsimons, 1976; Greenleaf, 1992; Greenleaf and Morimoto, 1996). The osmoreceptors respond to cellular dehydration, which occurs when fluids leave the cells as a result of osmotic forces. The volume receptors respond to extracellular dehydration that results from loss of fluid from the vascular and interstitial spaces. While the osmoreceptors respond to small increases in osmolality, the volume receptors are activated by more drastic fluid losses. The osmoreceptors, therefore, are considered the first line of homeostatic defense against dehydration.
The location of these cells varies among species, but they are concentrated mostly in the hypothalamic area of the brain. Stimulation of the osmoreceptors activates drinking behavior and the release of arginine vasopressin hormone. The latter increases water permeability of the collecting tubules and thereby reduces free water loss and urine volume. There is evidence that either sodium chloride or an increase in osmolality (probably through separate cells) can activate the cerebral osmoreceptors, but it is assumed that the increase in osmotic forces is the more important stimulus (Greenleaf and Morimoto, 1996). The addition of 18 mmol/L of sodium chloride to flavored water triggered an increase of 31 percent in ad libitum drinking of children who exercised in the heat, compared with flavored water alone (Wilk and Bar-Or, 1996). Similar responses have been described for animals (Okuno et al., 1988) and adult humans (Nose et al., 1988).
Other osmoreceptors located in the oropharynx, gastrointestinal tract, and particularly the liver-portal system respond to drinking and modulate the thirst drive. Their existence has been postulated through experiments in which thirst and arginine vasopressin levels were modulated soon after drinking (or after injection of fluid to the liver portal system), before there were any changes in plasma osmolality or volume.
Thirst may be triggered by a decrease in blood volume, such as in hemorrhage or severe dehydration. This occurs through volume or stretch receptors that are sensitive to a drop in pressure at sites such
as the large systemic veins and the right atrium. These receptors, through the vagal system, stimulate thirst and drinking. Because of the compensatory activation of the renin-angiotensin-aldosterone system, preservation of body fluid is also achieved through a reduction in urinary output. Triggering of thirst through hypovolemia requires more than small changes in blood volume. The role of various thirst mechanisms with altered hydration status has been reviewed in detail elsewhere (Mack and Nadel, 1996; Stricker and Sved, 2000). However, in almost all situations where smaller volumes are lost over time (such as 2 to 3 L of sweat over 6 hours due to high temperatures or exercise), thirst mechanisms come into play over the ensuing 24 hours to trigger replacement of fluids lost; thus, in general, normal hydration is maintained by thirst mechanisms and normal drinking behavior. Such replacement is enhanced by consuming beverages at meals and in other social situations (Engell, 1995; Szlyk et al., 1990), which may be a necessary component to achieve adequate rehydration within a short period of time due to minor fluid deficits induced by exercise or heat strain.
Dehydration, Health, and Performance
Well-Being and Cognition
Dehydration can adversely influence cognitive function and motor control. Dehydration and poor mental function have been reported to be associated in physically ill older people (Seymour et al., 1980). Table 4-9 summarizes studies that examined the effects of dehydration on cognitive performance and motor function in healthy individuals.
Interpretation of these reports is difficult because the experimental designs often do not allow discrimination of confounding factors, such as effect of thermal (or exercise) stress and that of dehydration per se (Epstein et al., 1980; Hancock, 1981; Leibowitz et al., 1972; Sharma et al., 1983). For example, a degradation in mental alertness, associative learning, visual perception, and reasoning ability were noted when healthy men exercised while exposed to a high climatic heat stress (Sharma et al., 1983). Although the subjects drank water ad libitum, they may not have consumed enough fluids over the 4-hour session and thus became dehydrated due to the exercise and heat stress. However, the possible effect of dehydration on the above mental functions was not addressed. In another study, men and women exercised in the heat for 6 hours to elicit dehydration levels of 2.5 and 5 percent (Leibowitz et al., 1972).
TABLE 4-9 Cognitive and Motor Control Functions Reported to Be Affected by Dehydration
|
Function |
Reference |
Subjects |
Conditions |
Results |
|
Perception of fatigue |
Cian et al., 2000 |
8 men |
2.8% dehydration by exercise or climatic heat |
Increased rating of fatigue |
|
Rating of mood |
Cian et al., 2000 |
8 men |
2.8% dehydration by exercise or climatic heat |
No effect on mood |
|
Target shooting |
Epstein et al., 1980 |
9 men |
2.5% dehydration by climatic heat |
Reduced speed and accuracy and increase in physiologic strain |
|
Perceived discrimination |
Cian et al., 2000 |
8 men |
2.8% dehydration by exercise or climatic heat |
Discrimination impaired |
|
Choice reaction time |
Leibowitz et al., 1972 |
4 men, 4 women |
6-h exercise in the heat, causing 2.5% or 5% dehydration visual |
Faster response time to peripheral stimuli, no effect on response time to central visual stimuli |
|
|
Cian et al., 2000 |
8 men |
2.8% dehydration by exercise or climatic heat |
No effect on response time |
|
Visual-motor tracking |
Gopinathan et al., 1988 |
11 men |
1, 2, 3, or 4% dehydration, induced by exercise in the heat |
Tracking impaired at 2% or more dehydration |
|
Short-term memory |
Cian et al., 2000 |
8 men |
2.8% dehydration by exercise or climatic heat |
Short-term memory impaired |
|
|
Gopinathan et al., 1988 |
11 men |
1, 2, 3, or 4% dehydration, induced by exercise in the heat |
Short-term memory impaired at 2% or more dehydration |
|
Function |
Reference |
Subjects |
Conditions |
Results |
|
Long-term memory |
Cian et al., 2000 |
8 men |
2.8% dehydration by exercise or climatic heat |
Impaired recall, especially following exercise |
|
Attention |
Gopinathan et al., 1988 |
11 men |
1, 2, 3, or 4% dehydration, induced by exercise in the heat |
Attention impaired at 2% or more dehydration |
|
Arithmetic efficiency |
Gopinathan et al., 1988 |
11 men |
1, 2, 3, or 4% dehydration, induced by exercise in the heat |
Arithmetic ability impaired at 2% or more dehydration |
There was no difference in reaction time in response to central visual cues, but reaction time decreased when the visual cues were given at the periphery of the field of vision during the two dehydration conditions. Once again, interpretation of this finding is difficult because factors such as climatic heat stress, exercise-related fatigue, and boredom were not removed.
In a well-designed study, the arithmetic ability, short-term memory, and visual-motor tracking of 11 men who, on separate days, had water deficits of either 1, 2, 3, or 4 percent of body weight via thermal dehydration were assessed (Gopinathan et al., 1988). The subjects had ample rest in a temperate environment once they reached the target dehydration. This design allowed the researchers to observe the effects of dehydration per se, without fatigue or heat stress. This study revealed that a threshold level of 2 percent dehydration is required for deterioration of mental functions. A similar threshold was reported by other investigators (Sharma et al., 1986).
The adverse effects on mental function occurred irrespective of whether dehydration was achieved through exposure to the heat or as a result of exercise (Cian et al., 2001). A previous study by the same group suggested that exercise-induced dehydration was accompanied by a greater reduction in long-term memory (Cian et al., 2000), but the decrement in other functions was similar despite the mode of dehydration.
In conclusion, there is evidence to suggest that water deficits of 2 percent of body weight or more are accompanied by declining men-
tal function (Epstein et al., 1980). The mechanisms for this deficiency have not been elucidated.
Physical Work
Body water deficits can adversely influence aerobic exercise tasks (Sawka, 1992; Sawka and Coyle, 1999). The critical water deficit and
TABLE 4-10 Dehydration Effects on Maximal Aerobic Power and Physical Work Capacity
|
Study |
Subjects |
Environmenta |
Dehydration Process |
|
Buskirk et al., 1958 |
13 men |
83°C (115°F) |
Heat |
|
Saltin, 1964 |
10 men |
36–38.5°C (68–70.5°F) |
Heat and exercise |
|
Craig and Cummings, 1966 |
9 men |
46°C (78°F) |
Heat and exercise |
|
Herbert and Ribisl, 1972 |
8 men |
N/A |
Fluid restriction |
|
Houston et al., 1981 |
4 men |
N/A |
Fluid restriction |
|
Caldwell et al., 1984 |
16 men |
N/A |
Exercise |
|
|
15 men |
N/A |
Diuretic |
|
16 men |
80°C (112°F), 50% RH |
Sauna |
|
|
Pichan et al., 1988 |
25 men |
39°C (71°F), 60% RH |
Fluid restriction and exercise in sauna |
|
Webster et al., 1990 |
7 men |
N/A |
Exercise in rubberized sweat suit |
|
Sawka et al., 1992 |
17 men |
49°C (81°F), 20% RH |
Fluid restriction and exercise |
|
Burge et al., 1993 |
8 men |
N/A |
Exercise and fluid restriction |
|
Walsh et al., 1994 |
6 men |
30°C (62°F), 60% RH |
Fluid restriction |
|
Below et al., 1995 |
8 men |
31°C (63°F), 54% RH |
Fluid restriction |
|
Fallowfield et al., 1996 |
4 men, 4 women |
N/A |
Fluid restriction |
|
Montain et al., 1998b |
5 men, 5 women |
40°C (72°F), 20% RH |
Exercise and hot room |
|
a N/A = not available, RH = relative humidity. b TM = treadmill, CY = cycle ergometer. c NC = no change. |
|||
magnitude of performance decrement are related to the environmental temperature, exercise task, and probably the subject’s unique biological characteristics (physical fitness, acclimatization state, tolerance to dehydration). Table 4-10 presents a summary of investigations concerning the influence of dehydration on maximal aerobic power and physical work capacity (e.g., how much aerobic-type exercise could be completed under a given set of conditions) in adults.
|
% Δ Wt |
Exercise Modeb |
Baseline Maximum Power (L/min) |
Δ Maximum Aerobic Powerc |
Physical Work |
|
−5 |
TM |
|
↓ (−0.22 L/min) |
— |
|
−4 |
CY |
3.96 |
NC |
↓ (33%) |
|
−2 |
TM |
≈ 3.8 |
↓ (10%) |
↓ (22%) |
|
−4 |
TM |
≈ 3.8 |
↓ (27%) |
↓ (48%) |
|
−5 |
CY |
|
— |
↓ (17%) |
|
−8 |
TM |
4.3 |
NC |
— |
|
−3 |
CY |
3.61 |
NC |
↓ (7 Watts) |
|
−4 |
CY |
4.15 |
↓ (8%) |
↓ (21 Watts) |
|
−5 |
CY |
4.25 |
↓ (4%) |
↓ (23 Watts) |
|
−1 |
CY |
|
— |
↓ (6%) |
|
−2 |
CY |
|
↓ (8%) |
|
|
−3 |
CY |
↓ (20%) |
||
|
−5 |
TM |
3.76 |
↓ (7%) |
↓ (12%) |
|
−8 |
TM |
|
— |
↓ (54%) |
|
−5 |
Rowing |
4.65 |
NC |
↓ (5%) |
|
−1.8 |
CY |
2.9 |
NC |
↓ (34%) |
|
−2 |
CY |
|
↓ (6.5%) |
— |
|
−2 |
TM |
— |
↓ (25%) |
|
|
−4 |
Leg kick |
— |
↓ (15%) endurance |
|
In a temperate climate, body water deficits of less than 3 percent of body weight did not reduce maximal aerobic power; however, in hot climates, water deficits of 2 percent resulted in large reductions. Physical work capacity was reduced by dehydration in almost all examined conditions, with a greater effect when heat stress was also present. The influence of factors such as a person’s initial maximal aerobic power, training status, and heat acclimatization status on the magnitude of aerobic performance decrements from body water deficits has not been delineated. In a study of dehydration in children at 1 and 2 percent of body weight loss, a greater increase in core body temperature than would have been expected to be observed in adults exercising in hot weather was noted (Bar-Or et al., 1980). Therefore, children may have greater adverse performance effects from the same extent of dehydration during heat stress than do adults.
The effects of body water loss on endurance exercise performance in 13 endurance exercise studies have been reviewed (Cheuvront et al., 2003) (see Table 4-11). Based on these studies, dehydration appears to alter cardiovascular, thermoregulatory, central nervous system, and metabolic functions. One or more of these alterations will degrade endurance exercise performance when dehydration exceeds 2 percent of body weight. These performance decrements are accentuated by heat stress.
In summary, the literature indicates that dehydration can adversely influence aerobic and endurance-type exercise performance. The level of body water deficit needed to induce performance decrements probably approximates 2 percent body weight deficit; however, some individuals are probably more sensitive and others less sensitive to the amount of body water deficit on performance consequences. In addition, experimental evidence supports the concept that greater body water deficits result in a greater magnitude of performance decrements. Finally, it appears that heat stress increases these adverse performance consequences from body water deficits.
Body water deficits can adversely affect anaerobic exercise performance but do not appear to alter muscular strength. Table 4-12 lists a summary of investigations concerning the influence of dehydration on anaerobic exercise performance. Note that half of the studies reported reductions in anaerobic performance with considerable variability in the magnitude of performance reduction. Table 4-13 presents a summary of investigations examining the influence of dehydration on muscular strength. Most studies reported no effect of dehydration on muscular strength.
Thermoregulation (Fever and Hyperthermia of Exercise) and Heat Strain Tolerance
Fever is a regulated rise in body temperature and is a common response to inflammation, infection, and trauma (Blatteis, 1998; Leon, 2002). Dehydration will probably enhance the fever response and therefore has implications for management of clinical conditions. Rats dehydrated by a 24-hour water deprivation period exhibited a more severe fever than normally hydrated rats after being injected with bacterial endotoxin (Morimoto et al., 1986). Subsequent studies by other investigators have reproduced these findings in rats (Watanabe et al., 2000), as well as in rabbits (Richmond, 2001), and suggest the enhanced fever is due to angiotensin II secretion, which increases production of pyrogenic cytokines, such as interleukin-1.
However, studies in guinea pigs have reported that dehydration reduced the febrile response to bacterial endotoxin and suggest that the mechanism may be an antipyretic effect of central arginine vasopressin (Roth et al., 1992). Although there may be some species differences, it seems reasonable to conclude that dehydration may induce higher fevers. In support of this belief, febrile episodes have been found to be frequently associated with dehydration in nursing home residents (Weinberg et al., 1994a).
Dehydration and Heat Strain Tolerance
During exercise, unlike with a fever, an increase in body temperature does not represent a set-point change and is proportional to the metabolic rate (Sawka et al., 1996a). Dehydration increases core temperature responses during exercise in temperate and hot climates (Sawka and Coyle, 1999). A deficit of only 1 percent of body weight has been reported to elevate core temperature during exercise (Ekblom et al., 1970). Figure 4-14 summarizes results from studies that examined multiple dehydration levels within the same subjects during exercise. As the magnitude of water deficit increased, there was a concomitant graded elevation of core temperature. The magnitude of core temperature elevation ranged from 0.1°C to 0.23°C for every percent body weight lost (Brown, 1947a; Gisolfi and Copping, 1974; Greenleaf and Castle, 1971; Montain et al., 1998a; Sawka et al., 1985; Strydom and Holdsworth, 1968). The core temperature elevation from dehydration may be greater during exercise in hot compared with temperate climates. Dehydration not only elevates core temperature, but it negates many thermal
TABLE 4-11 Dehydration Effects on Endurance Exercise Performance
|
Reference |
Sample Sizea |
Exerciseb |
|
Pitts et al., 1944 |
5 men |
Walk 3.5 mph, 2.5% grade for 5 h |
|
Brown, 1947a |
13 men, NF 9 men, AL |
21-mi desert hike |
|
Ladell, 1955 |
4 men |
Bench step to exhaustion |
|
Maughan et al., 1989 |
6 men |
CE 70% VO2max to exhaustion |
|
Barr et al., 1991 |
5 men 3 women |
CE 55% VO2max for 6 h (intermittent) |
|
Walsh et al., 1994 |
6 men |
CE 70% VO2max for 60 min, then 90% VO2max to exhaustion |
|
Below et al., 1995 |
8 men |
CE 50% VO2max for 50 min, then PR |
|
Robinson et al., 1995 |
8 men |
CE PR (total work in 60 min) |
|
Fallowfield et al., 1996 |
4 men 4 women |
TM run at 70% VO2max to exhaustion |
|
McConell et al., 1997 |
7 men |
CE 69% VO2max for 120 min, then 90% VO2max to exhaustion |
|
Mudambo et al., 1997a |
18 men, NF 6 men, SF |
Walk/run/obstacle course (3 h) |
|
McConell et al., 1999 |
8 men |
CE 80% VO2max for 45 min, then 15 min PR |
|
Bachle et al., 2001 |
4 men 7 women |
CE 60 min PR |
|
a NF = no fluid, AL = ad libitum, SF = some fluid (> NF, < F), F = fluid ≥ sweat losses. b CE = cycle ergometer, PR = performance ride or run, TM = treadmill, VO2max = maximal oxygen uptake. c RH = relative humidity. d RPE = rating of perceived exertion, TTE = time to exhaustion. SOURCE: Cheuvront et al. (2003). Reprinted with permission, from Cheuvront et al. (2003). Copyright 2003 by Current Science, Inc., Philadelphia, PA. |
||
|
Environmentc |
Drink Conditions |
Dehydration (% body weight) |
Performance Resultsd |
|
35°C, 83% RH |
NF, AL, F |
No data |
NF = ↓ (~60%) in walk duration; ↑ RPE vs. AL and F |
|
31–39°C |
NF, AL |
NF = 6.3 AL = 4.5 |
NF = 7 of 13 failed to complete hike (54%) AL = 3 of 9 failed to complete hike (33%) |
|
38°C, 78% RH 38°C, 30% RH |
NF, F |
No data |
NF = ↓ (25%) in work tolerance time vs. F NF = ↓ (~20%) in walk duration; ↑ RPE vs. AL and F |
|
Laboratory |
NF, SF |
NF = 1.8 SF = 2.0 |
No differences in TTE between NF and SF |
|
30°C, 50% RH |
NF, SF |
NF = 6.4 F = 1.2 |
NF = ↓ (25%) in TTE and ↑ RPE vs. SF |
|
30°C, 60% RH |
NF, F |
NF = 1.8 F = 0.0 |
NF = ↓ (31%) in TTE and ↑ in RPE vs. F |
|
31°C, 54% RH |
NF, F |
NF = 2.0 F = 0.5 |
NF = ↓ (7%) in performance vs. F |
|
20°C, 60% RH |
NF, F |
NF = 2.3 F = 0.9 |
NF = ↑ (1.7%) in PR vs. F |
|
20°C |
NF, SF |
NF = 2.0 SF = 2.7 |
NF = ↓ (25%) in TTE vs. SF |
|
21°C, 43% RH |
NF, SF, F |
NF = 3.2 SF = 1.8 F = 0.1 |
NF = ↓ (48%) in PR vs. F only |
|
39°C, 28% RH |
NF, SF |
NF = 7 SF = 2.8 |
NF = 6/18 subjects failed to complete 3-h exercise bout vs. SF NF = ↑ in RPE vs. SF |
|
21°C, 41% RH |
NF, SF, F |
NF = 1.9 SF = 1.0 F = 0.0 |
No differences in PR among trials |
|
21°C, 72% RH |
NF, F |
NF = 1.0 F = ↑ 0.5 |
No differences in PR or RPE among trials |
TABLE 4-12 Dehydration Effects on Anaerobic Performance
|
Reference |
Subjects |
Dehydration Processa |
% Δ Wt |
Anaerobic Method |
Resultb |
|
Jacobs, 1980 |
11 men |
Heat |
−5 |
Wingate Anaerobic Test |
NC |
|
Houston et al., 1981 |
4 men |
Fluid restriction |
−8 |
Supramaximal run |
NC |
|
Nielsen et al., 1981 |
6 men |
Diuretic |
−3 |
Supramaximal cycle |
↓ (18%) anaerobic capacity |
|
|
6 men |
Sauna |
−3 |
Supramaximal cycle |
↓ (35%) anaerobic capacity |
|
5 men |
Exercise |
−3 |
Supramaximal cycle |
↓ (44%) anaerobic capacity |
|
|
Webster et al., 1990 |
7 men |
Exercise in rubberized sweat suit |
−5 |
Wingate Anaerobic Test |
↓ (21%) anaerobic power ↓ (10%) anaerobic capacity |
|
Fritzsche et al., 2000 |
8 men |
Heat, 35°C, 25% RH |
−4 |
Inertial load, cycling |
↓ (4%) |
|
a RH = relative humidity. b NC = no change. |
|||||
advantages conferred by high aerobic fitness and heat acclimatization (Buskirk et al., 1958; Sawka et al., 1983b). Women and men who are of comparable physical fitness and heat acclimatization status appear to respond similarly to dehydration and exercise-heat stress (Sawka et al., 1983b).
The elevated core temperature responses to dehydration result from a decrease in heat loss (Sawka and Coyle, 1999). The relative contributions of evaporative and dry heat loss during exercise depend upon the specific environmental conditions, but both avenues of heat loss are adversely affected by dehydration. Local sweating (Fortney et al., 1981, Montain et al., 1995) and skin blood flow (Fortney et al., 1984; Kenney et al., 1990) responses are both reduced for a given core temperature when a person is dehydrated. Whole-body sweating is usually either reduced or unchanged during exercise at a given metabolic rate in the heat (Sawka and Coyle, 1999). However, even when dehydration is associated with no change in whole-body sweating rate, core temperature is usually elevated; therefore, the whole-body sweating rate for a given core temperature is lower when a person is dehydrated (Sawka et al., 1984b).
Both the singular and combined effects of plasma hyperosmolality and hypovolemia have been demonstrated as mediating the reduced heat loss response during exercise-heat stress (Sawka, 1992).
Dehydration reduces a person’s ability to tolerate exercise-heat stress. In experiments in the desert during 1942 and 1943, male soldiers serving as subjects attempted endurance (2 to 23 h) walks and were either allowed to drink water ad libitum or had to refrain from drinking (Brown, 1947c). One out of 59 (2 percent) subjects suffered exhaustion from heat strain during a desert walk when they were allowed to drink, whereas 11 of 70 (16 percent) subjects suffered exhaustion when they did not drink. In another study, “hyperacclimatized” subjects attempted a 140-minute walk in a hot environment while ingesting different combinations of salt and water (Ladell, 1955). Exhaustion from heat strain occurred in 9 of 12 (75 percent) subjects when receiving neither water or salt, and 3 of 41 (7 percent) subjects when receiving only water. More recently, normal subjects acclimated to heat attempted 140-minute treadmill walks in a hot-dry environment when euhydrated and when dehydrated by 3, 5, and 7 percent of body weight (Sawka et al., 1985). All eight subjects completed the euhydration and 3 percent dehydration experiments, while seven subjects completed the 5 percent dehydration experiments. During the 7 percent dehydration experiments, six subjects discontinued after completing an average of 64 minutes.
To address whether dehydration alters physiologic tolerance to heat strain, subjects walked to voluntary exhaustion when either euhydrated or dehydrated (8 percent of total body water) during uncompensable heat stress (Sawka et al., 1992). Dehydration reduced tolerance time from 121 to 55 min, but more importantly, dehydration reduced the core temperature that a person could tolerate. Heat exhaustion occurred at a core temperature about 0.4°C lower when dehydrated than when euhydrated.
Hyperhydration and Heat Strain
Because water deficits impair thermoregulation (e.g., body temperature increases), a logical question is whether greater-than-normal body water (hyperhydration) could improve a person’s ability to thermoregulate during exercise in the heat. Many studies have examined hyperhydration effects on thermoregulation in the heat. Some investigators report lower core temperatures during exercise after hyperhydration (Gisolfi and Copping, 1974; Grucza et al., 1987; Moroff and Bass, 1965; Nielsen, 1974; Nielsen et al., 1971), while
TABLE 4-13 Dehydration Effects on Muscular Strength and Endurance
other studies do not (Blyth and Burt, 1961; Candas et al., 1988; Greenleaf and Castle, 1971; Latzka et al., 1997, 1998; Montner et al., 1996; Nadel et al., 1980). Some investigators report higher sweating rates with hyperhydration (Lyons et al., 1990; Moroff and Bass, 1965), while other studies do not (Blyth and Burt, 1961; Candas et al., 1988; Greenleaf and Castle, 1971; Latzka et al., 1997, 1998; Montner et al., 1996).
However, most of these studies have serious design problems, such as control conditions representing dehydration but not euhydration (Candas et al., 1988; Moroff and Bass, 1965), control conditions not adequately described (Grucza et al., 1987; Nielsen, 1974; Nielsen et al., 1971), and cool fluid ingestion that might have caused reduced core temperature (Gisolfi and Copping, 1974; Moroff and Bass, 1965). No studies were found that examined the influence of gender on thermoregulatory responses to hyperhydration. Generally, the
|
Δ Wt |
Strength Method |
Resulta |
|
−5% |
Isometric |
NC in strength |
|
−2 kg |
Isokinetic |
NC in strength |
|
−4% |
Isometric |
NC in strength |
|
−7% |
Isometic |
NC in strength with up to 4% dehydration |
|
−3% |
Isometric |
↓ (11%) in strength |
|
−7% |
Isometric |
NC in strength |
|
−6% |
Isometric |
↓ (10%) in strength ↓ (9%) in endurance |
|
−4% |
Isometric |
↓ (31%) in endurance |
|
|
Isotonic |
↓ (29%) in endurance |
|
−3% |
Isometric |
↓ in endurance |
|
−8% |
Isokinetic |
↓ (11%) in strength |
|
−4% |
Isokinetic |
NC in strength NC in endurance |
|
−5% |
Isometric |
NC in strength NC in endurance |
|
−5% |
Isokinetic |
NC in leg strength ↓ (5%) in shoulder strength ↓ (4%) in chest strength |
|
−4% |
Isometric |
NC in strength NC in endurance |
|
−4% |
Isometric |
NC in strength |
“best” designed studies did not report any thermoregulatory benefits from hyperhydration relative to euhydration (Greenleaf and Castle, 1971; Latzka et al., 1997, 1998; Nadel et al., 1980).
Hyperhydration and Performance
Several studies have examined whether hyperhydration improves exercise performance or heat tolerance. Blyth and Burt (1961) were the first to report the effects of hyperhydration on performance during exercise-heat stress. Their subjects ran to exhaustion in a hot climate when normally hydrated, as well as when hyperhydrated by drinking 2 L of fluid 30 minutes prior to exercise. When hyperhydrated, 13 of 18 subjects ran longer to exhaustion compared with their time to exhaustion when normally hydrated. The average time to exhaustion when hyperhydrated versus normally
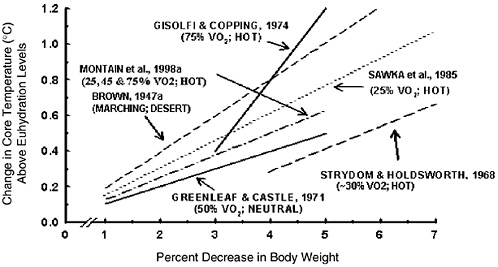
FIGURE 4-14 Relationship for elevation of core temperature (above that present with euhydration) at a given magnitude of water deficit during exercise conditions in different environments. VO2 is maximal oxygen uptake. Adapted with permission from Sawka (1992). Copyright 1992 by Lippincott, Williams and Wilkins.
hydrated (17.3 versus 16.9 minutes) did not, however, reach statistical significance. In another study, subjects exercised to exhaustion during uncompensable exercise-heat stress when initially euhydrated (control) or hyperhydrated (increased total body water by approximately 1.5 L) (Latzka et al., 1998). Water hyperhydration did not extend endurance time beyond that seen in the control (euhydrated) condition in this study.
Dehydration and Cardiovascular Function
Dehydration increases resting heart rate when standing or lying down in temperate conditions (Rothstein and Towbin, 1947). In addition, dehydration makes it more difficult to maintain blood pressure during exposure to various perturbations. Dehydration induces fainting in individuals susceptible to postural fainting when tilted with feet down (Harrison et al., 1986; Rothstein and Towbin, 1947). Figure 4-15 presents data on a subject who was tilted with feet held downward for 10 min or until becoming unconscious (Rothstein and Towbin, 1947). With increased levels of dehydra-
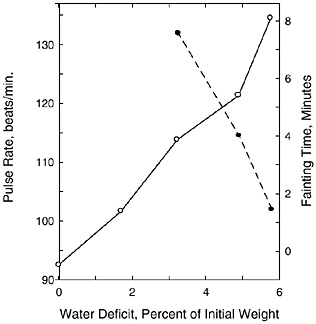
FIGURE 4-15 Relationship between body water deficit, heart rate (solid line), and fainting time (broken line) for a passively tilted subject.
SOURCE: Rothstein and Towbin (1947). Reprinted with permission from the Papers of Edward Adolph collection at the Edward G. Miner Library, University of Rochester Medical Center.
tion, the pulse rate increment increased and the time to faint decreased. Mild dehydration was recently shown to blunt baroreceptor control during an orthostatic tolerance test (Charkoudian et al., 2003), which may be an explanation for orthostatic intolerance (e.g., fainting upon standing) when an individual is dehydrated (≈ 1.6 percent of body weight). In addition, drinking water (0.5 L versus 0.05 L) markedly improved orthostatic tolerance in healthy men and women (Schroeder et al., 2002). The improved orthostatic tolerance could be mediated by plasma volume expansion or by the act of drinking resulting in increased sympathetic activation (Scott et al., 2001).
The effects of dehydration on cardiovascular responses to exercise have been investigated (Gonzalez-Alonso et al., 1997; Montain et al., 1998a; Nadel et al., 1980; Rothstein and Towbin, 1947; Sawka et al., 1979, 1985). Dehydration will increase heart rate in proportion to the magnitude of water deficit (Montain and Coyle, 1992; Montain et al., 1998a; Rothstein and Towbin, 1947; Sawka et al., 1985). Dehydration-mediated hypovolemia reduces central venous pressure (Morimoto, 1990) and cardiac filling (Coyle, 1998) and requires a compensatory increase in heart rate. During submaximal exercise with little heat strain, dehydration elicits an increase in heart rate
and a decrease in stroke volume, and usually no change in cardiac output relative to euhydration levels. Heat stress and dehydration, however, have additive effects on increasing cardiovascular strain. During submaximal exercise with moderate (Nadel et al., 1980) or severe (Gonzalez-Alonso et al., 1997; Sawka et al., 1979) heat strain, dehydration (3 to 4 percent body weight) led to a decrease in cardiac output (compared with performing the exercise task when euhydrated) because the increase in heart rate was not of sufficient magnitude to compensate for the decline in stroke volume. The dehydration-mediated reduction in cardiac output (below euhydration levels) during heat stress was greater during high intensity (65 percent VO2max) than low intensity (25 percent VO2max) exercise (Montain et al., 1998a). In addition, severe water deficits (7 percent of body weight) in the absence of heat strain also reduced cardiac output during submaximal exercise (Sproles et al., 1976).
Death
For obvious reasons, experimental data are not available on the effects of dehydration with death as an outcome in humans. As discussed earlier, fever is a common response to inflammation, infection, and trauma and may be augmented by dehydration (Morimoto et al., 1986; Watanabe et al., 2000). Furthermore, dehydration increases cardiovascular strain. It is suggested that dehydration might contribute to the death of hospitalized patients who are ill (Weinberg et al., 1994a).
Humans can lose 10 percent of body weight as water and have little increased risk of death unless the dehydration is accompanied by other severe stressors (Adolph, 1947a). Reports from persons in survival situations indicate that those who dehydrated to greater than 10 percent of their body weight required medical assistance to recover (Adolph, 1947a).
Experimental studies regarding dehydration and death in animals have been performed (Adolph, 1947a; Keith, 1924; Wierzuchowski, 1936). When investigators infused sugar solutions to dehydrate dogs (Keith, 1924; Wierzuchowski, 1936), most could tolerate 7 to 10 percent dehydration; however, beyond this point body temperature rose rapidly and often led to death.
Adolph (1947a) reported on experiments in which dogs were slowly dehydrated by water deprivation in temperate conditions and were then exposed to heat stress. When the dogs were dehydrated by 10 to 14 percent of body weight and exposed to heat, their core temperature “explosively increased,” and they would only survive if
removed from the heat stress or given water to drink (Adolph, 1947a). Deaths began as core temperatures approached 41.6°C (107°F) and would always occur when core temperatures reached 42.8°C (109°F). Lethal core temperatures were similar in the dehydrated and euhydrated dogs (Adolph, 1947a). Cats showed similar responses, but with water deficits of up to 20 percent body weight loss and core temperatures of up to 43°C (110°F) before dying.
There are many reports from civilian and military communities of persons being stranded in very hot conditions (such as desert conditions in the summer) for extended durations in which those who had water survived and those without water died. Dehydration is believed to contribute to life-threatening heat stroke. In view of physiological changes (e.g., elevated body temperatures and reduced tissue perfusion from inadequate cardiac output), this presumed association is reasonable (Bouchama and Knochel, 2002). Dehydration contributed significantly to an outbreak of serious heat illness of Massachusetts State Police recruits who had limited water availability during summer training sessions. Eleven of a class of 50 had serious rhabdomyolysis and/or heat injury and were hospitalized—two underwent kidney dialysis and one required a liver transplant and later died (Commonwealth of Massachusetts, 1988). In 1987, three collegiate wrestlers died of cardiorespiratory arrest while undergoing severe and rapid weight loss combined with stressful exercise in the heat (Remick et al., 1998). Dehydration was implicated in these three deaths; however, those athletes appeared to be employing exercise-heat dehydration procedures that were similar to those used by other interscholastic and collegiate wrestlers. Since these were the first deaths since record keeping was initiated in 1982, it is probable that some other unknown factor may have contributed. Thus dehydration is a serious health risk, particularly when associated with febrile illness or extreme heat and exercise.
Urinary Tract Infections
Dehydration may increase the risk of infections. Hydration monitoring was assessed to determine if it would encourage individuals to increase fluid intake and thus decrease their risk for urinary tract infections (Eckford et al., 1995). Twenty-eight premenopausal women who had at least two idiopathic urinary tract infections within 6 months of the study were taught to use a simple hand-held probe (a conductivity meter) to assess their urine osmolality (Eckford et al., 1995). Although this 4-month study was only completed by 17 of the 28 women, these women increased hydration
and significantly decreased their incidence of urinary tract infection due to their greater consumption of fluids. In another study of over 300 subjects, increased fluid intake resulted in a lower rate of urinary tract infections (Pitt, 1989). While it cannot be assumed that urinary tract infections are the result of dehydration, adequate hydration may contribute to the prevention of such infections in humans (Hooton, 1995).
However, the utility of using the prevention of urinary tract infections as an indicator of adequacy is not adequately established on a quantitative basis to be used as the criterion on which to base recommended intakes of total water.
Dehydration and Chronic Diseases
Kidney Stones
Increased fluid intake has been found to be inversely associated with an increased risk of developing kidney stones (Curhan et al., 1997, 1998), and increased fluid consumption has long been suggested as means to prevent recurrence of kidney stones (nephrolithiasis). As a result of increased urine flow, the urinary concentrations of calcium, oxalate, phosphorus, and uric acid fall, thereby reducing the degree of saturation of their salts, which leads to the formation of kidney stones. Most of the available studies have been conducted on individuals who have already had stones, with the goal of preventing recurrence.
One of the first studies to evaluate the therapeutic effects of increased fluid intake was a retrospective case-series study (Hosking et al., 1983). One-hundred eight patients (83 men and 25 women) who had idiopathic calcium nephrolithiasis had been advised to increase their fluid intake to achieve a 24-hour urinary output greater than or equal to 2.5 L. Over an average follow-up period of 5 years, 58 percent of these patients had no evidence of stone growth or new stone formation (Hosking et al., 1983). In another case-series, 98 individuals (87 men, 11 women), all of whom were diagnosed as having been chronically dehydrated due to either defined history of exposure to heat due to climate or occupation or due to poor fluid intake, were asked to increase fluid intake to about 2.5 L/day (Embon et al., 1990). Resulting mean urinary volume increased from 1.7 to 2.5 L/day based on periodic random sampling during the follow-up period. After more than 4 years, the stone recurrence rate was approximately 7 percent (7/98), which
was comparatively low (Embon et al., 1990). One randomized controlled trial with 5 years of follow-up tested the effects of increased water intake as a means of preventing recurrent kidney stones in 199 individuals (134 men and 65 women) with idiopathic calcium nephrolithiasis (Borghi et al., 1996). At baseline, estimated 24-hour urine volume was approximately 1 L. During the fifth year of follow-up, 24-hour urine volume remained unchanged in the control group but increased to 2.6 L in the active treatment group. Over the course of follow-up, recurrent stones occurred in 27 percent of control participants, but in just 12 percent of those in the active treatment group (p = 0.008) (Borghi et al., 1996).
More recent evidence suggests that increased fluid intake may prevent the initial occurrence of kidney stones; however, data are limited. Two prospective observational studies have assessed the relationship of fluid intake with incident kidney stones, while another study assessed the relationship of specific beverages. In a study of 45,619 male health professionals without kidney stones, the adjusted relative risk of developing a stone during 4 years of follow-up was 0.71 (95 percent confidence interval [CI]: 0.52 to 0.97) comparing the highest and lowest quintiles of fluid intake (> 2.5 versus < 1.3 L/ day) (Curhan et al., 1993). Similar findings were evident in a subsequent study of 91,731 female nurses without kidney stones; the adjusted relative risk of developing a stone during 12 years of follow-up was 0.61 (95 percent CI: 0.48 to 0.78) comparing the highest quintile of fluid intake (median intake of 4.7 L/day) to the lowest quintile of fluid intake (median intake of 1.9 L/day) (Curhan et al., 1997). Because the principal objective of both studies was to assess the relationship of dietary calcium intake with kidney stones, there were few analyses on the effects of fluid consumption. Subsequent reports on the beverages consumed (Curhan et al., 1996, 1998) provide data on intake of specific beverages, as well as intake of foods. A third prospective study (Hirvonen et al., 1999), which did not collect data on drinking water and total fluid intake, did report an inverse association of beer consumption with incident kidney stones.
Overall, available evidence, including the results of one clinical trial, strongly suggests that increased total water consumption can be effective therapy to prevent recurrent kidney stones. There is also some evidence from observational studies that increased fluid intake lowers the risk of incident kidney stones. However, this limited evidence is insufficient to set requirements for water intake as a means to prevent kidney stones.
Gallstones
Water ingestion has been shown to induce gallbladder emptying (Yamamura et al., 1988) via vagal stimulation (Svenberg et al., 1985). An association of gallstone formation (cholelithiasis) with low fluid consumption was suggested in a small group of patients (n = 30) with gallstones whose typical daily drinking water intake was estimated to be 0.4 to 0.7 L/day (Math et al., 1986). Subsequently, six individuals, one of whom had gallstones, were evaluated for the effect of water consumption on gallbladder emptying time. They consumed 0.5 L of water rapidly following an overnight fast; this resulted in gallbladder emptying within 10 to 20 minutes for those without gallstones, and 30 minutes for the patient with gallstones. It was concluded that a high daily water intake and consumption of water at regular intervals could assist with promotion of gallbladder emptying, and perhaps prevent gallstone formation (Math et al., 1986). While not tested, other beverages may have a similar effect.
Bladder, Colon, and Other Cancers
The relationship between colon cancer and total water intake has been evaluated, primarily in case-control studies. An early study that reported an inverse relationship between water consumption and colon cancer risk compared 238 men and 186 women with colon cancer to 224 men and 190 women who served as controls (Shannon et al., 1996). In the men studied, consumption of more than four glasses of water/day (~ 0.9 L) in addition to food versus one or fewer glasses/day was marginally associated with decreased colon cancer risk (odds ratio [OR] = 0.68; p = 0.16). In women, more than five glasses of water/day (~ 1.2 L) were associated with decreased colon cancer risk (OR = 0.55; p = 0.004). In another study, a fluid intake of greater than approximately 1.7 L/day was significantly associated with a decreased risk of colorectal adenoma (OR = 0.4; p < 0.01) (Lubin et al., 1997). Water intake levels of greater than six cups (1.4 L)/day have been reported to be protective for distal colon tumors (OR = 0.68) (Slattery et al., 1999).
Bladder cancer risk may also be reduced with increased fluid consumption. Although decreased bladder cancer risk with increased fluid intake has been reported, available studies did not all focus solely on fluid intake and bladder cancer risk (Bitterman et al., 1991; Braver et al., 1987; Pohlabeln et al., 1999; Wilkens et al., 1996). The strongest study to show a clear relationship between fluid intake and bladder cancer risk assessed the total daily fluid intake of 47,909
men (Michaud et al., 1999). Individuals who consumed greater than approximately 2.5 L/day of fluid were reported to have a 49 percent lower risk of bladder cancer than individuals who consumed less than approximately 1.3 L/day. It was also noted that the risk of bladder cancer was reduced by 7 percent for every addition of 240 mL (~1 cup) in daily fluid intake. However, several other studies have failed to demonstrate an overall association between fluid intake and bladder cancer risk (Bruemmer et al., 1997; Geoffroy-Perez and Cordier, 2001; Slattery et al., 1988).
Arrhythmias
One study has reported electrocardiogram (ECG) changes associated with varying levels of water deficit (Sawka et al., 1985). ECG abnormalities (arrhythmias and premature ventricular contractions) during exercise in the heat in healthy young adults who were dehydrated at 5 percent or greater of body weight loss were assessed (Sawka et al., 1985). All eight subjects completed 140 min of exercise without any ECG abnormalities when euhydrated or when dehydrated by 3 percent of body weight. Numerous premature ventricular contractions during exercise-heat trials at 5 and 7 percent dehydration were seen on the remaining subjects.
In another report, three collegiate wrestlers died of cardiorespiratory arrest while undergoing severe and rapid weight loss combined with stressful exercise in the heat (Remick et al., 1998). Because neither cardiorespiratory arrest nor heat injury/stroke had been previously reported with the rapid and severe dehydration procedures used in scholastic or collegiate wrestling, and because these deaths occurred over a short period of time, perhaps an unknown factor may have contributed. However, it is possible that the fluid-electrolyte imbalances resulting from marked dehydration, particularly if combined with stressful exercise, may contribute to ECG abnormalities in some individuals.
Ingestion of cold fluids has been thought to induce cardiac arrhythmias. However, the research in this area is equivocal. Electrocardiogram (ECG) changes after consumption of ice-cold beverages in healthy individuals without known cardiac or gastrointestinal problems were assessed (Pratte et al., 1973). In this controlled study, after ingestion of cold water there were significant changes in the ST segment. These segment changes were greater with larger volumes of cold water ingestion. Conversely, significant ECG changes (using a Holter monitor) were not seen in individuals who consumed iced fluids in another study (Haughey, 1990). Hence,
available data on the effects of cold fluid ingestion as a risk factor for arrhythmia are sparse and inconsistent.
Blood Clots
Few studies have been conducted on the effects of fluid intake on factors that may increase blood clots. In one study, water and an electrolyte-carbohydrate beverage were compared to assess which would maintain hydration and decrease blood viscosity during a 9-hour plane flight (Hamada et al., 2002). Forty healthy men (mean age 23 years) were given approximately 1.3 L of either an electrolyte-carbohydrate beverage or water in five servings during the long flight. Compared with the water group, the men given the electrolyte-carbohydrate beverage gained more body weight, had lower urine output, and had improved net fluid balance. In addition, those who consumed the electrolyte-carbohydrate beverage had less viscous blood than those who drank water. Based on this one study, it appears that on long flights the concomitant consumption of fluid and solute may be more suitable to maintain hydration status and decrease blood viscosity than water alone; however, additional studies are needed to validate this effect.
Mitral Valve Prolapse
The effects of dehydration on mitral valve prolapse (MVP) have been evaluated in order to assess if dehydration could be used as a diagnostic tool for MVP (Lax et al., 1992). MVP, or symptoms associated with it, was induced by mild dehydration and, upon rehydration, the symptoms disappeared (Aufderheide et al., 1994; Lax et al., 1992). A lower atrial filling pressure and volume would result in a floppy valve balloon (prolapse more). It has been recommended that hydration status should be considered if a person with MVP is suspected of having atypical chest pain or palpitations (Aufderheide et al., 1994; Lax et al., 1992).
Osteoporosis
Longitudinal research on the effects of fluid intake on bone mineral density and osteoporosis has not been conducted. However, some short-term studies evaluating bone mineral density changes due to hydration status or the type of ingested fluids are available. The extent to which drinking various amounts of fluids between meals, and the meals themselves, affected body composition and
bone mineral density were assessed in healthy individuals or individuals undergoing hemodialysis (Horber et al., 1992). No changes in bone mineral density as a result of the meals or hydration status were detected.
In a subsequent study, the calcium content of the water or beverage may have a greater impact on bone mineral density than the amount of fluids in terms of volume consumed (Costi et al., 1999).
FACTORS AFFECTING WATER REQUIREMENTS
Environmental Factors
Physical Activity and Heat Strain
Physical activity and heat strain can elicit high rates of total water loss via sweat loss. A person’s sweating rate depends on the climatic conditions, clothing worn, and exercise intensity and duration. In temperate conditions, the capacity for dry heat loss reduces evaporative heat loss requirements, so sweat losses are relatively low. It is not unusual for female and male distance runners to have sweating rates of approximately 0.7 and 1.0 L/hour, respectively, in temperate conditions (Cheuvront and Haymes, 2001). The level of physical fitness has a modest effect on sweat losses, unless accompanied by heat acclimatization. For persons to sustain high-intensity exercise in the heat or perform strenuous labor activities for an entire day in the heat, they would need to be well heat acclimatized.
Exposure to climatic heat stress will increase fluid3 requirements for a given physical activity level. Persons in very hot (e.g., desert) climates often have sweating rates of 0.3 to 1.2 L/hour while performing occupational activities (Gosselin, 1947). Persons wearing protective clothing often have sweating rates of 1 to 2 L/hour while performing light-intensity exercise in hot weather (Levine et al., 1990; Montain et al., 1994). Male competitive runners can have sweating rates of 1.0 to greater than 2.0 L/hour while training or racing in the heat (Armstrong et al., 1986; Costill, 1977; Costill et al., 1970). Female competitive runners may increase their sweat losses
from approximately 0.7 L/hour in temperate weather to approximately 1.1 L/hour in warm weather when performing the same event (Cheuvront et al., 2002). Clearly these exertional rates cannot be sustained for 24 hours. The effect of sustaining these high sweating rates can markedly increase daily total water requirements. For example, the daily fluid intake of soldiers performing either “normal” work (~ 3,350 kcal/day) or physical training (~ 5,500 kcal/day) over a 12-day period in hot climate (mean daytime conditions 40°C [104°F] and 29 percent relative humidity) averaged approximately 7 and 11 L/day for the “normal” and physical training groups, respectively (Mudambo et al., 1997b).
Several analyses have attempted to quantify the effects of hot weather on increasing daily fluid (total water) requirements (Brown, 1947b; Lee, 1964; Sawka and Montain, 2001; U.S. Army, 1959). These analyses (Figures 4-16, 4-17, and 4-18) suggest that daily fluid
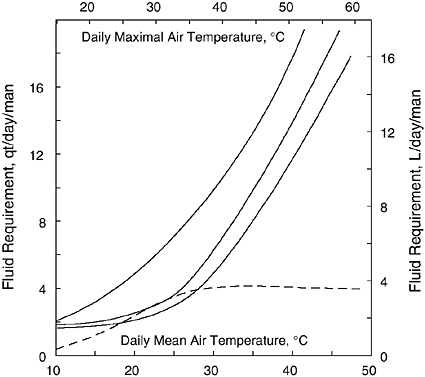
FIGURE 4-16 Daily fluid (water) requirements in soldiers as related to air temperature and activity from studies conducted by Brown (1947b). Top line represents “hard work” 8 h/day. Second line represents the same work but performed at night. Third line represents resting in shade. Bottom line represents the amount of water saved by working at night. Reprinted with permission from the Papers of Edward Adolph collection at the Edward G. Miner Library, University of Rochester Medical Center.
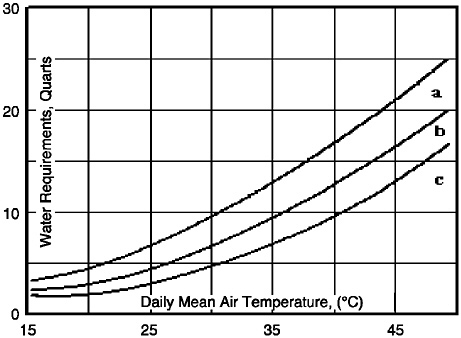
FIGURE 4-17 Daily fluid (water) requirements as related to air temperature and activity from studies conducted by the U.S. Army and used previously to estimate water requirements (1959). Top line (a) represents “hard work” in sun for 8 h/ day. Second line (b) represents moderate work in sun for 8 h/day. The bottom line (c) represents resting in shade for 8 h/day.
requirements range in sedentary, active, and very active persons from 3 to 6 L/day in temperate climates and from 4 to 12 L/day in hot climates (Brown, 1947b; Lee, 1964; Sawka and Montain, 2001; U.S. Army, 1959).
Fluid requirement data, based on intake, was reported in 1947 for soldiers working in different climates (Brown, 1947b). Figure 4-16 provides their reported relationships between daily maximal and mean air temperature values at two levels of physical activity on daily fluid requirements (qt/day, 1 qt = 0.95 L). This analysis did not specify the exact metabolic rates (kcal/day) or climatic heat stress encountered (e.g., radiant heat, humidity, air motion), and the experiments were mostly conducted in desert climates. Note that if the daily mean temperature was 30°C (86°F), the daily fluid requirements approximated ≈ 10 qt (9.5 L) if working 8 hours per day or ≈ 5 qt (4.5 L) if resting in the shade. Figure 4-16 suggests that in extreme heat stress and activity conditions, the daily fluid requirements could be greater than 16 qt (15.2 L). However, most persons reduce their activity level in hot weather, so such high daily fluid requirements would be for very physically fit, heat acclima-
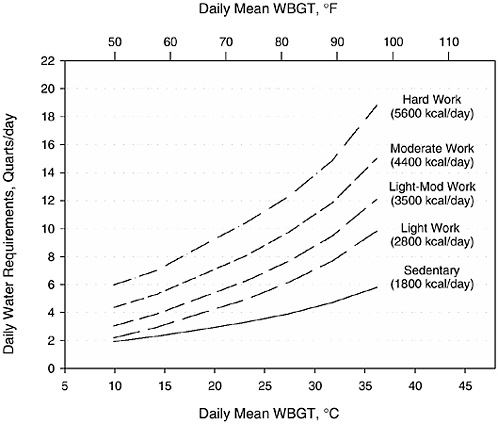
FIGURE 4-18 Approximate daily water requirements as a function of climatic temperature (Wet Bulb Globe Temperature, WBGT) and total energy expenditure (kcal). Reprinted with permission from Sawka and Montain (2001). Copyright 2001 by International Life Sciences Institute.
tized persons forced to work at very high metabolic rates for an extended period of time.
Figure 4-17 presents a graph published a number of years ago by the U.S. Army (1959) that displays daily fluid (water) requirements for soldiers living in hot climates under three conditions. It should be noted that no indication was given as to the type of data used to develop this graph. The analysis did not specify the exact metabolic rates (kcal/day) or climatic heat stress (e.g., radiant heat, humidity, air motion). Note that if the daily mean temperature was 30°C (86°F), the daily water requirements estimated in this graph approximate 12 qt (11.4 L) if working 8 hours per day and 4 qt (3.8 L) if resting in the shade. The figure suggests that in extreme heat stress and activity conditions, the daily water requirements could be greater than 20 qt (19 L).
Daily fluid (water) requirements have been estimated based upon mathematical modeling of sweating rates for a given environmental
condition (Sawka and Montain, 2001). The sweating rates were predicted by using an equation that includes the effects of metabolic rate, climate, and clothing (Moran et al., 1995; Shapiro et al., 1982, 1995). Physical exercise and rest were varied (a 12-hour work period was used) to achieve a variety of total energy expenditure rates at different climatic conditions. Climatic heat stress was quantified by mean daily Wet Bulb Globe Temperature (WBGT), which combines the effects of ambient temperature, humidity, solar load, and wind (Sawka et al., 1996a). Figure 4-18 presents the range of daily fluid (water) requirements of persons performing light (1,800 total kcal/day) through hard (5,640 total kcal/day) work in climates with mean daytime WBGT ranging from 5° to 35°C (41° to 95°F). Note that daily fluid requirements increase with metabolic rate and heat stress. For sedentary to very active persons, daily fluid requirements range from 2 to 4 qt/day (1.9 to 3.8 L/day) in a cool climate and up to 8 to 16 qt/day (7.6 to 15.2 L/day) in very hot climates. For example, in Atlanta, Georgia, the mean daily WBGT temperature is approximately 30°C (86°F) during mid-summer, and persons living there will have daily fluid requirements of 4 to 14 qt/day (3.8 to 13.3 L/day), depending upon their activity levels and duration of exposure (e.g., sitting in air conditioning is not heat exposure). Generally, physical activity is curtailed in hot weather, so high levels of water intake, such as 14 qt/day (13.3 L/day), are rare.
The maximal hourly fluid replacement rate approximates the sweating rates often observed during intense physical exercise in the heat. This upper limit for fluid replacement rate during exercise-heat stress is determined by the gastric emptying rate, as maximal intestinal absorption is not limiting (Gisolfi and Ryan, 1996). The maximal gastric emptying rate approximates 1.0 to 1.5 L/hour for an average adult man (Mitchell and Voss, 1991; Murray, 1987) but has considerable individual variability and is influenced by gastric volume (the higher the volume, the greater the emptying rate). Gastric emptying rates are reduced somewhat during high- (greater than 75 percent VO2max) intensity exercise (Costill and Saltin, 1974; Neufer et al., 1989b), dehydration (Neufer et al., 1989a; Rehrer et al., 1990), and heat strain (Neufer et al., 1989a; Rehrer et al., 1990). Dehydration probably mediates reduced gastric emptying by increasing heat strain, as an inverse relationship (r = −0.76) between the fluid volume emptied and core temperature has been observed (Neufer et al., 1989a).
This is consistent with observations by Rehrer and colleagues (1990), who found that dehydration reduced gastric emptying rate during exercise when core temperature was elevated above
euhydration levels, but not at rest when core temperature was not elevated. Likewise, Ryan and colleagues (1998) found that dehydration (approximately 3 percent of body weight) did not influence gastric emptying or intestinal absorption during exercise without marked heat strain. Their subjects had final exercise core temperatures of 38.5°C (101.3°F), which was approximately the core temperature where the subjects of Neufer and colleagues (1989a) began to clearly demonstrate reduced gastric emptying.
Altitude and Cold
Altitude exposure will result in dehydration because of elevated respiratory water losses (approximately 200 mL/day above the usual baseline of 250 mL/day), hypoxia-induced diuresis, reduced fluid consumption (approximately 2 to 3 L over several days), and possibly elevated sweating from the high metabolic rates needed to traverse rugged mountain terrains (Anand and Chandrashekhar, 1996; Hoyt and Honig, 1996). The net effect is a total body water deficit reduction during altitude exposure (Anand and Chandrashekhar, 1996; Hoyt and Honig, 1996). In lowlanders exposed to moderate altitude (> 2,500 m), hypoxia will rapidly initiate diuresis that continues for several days (Anand and Chandrashekhar, 1996; Hoyt and Honig, 1996). This diuresis and the factors discussed above decrease total body water and plasma volume in proportion to the elevation of ascent (Sawka et al., 2000). Mechanisms responsible for the resultant hemoconcentration include diuresis, natriuresis, and dehydration, as well as loss of circulating plasma protein (Anand and Chandrashekhar, 1996; Hoyt and Honig, 1996; Sawka et al., 2000). This hemoconcentration is isoosmotic (unless sweat-induced dehydration contributes) and exceeds the reduction in total body water because it is largely oncotically mediated (Sawka et al., 1996b).
Body water reduction and hemoconcentration are believed to provide several physiological benefits by contributing to the increased oxygen content (Sawka et al., 2000) and perhaps reduced risk of mountain sickness (e.g., Acute Mountain Sickness, pulmonary edema, cerebral edema) (Anand and Chandrashekhar, 1996). The effects of dehydration on mountain sickness and performance decrements at altitude have not been studied.
Body fluid losses in cold climates can be as high as losses in hot climates due to high rates of energy expenditure and use of heavy clothing (Freund and Young, 1996). Fluid losses during cold exposure are commonly thought to result from cold-induced diuresis
and increased respiratory water losses (see Table 4-3). Cold-induced diuresis (CID) is well studied and is a “normal” physiological response to body cooling. Urine specific gravities decrease with CID; however, they cluster around 1.009 (Bass and Henschel, 1956). CID induces an isoosmotic hemoconcentration, and there is little relationship between the magnitude of diuresis and hemoconcentration (Bass and Henschel, 1956; Young et al., 1987). The reduction in body water with contracting vascular volume is probably of no concern as long as the body remains cool.
Dehydration does not modify thermoregulation during cold exposure as evidenced by body heat balance (O’Brien et al., 1998) or peripheral vascular responses (O’Brien and Montain, 2003). However, if the dehydrated person were to subsequently exercise and produce body heat while wearing highly insulating clothing, then heat stress will be encountered. (The effects of dehydration and heat stress on thermoregulation and physical work performance have been discussed earlier in this chapter.)
Dietary Factors
Caffeine
Caffeine is one of three methylxanthines found in foods; it is naturally present in coffee, teas, and chocolate, is added to colas and other beverages (IOM, 2001a), and is a component of many medications (Passmore et al., 1987). It is estimated that 20 to 30 percent of Americans consume more than 600 mg of caffeine daily (Neuhauser-Berthold et al., 1997). The other two methylxanthines, theobromine (found in chocolate) and theophylline (found in tea), demonstrate some, but not all, of the pharmacological effects of caffeine (Dorfman and Jarvick, 1970).
It has long been thought that consumption of caffeinated beverages, because of the diuretic effect of caffeine on reabsorption of water in the kidney, can lead to a total body water deficit. However, available data are inconsistent. As early as 1928 it was reported that caffeine-containing beverages did not significantly increase 24-hour urinary output (Eddy and Downs, 1928). Caffeine-containing beverages did not increase 24-hour urine volume in healthy, free-living men when compared with other types of beverages (e.g., water, energy-containing beverages, or theobromine-containing beverages) (Dorfman and Jarvik, 1970; Grandjean et al., 2000).
Conversely, in a study in which 12 individuals who normally consumed caffeinated beverages were required to abstain from all
methylxanthine-containing foods and drugs for 5 days and who were then were given 642 mg of caffeine in the form of coffee, 24-hour urine output increased by 0.75 ± 0.53 L, a 41 percent increase (Neuhauser-Berthold et al., 1997). Given that the study design did not evaluate habitual intake, it is difficult to determine the extent to which this large amount of caffeine would impact total water needs on a chronic basis.
In an earlier study, the effect of caffeine intake on urinary output was evaluated in eight men who were asked to consume four cups of coffee or six cups of tea/day (providing approximately 240 mg of caffeine/day) for 5 days prior to data collection and then to abstain from caffeine 24 hours prior to data collection (Passmore et al., 1987). The subjects were then given various doses of caffeine (45, 90, 180, or 360 mg) on the study day. Cumulative urine volume 3 hours after consuming the test dose was increased significantly only at the 360-mg dose of caffeine. This is equivalent to four cups of regular brewed coffee (USDA/ARS, 2002).
Caffeine can induce hemodynamic effects not directly related to fluid balance. The acute pressor effects (e.g., vasoconstriction, palpitations) of caffeine consumption are well documented; however, in a review of the relevant literature, there was no clear epidemiologic evidence that habitual caffeine consumption leads to hypertension (Nurminen et al., 1999).
In aggregate, available data suggest that higher doses of caffeine (above 180 mg/day) have been shown to increase urinary output, perhaps transiently, and that this diuretic effect occurs within a short time period (Passmore et al., 1987). Whether or not caffeine ingestion at high amounts leads to a total body water deficit is uncertain (IOM, 2001a), although some have tried to develop a predictive model of water needs based on the limited data available (Stookey, 1999). Hence, unless additional evidence becomes available indicating cumulative total water deficits in individuals with habitual intakes of significant amounts of caffeine, caffeinated beverages appear to contribute to the daily total water intake similar to that contributed by noncaffeinated beverages.
Alcohol
Similar to caffeine, the diuretic effect of alcohol is mediated by the suppression of arginine vasopressin (Stookey, 1999). Increased diuresis was reported during the initial 3 hours of consuming a beverage in which alcohol (ethanol) was present (consumed at level of 1.2 g/kg of body weight in a solution of fruit juice) in healthy,
adult men (Taivainen et al., 1995). Nonetheless, 6 hours after ingestion, there was an antidiuretic phase, which lasted up to 12 hours post-alcohol ingestion (Taivainen et al., 1995). This could have been a result of a high serum osmolality that stimulated arginine vasopressin, resulting in water reabsorption (Taivainen et al., 1995). The effects of ethanol appear to change during the course of the day and may depend on the amount of water consumed at prior meals (Stookey, 1999). Thus, based on these limited data, it appears that the effect of ethanol ingestion on increasing excretion of water appears to be transient and would not result in appreciable fluid losses over a 24-hour period.
Macronutrients
Urea, a major end product of metabolism of dietary proteins and amino acids, requires water for excretion by the kidneys. Renal excretion of 1 g of urea nitrogen (2.2 g of urea) requires 40 to 60 mL of water. Thus, if a person consumes 63 g of protein in a diet that contains 2,100 kcal, the volume of water required increases by 0.4 to 0.6 L/day above the basal osmolar excretory requirement of 0.5 and 0.75 L/day in younger and older individuals, respectively. Increasing dietary protein did not affect water intake or urine volume in eight men fed constant diets with 80 versus 180 g/day of protein for 7 days while energy and sodium intake remained constant (Luft et al., 1983). Ad libitum water intake was reported to be 2.8 and 2.7 L/day and urine volume was 2.1 and 2.0 L/day, respectively. Although changes in solute and urea nitrogen excretion were reported, these changes were appropriate for the changes in protein intake. Thus increased protein intake did not affect water intake or urine volume in the setting of ad libitum water consumption.
Like protein, the presence of dietary carbohydrate may also affect water requirements. On average, 100 g/day of carbohydrate is needed to prevent ketosis (IOM, 2002/2005). This amount of carbohydrate has been shown to decrease the body water deficit by decreasing the quantity of body solutes (ketone bodies) that need to be excreted (Gamble, 1947). This response is similar when ketosis occurs with consumption of very low carbohydrate diets.
Fecal water losses are increased with increased dietary fiber. The effects of adding 5.1 g/day of crude fiber to the diet of 20 nuns who ranged in age from 25 to 72 years were evaluated (Baird et al., 1977); mean total daily crude fiber intake was 8.4 g (Baird et al., 1977). After 12 weeks, consumption of a high-fiber biscuit resulted in a significant increase in fecal water loss compared with a placebo
biscuit (107 versus 67 mL/day, p < 0.01) (Baird et al., 1977). Other studies have also demonstrated increased stool weight due to increased fecal water during periods of increased dietary fiber intake (Cummings et al., 1976; Floch and Fuchs, 1978).
Sodium Intake
The effects of increased sodium intake on urine volume, a proxy of water intake, have been assessed in two experimental studies (He et al., 2001; Luft et al., 1983). In one study, 24 men were given 0.23, 4.6, and 9.2 g (10, 200, and 400 mmol)/day of sodium for 7 days while energy, potassium, and protein intake were maintained at a constant level (Luft et al., 1983). In spite of a 40-fold increase in sodium intake, little change was noted in urine volume (which averaged 2.1 L on the lowest sodium intake level and 2.3 L on the highest). In a second study, 104 hypertensive subjects (48 men and 56 women) were studied after 5 days on approximately 8 g (350 mmol)/day of sodium and again after 5 days on 0.23 to 0.5 g (10 to 20 mmol)/day (He et al., 2001). Twenty-four-hour urine excretion volume was 2.2 L at the higher sodium level, but significantly less, just 1.3 L, on the lower sodium level. In separate analyses of data from the Intersalt study, it was estimated that a 2.3 g (100 mmol)/ day reduction in sodium intake should decrease 24-hour urine volume by 0.38 and 0.40 L in hypertensive and nonhypertensive individuals, respectively (He et al., 2001). Overall, based on these limited data, it is not possible to determine the extent to which sodium intake influences water intake.
Pathophysiologic Factors
Diabetes Mellitus
There is no evidence that increased water intake influences the detection of diabetes mellitus or alters the diagnostic approach to this illness. However, dehydration is clearly associated with worsening of diabetes control. In addition, uncontrolled diabetes mellitus dramatically enhances the development of severe dehydration and volume depletion due to osmotic diuresis. The changes in acid-base balance and increased osmolality of urine from hyperglycemia-induced glycosuria and ketoaciduria increase urine output. In poorly controlled diabetic individuals, reduced water intake can also lead to dehydration as a result of infection or hypotension, which can lead to delirium and impaired ability to seek water.
While two-thirds of diabetic ketoacidosis and hyperglycemic hyperosmolar states are associated with infections, many episodes develop with minimal or no apparent causation. In these settings, dehydration may be the clinical presentation of the altered diabetic state and can be quite profound, with deficits of whole-body water exceeding 5 L. In these individuals, weakness and confusion further reduce fluid intake and lead to greater dehydration.
Cystic Fibrosis
The concentration of sodium chloride in the sweat of patients with cystic fibrosis (CF) is considerably higher than that of age-matched healthy individuals. In some patients, sweat sodium and chloride levels may approach their plasma concentrations. In contrast, sweat sodium and chloride levels of healthy individuals seldom exceed 60 to 70 mmol/L. As a result, patients with CF may lose excessive amounts of sodium chloride, particularly when their sweating rates are elevated during physical exercise or exposure to climatic heat (Bar-Or et al., 1992; Kriemler et al., 1999; Orenstein et al., 1983).
Unlike healthy people, whose body fluid osmolality rises as a result of sweating, the osmolality of CF patients does not increase due to high concentrations of sodium and chloride in their sweat. The excessive loss of these ions results in significantly lower serum sodium and chloride concentrations, as well as lower serum osmolality. Furthermore, drinking water while exercising in the heat can also contribute to the decrease in serum osmolality experienced by CF patients (Kriemler et al., 1999; Orenstein et al., 1983). Without elevated serum osmolality, these patients are deprived of a major trigger for thirst and, as a result, dehydration ensues. A study with 10- to 14-year-old CF patients showed that during a 3-hour intermittent exercise program in 31° to 33°C (88° to 91°F), voluntary drinking of water was only half that of age-matched controls, and the CF patients’ level of dehydration was threefold that of the controls (Bar-Or et al., 1992) (Figure 4-19).
One can stimulate the thirst of patients with CF, as with healthy individuals, by increasing the sodium chloride content in the fluid ingested. Indeed, when 11- to 19-year-old patients with CF were given a flavored drink containing 50 mmol/L of sodium chloride, their voluntary drinking increased, which was sufficient to prevent dehydration during a 3-hour exposure to exercise in the heat. Lower concentrations of sodium chloride in the drink were insufficient to trigger adequate drinking (Kriemler et al., 1999).
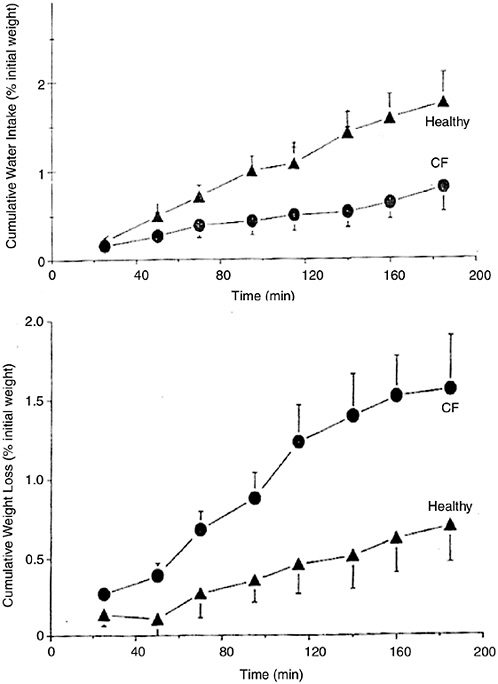
FIGURE 4-19 Cumulative voluntary water intake (top graph) and involuntary dehydration (bottom) in 10- to 14-year-old girls and boys with cystic fibrosis and in healthy controls, during intermittent exercise in hot climate. Reprinted with permission, from Bar-Or et al. (1992). Copyright 1992 by Elsevier.
Renal Disease
Studies have been conducted to assess whether increased water intake will prevent renal disease (aside from kidney stone formation, as discussed earlier). The association between consumption of varying amounts of water intake and renal function was assessed in a study of eight men and one woman (Shore et al., 1988). As expected, urine volume decreased during water restriction and urine volume increased with water loading. These changes occurred without any effects on atrial natriuretic peptide levels. Plasma arginine vasopressin and plasma and urine osmolality were increased during water restriction and decreased during the water loading period (Shore et al., 1988). Similar changes in plasma osmolality and arginine vasopressin levels have been reported during water loading (Kimura et al., 1976). While no specific data were identified that would indicate that the volume of water consumed on a chronic basis was related to subsequent development of kidney diseases, such as glomerulonephritis or end-stage renal disease, total water consumption must be adequate to allow excretion of variable amounts of osmotically active ions and compounds that are the end products of dietary intake and metabolism; in healthy-functioning kidneys, it appears that homeostatic changes typically maintain water balance in spite of the wide range of dietary intakes (Shore et al., 1988).
Diuretics and Medication Use
There are no medications that directly stimulate water intake. However, certain anticholineric drugs may do so indirectly by producing a dry mouth. Also, in settings where decreased fluid intake has occurred, medications that improve metabolic and cognitive function should indirectly assist individuals to increase fluid intake. Examples of such medications include antibiotics for infection, insulin for unstable diabetes, and analgesics to control pain that has produced delirium. Antidepressant therapy may also stimulate improved fluid intake.
On the other hand, some medications produce excess water loss. In the situation of diuretic use, unintentional dehydration may occur when individuals reduce their fluid intake for some illness or behavior-related reason, yet continue with their diuretic treatments. This may occur clinically when a heart failure patient on chronic diuretics undergoes a bowel preparation for elective colonoscopy and loses excess fluid through the gastrointestinal tract during the preparation. Dehydration may also occur if the individual does not
modify the chronic use of diuretics in situations where excess water losses occur (e.g., prolonged environmental heat).
Some medications, such as lithium, may interfere with regulatory systems for the control of arginine vasopressin release and result in a central or nephrogenic diabetes insipidus (Posner and Mokrzycki, 1996; Stone, 1999). In this setting, water losses through the kidney increase dramatically as arginine vasopressin is unavailable to stimulate water reabsorption back into the collecting tubules.
FINDINGS BY LIFE STAGE AND GENDER GROUP
Infants Ages 0 Through 12 Months
Evidence Considered in Setting the AI
As is described in Chapter 2, unless there is reason to believe that human milk is inadequate in meeting an infant’s need for a nutrient, an adequate intake (AI) is derived for infants based on data regarding human milk consumption for this age group.
Water Production and Losses. Infants ages 0 to 12 months merit special consideration regarding water losses and requirements. Compared with children and adults, infants have a higher total body water content per kg of body mass (Altman, 1961), a higher surface area-to-body mass ratio, a higher rate of water turnover (Fusch et al., 1993), a less-developed sweating apparatus (Kuno, 1956), a limited ability to excrete solutes, and a lower ability to express thirst.
During the first year of life, more than half of daily water losses occur through urine (Goellner et al., 1981; NRC, 1989). Insensible loss accounts for approximately 40 percent and stool for approximately 5 percent. Most studies report daily urine losses of approximately 90 to 110 mL/kg of body weight. Based on periodic monitoring of 15 healthy, full-term infants undergoing metabolic balance studies, daily urine volume was 59 percent of volume intake in the first month of life. It gradually decreased, reaching 47 percent in months 6 to 12, and again rose to just over 50 percent during months 12 to 32 (Goellner et al., 1981).
It is not known what percentage of insensible water loss is respiratory loss versus losses from the skin. Sweating can occur soon after birth, but not in all infants. In one study, 64 percent of full-term newborns excreted sweat within several hours of birth when they were exposed to a warm environment in the nursery (Agren et al., 1997). Some evidence exists, however, that the sweating apparatus is not fully developed before the third year of life (Kuno, 1956).
Very little information is available on metabolic water production in infants. In one study, the metabolic water production in 10- to 15-month-old infants was 13 percent of water turnover (Fusch et al., 1993), a value similar to that found in adults.
Milk Consumption. Infants exclusively fed human milk do not require supplemental water. This is true not only during temperate climatic conditions, but also in hot and humid climates (Almroth and Bidinger, 1990; Cohen et al., 2000). It is also true for term infants with low birth weight (Cohen et al., 2000).
Average total daily intake of water of all sources in the first year of life was 130 mL/kg/day based on data from 296 infants in the 1994–1996 Continuing Survey of Food Intake by Individuals (CSFII) conducted by the U.S. Department of Agriculture (Heller et al., 2000). This total intake of water decreased significantly to 108 mL/kg/day in year two. Non-Hispanic blacks had the highest total water consumption (129 mL/kg/day), while non-Hispanic whites had the lowest consumption (113 mL/kg/day) (Heller et al., 2000).
As discussed in Chapter 2, the average volume of human milk consumed during the first 6 months of life is estimated to be 0.78 L/day. Because approximately 87 percent of the volume of human milk exists as water, approximately 0.68 L/day (0.78 × 0.87) of water is consumed. Therefore the AI for total water for infants 0 through 6 months of age is set at 0.7 L/day after rounding to the nearest 0.1 L.
Milk volume for infants 7 to 12 months of age has been estimated to be 0.6 L/day (see Chapter 2). Water intake for older infants can be determined by estimating the water intake from human milk (concentration × 0.6 L/day) and from complementary foods and other beverages (see Chapter 2). Water intake data from complementary foods and beverages other than human milk was estimated to be 0.32 L/day based on data from the CSFII (Appendix E).4 The average water intake from human milk is approximately 0.52 L/day (0.87 × 0.6 L/day). Thus the total water intake is estimated to be 0.84
L/day (0.32 + 0.52). The AI is set at 0.8 L/day after rounding to the nearest 0.1 L. Based on CSFII, approximately 26 percent of total water intake is from foods, whereas 74 percent is from beverages (including formula and drinking water) for infants 7 to 12 months of age.
Total Water AI Summary, Ages 0 Through 12 Months
|
AI for Infants |
|
|
0–6 months |
0.7 L/day of water, assumed to be from human milk. |
|
7–12 months |
0.8 L/day of total water, assumed to be from human milk, complementary foods and beverages. This includes approximately 0.6 L (≈ 3 cups) as total fluid, including formula or human milk, juices, and drinking water. |
Children and Adolescents Ages 1 Through 18 Years
Evidence Considered in Setting the AI
In general, the differences in body water content between children, adolescents, and adults are smaller than between infants and children. This is shown in Table 4-1 for total body water as a fraction of body mass (Altman, 1961). A gradual, modest decline during childhood and adolescence in total body water per fat-free mass and per body mass in shown in Figure 4-1 (Van Loan and Bolieau, 1996).
Based on water balance studies, daily water intake increases twofold between the first month of life and months 6 to 12 (Goellner et al., 1981). In contrast, the increase in the daily intake between the ages of 2 and 9 years is only about 5 to 10 percent (Table 4-4). Likewise, based on doubly labeled water measurements, daily water turnover per body mass declines rapidly between infancy and early childhood, but thereafter, the decline is modest.
There are a number of indicators that can be used for assessing water status; however, because of homeostatic responses, some degree of over- and underhydration can be compensated for over the short term. Therefore, there is not a single water intake level that can be recommended for ensuring adequate hydration and optimal health. Data from Third National Health and Nutrition Examination Survey (NHANES III) demonstrate that normal hydration status for children (12 to 18 years of age), as measured by serum osmo-
lality, can be achieved with a wide range of total water intakes (e.g., first through 99th percentile of total water intake) (Appendix Table G-1). Therefore, the AI for total water is set based on the median total water intake using data from NHANES III (Appendix Table D-1) and rounding to the nearest 0.1 L.
Based on these data, the median total water intake for children 1 to 3 years of age was 1.3 L/day, children 4 to 8 years was 1.7 L/day, boys 9 to 13 years was 2.4 L/day, boys 14 to 18 years was 3.3 L/day, girls 9 to 13 years was 2.1 L/day, and girls 14 to 18 years was 2.3 L/ day.
The percent of total water that was consumed from foods was 29 percent for ages 1 to 3 years (0.38 L/day), 29 percent for ages 4 to 8 years (0.51 L/day), 24 percent for boys 9 to 13 years (0.58 L/day), 20 percent for boys 14 to 18 years (0.67 L/day), 24 percent for girls 9 to 13 years (0.52 L/day), and 20 percent for girls 14 to 18 years (0.46 L/day) (derived from Appendix Table D-1 and D-4, by dividing the median in Table D-4 by the median in Table D-1).
Total Water AI Summary, Ages 1 Through 18 Years
|
AI for Children |
|
|
1–3 years |
1.3 L/day of total water. This includes approximately 0.9 L (≈ 4 cups) as total beverages, including drinking water.5 |
|
4–8 years |
1.7 L/day of total water. This includes approximately 1.2 L (≈ 5 cups) as total beverages, including drinking water. |
|
AI for Boys |
|
|
9–13 years |
2.4 L/day of total water. This includes approximately 1.8 L (≈ 8 cups) as total beverages, including drinking water. |
|
14–18 years |
3.3 L/day of total water. This includes approximately 2.6 L (≈ 11 cups) as total beverages, including drinking water. |
|
AI for Girls |
|
|
9–13 years |
2.1 L/day of total water. This includes approximately 1.6 L (≈ 7 cups) as total beverages, including drinking water. |
|
14–18 years |
2.3 L/day of total water. This includes approximately 1.8 L (≈ 8 cups) as total beverages, including drinking water. |
Adults Ages 19 Through 50 Years
Evidence Considered in Setting the AI
Hydration status, as assessed by plasma or serum osmolality, is the primary indicator used for water. As documented previously, physical activity and environmental conditions have substantial influences on water needs (see later section, “Special Considerations”). Also, because of homeostatic responses, some degree of over- and underhydration can readily be compensated over the short-term. While it might appear useful to estimate an average requirement (an EAR) for water, it is not possible. An EAR is set based on data indicating that about half the individuals in the life stage group would have their needs met, while the other half would be inadequate at a specific intake level. Given the extreme variability in water needs that are not solely based on differences in metabolism, but also in environmental conditions and activity, there is not a single level of water intake that would ensure adequate hydration and optimal health for half of all apparently healthy persons in all environmental conditions. Thus an AI is established in place of the EAR (upon which a Recommended Dietary Allowance could be based).
Based upon a review of water balance studies (Table 4-5) for inactive adults in temperate climates, the minimal water requirement should be approximately 1 to 3.1 L/day to replace respiratory, urinary, fecal, and insensible fluid losses (Table 4-2). Data from NHANES III demonstrate that normal hydration status for all adults, as measured by serum osmolality, can be achieved with a wide range of water intakes (e.g., first through 99th percentile of total water intake) (Appendix Table G-1). Therefore, the AIs for total water are set based on median intakes of total water (drinking water, beverages, and food) from NHANES III (Appendix Table D-1), rounded to the nearest 0.1 L. These AIs cover the minimal losses that routinely occur in temperate climates for somewhat sedentary individuals and are based upon the factors previously discussed.
Individual water requirements can vary greatly, even on a day-to-day basis, because of differences in physical activity and climates. To a lesser extent, dietary factors also influence water requirements, as the osmotic load created by metabolizing dietary protein and or-
ganic compounds, as well as by varying intakes of electrolytes, must be accommodated by adequate total water consumption. Hence there is no single daily total water requirement for a given person, and need varies markedly depending primarily on physical activity and climate, but also based on diet. It would be misinterpreting the basis for setting the AI to state that there is a“requirement” for water at the level of the AI. As is discussed in Chapter 1, the AI does not represent a requirement; it is an amount that should meet the needs of almost everyone in the specific life stage group under the conditions described. It is thus determined on a different scientific basis than other recommendations for water or fluid intake (NRC, 1989).
The AI for total water intake for young men and women (19 to 30 years) is 3.7 L (131 oz) and 2.7 L (95 oz)/day, respectively, which correspond to median intakes for this age group in the NHANES III survey (Appendix Table D-1). Fluids (drinking water and beverages) provided about 3.0 and 2.2 L/day for 19- to 30-year-old men and women, respectively, representing approximately 81 percent of total water intake (Appendix Table D-3). Water from food provided 19 percent of total water intake, or 0.7 L/day for men and 0.5 L/day for women (Appendix Table D-4). While it is recognized that the median intake for men and women 31 to 50 years was lower, there is no reason to assume that the level recommended for adults 19 to 30 years would be in excess. Therefore, the AI for those ages 31 to 50 years is set equal to that for younger adults.
It is recognized that nationwide surveys such as NHANES III that rely on self-report are often inaccurate and possibly biased, with a greater tendency to underestimate actual intake (IOM, 2001b). People who meet the recommended 60 minutes per day or the equivalent of moderate physical activity (IOM, 2002/2005) and consume approximately 2,200 kcal can meet the AI through beverages and food (see Table 4-14).
Total Water AI Summary, Ages 19 Through 50 years
|
AI for Men |
|
|
19–30 years |
3.7 L/day of total water. This includes approximately 3.0 L (≈ 13 cups) as total beverages, including drinking water.6 |
|
31–50 years |
3.7 L/day of total water. This includes approximately 3.0 L (≈ 13 cups) as total beverages, including drinking water. |
TABLE 4-14 Daily Water Intake from a Diet Providing 2,200 kcal
|
Meal |
Food/Beverage Consumed |
Energy (kcal) |
Water (mL) |
|
Breakfast |
Shredded wheat miniatures fortified ready-to-eat cereal (1 cup) |
183 |
2 |
|
|
Milk, 1% (8 oz) |
102 |
219 |
|
Orange juice (6 oz) |
82 |
165 |
|
|
Cantaloupe, cubed (1/2 cup) |
27 |
72 |
|
|
White toast (1 slice) with unsalted margarine vegetable oil spread (1 tsp) |
89 |
9 |
|
|
Coffee, black, unsweetened (12 oz.) |
13 |
354 |
|
|
Total for meal |
496 |
821 |
|
|
Snack |
Banana (1 medium) |
105 |
88 |
|
|
Water (12 oz.) |
0 |
356 |
|
Total for snack |
105 |
444 |
|
|
Lunch |
Sandwich with turkey (2 oz) Swiss cheese (1 oz), lettuce (2 leaves), tomato (1/4″ slice), and mayonnaise (1 tbsp) on whole wheat bread (2 slices) |
395 |
113 |
|
|
Baby carrots (8) |
28 |
72 |
|
Fig bars cookies (2) |
111 |
5 |
|
|
Iced tea, brewed, decaffeinated (16 oz) |
5 |
472 |
|
|
Total for meal |
539 |
662 |
|
|
Snack |
Almonds, dry roasted, unsalted (1/4 cup) |
206 |
1 |
|
|
Raisins (1/4 cup) |
108 |
6 |
|
Milk, 1% (8 oz) |
102 |
219 |
|
|
Water (12 oz) |
0 |
356 |
|
|
Total for snack |
416 |
582 |
|
|
Dinner |
Baked salmon (3 oz) |
151 |
57 |
|
|
Long-grain brown rice (1/2 cup cooked) |
108 |
71 |
|
Tossed salad (1 1/2 cups) with safflower oil and vinegar dressing (2 tbsp) |
155 |
212 |
|
|
Asparagus (6 spears) |
20 |
83 |
|
|
Wheat roll (1 medium) with unsalted margarine vegetable oil spread (1 tsp) |
101 |
12 |
|
|
Angel food cake (1 slice) with sliced strawberries (1/2 cup) and whipped cream topping (2 tbsp) |
114 |
88 |
|
AI for Women |
|
|
19–30 years |
2.7 L/day of total water. This includes approximately 2.2 L (≈ 9 cups) as total beverages, including drinking water. |
|
31–50 years |
2.7 L/day of total water. This includes approximately 2.2 L (≈ 9 cups) as total beverages, including drinking water. |
Older Adults and the Elderly Ages 51+ Years
Evidence Considered in Setting the AI
Renal Concentrating Ability. Renal concentrating ability is well known to decline with age in humans (Dontas et al., 1972; Lindeman et al., 1966; Rowe et al., 1976). In several studies the maximal urine osmolality, when measured following 12 to 24 hours of dehydration, was inversely related to age (Dontas et al., 1972; Lindeman et al., 1966). In one study, the maximal urine osmolality was 1,109 mOsmol/kg in 31 subjects 20 to 39 years old, compared with 1,051 mOsmol/kg in 48 subjects 40 to 59 years old and 882 mOsmol/kg in 18 subjects 60 to 79 years old (Rowe et al., 1976). It is interesting to note that the age-related decline in concentrating
ability did not correlate with the age-related decline in the glomerular filtration rate (GFR) (Dontas et al., 1972; Rowe et al., 1976). While this age-related deficit in water conservation can easily be demonstrated in physiologic studies, it is likely to be of major clinical consequence if individuals are exposed to high solute excretion requirements.
Studies in humans suggest that the concentrating defect is due to an intrarenal defect rather than a failure in the osmotic-induced release of arginine vasopressin (Helderman et al., 1978; Lindeman et al., 1966; Miller and Shock, 1953). Following intravenous infusion of hypertonic saline (3 percent sodium chloride) in eight young (22 to 48 years of age) and eight older (52 to 66 years of age) men, serum arginine vasopressin concentrations rose 4.5 times the baseline in the older men compared with 2.5 times the baseline in the younger men despite similar free water clearances (Helderman et al., 1978). The slope of the serum arginine vasopressin concentration (as a percentage of baseline) versus serum osmolality, an index of the sensitivity of the osmoreceptor, was significantly increased in the older subjects. In addition, intravenous infusion of ethanol in 9 younger (21 to 49 years of age) and 13 older (54 to 92 years of age) men resulted in a progressive decline in plasma arginine vasopressin levels in the young subjects, but failed to have a similar effect in the older subjects (Helderman et al., 1978).
In contrast to osmotic stimulation, volume-pressure-mediated arginine vasopressin release has been found to decrease with old age and appears to be absent in many healthy elderly people (Rowe et al., 1982). An additional factor that may influence arginine vasopressin concentrations and impair water conservation in the elderly is the increase in atrial natriuretic peptide (ANP) concentrations with age, since ANP has been demonstrated to suppress arginine vasopressin release in response to hyperosmolality in young and old individuals (Clark et al., 1991).
Studies in humans reveal an age-related increase in solute excretion and osmolar clearance during dehydration (Rowe et al., 1976). This phenomenon, which may be a reflection of an impaired solute transport by the ascending loop of Henle, may be responsible for the impairment in urine concentrating ability in elderly subjects. This possibility is supported by clearance studies during water diuresis that demonstrate a decrease in the sodium chloride transport in the ascending loop of Henle in elderly subjects (Macias-Nunez et al., 1978, 1980). This defect in solute transport by the thick ascending limb of the loop of Henle could diminish inner medullary hypertonicity and thereby impair urinary concentrating ability.
Renal Diluting Ability
Renal diluting ability is also impaired as a function of aging (Crowe et al., 1987; Epstein, 1985; Lindeman et al., 1966). In water-diuresing subjects as a result of water loading, minimal urine osmolality was significantly higher: 92 mOsmol/kg in the elderly subjects (aged 77 to 88 years) when compared with 52 mOsmol/kg in the young subjects (aged 17 to 40 years). Free water clearance was also decreased: 5.9 mL/minute in the elderly subjects compared with 16.2 mL/ minute in the young subjects (Lindeman et al., 1966). While the impairment is largely due to the decrease in GFR, when free water clearance is factored for GFR, the ratio of free water clearance to GFR is, however, still decreased in the older subjects (Crowe et al., 1987; Lindeman et al., 1966). Mechanisms of the impaired diluting ability in the elderly have not been well studied. In addition to the major role of impaired GFR, inadequate suppression of arginine vasopressin release or impaired solute transport in the ascending loop of Henle may also play a role.
Thirst in the Elderly
The age-related impairments in renal-concentrating and sodium-conserving ability are associated with an increased incidence of volume depletion and hypernatremia in the elderly (Snyder et al., 1987). Under normal physiological conditions, increased thirst and fluid intake are natural defense mechanisms against volume depletion and hypernatremia. A deficit in thirst and regulation of fluid intake in the elderly, however, may further contribute to the increased incidence of dehydration and hypernatremia.
Several studies confirm the long-held clinical observation that thirst and fluid intake are impaired in the elderly (Fish et al., 1985; Miller et al., 1982; Murphy et al., 1988; Phillips et al., 1984). In a series of studies the osmotic threshold for thirst during hypertonic saline infusion has been found to be much higher in healthy elderly subjects than in their younger counterparts, with many apparently healthy elders not reporting thirst despite elevations of plasma osmolality to levels over 300 mOsmol/kg (Fish et al., 1985). In studies of water ingestion after intravenously induced hyperosmolality, elderly individuals demonstrated marked reductions in their water intake and rate of return of plasma osmolality to baseline when compared with the younger group (Murphy et al., 1988). The influence of free access to water on prevention of serum osmolality increases during hypertonic saline infusion was also investigated (McAloon-
Dyke et al., 1997). Despite equivalent increases in plasma volume, the older group consumed significantly less water and had greater increases in serum osmolality than the younger group.
Thirst may also be severely impaired in patients with a prior history of stroke who do not have cognitive impairment or evidence of hypothalamic or pituitary dysfunction (Miller et al., 1982). The complication of age-related decreases in thirst by systemic illnesses and dementia in many frail elderly patients clearly place them at risk for the development of severe water deficiency.
Summary. While there are differences in renal physiology that occur with aging, Appendix Table G-1 (which provides serum osmolality values by percentile of water intake) indicates that hydration status continues to be normal over a wide range of intakes for elderly individuals as well as younger individuals. The AI for total water (drinking water, beverages, and foods) for the elderly is set based on median total water intake of young adults (Appendix Table D-1), rather than the older age group, in order to ensure that total water intake is not limited in the face of a potential declining ability to consume adequate amounts in response to thirst.
Total Water AI Summary, Ages 51+ Years
|
AI for Men |
|
|
51–70 years |
3.7 L/day of total water. This includes approximately 3.0 L (≈ 13 cups) as total beverages, including drinking water.7 |
|
> 70 years |
3.7 L/day of total water. This includes approximately 3.0 L (≈ 13 cups) as total beverages, including drinking water. |
|
AI for Women |
|
|
51–70 years |
2.7 L/day of total water. This includes approximately 2.2 L (≈ 9 cups) as total beverages, including drinking water. |
|
> 70 years |
2.7 L/day of total water. This includes approximately 2.2 L (≈ 9 cups) as total beverages, including drinking water. |
Pregnancy
Evidence Considered in Setting the AI
Body Water. Weight increases about 12 kg during an average pregnancy, but approximately 15 percent of normal pregnant women also develop generalized swelling and additional weight gain (≈ 2.5 kg) (Chesley, 1978; Forsum et al., 1988; Hytten, 1980; Hytten and Leitch, 1971; Lindheimer and Katz, 1985). Most of this added weight is water and includes the products of conceptus and gains within the expanded maternal intra- and extracellular spaces.
Total body water has been measured during gestation with deuterium, the stable isotope of oxygen, or by bioelectric impedance (Catalano et al., 1995; Chesley, 1978; Forsum et al., 1988; Hytten, 1980; Hytten and Leitch, 1971; Lindheimer and Katz, 1985). Results vary (due partly to different methodologies, but also to the period of testing with interpolation from final measurement until term), with findings of total accumulation from 6 to 9 L, of which 1.8 to 2.5 L are intracellular fluid. The increases in maternal vascular and interstitial volumes are discussed in Chapter 6, and further discussions of the validity of methodologies utilized primarily in studies of the extracellular-extravascular compartment are discussed by Chesley (1978) and Lindheimer and Katz (1985, 2000).
Hydration Status and Plasma Osmolality. Plasma osmolality decreases by 8 to 10 mOsmol/kg during normal gestation. The decrement that normally starts during the luteal phase of the menstrual cycle continues through conception, reaching its lowest point during gestational week 10, after which the decline is sustained until term (Davison et al., 1981, 1984; Lindheimer and Davison, 1995). Since only approximately 1.5 mOsmol/kg of the decrease can be attributed to the small decrement in circulating urea, most of the decline is due to lower levels of sodium and its attendant anion. Thus gestation is characterized by a decrease in body tonicity (i.e., effective osmolality). The reason for this decline is a parallel decrease in the osmotic thresholds for arginine vasopressin release and thirst, with the pregnant woman then concentrating and diluting urine appropriately around this new steady-state body tonicity (Davison et al., 1981; Lindheimer and Davison, 1995). Since the threshold for arginine vasopressin release decreases a bit more rapidly than that for thirst, pregnant women may experience a short transient period of polyuria during early gestation (Davison et al., 1988).
When stressed by dehydration or water loading, pregnant women respond in a manner similar to that of nonpregnant women, in spite of the large increase in glomerular filtration rate that accompanies gestation, which might increase filtered solute substantially and thus compromise the extremes of concentration and dilution.
The metabolism of arginine vasopressin is markedly altered during pregnancy as metabolic clearance rate increases fourfold between early and mid-gestation (Davison et al., 1989, 1993). This is due to the appearance of high circulating levels of placental vasopressinase (a cystine aminopeptidase). Normally the production rate of arginine vasopressin is sufficient to overcome the increased disposal rate, but there are rare instances of subclinical central diabetes insipidus that become apparent by the increased metabolic clearance rate of arginine vasopressin in pregnancy (Baylis et al., 1986; Lindheimer and Davison, 1995). There are also instances of overproduction of vasopressinase resulting in a syndrome-labeled transient diabetes insipidus during pregnancy (Durr et al., 1987; Lindheimer and Davison, 1995).
Summary. While there are differences in plasma osmolality during pregnancy, the differences are not a result of poor hydration status and are short term. Therefore, an AI for total water (drinking water, beverages, and food) during pregnancy is based on the estimated median total water intake during pregnancy (Appendix Table D-1). In the NHANES, water from food provided 22 percent of the estimated total water intake, slightly more than the 19 percent of the estimated total water consumption seen in nonpregnant women (Appendix Table D-4).
Total Water AI Summary, Pregnancy
|
AI for Pregnancy |
|
|
14–18 years |
3.0 L/day of total water. This includes approximately 2.3 L (≈ 10 cups) as total beverages, including drinking water.8 |
|
19–30 years |
3.0 L/day of total water. This includes approximately 2.3 L (≈ 10 cups) as total beverages, including drinking water. |
|
31–50 years |
3.0 L/day of total water. This includes approximately 2.3 L (≈ 10 cups) as total beverages, including drinking water. |
Lactation
Evidence Considered in Setting the AI
There is no evidence to suggest that renal function and hydration status are different during lactation. Therefore, the AI for total water (drinking water, beverages, and food) is set based on median total water intakes during lactation estimated in the NHANES III (Appendix Table D-1). In this survey, water from food for this life stage group was estimated to provide 19 percent of total water intake (Appendix Table D-4).
Another approach to determining the total water needs during lactation would be to sum the nonpregnant AI (2.3, 2.7, and 2.9 L/ day for 14- through 18-, 19- through 30-, and 31- through 50-year-old females, respectively) and the water content of the average milk output during the first 6 months of lactation (0.78 L milk × 87 percent = 0.68 L water). This generates an estimated total water intake of 3.0, 3.4, and 3.6 L/day for lactating females 14 to 18, 19 to 30, and 31 to 50 years of age, respectively. These estimates closely coincide with the AI for total water based on median intake during lactation. Hence, the latter, median intake during lactation is used as the AI for all age groups.
Total Water AI Summary, Lactation
|
AI for Lactation |
|
|
14–18 years |
3.8 L/day of total water. This includes approximately 3.1 L (≈ 13 cups) as total beverages, including drinking water.9 |
|
19–30 years |
3.8 L/day of total water. This includes approximately 3.1 L (≈ 13 cups) as total beverages, including drinking water. |
|
31–50 years |
3.8 L/day of total water. This includes approximately 3.1 L (≈ 13 cups) as total beverages, including drinking water. |
Special Considerations
Active Adults
Physical activity and environmental exposure will increase water losses and therefore increase daily fluid needs. Physically active persons are often more likely to be outdoors and exposed to ambient environmental conditions (e.g., hot weather). Because dehydration will reduce physical exercise capabilities and increase heat strain (e.g., body temperature), it is important that active populations adequately replace their fluid losses (IOM, 1994; Sawka and Coyle, 1999).
As previously discussed, this increased water loss is essentially equal to sweat losses, as increased respiratory water losses are essentially offset by increased production of metabolic water. Water balance studies (Table 4-5) indicate that going from minimal activity to sedentary activity levels in temperate environments increased daily water requirements from approximately 2.5 to 3.2 L/day, respectively. Water turnover studies (Table 4-6) indicate that individuals with more strenuous levels of activity (> 60 minutes per day of activity) compared with individuals engaging in relatively sedentary activity (i.e., less than 60 minutes per day of activity) in temperate environments have increased daily total water requirements of approximately 3.0 to 4.5 L/day in men (Fusch et al., 1998; Leiper et al., 1996). Higher levels of physical activity further increase water requirements; for example, very active fire fighters had daily water requirements of about 7 L/day (Ruby et al., 2002).
Data from NHANES III (Table 4-15; Appendix H) indicate that individuals reporting leisure time activity five or more times per week had higher median daily water intakes by ≈ 0.5 L/day (e.g., 19 to 30 years: men 3.16 to 3.78 L/day, women 2.60 to 2.93 L/day). If persons perform physical activity in hot weather, then daily water requirements will be markedly increased. For active populations living in tropic or desert weather, daily sweat losses are often an additional 2 to 7 L/day (IOM, 1993, 1994; Molnar, 1947). Several analyses of water losses in hot weather (Figures 4-16, 4-17, and 4-18) support that active individuals who are continually exposed to hot weather can often have daily water requirements of 6 to 8 L/day or more.
Figure 4-20 provides approximate daily fluid requirements based on modeling for adults (assuming approximately 1.0 L for minimal needs for urine, respiratory, gastrointestinal, and insensible losses [Table 4-2]) wearing light-weight clothing while exposed to a vari-
TABLE 4-15 Summary of Estimated Median Daily Total Water Intake for Individuals Reporting Leisure Time Activity in the United States
|
Age |
Males, Total Water Intake (L/d) |
Females, Total Water Intake (L/d) |
||
|
Least Active,a Median |
Most Active,b Median |
Least Active,a Median |
Most Active,b Median |
|
|
8–16 yr |
2.11 |
2.69 |
1.78 |
2.29 |
|
17–18 yr |
2.04 |
3.35 |
1.90 |
2.74 |
|
19–30 yr |
3.16 |
3.78 |
2.60 |
2.93 |
|
31–50 yr |
3.54 |
3.77 |
2.52 |
3.16 |
|
51–70 yr |
3.22 |
3.42 |
2.81 |
3.06 |
|
71+ yr |
2.54 |
3.05 |
2.33 |
2.75 |
|
a Least active = no reported leisure time activity. b Most active = leisure time activity reported five or more times per week. SOURCE: Third National Health and Nutrition Examination Survey, 1988–1994. Appendix Tables H-1, H-2, and H-4. |
||||
ety of average daytime ambient dry bulb temperatures (i.e., with 50 percent relative humidity and a partly cloudy sky) and varying their level of physical activity from sedentary, low active, active, and very active levels. The sweating rates were predicted by an equation developed for healthy adults that includes the effects of metabolic rate, climate, and clothing (Moran et al., 1995; Sawka et al., 1996a; Shapiro et al., 1982). Considerable variability can be expected among persons due to individual differences in body size, diet, and sweat loss responses (e.g., heat acclimatization, physical fitness, air movement). In addition, most individuals will not be constantly exposed to one environmental condition. Note that the daily water requirements for temperate conditions can double or even triple in very hot weather (≈ 40°C [104°F]). Adolph’s (1933) “minimal,” “average,” and “liberal” water requirements of 2.1, 3.4, and 5.0 L/day, respectively, are fairly consistent with this figure, except for very active persons in hot weather. The daily water requirement increases with activity and ambient temperature are a result of increased sweating to meet evaporative cooling requirements.
Active Children
Sweat production in children is considerably less than in adults under similar climatic and activity conditions (Falk, 1998). This dif-
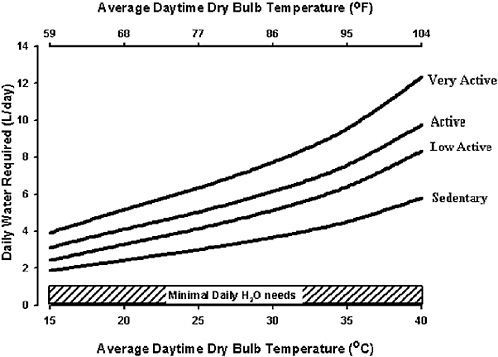
FIGURE 4-20 Approximate daily sweating rates as a function of dry-bulb temperature and level of physical activity derived from modeling available data. The hatched area indicates the ≈ 1 L minimal water requirements as described in Table 4-2. The y-axis represents the predicted water requirements that increase because of increased sweat losses to enable thermoregulation. The x-axis is the average daytime dry bulb temperature. “Very active” is equivalent to approximately 3,600 total kcal/ day of energy expenditure, “active” is equivalent to approximately 2,900 total kcal/ day of energy expenditure, “low active” is equivalent to approximately 2,400 total kcal/day of energy expenditure, and “sedentary” is equivalent to approximately 1,900 total kcal/day of energy expenditure, categories identified in estimates of energy expenditure (IOM, 2002/2005). The model used to develop this graph is further explained in Appendix C.
ference prevails even when sweating rate is corrected for skin surface area (Araki et al., 1979; Falk et al., 1992a; Wagner et al., 1972), and it becomes manifested during midpuberty. For example, while performing moderate-intensity exercise at dry climatic heat (42°C [107.6°F], 20 percent relative humidity), prepubertal boys produced ≈ 15 to 25 percent less sweat, 294 mL/m2skin/hour of sweat compared with 342 and 396 mL/m2skin/hour in mid- and late-pubertal boys, respectively (Falk et al., 1992b).
Similar to the adult considerations for those exposed to climatic heat stress, the above differences should be taken into consideration when determining water requirements of active children and adolescents. They are unimportant for sedentary or mildly active young people not exposed to climatic heat who therefore produce little or no sweat.
INTAKE OF WATER
Sources
Sources of water consumed to meet body needs include beverages, food, and drinking water. Although water is thought of as the primary fluid to sustain hydration, fluids in different types of beverages and foods contribute significantly to a person’s daily fluid needs (Heller et al., 1999; Appendix Tables D-1, D-2, D-3, and D-4). Figure 4-21 shows the sources and quantities of water consumed as
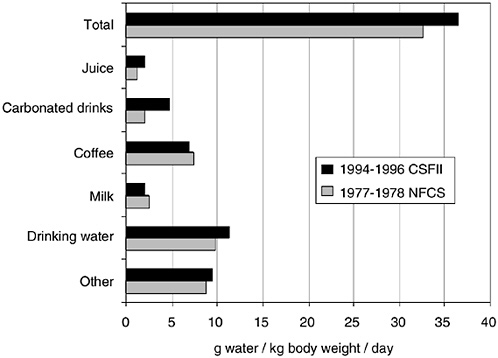
FIGURE 4-21 Sources and quantities of beverage intake for individuals aged 20 to 64 years as provided by the 1977–1978 National Food Consumption Survey (NFCS) and 1994–1996 Continuing Survey of Food Intakes by Individuals (CSFII). Reprinted with permission, from Heller et al. (1999). Copyright 1999 by the American Association of Public Health Dentistry.
TABLE 4-16 Water Content of Selected Foods
|
Food |
Water (% wt) |
Food |
Water (% wt) |
|
Apple, raw |
86 |
Ham, cooked |
70 |
|
Apricot, raw |
86 |
Lettuce, iceberg |
96 |
|
Banana, raw |
75 |
Macaroni/spaghetti, cooked |
66 |
|
Bread, white |
36 |
Milk, 2% |
89 |
|
Bread, whole-wheat |
38 |
Orange, raw |
87 |
|
Broccoli, cooked |
89 |
Peach, raw |
89 |
|
Cantaloupe, raw |
90 |
Peanuts, dry roasted |
2 |
|
Carrots, raw |
88 |
Pear, raw |
84 |
|
Cheese, cheddar |
37 |
Pickle |
92 |
|
Cheese, cottage |
79 |
Pineapple, raw |
86 |
|
Chicken, roasted |
64 |
Potato, baked |
75 |
|
Chocolate chip cookies |
4 |
Squash, cooked |
94 |
|
Corn, cooked |
70 |
Steak, tenderloin, cooked |
50 |
|
Corn flakes cereal |
3 |
Sweet potato, boiled |
80 |
|
Crackers, saltines |
4 |
Turkey, roasted |
62 |
|
Grapes, raw |
81 |
Walnuts |
4 |
|
SOURCE: USDA/ARS (2002). |
|||
fluid by individuals 20 to 64 years old as provided by the 1977–1978 Nationwide Food Consumption Survey and the 1994–1996 Continuing Survey of Food Intakes by Individuals (CSFII) (Heller et al., 1999). Table 4-16 shows the water content of various foods. Fruits and vegetables contain a high percentage of water. For adults in the United States, drinking water provided 35 to 54 percent of total water, while foods and beverages provided 19 to 25 percent and 49 to 63 percent, respectively (Appendix Tables D-1, D-2, D-3, and D-4). Together, drinking water and beverages provided 73 to 80 percent of the total water consumed as food and fluids. Analysis of other data (Ershow and Cantor, 1989) showed total water intake with approximately 28 percent coming from food, 28 percent from drinking water, and 44 percent from other beverages. Foods such as soup and ice cream were included in the food category.
Intake
Appendix D, using data from the Third National Health and Nutrition Examination Survey (NHANES III), provides the daily intake of water from (1) total sources (food and beverages), (2) drinking water, (3) drinking water and beverages, and (4) foods. Table 4-17
TABLE 4-17 Daily Estimated Total Water Intake of Infants and Young Children in the United States
|
Age |
n |
Total Water Intakea (L) |
Total Water Intake (L/kg body weight) |
||||
|
Mean |
Median |
5th Percentile |
95th Percentile |
Mean |
Median |
||
|
2–6 mo |
780 |
1.11 |
1.05 |
0.61 |
1.79 |
0.152 |
0.145 |
|
7–12 mo |
807 |
1.32 |
1.26 |
0.77 |
2.03 |
0.144 |
0.137 |
|
1–3 yr |
3,142 |
1.42 |
1.32 |
0.70 |
2.49 |
0.107 |
0.099 |
|
4–8 yr |
3,225 |
1.78 |
1.74 |
1.24 |
2.45 |
0.079 |
0.077 |
|
a Total water intake reflects the sum of plain drinking (tap) water and the water content of all foods, formula, and beverages consumed. NOTE: Data are limited to individuals who provided a valid response to the question, “How much plain drinking water do you usually drink in a 24-hour period? Include only plain tap or spring water” and provided a complete and reliable 24-hour dietary recall on Day 1. The intake distributions for infants 2–6 and 7–12 months and children 1–3 years of age are unadjusted. Means and percentiles for these groups were computed using SAS PROC UNIVARIATE. For all other groups, data were adjusted using the Iowa State University method to provide estimates of usual intake. Means and medians were obtained using C-Side. Infants and children fed human milk were excluded from the analysis. DATA SOURCE: Appendix Table D-1: U.S. Department of Health and Human Services, National Center for Health Statistics, Third National Health and Nutrition Examination Survey (NHANES III), 1988–1994. SOURCE: ENVIRON International Corporation and Iowa State University Department of Statistics (2003). |
|||||||
summarizes the medians and ranges of water intake of infants and young children of both genders. Note that with maturation, the range of total water (difference between the 5th and 95th percentiles) increases. The expanding range probably results from differences in body size, physical activity, and environmental exposure.
Table 4-18 summarizes the median values of total water intake (food and beverages) for male and female older children, adolescents, and adults in the United States (Appendix D). Daily total water intake values are lower in females than in males at all ages. For both genders, daily total fluid intakes are relatively constant from late teens to late middle age, with slightly lower values before and after. The variability of values is probably not due to altered hydration status, as serum osmolalities are similar (and indicative of euhydration) across age groups and deciles of total water intake (see earlier section, “Plasma Indicators,” and Appendix G). Women
TABLE 4-18 U.S. Estimated Daily Total Water Intake of Male and Female Older Children, Adolescents, and Adults
|
Age |
Males, Total Water Intakea (L/d) |
Females, Total Water Intake (L/d) |
||||
|
Mean |
Median |
5th to 95th Percentiles |
Mean |
Median |
5th to 95th Percentiles |
|
|
9–13 yr |
2.54 |
2.44 |
1.50–3.90 |
2.24 |
2.13 |
1.27–3.58 |
|
14–18 yr |
3.40 |
3.28 |
2.12–5.09 |
2.50 |
2.33 |
1.27–4.30 |
|
19–30 yr |
3.91 |
3.71 |
2.26–6.23 |
2.84 |
2.69 |
1.40–4.80 |
|
31–50 yr |
3.85 |
3.63 |
2.10–6.34 |
3.10 |
2.90 |
1.59–5.28 |
|
51–70 yr |
3.55 |
3.39 |
2.02–5.64 |
3.02 |
2.90 |
1.65–4.83 |
|
71+ yr |
2.99 |
2.90 |
1.77–4.56 |
2.62 |
2.54 |
1.54–3.97 |
|
a Total water intake reflects the sum of plain drinking (tap) water and the water content of all foods, formulas, and beverages consumed. DATA SOURCE: Appendix Table D-1: U.S. Department of Health and Human Services, National Center for Health Statistics, Third National Health and Nutrition Examination Survey (NHANES III), 1988–1994. SOURCE: ENVIRON International Corporation and Iowa State University Department of Statistics (2003). |
||||||
had lower (relative to men) total water intake values by approximately 0.4 L/day early and late in life and by approximately 1.0 L/ day from 14 to 30 years of age. Differences in daily total water intake are probably somewhat due to differences in body size, physical activity, and climatic exposure.
Table 4-19 summarizes the total intake for moisture (water content from foods and beverages) in the Canadian Provincial survey 1990–1999 (Appendix Table F-1). They are somewhat lower than the estimates from the NHANES for individuals in the United States. However, similar trends are seen to that seen with the U.S. data: intake of females is lower on average for all adult age groups, and water intake as estimated by moisture remains relatively constant through adulthood, declining in the oldest age group (71+ years of age).
Table 4-15 summarizes the daily total water intake from the NHANES in the United States (from all sources—food and beverages) for the least active (reported no leisure activity during the week) and most active (leisure activity reported five or more times per week) persons surveyed (Appendix H). These data do not represent the water requirements for a specific metabolic rate, but rather the total water intake on a given day (whether or not the
TABLE 4-19 Canadian Daily Total Moisture (Water from Food and Beverages) Intake for Men and Women
|
Age |
Men, Total Water Intake (L/d) |
Women, Total Moisture Intake (L/d) |
||||
|
Mean |
Median |
5th to 95th Percentiles |
Mean |
Median |
5th to 95th Percentiles |
|
|
19–30 yr |
3.04 |
2.69 |
1.74–4.40 |
2.46 |
2.23 |
1.31–3.98 |
|
31–50 yr |
2.96 |
2.71 |
1.90–4.47 |
2.55 |
2.38 |
1.50–3.67 |
|
51–70 yr |
2.71 |
2.52 |
1.57–4.10 |
2.41 |
2.24 |
1.46–3.58 |
|
71+ yr |
2.39 |
2.31 |
1.57–3.39 |
2.14 |
2.06 |
1.38–3.20 |
|
SOURCE: Appendix Table F-1; Health Canada. |
||||||
individual participated in leisure activity that day). It is reasonable to assume that these two populations differed in physical activity levels on the surveyed day; however, data are not available to document this difference. The more active groups had a greater daily total water intake by approximately 0.6 and 0.5 L for the men and women, respectively.
There are few data concerning water intake during gestation or during lactation. NHANES III surveyed 341 pregnant and 98 lactating women (Appendix D). The median daily intake of drinking and beverage water was estimated to be 2.3 L, and the intake of water from food was 0.6 L, providing a total intake of approximate 2.9 L for total water from foods, beverages, and drinking water. CSFII surveyed 124 women listed as pregnant or lactating (Appendix E). The median daily intake of drinking and beverage water was estimated to be 1.8, and the intake of water from food was 0.7, providing a total water intake of approximately 2.5 L from foods, beverages, and drinking water. CSFII data were not separated as to period of gestation nor to gestation versus lactation.
ADVERSE EFFECTS OF OVERCONSUMPTION
Water intoxication can lead to hyponatremia, which can be life threatening. This occurs occasionally in psychiatric patients (psychogenic polydipsia) and needs to be addressed quickly before serious side effects occur. Water intoxication and death from acute water toxicity have also been reported in nonpsychiatric situations in which voluntary consumption of excess amounts occurred
(Gardner and Gutmann, 2002), as well as in other social situations in which excess fluid ingestion was involved (Arieff and Kronlund, 1999). Hyponatremia can also occur from excessive fluid intake, under-replacement of sodium, or both during or after prolonged endurance athletic events. Hyponatremia is rare in healthy populations consuming the average North American diet.
Psychogenic polydipsia is the excessive consumption of fluid, especially water, among chronic psychiatric patients, but particularly those with schizophrenia (de Leon et al., 1994). This concept has been known since 1935 (Sleeper, 1935); however, it is still poorly understood. There have been a number of case studies published (Adler, 1980; Akasaki et al., 1993; Browne, 1979; de Leon et al., 1994; Gehi et al., 1981; Jos et al., 1986; Koczapski and Millson, 1989; Korzets et al., 1996; Ledochowski et al., 1986; Mor et al., 1987; Okura et al., 1990; Sidi et al., 1984; Tomiyama et al., 1990; Yonemura et al., 1987) on psychogenic polydipsia and water intoxication, leading to hyponatremia and rhabdomyolysis, an injury to skeletal muscle tissue that results in the destruction of skeletal muscle cells and allows for the escape of cellular contents into the extracellular fluid, leading to renal failure and compartment syndromes (Korzets et al., 1996). Electroencephalographic changes have been reported with water intoxication in some patients (Okura et al., 1990).
Acute water toxicity has been reported due to rapid consumption of large quantities of fluids that greatly exceeded the kidney’s maximal excretion rate of from 0.7 to 1.0 L/hour.
Hazard Identification
Hyponatremia is defined by a serum sodium level of less than 135 mmol/L, but symptoms are usually not apparent unless the serum sodium level is less than 130 mmol/L. The signs and symptoms of hyponatremia depend upon the rapidity with which the serum sodium declines, as well as on the absolute levels. The lowering of the extracellular fluid (ECF) sodium concentration causes fluid to move to the intracellular fluid (ICF) space, resulting in central nervous system edema, lung congestion, and muscle weakness.
Hyponatremia is very difficult to achieve in healthy persons consuming an average U.S. diet. As discussed previously, urine output will increase (and be dilute) in proportion to the excess fluid intake to reestablish water balance (Freund et al., 1995; Habener et al., 1964). Hyponatremia from excess fluid intake is most often observed in infants (Keating et al., 1991), and is also seen in psychiatric pa-
tients with polydipsia (de Leon et al., 1994), patients on psychotropic drugs (Siegel et al., 1998), women who have had operations using a uterine distension medium (Kim et al., 1995), individuals participating in prolonged endurance events (Montain et al., 2001; Noakes, 2002), and military recruits (O’Brien et al., 2001). Hyponatremia can sometimes lead to death (Gardner, 2002; Garigan and Ristedt, 1999). The U.S. Army has provided epidemiologic data for the incidence of hyponatremia hospitalizations for soldiers. The hyponatremia incidence rate averaged less than 1 per 100,000 soldier years, which was much less (35 to 70 times less frequent) than heat casualty hospitalizations (U.S. Army, 2003).
Increased total body water, which dilutes the ECF sodium, occurs from overconsumption of water. The misdiagnosis of hyponatremia as dehydration (as both share several symptoms) that is inappropriately treated with aggressive rehydration treatment (O’Brien et al., 2001) can worsen the hyponatremia. Likewise, a failure to excrete excess volume can exacerbate this condition. Hospitalized patients who develop hyponatremia may have impaired renal water excretion, which is often associated with an inappropriate (relative to osmotic and volume status) secretion of arginine vasopressin during the fluid overload (Gibbs et al., 2002). Nausea is a stimulus for arginine vasopressin, common in hyponatremia, and may account for some of the reported inappropriate arginine vasopressin responses. Likewise, exercise and heat stress will both reduce urine output (see earlier sections), and if excessive overconsumption occurs with prolonged stressful exercise, hyponatremia may develop. The symptomatic hyponatremia of exercise is typically associated with greater than 6 hours of prolonged stressful exercise (Montain et al., 2001).
It has been suggested that persons with certain mutations of the cystic fibrosis transmembrane regulatory (CFTR) gene may be susceptible to hyponatremia (Leoni et al., 1995). There are greater than 800 variants of the CFTR gene that have been identified; many are seen in otherwise healthy people, but they may be associated with exceptionally high sweat sodium losses (Montain et al., 2001).
The increase in total body water (TBW) required to decrease serum sodium to 125 mmol/L from an elevated level of 140 mmol/L is approximately 5.1 L for a 70-kg man, depending on the extent of the exercise and heat strain. This can be calculated as follows: a 70-kg man, who would have a TBW volume of about 42 L, and an ECF volume of approximately 14 L, would have an extracellular sodium content of approximately 1,960 mmol (14 L ECF × 140 mmol/L). To dilute his serum sodium from 140 to 125 mmol/L, the ECF
would need to increase by 1.7 L to 15.7 L ([140 ÷ 125 mmol/L] × 14 L) and, assuming that the ECF and the TBW increases are in proportion due to osmotic equilibrium, the TBW would need to increase by approximately 5.1 L ([15.7 L ÷ 14 L] × 42 L = 47.1 L) to provide this additional 1.7 L to the ECF.
However, if this person had been exercising in a hot climate and losing sodium in sweat, then less overhydration (hypoosmotic fluid consumption) is required to reduce plasma sodium to 125 mmol/ L, assuming sweat losses are replaced as well. If sweat losses total 6 L and sweat sodium concentration is 25 mmol/L (since it is less concentrated than serum), then there is a 150 mmol sodium deficit due to sodium loss (ECF sodium would be decreased to 1,810 mmol [1,960 mmol − 150 mmol]). If the 6-L water loss as sweat is replaced by sodium-free fluid, then the sodium deficit would produce a 3.6 mmol decrease to the TBW (150 mmol ÷ 42 L = 3.6 mmol/L) and effectively reduce ECF sodium to 136.4 mmol/L (140 − 3.6 = 136.4). The volume of excess fluid intake necessary to further dilute ECF sodium to 125 mmol/L would be 3.8 L ([136.4 ÷ 125 mmol/L] × 42 L), less than the 5.1 L needed to decrease hypernatremia from 140 mmol to 125 mmol/L where sweating had not occurred. Thus the total fluid intake would need to be 9.8 L (6 L [to replace that lost in sweat] + 3.8 L [needed to allow the TBW to be at equilibrium with the ECF]).
Smaller persons, such as women and children, are more susceptible to hyponatremia due to having smaller TBW and ECF volumes, therefore the same magnitude of overdrinking (as a larger person) dilutes a smaller osmotic content.
Bladder Lesions
The gross overconsumption of fluids (such as > 20 L/day) has been suggested as being associated with irreversible bladder lesions in a series of case studies (Susset, 1993). In addition, possible association of thinner bladder muscles, delayed bladder sensation, and flow rate impairment due to excessive fluid intake was suggested (Susset, 1993).
Dose-Response Assessment
While hazards associated with overconsumption can thus be identified, there are no data on habitual consumption of elevated water intakes resulting in identifiable hazards in apparently healthy people. Because of the significant ability to self-regulate excessive
consumption of water from fluids and foods by healthy people in temperate climates, a Tolerable Upper Intake Level was not set for water.
Intake Assessment
The highest (99th percentile of intake) total water intake reported was 8.1 L/day in men aged 31 to 50 years (Appendix Table D-1). Only 5 percent of men consumed in excess of 6.4 L/day of water.
Risk Characteristics
No adverse effects have been reported with chronic high intakes of water in healthy people consuming a normal diet, as long as fluid intake is approximately proportional to losses.
RESEARCH RECOMMENDATIONS
-
Development of simple non- or minimally invasive indexes of body hydration status (both hyperosmotic and isoosmotic).
-
Controlled water balance studies in different subgroups of the population (i.e., children, elderly, and those with chronic illnesses) in different climatic conditions.
-
Development of capabilities to predict hourly and daily water requirements based on metabolic rate, climatic conditions, and clothing for different subgroups of the population.
-
Studies in water consumption and retention patterns due to meal schedule and diet.
-
Validation of estimates of total water intake, both from food and fluids, in large-scale surveys.
-
Additional studies on the effects of water deficits on cognitive performance.
-
The effects of water deficits on the risk of accidents, particularly when combined with heat or other environmental stresses (e.g., hypoxia).
-
Better understanding of the relationship between body water deficits and heat stroke or cardiac arrest associated with intense physical activity.
-
The influence of hydration status on morbidity-associated fever and infection outcome.
-
The effects of hydration status and fluid intake on the occurrence of urinary tract infections.
-
The effects of hydration status and fluid intake on chronic diseases, such as kidney stones and cholelithiasis, as well as the occurrence of specific cancers, including colon cancer and bladder cancer.
-
The effects of chronic overhydration, in the presence of adequate sodium intake, on health and cognitive ability.
-
The mechanistic effects by which dehydration can contribute to exertional heat injury and stroke.
REFERENCES
Adler S. 1980. Hyponatremia and rhabdomyolysis: A possible relationship. South Med J 73:511–513.
Adolph EF. 1933. The metabolism and distribution of water in body and tissues. Physiol Rev 13:336–371.
Adolph EF. 1943. Physiological Regulations. Lancaster, PA: The Jaques Cattell Press.
Adolph EF. 1947a. Signs and symptoms of desert dehydration. In: Adolph EF, ed. Physiology of Man in the Desert. New York: Intersciences Publishers. Pp. 226–240.
Adolph EF. 1947b. Urinary excretion of water and solutes. In: Adolph EF, ed. Physiology of Man in the Desert. New York: Intersciences Publishers. Pp. 96–109.
Adolph EF, Wills JH. 1947. Thirst. In: Adolph EF, ed. Physiology of Man in the Desert. New York: Intersciences Publishers. Pp. 241–253.
Agren J, Stromberg B, Sedin G. 1997. Evaporation rate and skin blood flow in full term infants nursed in a warm environment before and after feeding cold water. Acta Paediatr 86:1085–1089.
Ahlman K, Karvonen MJ. 1961. Weight reduction by sweating in wrestlers, and its effect on physical fitness. J Sports Med Phys Fitness 1:58–62.
Akasaki Y, Nagatomo I, Akasaki Y, Nomaguchi M, Akasaki Y, Matsumoto K. 1993. Water intoxication in a schizophrenic patient with rhabdomyolysis. Jpn J Psychiatry Neurol 47:843–846.
Almroth S, Bidinger PD. 1990. No need for water supplementation for exclusively breast-fed infants under hot and arid conditions. Trans R Soc Trop Med Hyg 84:602–604.
Altman PL. 1961. Blood and Other Body Fluids. Washington, DC: Federation of American Societies for Experimental Biology.
Anand IS, Chandrashekhar Y. 1996. Fluid metabolism at high altitudes. In: Marriott BM, Carlson SJ, eds. Nutritional Needs in Cold and in High-Altitude Environments. Washington, DC: National Academy Press. Pp. 331–356.
Andreoli TE, Reeves WB, Bichet DG. 2000. Endocrine control of water balance. In: Fray JCS, Goodman HM, eds. Handbook of Physiology, Section 7, Volume III: Endocrine Regulation of Water and Electrolyte Balance. New York: Oxford University Press. Pp. 530–569.
Araki T, Toda Y, Matsushita K, Tsujino A. 1979. Age differences in sweating during muscular exercise. Jpn J Phys Fitness Sports Med 28:239–248.
Arieff AI, Kronlund BA. 1999. Fatal child abuse by forced water intoxication. Pediatrics 103:1292–1295.
Armstrong LE, Hubbard RW, Szlyk PC, Matthew WT, Sils IV. 1985. Voluntary dehydration and electrolyte losses during prolonged exercise in the heat. Aviat Space Environ Med 56:765–770.
Armstrong LE, Hubbard RW, Jones BH, Daniels JT. 1986. Preparing Alberto Salazar for the heat of the 1984 Olympic marathon. Phys Sports Med 14:73–81.
Armstrong LE, Maresh CM, Castellani JW, Bergeron MF, Kenefick RW, LaGasse KE, Riebe D. 1994. Urinary indicies of hydration status. Int J Sport Nutr 4:265–279.
Armstrong LE, Maresh CM, Gabaree CV, Hoffman JR, Kavouras SA, Kenefick RW, Castellani JW, Ahlquist LE. 1997. Thermal and circulatory responses during exercise: Effects of hypohydration, dehydration, and water intake. J Appl Physiol 82:2028–2035.
Aufderheide S, Lax D, Goldberg SJ. 1994. Gender differences in dehydration-induced mitral valve prolapse. Am Heart J 129:83–86.
Bachle L, Eckerson J, Albertson L, Ebersole K, Goodwin J, Petzel D. 2001. The effect of fluid replacement on endurance performance. J Strength Cond Res 15:217–224.
Baird IM, Walters RL, Davies PS, Hill MJ, Drasar BS, Southgate DAT. 1977. The effects of two dietary fiber supplements on gastrointestinal transit, stool weight and frequency, and bacterial flora, and fecal bile acids in normal subjects. Metabolism 26:117–128.
Ballauff A, Kersting M, Manz F. 1988. Do children have an adequate fluid intake? Water balance studies carried out at home. Ann Nutr Metab 32:332–339.
Bar-Or O, Dotan R, Inbar O, Rotshtein A, Zonder H. 1980. Voluntary hypohydration in 10 to 12 year old boys. J Appl Physiol 48:104–108.
Bar-Or O, Blimkie CJR, Hay JA, MacDougall JD, Ward DS, Wilson WM. 1992. Voluntary dehydration and heat intolerance in cystic fibrosis. Lancet 339:696–699.
Barr SI, Costill DL, Fink WJ. 1991. Fluid replacement during prolonged exercise: Effects of water, saline, or no fluid. Med Sci Sports Exerc 23:811–817.
Bartok C, Schoeller DA, Randall-Clark R, Sullivan JC, Landry GL. 2004. The effect of dehydration on wrestling minimum weight assessment. Med Sci Sports Exerc 36:160–167.
Bass DE, Henschel A. 1956. Responses of body fluid compartments to heat and cold. Physiol Rev 36:128–144.
Baumgartner RN, Stauber PM, McHugh D, Koehler KM, Garry PJ. 1995. Cross-sectional age differences in body composition in persons 60+ years of age. J Gerontol 50A:M307–M316.
Baylis PH, Thompson C, Burd J, Tunbridge WMG, Snodgrass CA. 1986. Recurrent pregnancy-induced polyuria and thirst due to hypothalamic diabetes insipidus: An investigation into possible mechanisms responsible for polyuria. Clin Endocrinol 24:459–466.
Below PR, Mora-Rodriguez R, Gonzalez-Alonso J, Coyle EF. 1995. Fluid and carbohydrate ingestion independently improve performance during 1 h of intense exercise. Med Sci Sports Exerc 27:200–210.
Bijlani RL, Sharma KN. 1980. Effect of dehydration and a few regimes of rehydration on human performance. Indian J Physiol Pharmacol 24:255–266.
Bitterman WA, Farhadian H, Abu Samra C, Lerner D, Amoun H, Krapf D, Makov UE. 1991. Environmental and nutritional factors significantly associated with cancer of the urinary tract among different ethnic groups. Urol Clin North Amer 18:501–508.
Blanc S, Normand S, Ritz P, Pachiaudi C, Vico L, Gharib C, Gauquelin-Koch G. 1998. Energy and water metabolism, body composition, and hormonal changes induced by 42 days of enforced inactivity and simulated weightlessness. J Clin Endocrinol Metab 83:4289–4297.
Blatteis CM. 1998. Fever. In: Blatteis CM, ed. Physiology and Pathophysiology of Temperature Regulation. River Edge, NJ: World Scientific. Pp. 178–191.
Blyth CS, Burt JJ. 1961. Effect of water balance on ability to perform in high ambient temperatures. Res Q 32:301–307.
Borghi L, Meschi T, Amato F, Briganti A, Novarini A, Giannini A. 1996. Urinary volume, water and recurrences in idiopathic calcium nephrolithiasis: A 5-year randomized prospective study. J Urol 155:839–843.
Bosco JS, Terjung RL, Greenleaf JE. 1968. Effects of progressive hypohydration on maximal isometric muscle strength. J Sports Med Phys Fitness 8:81–86.
Bosco JS, Greenleaf JE, Bernauer EM, Card DH. 1974. Effects of acute dehydration and starvation on muscular strength and endurance. Acta Physiol Pol 25:411–421.
Bouchama A, Knochel JP. 2002. Heat stroke. N Engl J Med 346:1978–1988.
Boulze D, Montastruc P, Cabanac M. 1983. Water intake, pleasure and water temperature in humans. Physiol Behav 30:97–102.
Braver DJ, Modan M, Chetrit A, Lusky A, Braf Z. 1987. Drinking, micturition habits, and urine concentration as potential risk factors in urinary bladder cancer. J Natl Cancer Inst 78:437–440.
Brown AH. 1947a. Dehydration exhaustion. In: Adolph EF, ed. Physiology of Man in the Desert. New York: Intersciences Publishers. Pp. 208–225.
Brown AH. 1947b. Water requirements of man in the desert. In: Adolph EF, ed. Physiology of Man in the Desert. New York: Intersciences Publishers. Pp. 115–135.
Brown AH. 1947c. Water shortage in the desert. In: Adolph EF, ed. Physiology of Man in the Desert. New York: Intersciences Publishers. Pp. 136–159.
Browne PM. 1979. Rhabdomyolysis and myoglobinuria associated with acute water intoxication. West J Med 130:459–461.
Bruemmer B, White E, Vaughan TL, Cheney CL. 1997. Fluid intake and the incidence of bladder cancer among middle-aged men and women in a three-county area of western Washington. Nutr Cancer 29:163–168.
Burge CM, Carey MF, Payne WR. 1993. Rowing performance, fluid balance, and metabolic function following dehydration and rehydration. Med Sci Sports Exerc 25:1358–1364.
Buskirk ER, Iampietro PF, Bass DE. 1958. Work performance after dehydration: Effects of physical conditioning and heat acclimatization. J Appl Physiol 12:189–194.
Butte NF, Wong WW, Patterson BW, Garza C, Klein PD. 1988. Human-milk intake measured by administration of deuterium oxide to the mother: A comparison with the test-weighing technique. Am J Clin Nutr 47:815–821.
Butte NF, Wong WW, Klein PD, Garza C. 1991. Measurement of milk intake: Tracer-to-infant deuterium dilution method. Br J Nutr 65:3–14.
Caldwell JE, Ahonen E, Nousiainen U. 1984. Differential effects of sauna-, diuretic-, and exercise-induced hypohydration. J Appl Physiol 57:1018–1023.
Candas V, Libert J-P, Brandenberger G, Sagot J-C, Kahn J-M. 1988. Thermal and circulatory responses during prolonged exercise at different levels of hydration. J Physiol (Paris) 83:11–18.
Casa DJ, Armstrong LE, Hillman SK, Montain SJ, Reiff RV, Rich BSE, Roberts WO, Stone JA. 2000. National Athletic Trainers’ Association position statement: Fluid replacement for athletes. J Athl Train 35:212–224.
Catalano PM, Wong WW, Drago MN, Amini SB. 1995. Estimating body composition in late gestation: A new hydration constant for body density and total body water. Am J Physiol 268:E153–E158.
Charkoudian N, Halliwill JR, Morgan BJ, Eisenach JE, Joyner MJ. 2003. Influences
of hydration on post-exercise cardiovascular control in humans. J Physiol 552: 635–644.
Chesley LC. 1978. Hypertensive Disorders in Pregnancy. New York: Appleton-Century-Crofts.
Cheung SS, McLellan TM. 1998. Influence of hydration status and fluid replacement on heat tolerance while wearing NBC protective clothing. Eur J Appl Physiol 77:139–148.
Cheuvront SN, Haymes EM. 2001. Thermoregulation and marathon running: Biological and environmental influences. Sports Med 31:743–762.
Cheuvront SN, Haymes EM, Sawka MN. 2002. Comparison of sweat loss estimates for women during prolonged high-intensity running. Med Sci Sports Exerc 34: 1344–1350.
Cheuvront SN, Carter R III, Sawka MN. 2003. Fluid balance and endurance exercise performance. Curr Sports Med Rep 2:202–208.
Cian C, Koulmann N, Barraud PA, Raphel C, Jimenez C, Melin B. 2000. Influence of variations in body hydration on cognitive function: Effect of hyperhydration, heat stress, and exercise-induced dehydration. J Psychophysiol 14:29–36.
Cian C, Barraud PA, Melin B, Raphel C. 2001. Effects of fluid ingestion on cognitive function after heat stress or exercise-induced dehydration. Int J Psychophysiol 42:243–251.
Clark BA, Elahi D, Fish L, McAloon-Dyke M, Davis K, Minaker KL, Epstein FH. 1991. Atrial natriuretic peptide suppresses osmostimulated vasopressin release in young and elderly humans. Am J Physiol 261:E252–E256.
Cohen RJ, Brown KH, Rivera LL, Dewey KG. 2000. Exclusively breastfed, low birthweight term infants do not need supplemental water. Acta Paediatr 89:550–552.
Commonwealth of Massachusetts. 1988. The Report of the Investigation of Attorney General James M. Shannon of the Class 12 Experience at the Edward W. Connelly Criminal Justice Training Center, Agawam, Massachusetts. Boston: Department of the Attorney General.
Consolazio CF, Johnson RE, Pecora LJ. 1963. Physiological Measurements of Metabolic Functions in Man. New York: McGraw-Hill.
Consolazio CF, Matoush LO, Johnson HL, Nelson RA, Krzywicki HJ. 1967. Metabolic aspects of acute starvation in normal humans (10 days). Am J Clin Nutr 20:672–683.
Consolazio CF, Matoush LO, Johnson HL, Daws TA. 1968. Protein and water balances of young adults during prolonged exposure to high altitude (4,300 meters). Amer J Clin Nutr 21:154–161.
Convertino VA. 1991. Blood volume: Its adaptation to endurance training. Med Sci Sports Exerc 23:1338–1348.
Costi D, Calcaterra PG, Iori N, Vourna S, Nappi G, Passeri M. 1999. Importance of bioavailable calcium drinking water for the maintenance of bone mass in postmenopausal women. J Endocrinol Invest 22:852–856.
Costill DL. 1977. Sweating: Its composition and effects on body fluids. Ann NY Acad Sci 301:160–174.
Costill DL, Fink WJ. 1974. Plasma volume changes following exercise and thermal dehydration. J Appl Physiol 37:521–525.
Costill DL, Saltin B. 1974. Factors limiting gastric emptying during rest and exercise. J Appl Physiol 37:679–683.
Costill DL, Kammer WF, Fisher A. 1970. Fluid ingestion during distance running. Arch Environ Health 21:520–525.
Coyle EF. 1998. Cardiovascular drift during prolonged exercise and the effects of dehydration. Int J Sports Med 19:S121–S124.
Craig FN, Cummings EG. 1966. Dehydration and muscular work. J Appl Physiol 21:670–674.
Crowe MJ, Forsling ML, Rolls BJ, Phillips PA, Ledingham JGG, Smith RF. 1987. Altered water excretion in healthy elderly men. Age Ageing 16:285–293.
Cummings JH, Hill MJ, Jenkins DJA, Pearson JR, Wiggins HS. 1976. Changes in fecal composition and colonic function due to cereal fiber. Am J Clin Nutr 29:1468–1473.
Curhan GC, Willett WC, Rimm EB, Stampfer MJ. 1993. A prospective study of dietary calcium and other nutrients and the risk of symptomatic kidney stones. N Engl J Med 328:833–838.
Curhan GC, Willett WC, Rimm EB, Spiegelman D, Stampfer MJ. 1996. Prospective study of beverage use and the risk of kidney stones. Am J Epidemiol 143:240–247.
Curhan GC, Willett WC, Speizer FE, Spiegelman D, Stampfer MJ. 1997. Comparison of dietary calcium with supplemental calcium and other nutrients as factors affecting the risk for kidney stones in women. Ann Intern Med 126:497–504.
Curhan GC, Willett WC, Speizer FE, Stampfer MJ. 1998. Beverage use and risk for kidney stones in women. Ann Intern Med 128:534–540.
Davison JM, Vallotton MB, Lindheimer MD. 1981. Plasma osmolality and urinary concentration and dilution during and after pregnancy: Evidence that lateral recumbency inhibits maximal urinary concentrating ability. Br J Obstet Gynaecol 88:472–479.
Davison JM, Gilmore EA, Durr JA, Robertson GL, Lindheimer MD. 1984. Altered osmotic thresholds for vasopressin secretion and thirst in human pregnancy. Am J Physiol 246:F105–F109.
Davison JM, Sheills EA, Philips PR, Lindheimer MD. 1988. Serial evaluation of vasopressin release and thirst in human pregnancy. Role of human chorionic gonadotrophin on the osmoregulatory changes of gestation. J Clin Invest 81:798–806.
Davison JM, Sheills EA, Barron WM, Robinson AG, Lindheimer MD. 1989. Changes in the metabolic clearance of vasopressin and in plasma vasopressinase throughout human pregnancy. J Clin Invest 83:1313–1318.
Davison JM, Sheills EA, Philips PR, Barron WM, Lindheimer MD. 1993. Metabolic clearance of vasopressin and an analogue resistant to vasopressinase in human pregnancy. Am J Physiol 264:F348–F353.
de Leon J, Verghese C, Tracy JI, Josiassen RC, Simpson GM. 1994. Polydipsia and water intoxication in psychiatric patients: A review of the epidemiological literature. Biol Psychiatry 35:408–419.
Dontas AS, Marketos S, Papanayiotou P. 1972. Mechanisms of renal tubular defects in old age. Postgrad Med J 48:295–303.
Dorfman LJ, Jarvik ME. 1970. Comparative stimulant and diuretic actions of caffeine and theobromine in man. Clin Pharmacol Ther 11:869–872.
Durkot MJ, Martinez O, Brooks-McQuade D, Francesconi R. 1986. Simultaneous determination of fluid shifts during thermal stress in a small-animal model. J Appl Physiol 61:1031–1034.
Durr JA, Hoggard JG, Hunt JM, Schrier RW. 1987. Diabetes insipidus in pregnancy associated with abnormally high circulating vasopressinase activity. N Engl J Med 316:1070–1074.
Eckford SD, Keane DP, Lamond KE, Jackson SR, Abrams P. 1995. Hydration moni-
toring in the prevention of recurrent idiopathic urinary tract infections in premenopausal women. Br J Urol 76:90–93.
Eddy NB, Downs AW. 1928. Tolerance and cross-tolerance in the human subject to the diuretic effect of caffeine, theobromine and theophylline. J Pharmacol Exp Ther 33:167–174.
Eichna JW, Bean WB, Ashe WF. 1945. Performance in relation to environmental temperature. Bull Johns Hokins Hosp 76:25–58.
Ekblom B, Greenleaf CJ, Greenleaf JE, Hermansen L. 1970. Temperature regulation during exercise dehydration in man. Acta Physiol Scand 79:475–483.
Embon OM, Rose GA, Rosenbaum T. 1990. Chronic dehydration stone disease. Br J Urol 66:357–362.
Engell D. 1995. Effects of beverage consumption and hydration status on caloric intake. In: Institute of Medicine. Not Eating Enough. Washington, DC: National Academy Press. Pp. 217–237.
Engell DB, Maller O, Sawka MN, Francesconi RN, Drolet L, Young AJ. 1987. Thirst and fluid intake following graded hypohydration levels in humans. Physiol Behav 40:229–236.
Epstein M. 1985. Aging and the kidney: Clinical implications. Am Fam Physician 31:123–137.
Epstein Y, Keren G, Moisseiev J, Gasko O, Yachin S. 1980. Psychomotor deterioration during exposure to heat. Aviat Space Environ Med 51:607–610.
Ershow AG, Cantor KP. 1989. Total Water and Tapwater Intake in the United States: Population-Based Estimates of Quantities and Sources. Bethesda, MD: Life Sciences Research Office.
Falk B. 1998. Effects of thermal stress during rest and exercise in the paediatric population. Sports Med 25:221–240.
Falk B, Bar-Or O, Calvert R, MacDougall JD. 1992a. Sweat gland response to exercise in the heat among pre-, mid-, and late-pubertal boys. Med Sci Sports Exerc 24:313–319.
Falk B, Bar-Or O, MacDougall JD. 1992b. Thermoregulatory responses of pre-, mid-, and late-pubertal boys to exercise in dry heat. Med Sci Sports Exerc 24:688–694.
Fallowfield JL, Williams C, Booth J, Choo BH, Growns S. 1996. Effect of water ingestion on endurance capacity during prolonged running. J Sports Sci 14:497–502.
Fish LC, Minaker KL, Rowe JW. 1985. Altered thirst threshold during hypertonic stress in aging men. Gerontologist 25:A118–A119.
Fitzsimons JT. 1976. The physiological basis of thirst. Kidney Int 10:3–11.
Floch MH, Fuchs H-M. 1978. Modification of stool content by increased bran intake. Am J Clin Nutr 31:S185–S189.
Fomon SJ. 1967. Body composition of the male reference infant during the first year of life. Pediatrics 40:863–870.
Forsum E, Sadurskis A, Wager J. 1988. Resting metabolic rate and body composition of healthy Swedish women during pregnancy. Am J Clin Nutr 47:942–947.
Fortney SM, Nadel ER, Wenger CB, Bove JR. 1981. Effect of blood volume on sweating rate and body fluids in exercising humans. J Appl Physiol 51:1594–1600.
Fortney SM, Wenger CB, Bove JR, Nadel ER. 1984. Effect of hyperosmolality on control of blood flow and sweating. J Appl Physiol 57:1688–1695.
Francesconi RP, Hubbard RW, Szlyk PC, Schnakenberg D, Carlson D, Leva N, Sils I, Hubbard L, Pease V, Young J, Moore D. 1987. Urinary and hematologic indexes of hypohydration. J Appl Physiol 62:1271–1276.
Freund BJ, Young AJ. 1996. Environmental influences on body fluid balance during exercise: Cold exposure. In: Buskirk ER, Puhl SM, eds. Body Fluid Balance: Exercise and Sport. Boca Raton, FL: CRC Press. Pp. 159–181.
Freund BJ, Montain SJ, Young AJ, Sawka MN, DeLuca JP, Pandolf KB, Valeri CR. 1995. Glycerol hyperhydration: Hormonal, renal, and vascular fluid responses. J Appl Physiol 79:2069–2077.
Fritzsche RG, Switzer TW, Hodgkinson BJ, Lee SH, Martian JC, Coyle EF. 2000. Water and carbohydrate ingestion during prolonged exercise increase maximal neuromuscular power. J Appl Physiol 88:730–737.
Fusch C, Hungerland E, Scharrer B, Moeller H. 1993. Water turnover of healthy children measured by deuterated water elimination. Eur J Pediatr 152:110–114.
Fusch C, Gfrorer W, Koch C, Thomas A, Grunert A, Moeller H. 1996. Water turnover and body composition during long-term exposure to high altitude (4,900–7,600 m). J Appl Physiol 80:1118–1125.
Fusch C, Gfrorer W, Dickhuth H-H, Moeller H. 1998. Physical fitness influences water turnover and body water changes during trekking. Med Sci Sports Exerc 30:704–708.
Gamble JL. 1947. Physiological information gained from studies on the life raft ration. In: The Harvey Society of New York, eds. The Harvey Lectures. Lancaster, PA: The Sciences Press Printing Co. Pp. 247–273.
Gardner JW. 2002. Death by water intoxication. Mil Med 167:432–434.
Gardner JW, Gutmann FD. 2002. Fatal water intoxication of an Army trainee during urine drug test. Mil Med 167:435–437.
Garigan TP, Ristedt DE. 1999. Death from hyponatremia as a result of acute water intoxication in an Army basic trainee. Mil Med 164:234–237.
Gehi MM, Rosenthal RH, Fizette NB, Crowe LR, Webb WL. 1981. Psychiatric manifestations of hyponatremia. Psychosomatics 22:739–743.
Geoffroy-Perez B, Cordier S. 2001. Fluid consumption and the risk of bladder cancer: Results of a multicenter case-control study. Int J Cancer 93:880–887.
Gibbs MA, Wolfson AB, Tayal VS. 2002. Electrolyte disturbances. In: Marx JA, Hockberger RS, Walls RM, Adams J, Barkin RM, Barsan WG, Danzl DF, Gausche-Hill M, Hamilton GC, Ling LJ, Newton E, eds. Rosen’s Emergency Medicine: Concepts and Clinical Practice, 5th ed. St. Louis, MO: Mosby. Pp. 1724–1744.
Gisolfi CV, Copping JR. 1974. Thermal effects of prolonged treadmill exercise in the heat. Med Sci Sports 6:108–113.
Gisolfi CV, Ryan AJ. 1996. Gastrointestinal physiology during exercise. In: Buskirk ER, Puhl SM, eds. Body Fluid Balance: Exercise and Sport. Boca Raton, FL: CRC Press. Pp. 19–51.
Goellner MH, Ziegler EE, Formon SJ. 1981. Urination during the first three years of life. Nephron 28:174–178.
Gonzalez-Alonso J, Mora-Rodriguez R, Below PR, Coyle EF. 1997. Dehydration markedly impairs cardiovascular function in hyperthermic endurance athletes during exercise. J Appl Physiol 82:1229–1236.
Gopinathan PM, Pichan G, Sharma VM. 1988. Role of dehydration in heat stress-induced variations in mental performance. Arch Environ Health 43:15–17.
Goran MI, Poehlman ET, Danforth E, Sreekumaran Nair K. 1994. Comparison of body fat estimates derived from underwater weight and total body water. Int J Obes Relat Metab Disord 18:622–626.
Gosselin RE. 1947. Rates of sweating in the desert. In: Adolph EF, ed. Physiology of Man in the Desert. New York: Intersciences Publishers. Pp. 44–76.
Grandjean AC, Reimers KJ, Bannick KE, Haven MC. 2000. The effect of caffeinated,
non-caffeinated, caloric and non-caloric beverages on hydration. J Am Coll Nutr 19:591–600.
Greenleaf JE. 1992. Problem: Thirst, drinking behavior, and involuntary dehydration. Med Sci Sports Exerc 24:645–656.
Greenleaf JE, Castle BL. 1971. Exercise temperature regulation in man during hypohydration and hyperhydration. J Appl Physiol 30:847–853.
Greenleaf JE, Morimoto T. 1996. Mechanisms controlling fluid ingestion: Thirst and drinking. In: Buskirk ER, Puhl SM, eds. Body Fluid Balance: Exercise and Sport. Boca Raton, FL: CRC Press. Pp. 3–17.
Greenleaf JE, Matter M Jr, Bosco JS, Douglas LG, Averkin EG. 1966. Effects of hypohydration on work performance and tolerance to +GZ acceleration in man. Aerospace Med 37:34–39.
Greenleaf JE, Bernauer EM, Juhos LT, Young HL, Morse JT, Staley RW. 1977. Effects of exercise on fluid exchange and body composition in man during 14-day bed rest. J Appl Physiol 43:126–132.
Greiwe JS, Staffey KS, Melrose DR, Narve MD, Knowlton RG. 1998. Effects of dehydration on isometric muscular strength and endurance. Med Sci Sports Exerc 30:284–288.
Grucza R, Szczypaczewska M, Kozlowski S. 1987. Thermoregulation in hyperhydrated men during physical exercise. Eur J Appl Physiol 56:603–607.
Gudivaka R, Schoeller DA, Kushner RF, Bolt MJG. 1999. Single- and multifrequency models for bioelectrical impedance analysis of body water compartments. J Appl Physiol 87:1087–1096.
Gunga HC, Maillet A, Kirsch K, Rocker L, Gharib C, Vaernes R. 1993. Water and salt turnover. Adv Space Biol Med 3:185–200.
Guyton AC, Hall JE. 2000. Textbook of Medical Physiology, 10th ed. Philadelphia: WB Saunders.
Habener JF, Dashe AM, Solomon DH. 1964. Response of normal subjects to prolonged high fluid intake. J Appl Physiol 19:134–136.
Hackney AC, Coyne JT, Pozos R, Feith S, Seale J. 1995. Validity of urine-blood hydrational measures to assess total body water changes during mountaineering in the Sub-Arctic. Arct Med Res 54:69–77.
Hamada K, Doi T, Sakura M, Matsumoto K, Yanagisawa K, Suzuki T, Kikuchi N, Okuda J, Miyazaki H, Okoshi H, Zeniya M, Asukata I. 2002. Effects of hydration on fluid balance and lower-extremity blood viscosity during long airplane flights. J Am Med Assoc 287:844–845.
Hancock PA. 1981. Heat stress impairment of mental performance: A revision of tolerance limits. Aviat Space Environ Med 52:177–180.
Harrison MH, Hill LC, Spaul WA, Greenleaf JE. 1986. Effect of hydration on some orthostatic and hematological responses to head-up tilt. Eur J Appl Physiol 55:187–194.
Haughey BP. 1990. Ingestion of cold fluids: Related to onset of arrhythmias? Crit Care Nurse 10:98–110.
Haussinger D, Lang F, Gerok W. 1994. Regulation of cell function by the cellular hydration state. Am J Physiol 267:E343–E355.
He FJ, Markandu ND, Sagnella GA, MacGregor GA. 2001. Effect of salt intake on renal excretion of water in humans. Hypertension 38:317–320.
Helderman JH, Vestal RE, Rowe JW, Tobin JD, Andres R, Robertson GL. 1978. The response of arginine vasopressin to intravenous ethanol and hypertonic saline in man: The impact of aging. J Gerontol 33:39–47.
Heller KE, Sohn W, Burt BA, Eklund SA. 1999. Water consumption in the United
States in 1994–96 and implications for water fluoridation policy. J Public Health Dent 59:3–11.
Heller KE, Sohn W, Burt BA, Feigal RJ. 2000. Water consumption and nursing characteristics of infants by race and ethnicity. J Public Health Dent 60:140–146.
Herbert WG, Ribisl PM. 1972. Effects of dehydration upon physical working capacity of wrestlers under competitive conditions. Res Q 43:416–422.
Hirvonen T, Pietinen P, Virtanen M, Albanes D, Virtamo J. 1999. Nutrient intake and use of beverages and the risk of kidney stones among male smokers. Am J Epidemiol 150:187–194.
Hooton TM. 1995. A simplified approach to urinary tract infection. Hosp Pract 30:23–30.
Horber FF, Thomi F, Casez JP, Fonteille J, Jaeger P. 1992. Impact of hydration status on body composition as measured by dual energy X-ray absorptiometry in normal volunteers and patients on haemodialysis. Br J Radiol 65:895–900.
Hosking DH, Erickson SB, Van Den Berg CJ, Wilson DM, Smith LH. 1983. The stone clinic effect in patients with idiopathic calcium urolithiasis. J Urol 130: 1115–1118.
Houston ME, Marrin DA, Green HJ, Thomson JA. 1981. The effect of rapid weight loss on physiological functions in wrestlers. Phys Sportsmed 9:73–78.
Hoyt RW, Honig A. 1996. Environmental influences on body fluid balance during exercise: Altitude. In: Buskirk ER, Puhl SM, eds. Body Fluid Balance: Exercise and Sport. Boca Raton, FL: CRC Press. Pp. 183–196.
Hubbard RW, Sandick BL, Matthew WT, Francesconi RP, Sampson JB, Durkot MJ, Maller O, Engell DB. 1984. Voluntary dehydration and alliesthesia for water. J Appl Physiol 57:868–873.
Hytten FE. 1980. Weight gain in pregnancy. In: Hytten FE, Chamberlain G, eds. Clinical Physiology in Obstetrics. Oxford: Blackwell Scientific. Pp. 193–230.
Hytten FE, Leitch I. 1971. The Physiology of Human Pregnancy. Oxford: Blackwell Scientific.
IOM (Institute of Medicine). 1993. Nutritional Needs in Hot Environments: Applications for Military Personnel in Field Operations. Washington, DC: National Academy Press.
IOM. 1994. Fluid Replacement and Heat Stress. Washington, DC: National Academy Press.
IOM. 2001a. Caffeine for the Sustainment of Mental Task Performance. Washington, DC: National Academy Press.
IOM. 2001b. Dietary Reference Intakes: Applications in Dietary Assessment. Washington, DC: National Academy Press.
IOM. 2002/2005. Dietary Reference Intakes for Energy, Carbohydrate, Fiber, Fat, Fatty Acids, Cholesterol, Protein, and Amino Acids. Washington, DC: The National Academies Press.
Jacobs I. 1980. The effects of thermal dehydration on performance of the Wingate Anaerobic Test. Int J Sports Med 1:21–24.
Johnson RE. 1964. Water and osmotic economy on survival rations. J Am Diet Assoc 45:124–129.
Jos CJ, Evenson RC, Mallya AR. 1986. Self-induced water intoxication: A comparison of 34 cases with matched controls. J Clin Psychiatry 47:368–370.
Keating JP, Schears GJ, Dodge PR. 1991. Oral water intoxication in infants. An American epidemic. Am J Dis Child 145:985–990.
Keith NM. 1924. Experimental dehydration: Changes in blood composition and body temperature. Am J Physiol 68:80–96.
Kenney WL, Tankersley CG, Newswanger DL, Hyde DE, Puhl SM, Turner NL. 1990. Age and hypohydration independently influence the peripheral vascular response to heat stress. J Appl Physiol 68:1902–1908.
Kim AH, Keltz MD, Arici A, Rosenberg M, Olive DL. 1995. Dilutional hyponatremia during hysteroscopic myomectomy with sorbitol-mannitol distention medium. J Am Assoc Gynecol Laparosc 2:237–242.
Kimura T, Minai K, Matsui K, Mouri T, Sato T, Yoshinaga K, Hoshi T. 1976. Effect of various states of hydration on plasma ADH and renin in man. J Clin Endocrinol Metab 42:79–87.
Knepper MA, Valtin H, Sands JM. 2000. Renal actions of vasopressin. In: Fray JCS, Goodman HM, eds. Handbook of Physiology, Section 7, Volume III: Endocrine Regulation of Water and Electrolyte Balance. New York: Oxford University Press. Pp. 496–529.
Koczapski AB, Millson RC. 1989. Individual differences in serum sodium levels in schizophrenic men with self-induced water intoxication. Am J Psychiatry 146: 1614–1615.
Korzets A, Ori Y, Floro S, Ish-Tov E, Chagnac A, Weinstein T, Zevin D, Gruzman C. 1996. Case report: Severe hyponatremia after water intoxication: A potential cause of rhabdomyolsis. Am J Med Sci 312:92–94.
Kriemler S, Wilk B, Schurer W, Wilson WM, Bar-Or O. 1999. Preventing dehydration in children with cystic fibrosis who exercise in the heat. Med Sci Sports Exerc 31:774–779.
Kristal-Boneh E, Glusman JG, Chaemovitz C, Cassuto Y. 1988. Improved thermoregulation caused by forced water intake in human desert dwellers. Eur J Appl Physiol 57:220–224.
Kuno Y. 1956. Human Perspiration. Springfield, IL: Charles C. Thomas Publisher.
Kushner RF, Schoeller DA. 1986. Estimation of total body water by bioelectrical impedance analysis. Am J Clin Nutr 44:417–424.
Kushner RF, Schoeller DA, Fjeld CR, Danford L. 1992. Is the impedance index (ht2/R) significant in predicting total body water? Am J Clin Nutr 56:835–839.
Ladell WSS. 1955. The effects of water and salt intake upon the performance of men working in hot and humid environments. J Physiol 127:11–46.
Lane HW, Gretebeck RJ, Schoeller DA, Davis-Street J, Socki RA, Gibson EK. 1997. Comparison of ground-based and space flight energy expenditure and water turnover in middle-aged healthy male US astronauts. Am J Clin Nutr 65:4–12.
Latzka WA, Sawka MN, Montain SJ, Skrinar GS, Fielding RA, Matott RP, Pandolf KB. 1997. Hyperhydration: Thermoregulatory effects during compensable exercise-heat stress. J Appl Physiol 83:860–866.
Latzka WA, Sawka MN, Montain SJ, Skrinar GA, Fielding RA, Matott RP, Pandolf KB. 1998. Hyperhydration: Tolerance and cardiovascular effects during uncompensable exercise-heat stress. J Appl Physiol 84:1858–1864.
Lax D, Eicher M, Goldberg SJ. 1992. Mild dehydration induces echocardiographic signs of mitral valve prolapse in healthy females with prior normal cardiac findings. Am Heart J 124:1533–1540.
Ledochowski M, Kahler M, Dienstl F, Fleischhacker W, Barnes C. 1986. Water intoxication in the course of an acute schizophrenic episode. Intensive Care Med 12:47–48.
Lee DHK. 1964. Terrestrial animals in dry heat: Man in the desert. In: Dill DB, Adolph EF, Wilber CG, eds. Handbook of Physiology, Section 4: Adaptation to the Environment. Washington, DC: American Physiological Society. Pp. 551–582.
Leibowitz HW, Abernethy CN, Buskirk ER, Bar-Or O, Hennessy RT. 1972. The effect of heat stress on reaction time to centrally and peripherally presented stimuli. Hum Factors 14:155–160.
Leiper JB, Carnie A, Maughan RJ. 1996. Water turnover rates in sedentary and exercising middle aged men. Br J Sports Med 30:24–26.
Leiper JB, Pitsiladis Y, Maughan RJ. 2001. Comparison of water turnover rates in men undertaking prolonged cycling exercise and sedentary men. Int J Sports Med 22:181–185.
Leon LR. 2002. Invited review: Cytokine regulation of fever: Studies using gene knockout mice. J Appl Physiol 92:2648–2655.
Leoni GB, Pitzalis S, Podda R, Zanda M, Silvetti M, Caocci L, Cao A, Rosatelli MC. 1995. A specific cystic fibrosis mutation (T338I) associated with the phenotype of isolated hypotonic dehydration. J Pediatr 127:281–283.
Levine L, Quigley MD, Cadarette BS, Sawka MN, Pandolf KB. 1990. Physiologic strain associated with wearing toxic-environment protective systems during exercise in the heat. In: Das B, ed. Advances in Industrial Ergonomics and Safety II. London: Taylor & Francis. Pp. 897–904.
Lindeman RD, Lee TD Jr, Yiengst MJ, Shock NW. 1966. Influence of age, renal disease, hypertension, diuretics, and calcium on the antidiuretic responses to suboptimal infusions of vasopressin. J Lab Clin Med 68:206–223.
Lindheimer MD, Davison JM. 1995. Osmoregulation, the secretion of arginine vasopressin and its metabolism during pregnancy. Eur J Endocrinol 132:133–143.
Lindheimer MD, Katz AI. 1985. Fluid and electrolyte metabolism in normal and abnormal pregnancy. In: Arieff AI, DeFronzo RA, eds. Fluid, Electrolyte, and Acid-Base Disorders. New York: Churchill Livingstone. Pp. 1041–1086.
Lindheimer MD, Katz AI. 2000. Renal physiology and disease in pregnancy. In: Seldin DW, Giebisch G, eds. The Kidney: Physiology and Pathophysiology. Philadelphia: Lippincott, Williams & Wilkins. Pp. 2597–2644.
Lloyd LE, McDonald BE, Crampton EW. 1978. Water and its metabolism. In: Fundamentals of Nutrition, 2nd ed. San Francisco: WH Freeman. Pp. 22–35.
Lubin F, Rozen P, Arieli B, Farbstein M, Knaani Y, Bat L, Farbstein H. 1997. Nutritional and lifestyle habits and water-fiber interaction in colorectal adenoma etiology. Cancer Epidemiol Biomarkers Prev 6:79–85.
Luft FC, Fineberg NS, Sloan RS, Hunt JN. 1983. The effect of dietary sodium and protein on urine volume and water intake. J Lab Clin Med 101:605–610.
Lyons TP, Reidesel ML, Meuli LE, Chick TW. 1990. Effects of glycerol-induced hyperhydration prior to exercise in the heat on sweating and core temperature. Med Sci Sports Exerc 22:477–483.
Macias-Nunez JF, Garcia-Iglesias C, Bondia-Roman A, Rodriguez-Commes JL, Corbacho-Becerra L, Tabernero-Romo JM, De Castro del Pozo S. 1978. Renal handling of sodium in old people: A functional study. Age Ageing 7:178–181.
Macias-Nunez JF, Garcia-Iglesias C, Tabernero-Romo JM, Rodriguez-Commes JL, Corbacho-Becerra L, Sanchez-Tomero JA. 1980. Renal management of sodium under indomethacin and aldosterone in the elderly. Age Ageing 9:165–172.
Mack GW, Nadel ER. 1996. Body fluid balance during heat stress in humans. In: Fregly MJ, Blatteis CM, eds. Handbook of Physiology, Section 4: Environmental Physiology. New York: Oxford University Press. Pp. 187–214.
Mack GW, Weseman CA, Langhans GW, Scherzer H, Gillen CM, Nadel ER. 1994. Body fluid balance in dehydrated healthy older men: Thirst and renal osmoregulation. J Appl Physiol 76:1615–1623.
Maresh CM, Bergeron MF, Kenefick RW, Castellani JW, Hoffman JR, Armstrong LE. 2001. Effect of overhydration on time-trial swim performance. J Strength Cond Res 15:514–518.
Martin AD, Daniel MZ, Drinkwater DT, Clarys JP. 1994. Adipose tissue density, estimated adipose lipid fraction and whole body adiposity in male cadavers. Int J Obes Relat Metab Disord 18:79–83.
Math MV, Rampal PM, Faure XR, Delmont JP. 1986. Gallbladder emptying after drinking water and its possible role in prevention of gallstone formation. Singapore Med J 27:531–532.
Maughan RJ, Fenn CE, Leiper JB. 1989. Effects of fluid, electrolyte and substrate ingestion on endurance capacity. Eur J Appl Physiol 58:481–486.
Maughan RJ, Leiper JB, Shirreffs SM. 1996. Restoration of fluid balance after exercise-induced dehydration: Effects of food and fluid intake. Eur J Appl Physiol Occup Physiol 73:317–325.
Mazariegos M, Wang Z-M, Gallagher D, Baumgartner RN, Allison DB, Wang J, Pierson RN, Heymsfield SB. 1994. Differences between young and old females in the five levels of body composition and their relevance to the two-compartment chemical model. J Gerontol 49:M201–M208.
McAloon-Dyke M, David KM, Clark BA, Fish LC, Elahi D, Minaker KL. 1997. Effects of hypertonicity on water intake in the elderly: An age-related failure. Geriatr Nephrol Urol 7:11–16.
McConell GK, Burge CM, Skinner SL, Hargreaves M. 1997. Influence of ingested fluid volume on physiological responses during prolonged exercise. Acta Physiol Scand 160:149–156.
McConell GK, Stephens TJ, Canny BJ. 1999. Fluid ingestion does not influence intense 1-h exercise performance in a mild environment. Med Sci Sports Exerc 31:386–392.
Meyer F, Bar-Or O, Salsberg A, Passe D. 1994. Hypohydration during exercise in children: Effect on thirst, drinking preferences, and rehydration. Int J Sport Nutr 4:22–35.
Michaud DS, Spiegelman D, Clinton SK, Rimm EB, Curhan GC, Willett WC, Giovannucci EL. 1999. Fluid intake and the risk of bladder cancer in men. N Engl J Med 340:1390–1397.
Miescher E, Fortney SM. 1989. Responses to dehydration and rehydration during heat exposure in young and older men. Am J Physiol 257:R1050–R1056.
Miller JH, Shock NW. 1953. Age differences in the renal tubular response to antidiuretic hormone. J Gerontol 8:446–450.
Miller PD, Krebs RA, Neal BJH, McIntyre DO. 1982. Hypodipsia in geriatric patients. Am J Med 73:354–356.
Mitchell JB, Voss KW. 1991. The influence of volume on gastric emptying and fluid balance during prolonged exercise. Med Sci Sports Exerc 23:314–319.
Mitchell JW, Nadel ER, Stolwijk JAJ. 1972. Respiratory weight losses during exercise. J Appl Physiol 32:474–476.
Mittleman KD. 1996. Influence of angiotensin II blockade during exercise in the heat. Eur J Appl Physiol Occup Physiol 72:542–547.
Mnatzakanian PA, Vaccaro P. 1982. Effects of 4% dehydration and rehydration on hematological profiles, urinary profiles and muscular endurance of college wrestlers. Med Sci Sports Exerc 14:117.
Molnar GW. 1947. Man in the tropics compared with man in the desert. In: Adolph EF, ed. Physiology of Man in the Desert. New York: Intersciences Publishers. Pp. 315–325.
Montain SJ, Coyle EF. 1992. Influence of graded dehydration on hyperthermia and cardiovascular drift during exercise. J Appl Physiol 73:1340–1350.
Montain SJ, Sawka MN, Cadarette BS, Quigley MD, McKay JM. 1994. Physiological tolerance to uncompensable heat stress: Effects of exercise intensity, protective clothing, and climate. J Appl Physiol 77:216–222.
Montain SJ, Latzka WA, Sawka MN. 1995. Control of thermoregulatory sweating is altered by hydration level and exercise intensity. J Appl Physiol 79:1434–1439.
Montain SJ, Laird JE, Latzka WA, Sawka MN. 1997. Aldosterone and vasopressin responses in the heat: Hydration level and exercise intensity effects. Med Sci Sports Exerc 29:661–668.
Montain SJ, Sawka MN, Latzka WA, Valeri CR. 1998a. Thermal and cardiovascular strain from hypohydration: Influence of exercise intensity. Int J Sports Med 19:87–91.
Montain SJ, Smith SA, Mattot RP, Zientara GP, Jolesz FA, Sawka MN. 1998b. Hypohydration effects on skeletal muscle performance and metabolism: A 31P-MRS study. J Appl Physiol 84:1889–1894.
Montain SJ, Sawka MN, Wenger CB. 2001. Hyponatremia associated with exercise: Risk factors and pathogenesis. Exerc Sports Sci Rev 29:113–117.
Montner P, Stark DM, Riedesel ML, Murata G, Robergs R, Timms M, Chick TW. 1996. Pre-exercise glycerol hydration improves cycling endurance time. Int J Sports Med 17:27–33.
Mor F, Mor-Snir I, Wysenbeek AJ. 1987. Rhabdomyolysis in self-induced water intoxication. J Nerv Ment Dis 175:742–743.
Moran D, Shapiro Y, Epstein Y, Burstein R, Stroschein L, Pandolf KB. 1995. Validation and adjustment of the mathematical prediction model for human rectal temperature responses to outdoor environmental conditions. Ergonomics 38: 1011–1018.
Morimoto A, Murakami N, Ono T, Watanabe T. 1986. Dehydration enhances endotoxin fever by increased production of endogenous pyrogen. Am J Physiol 251:R41–R47.
Morimoto T. 1990. Thermoregulation and body fluids: Role of blood volume and central venous pressure. Jpn J Physiol 40:165–179.
Moroff SV, Bass DE. 1965. Effects of overhydration on man’s physiological responses to work in the heat. J Appl Physiol 20:267–270.
Mudambo KSMT, Leese GP, Rennie MJ. 1997a. Dehydration in soldiers during walking/running exercise in the heat and the effects of fluid ingestion during and after exercise. Eur J Appl Physiol 76:517–524.
Mudambo KSMT, Scrimgeour CM, Rennie MJ. 1997b. Adequacy of food rations in soldiers during exercise in hot, day-time conditions assessed by doubly labelled water and energy balance methods. Eur J Appl Physiol 76:346–351.
Murphy DJ, Minaker KL, Fish LC, Rowe JW. 1988. Impaired osmostimulation of water ingestion delays recovery from hyperosmolarity in normal elderly. Gerontologist 28:A141.
Murray R. 1987. The effects of consuming carbohydrate-electrolyte beverages on gastric emptying and fluid absorption during and following exercise. Sports Med 4:322–351.
Nadel ER, Fortney SM, Wenger CB. 1980. Effect of hydration state on circulatory and thermal regulations. J Appl Physiol 49:715–721.
Nagy KA, Costa DP. 1980. Water flux in animals: Analysis of potential errors in the tritiated water method. Am J Physiol 238:R454–R465.
Neufer PD, Young AJ, Sawka MN. 1989a. Gastric emptying during exercise: Effects of heat stress and hypohydration. Eur J Appl Physiol 58:433–439.
Neufer PD, Young AJ, Sawka MN. 1989b. Gastric emptying during walking and running: Effects of varied exercise intensity. Eur J Appl Physiol 58:440–445.
Neufer PD, Sawka MN, Young AJ, Quigley MD, Latzka WA, Levine L. 1991. Hypohydration does not impair skeletal muscle glycogen resynthesis after exercise. J Appl Physiol 70:1490–1494.
Neuhauser-Berthold M, Beine S, Verwied SC, Luhrmann PM. 1997. Coffee consumption and total body water homeostasis as measured by fluid balance and bioelectrical impedance analysis. Ann Nutr Metab 41:29–36.
Newburgh LH, Woodwell Johnston M, Falcon-Lesses M. 1930. Measurement of total water exchange. J Clin Invest 8:161–196.
Nielsen B. 1974. Effects of changes in plasma volume and osmolarity on thermoregulation during exercise. Acta Physiol Scand 90:725–730.
Nielsen B, Hansen G, Jorgensen SO, Nielsen E. 1971. Thermoregulation in exercising man during dehydration and hyperhydration with water and saline. Int J Biometeorol 15:195–200.
Nielsen B, Kubica R, Bonnesen A, Rasmussen IB, Stoklosa J, Wilk B. 1981. Physical work capacity after dehydration and hyperthermia. Scand J Sports Sci 3:2–10.
Noakes TD. 2002. Hyponatremia in distance runners: Fluid and sodium balance during exercise. Curr Sports Med Rep 4:197–207.
Noakes TD, Wilson G, Gray DA, Lambert MI, Dennis SC. 2001. Peak rates of diuresis in healthy humans during oral fluid overload. S Afr Med J 91:852–857.
Nose H, Morimoto T, Ogura K. 1983. Distribution of water losses among fluid compartments of tissues under thermal dehydration in the rat. Jpn J Physiol 33:1019–1029.
Nose H, Mack GW, Shi X, Nadel ER. 1988. Role of osmolality and plasma volume during rehydration in humans. J Appl Physiol 65:325–331.
Novak LP. 1989. Changes in total body water during adolescent growth. Hum Biol 61:407–414.
NRC (National Research Council). 1989. Recommended Dietary Allowances, 10th ed. Washington, DC: National Academy Press.
Nurminen ML, Niitynen L, Korpela R, Vapaatalo H. 1999. Coffee, caffeine and blood pressure: A critical review. Eur J Clin Nutr 53:831–839.
O’Brien C, Montain SJ. 2003. Hypohydration effect on finger skin temperature and blood flow during cold-water finger immersion. J Appl Physiol 94:598–603.
O’Brien C, Freund BJ, Sawka MN, McKay J, Hesslink RL, Jones TE. 1996. Hydration assessment during cold-weather military field training exercises. Arctic Med Res 55:20–26.
O’Brien C, Young AJ, Sawka MN. 1998. Hypohydration and thermoregulation in cold air. J Appl Physiol 84:185–189.
O’Brien C, Baker-Fulco CJ, Young AJ, Sawka MN. 1999. Bioimpedance assessment of hypohydration. Med Sci Sports Exerc 31:1466–1471.
O’Brien C, Young AJ, Sawka MN. 2002. Bioelectrical impedance to estimate changes in hydration status. Int J Sports Med 23:361–366.
O’Brien KK, Montain SJ, Corr WP, Sawka MN, Knapik JJ, Craig SC. 2001. Hyponatremia associated with overhydration in U.S. Army trainees. Mil Med 166:405–410.
Okuno T, Yawata T, Nose H, Morimoto T. 1988. Difference in rehydration process due to salt concentration of drinking water in rats. J Appl Physiol 64:2438–2443.
Okura M, Okada K, Nagamine I, Yamaguchi H, Karisha K, Ishimoto Y, Ikuta T. 1990. Electroencephalographic changes during and after water intoxication. Jpn J Psychiatry Neurol 44:729–734.
Olsson K-E, Saltin B. 1970. Variation in total body water with muscle glycogen changes in man. Acta Physiol Scand 80:11–18.
Orenstein DM, Henke KG, Costill DL, Doershuk CF, Lemon PJ, Stern RC. 1983. Exercise and heat stress in cystic fibrosis patients. Pediatr Res 17:267–269.
Passmore AP, Kondowe GB, Johnston GD. 1987. Renal and cardiovascular effects of caffeine: A dose-response study. Clin Sci 72:749–756.
Phillips PA, Rolls BJ, Ledingham JGG, Forsling ML, Morton JJ, Crowe MJ, Wollner L. 1984. Reduced thirst after water deprivation in healthy elderly men. N Engl J Med 311:753–759.
Pichan G, Gauttam RK, Tomar OS, Bajaj AC. 1988. Effect of primary hypohydration on physical work capacity. Int J Biometeorol 32:176–180.
Pitt M. 1989. Fluid intake and urinary tract infection. Nurs Times 85:36–38.
Pitts GC, Johnson RE, Consolazio FC. 1944. Work in the heat as affected by intake of water, salt and glucose. Am J Physiol 142:253–259.
Pohlabeln H, Jockel K-H, Bolm-Audorff U. 1999. Non-occupational risk factors for cancer of the lower urinary tract in Germany. Eur J Epidemiol 15:411–419.
Popowski LA, Oppliger RA, Lambert GP, Johnson RF, Johnson AK, Gisolf CV. 2001. Blood and urinary measures of hydration status during progressive acute dehydration. Med Sci Sports Exerc 33:747–753.
Posner L, Mokrzycki MH. 1996. Transient central diabetes insipidus in the setting of underlying chronic nephrogenic diabetes insipidus associated with lithium use. Am J Nephrol 16:339–343.
Pratte AL, Padilla GV, Baker VE. 1973. Alterations in cardiac activity from ingestion of ice water. Commun Nurs Res 6:148–155.
Raman A, Schoeller DA, Subar AF, Troiano RP, Schatzkin A, Harris T, Bauer D, Bingham S, Everhart J, Newman AB, Tylavsky FA. 2004. Water turnover in 458 US adults 40–79 years of age. Am J Physiol Renal Physiol 286:F394–F401.
Rehrer NJ, Beckers EJ, Brouns F, Ten Hoor F, Saris WHM. 1990. Effects of dehydration on gastric emptying and gastrointestinal distress while running. Med Sci Sports Exerc 22:790–795.
Remick D, Chancellor K, Pederson J, Zambraski EJ, Sawka MN, Wenger CB. 1998. Hyperthermia and dehydration-related deaths associated with intentional rapid weight loss in three collegiate wrestlers—North Carolina, Wisconsin, and Michigan, November–December 1997. Morb Mortal Wkly Rep 47:105–108.
Richmond CA. 2001. Effects of hydration on febrile temperature patterns in rabbits. Biol Res Nurs 2:277–291.
Rivera-Brown AM, Gutierrez R, Gutierrez JC, Frontera WR, Bar-Or O. 1999. Drink composition, voluntary drinking, and fluid balance in exercising, trained, heat-acclimatized boys. J Appl Physiol 86:78–84.
Robinson TA, Hawley JA, Palmer GS, Wilson GR, Gray DA, Noakes TD, Dennis SC. 1995. Water ingestion does not improve 1-h cycling performance in moderate ambient temperatures. Eur J Appl Physiol 71:153–160.
Rolls BJ, Rolls ET. 1982. Thirst. Cambridge: Cambridge University Press.
Roth J, Schulze K, Simon E, Zeisberger E. 1992. Alteration of endotoxin fever and release of arginine vasopressin by dehydration in the guinea pig. Neuroendocrinology 56:680–686.
Rothstein A, Towbin EJ. 1947. Blood circulation and temperature of men dehydrating in the heat. In: Adolph EF, ed. Physiology of Man in the Desert. New York: Intersciences Publishers. Pp. 172–196.
Rowe JW, Shock NW, DeFronzo RA. 1976. The influence of age on the renal response to water deprivation in man. Nephron 17:270–278.
Rowe JW, Minaker KL, Sparrow D, Robertson GL. 1982. Age-related failure of volume-pressure-mediated vasopressin release. J Clin Endocrinol Metab 54:661–664.
Ruby BC, Shriver TC, Zderic TW, Sharkey BJ, Burks C, Tysk S. 2002. Total energy expenditure during arduous wildfire suppression. Med Sci Sports Exerc 34:1048–1054.
Ryan AJ, Lambert GP, Shi X, Chang RT, Summers RW, Gisolfi CV. 1998. Effect of hypohydration on gastric emptying and intestinal absorption during exercise. J Appl Physiol 84:1581–1588.
Saltin B. 1964. Aerobic and anaerobic work capacity after dehydration. J Appl Physiol 19:1114–1118.
Sanford RA, Wells BB. 1962. The urine. In: Davidsohn I, Wells BB, eds. Clinical Diagnosis by Laboratory Methods. Philadelphia: WB Saunders. Pp. 22–60.
Sawka MN. 1988. Body fluid responses and hypohydration during exercise-heat stress. In: Pandolf KB, Sawka MN, Gonzalez RR, eds. Human Performance Physiology and Environmental Medicine at Terrestrial Extremes. Indianapolis, IN: Benchmark Press. Pp. 227–266.
Sawka MN. 1992. Physiological consequences of hypohydration: Exercise performance and thermoregulation. Med Sci Sports Exerc 24:657–670.
Sawka MN, Coyle EF. 1999. Influence of body water and blood volume on thermoregulation and exercise performance in the heat. In: Holloszy, ed. Exercise and Sport Sciences Reviews. Vol 27. Baltimore, MD: Lippincott, Williams & Wilkins. Pp. 167–218.
Sawka MN, Montain SJ. 2001. Fluid and electrolyte balance: Effects on thermoregulation and exercise in the heat. In: Bowman BA, Russell RM, eds. Present Knowledge in Nutrition, 8th ed. Washington, DC: ILSI Press. Pp. 115–124.
Sawka MN, Knowlton RG, Critz JB. 1979. Thermal and circulatory responses to repeated bouts of prolonged running. Med Sci Sports 11:177–180.
Sawka MN, Hubbard RW, Francesconi RP, Horstman DH. 1983a. Effects of acute plasma volume expansion on altering exercise-heat performance. Eur J Appl Physiol 51:303–312.
Sawka MN, Toner MM, Francesconi RP, Pandolf KB. 1983b. Hypohydration and exercise: Effects of heat acclimation, gender, and environment. J Appl Physiol 55:1147–1153.
Sawka MN, Francesconi RP, Pimental NA, Pandolf KB. 1984a. Hydration and vascular fluid shifts during exercise in the heat. J Appl Physiol 56:91–96.
Sawka MN, Francesconi RP, Young AJ, Pandolf KB. 1984b. Influence of hydration level and body fluids on exercise performance in the heat. J Am Med Assoc 252:1165–1169.
Sawka MN, Young AJ, Francesconi RP, Muza SR, Pandolf KB. 1985. Thermoregulatory and blood responses during exercise at graded hypohydration levels. J Appl Physiol 59:1394–1401.
Sawka MN, Gonzalez RR, Young AJ, Muza SR, Pandolf KB, Latzka WA, Dennis RC, Valeri CR. 1988. Polycythemia and hydration: Effects on thermoregulation and blood volume during exercise-heat stress. Am J Physiol 255:R456–R463.
Sawka MN, Gonzalez RR, Young AJ, Dennis RC, Valeri CR, Pandolf KB. 1989a. Control of thermoregulatory sweating during exercise in the heat. Am J Physiol 257:R311–R316.
Sawka MN, Young AJ, Dennis RC, Gonzalez RR, Pandolf KB, Valeri CR. 1989b. Human intravascular immunoglobulin responses to exercise-heat and hypohydration. Aviat Space Environ Med 60:634–638.
Sawka MN, Young AJ, Latzka WA, Neufer PD, Quigley MD, Pandolf KB. 1992. Human tolerance to heat strain during exercise: Influence of hydration. J Appl Physiol 73:368–375.
Sawka MN, Wenger CB, Pandolf KB. 1996a. Thermoregulatory responses to acute exercise-heat stress and heat acclimation. In: Fregly MJ, Blatteis CM, eds. Handbook of Physiology. Section 4: Environmental Physiology, Volume 1. New York: Oxford University Press. Pp. 157–185.
Sawka MN, Young AJ, Rock PB, Lyons TP, Boushel R, Freund BJ, Muza SR, Cymerman A, Dennis RC, Pandolf KB, Valeri CR. 1996b. Altitude acclimatization and blood volume: Effects of exogenous erythrocyte volume expansion. J Appl Physiol 81:636–642.
Sawka MN, Convertino VA, Eichner ER, Schnieder SM, Young AJ. 2000. Blood volume: Importance and adaptations to exercise training, environmental stresses, and trauma/sickness. Med Sci Sports Exerc 32:332–348.
Sawka MN, Montain SJ, Latzka WA. 2001. Hydration effects on thermoregulation and performance in the heat. Comp Biochem Physiol A 128:679–690.
Schloerb PR, Friis-Hansen BJ, Edelman IS, Solomon AK, Moore FD. 1950. The measurement of total body water in the human subject by deuterium oxide dilution. J Clin Invest 29:1296–1310.
Schroeder C, Bush VE, Norcliffe LJ, Luft FC, Tank J, Jordan J, Hainsworth R. 2002. Water drinking acutely improves orthostatic tolerance in health subjects. Circulation 106:2806–2811.
Scott EM, Greenwood JP, Gilby SG, Stoker JB, Mary DASG. 2001. Water ingestion increases sympathetic vasoconstrictor discharge in normal human subjects. Clin Sci 100:335–342.
Senay LC Jr, Christensen ML. 1965. Changes in blood plasma during progressive dehydration. J Appl Physiol 20:1136–1140.
Serfass RC, Stull GA, Alexander JF, Ewing JL Jr. 1984. The effects of rapid weight loss and attempted rehydration on strength and endurance of the handgripping muscles in college wrestlers. Res Q Exerc Sport 55:46–52.
Seymour DG, Henschke PJ, Cape RDT, Campbell AJ. 1980. Acute confusional states and dementia in the elderly: The role of dehydration/volume depletion, physical illness and age. Age Ageing 9:137–146.
Shannon IL, Segreto VA. 1968. Saliva Specific Gravity. Technical Report SAM-TR-68-88. Brooks Air Force Base, TX: United States Air Force. Pp. 1–8.
Shannon J, White E, Shattuck AL, Potter JD. 1996. Relationship of food groups and water intake to colon cancer risk. Cancer Epidemiol Biomarkers Prev 5:495–502.
Shapiro Y, Pandolf KB, Goldman RF. 1982. Predicting sweat loss response to exercise, environment and clothing. Eur J Appl Physiol Occup Physiol 48:83–96.
Shapiro Y, Moran D, Epstein Y, Stroschein L, Pandolf KB. 1995. Validation and adjustment of the mathematical prediction model for human sweat rate responses to outdoor environmental conditions. Ergonomics 38:981–986.
Share L, Claybaugh JR, Hatch FE Jr, Johnson JG, Lee S, Muirhead EE, Shaw P. 1972. Effects of change in posture and of sodium depletion on plasma levels of vasopressin and renin in normal human subjects. J Clin Endocrinol Metab 35:171–174.
Sharma VM, Pichan G, Panwar MR. 1983. Differential effects of hot-humid and hot-dry environments on mental functions. Int Arch Occup Environ Health 52:315–327.
Sharma VM, Sridharan K, Pichan G, Panwar MR. 1986. Influence of heat-stress induced dehydration on mental functions. Ergonomics 29:791–799.
Ship JA, Fischer DJ. 1997. The relationship between dehydration and parotid salivary gland function in young and older healthy adults. J Gerontol 52A:M310–M319.
Ship JA, Fischer DJ. 1999. Metabolic indicators of hydration status in the prediction of parotid salivary-gland function. Arch Oral Biol 44:343–350.
Shirreffs SM, Maughan RJ. 1998. Urine osmolality and conductivity as indicies of hydration status in athletes in the heat. Med Sci Sports Exerc 30:1598–1602.
Shore AC, Markandu ND, Sagnella GA, Singer DRJ, Forsling ML, Buckley MG, Sugden AL, MacGregor GA. 1988. Endocrine and renal response to water loading and water restriction in normal man. Clin Sci 75:171–177.
Sidi Y, Gassner S, Sandbank U, Keren G, Pinkhas J. 1984. Water intoxication, hyperpyrexia and rhabdomyolysis in a patient with psychogenic polydipsia. NY State J Med 84:462–464.
Siegel AJ, Baldessarini RJ, Klepser MB, McDonald JC. 1998. Primary and drug-induced disorders of water homeostatis in psychiatric patients: Principles of diagnosis and management. Harvard Rev Psychiatry 6:190–200.
Singer RN, Weiss SA. 1968. Effects of weight reduction on selected anthropometric, physcial, and performance measures of wrestlers. Res Q 39:361–369.
Slattery ML, West DW, Robison LM. 1988. Fluid intake and bladder cancer in Utah. Int J Cancer 42:17–22.
Slattery ML, Caan BJ, Anderson KE, Potter JD. 1999. Intake of fluids and methylxanthine-containing beverages: Association with colon cancer. Int J Cancer 81:199–204.
Sleeper FH. 1935. Investigation of polyuria in schizophrenia. Am J Psychiatry 91:1019–1031.
Snyder NA, Fiegal DW, Arieff AI. 1987. Hypernatremia in elderly patients. A heterogeneous, morbid, and iatrogenic entity. Ann Intern Med 107:309–319.
Speedy DB, Noakes TD, Boswell T, Thompson JM, Rehrer N, Boswell DR. 2001. Response to a fluid load in athletes with a history of exercise induced hyponatremia. Med Sci Sports Exerc 33:1434–1442.
Sproles CB, Smith DP, Byrd RJ, Allen TE. 1976. Circulatory responses to submaximal exercise after dehydration and rehydration. J Sports Med 16:98–105.
Stachenfeld NS, Mack GW, Takamata A, DiPietro L, Nadel ER. 1996. Thirst and fluid regulatory responses to hypertonicity in older adults. Am J Physiol 271: R757–R765.
Stachenfeld NS, DiPietro L, Nadel ER, Mack GW. 1997. Mechanism of attenuated thirst in aging: Role of central volume receptors. Am J Physiol 272:R148–R157.
Stone KA. 1999. Lithium-induced nephrogenic diabetes insipidus. J Am Board Fam Pract 12:43–47.
Stookey JD. 1999. The diuretic effects of alcohol and caffeine and total water intake misclassification. Eur J Epidemiol 15:181–188.
Stricker EM, Sved AF. 2000. Thirst. Nutrition 16:821–826.
Strydom NB, Holdsworth LD. 1968. The effects of different levels of water deficit on physiological responses during heat stress. Int Z Angew Physiol 26:95–102.
Susset J. 1993. The hazards of excessive fluid intake. J Urol Nurs 12:605–608.
Svenberg T, Christofides ND, Fitzpatrick ML, Bloom SR, Welbourn RB. 1985. Oral water causes emptying of the human gallbladder through actions of vagal stimuli rather than motilin. Scand J Gastroenterol 20:775–778.
Szlyk PC, Sils IV, Francesconi RP, Hubbard RW, Armstrong LE. 1989. Effects of water temperature and flavoring on voluntary dehydration in man. Physiol Behav 45:639–647.
Szlyk PC, Sils IV, Francesconi RP, Hubbard RW. 1990. Patterns of human drinking: Effects of exercise, water temperature, and food consumption. Aviat Space Environ Med 61:43–48.
Taivainen H, Laitinen R, Tahtela R, Kiianmaa K, Valimaki MJ. 1995. Role of plasma vasopressin in changes of water balance accompanying acute alcohol intoxication. Alcohol Clin Exp Res 19:759–762.
Tietz NW. 1995. Clinical Guide to Laboratory Tests, 3rd ed. Philadelphia: WB Sauders.
Tilkian SM, Boudreau Conover M, Tilkian AG. 1995. Clinical & Nursing Implications of Laboratory Tests, 5th ed. St. Louis: Mosby.
Tomiyama J, Kametani H, Kumagai Y, Adachi Y, Tohri K. 1990. Water intoxication and rhabdomyolysis. Jpn J Med 29:52–55.
Torranin C, Smith DP, Byrd RJ. 1979. The effect of acute thermal dehydration and rapid rehydration on isometric and isotonic endurance. J Sports Med 19:1–9.
Tuttle WW. 1943. The effect of weight loss by dehydration and the withholding of food on the physiologic responses of wrestlers. Res Q 14:158–166.
U.S. Army. 1959. Southwest Asia: Environment and its Relationship to Military Activities. Technical Report EP-118. Natick, MA: Environmental Protection Research Division, Quartermaster Research and Engineering Command, U.S. Army.
U.S. Army. 2003. Heat Stress Control and Heat Casualty Management. TB MED 507/AFPAM 48-152(I). Washington, DC: Department of the Army and Air Force.
USDA/ARS (U.S. Department of Agriculture/Agricultural Research Service). 2002. USDA National Nutrient Database for Standard Reference, Release 15. Online. Available at http://www.nal.usda.gov/fnic/foodcomp. Accessed June 30, 2003.
Valtin H. 2002. Drink at least eight glasses of water a day. Really? Is there scientific evidence for “8 x 8”? Am J Physiol 283:R993–1004.
Van Loan MD, Boileau RA. 1996. Age, gender, and fluid balance. In: Buskirk ER, Puhl SM, eds. Body Fluid Balance: Exercise and Sport. Boca Raton, FL: CRC Press. Pp. 215–230.
Van Loan MD, Kopp LE, King JC, Wong WW, Mayclin PL. 1995. Fluid changes during pregnancy: Use of bioimpedance spectroscopy. J Appl Physiol 78:1037–1042.
Vio FR, Infante CB, Lara WC, Mardones-Santander F, Rosso PR. 1986. Validation of the deuterium dilution technique for the measurement of fluid intake in infants. Hum Nutr Clin Nutr 40C:327–332.
Visser M, Gallagher D. 1998. Age-related change in body water and hydration in old age. In: Arnaud MJ, ed. Hydration Throughout Life. Montrouge, France: John Libbey Eurotext. Pp. 117–125.
Visser M, Gallagher D, Deurenberg P, Wang J, Peirson RN Jr, Heymsfield SB. 1997. Density of fat-free body mass: Relationship with race, age, and level of body fatness. Am J Physiol 272:E781–E787.
Wagner JA, Robinson S, Tzankoff SP, Marino RP. 1972. Heat tolerance and acclimatization to work in the heat in relation to age. J Appl Physiol 33:616–622.
Wakefield B, Mentes J, Diggelmann L, Culp K. 2002. Monitoring hydration status in elderly veterans. West J Nurs Res 24:132–142.
Walsh NP, Montague JC, Callow N, Rowlands AV. 2004. Saliva flow rate, total protein concentration and osmolality as potential markers of whole body hydration status during progressive acute dehydration in humans. Arch Oral Biol 49:149–154.
Walsh RM, Noakes TD, Hawley JA, Dennis SC. 1994. Impaired high-intensity cycling performance time at low levels of dehydration. Int J Sports Med 15:392–398.
Watanabe T, Hashimoto M, Wada M, Imoto T, Miyoshi M, Sadamitsu D, Maekawa T. 2000. Angiotensin-converting enzyme inhibitor inhibits dehydration-enhanced fever induced by endotoxin in rats. Am J Physiol 279:R1512–R1516.
Webster S, Rutt R, Weltman A. 1990. Physiological effects of a weight loss regimen practiced by college wrestlers. Med Sci Sports Exerc 22:229–234.
Weinberg AD, Pals JK, Levesque PG, Beal LF, Cunnigham TJ, Minaker KL. 1994a. Dehydration and death during febrile episodes in the nursing home. J Am Geriatr Soc 42:968–971.
Weinberg AD, Pals JK, McGlinchey-Berroth R, Minaker KL. 1994b. Indices of dehydration among frail nursing home patients: Highly variable but stable over time. J Am Geriatr Soc 42:1070–1073.
Welch BE, Buskirk ER, Iampietro PF. 1958. Relation of climate and temperature to food and water intake in man. Metabolism 7:141–148.
Wenger CB. 1972. Heat of evaporation of sweat: Thermodynamic considerations. J Appl Physiol 32:456–459.
West JB. 1990. Regulation of volume and osmolality of the body fluids. In: West JB, ed. Best and Taylor’s Physiological Basis of Medical Practice, 11th ed. Baltimore: Williams and Wilkins. Pp. 478–485.
Wierzuchowski M. 1936. The limiting rate of assimilation of glucose introduced intravenously at constant speed in the resting dog. J Physiol 87:311–335.
Wilk B, Bar-Or O. 1996. Effect of drink flavor and NaCl on voluntary drinking and hydration in boys exercising in the heat. J Appl Physiol 80:1112–1117.
Wilkens LR, Kadir MM, Kolonel LN, Nomura AMY, Hankin JH. 1996. Risk factors for lower urinary tract cancer: The role of total fluid consumption, nitrites and nitrosamines, and selected foods. Cancer Epidemiol Biomarkers Prev 5:161–166.
Yamamura T, Takahashi T, Kusunoki M, Kantoh M, Seino Y, Utsunomiya J. 1988. Gallbladder dynamics and plasma cholecystokinin responses after meals, oral water, or sham feeding in healthy subjects. Am J Med Sci 295:102–107.
Yokozawa K, Torikoshi S, Nagano J, Ito K, Suzuki Y. 1993. Water intake and urinary volume during 20 days bed-rest in young women. Physiologist 36:S123–S124.
Yonemura K, Hishida A, Miyajima H, Tawarahara K, Mizoguchi K, Nishimura Y, Ohishi K. 1987. Water intoxication due to excessive water intake: Observation of initiation stage. Jpn J Med 26:249–252.
Young AJ, Muza SR, Sawka MN, Pandolf KB. 1987. Human vascular fluid responses to cold stress are not altered by cold acclimation. Undersea Biomed Res 14:215–228.
Zambraski EJ. 1996. The kidney and body fluid balance during exercise. In: Buskirk ER, Puhl SM, eds. Body Fluid Balance: Exercise and Sport. Boca Raton, FL: CRC Press. Pp. 75–95.
Zambraski EJ, Tipton CM, Jordon HR, Palmer WK, Tcheng TK. 1974. Iowa wrestling study: Urinary profiles of state finalists prior to competition. Med Sci Sports 6:129–132.
Zellner DA, Bartoli AM, Eckard R. 1991. Influence of color on odor identification and liking ratings. Am J Psychol 104:547–561.


