
6
Sodium and Chloride
SUMMARY
The cation sodium and the anion chloride are normally found in most foods together as sodium chloride, also termed salt. For this reason, this report presents data on the requirements for and the effects of sodium and chloride together.1
Sodium and chloride are required to maintain extracellular volume and plamsa osmolality. Human populations have demonstrated the capacity to survive at extremes of sodium intake from less than 0.2 g (10 mmol)/day of sodium in the Yanomamo Indians of Brazil to over 10.3 g (450 mmol)/day in Northern Japan. The ability to survive at extremely low levels of sodium intake reflects the capacity of the normal human body to conserve sodium by markedly reducing losses of sodium in the urine and sweat. Under conditions of maximal adaptation and without sweating, the minimal amount of sodium required to replace losses is estimated to be no more than 0.18 g (8 mmol)/day. Still, it is unlikely that a diet providing this level of sodium intake is sufficient to meet dietary requirements for other nutrients.
Because of insufficient data from dose-response trials, an Estimated Average Requirement (EAR) could not be established, and thus a Recommended Dietary Allowance could not be derived. Hence, an Adequate Intake (AI) is provided.
The AI for sodium is set for young adults at 1.5 g (65 mmol)/day (3.8 g of sodium chloride) to ensure that the overall diet provides an adequate intake of other important nutrients and to cover sodium sweat losses in unacclimatized individuals who are exposed to high temperatures or who become physically active as recommended in other dietary reference intakes (DRI) reports. This AI does not apply to individuals who lose large volumes of sodium in sweat, such as competitive athletes and workers exposed to extreme heat stress (e.g., foundry workers and fire fighters). The AI for sodium for older adults and the elderly is somewhat less, based on lower energy intakes, and is set at 1.3 g (55 mmol)/day for men and women 50 through 70 years of age, and at 1.2 g (50 mmol)/day for those 71 years of age and older.
Concerns have been raised that a low level of sodium intake adversely affects blood lipids, insulin resistance, and cardiovascular disease risk. However, at the level of the AI, the preponderance of evidence does not support this contention. A potential indicator of an adverse effect of inadequate sodium is an increase in plasma renin activity. However, in contrast to the well-accepted benefits of blood pressure reduction, the clinical relevance of modest rises in plasma renin activity as a result of sodium reduction is uncertain.
The AI for chloride is set at a level equivalent on a molar basis to that of sodium, since almost all dietary chloride comes with the sodium added during processing or consumption of foods. Thus the AI for chloride for younger adults is 2.3 g (65 mmol)/day of chloride, which is equivalent to 3.8 g/day sodium chloride. The AIs for chloride for older adults and the elderly are 2.0 and 1.8 g of chloride per day respectively, equivalent to 3.2 g (55 mmol) and 2.9 g (50 mmol) of sodium chloride per day.
The major adverse effect of increased sodium chloride intake is elevated blood pressure, which has been shown to be an etiologically related risk factor for cardiovascular and renal diseases. On average, blood pressure rises progressively with increased sodium chloride intake. The dose-dependent rise in blood pressure appears to occur throughout the spectrum of sodium intake. However, the relationship is nonlinear in that the blood pressure response to changes in sodium intake is greater at sodium intakes below 2.3 g (100 mmol)/day than above this level. The strongest
dose-response evidence comes from those clinical trials that specifically examined the effects of at least three levels of sodium intake on blood pressure. The range of sodium intake in these studies varied from 0.23 g (10 mmol)/day to 34.5 g (1,500 mmol)/day. Several trials included sodium intake levels close to 1.5 g (65 mmol) and 2.3 g (100 mmol)/day.
While blood pressure, on average, rises with increased sodium intake, there is well-recognized heterogeneity in the blood pressure response to changes in sodium chloride intake. Individuals with hypertension, diabetes, and chronic kidney disease, as well as older-age persons and African Americans, tend to be more sensitive to the blood pressure-raising effects of sodium chloride intake than their counterparts.2 Genetic factors also influence the blood pressure response to sodium chloride. There is considerable evidence that salt sensitivity is modifiable. The rise in blood pressure from increased sodium chloride intake is blunted in the setting of a diet that is high in potassium or that is low in fat, and rich in minerals; nonetheless, a dose-response relationship between sodium intake and blood pressure still persists. In nonhypertensive individuals, a reduced salt intake can decrease the risk of developing hypertension (typically defined as systolic blood pressure ≥140 mm Hg or diastolic blood pressure ≥ 90 mm Hg).
The adverse effects of higher levels of sodium intake on blood pressure provide the scientific rationale for setting the Tolerable Upper Intake Level (UL). Because the relationship between sodium intake and blood pressure is progressive and continuous without an apparent threshold, it is difficult to precisely set a UL, especially because other environmental factors (weight, exercise, potassium intake, dietary pattern, and alcohol intake) and genetic factors also affect blood pressure. For adults, a UL of 2.3 g (100 mmol)/day is set. In dose-response trials, this level was commonly the next level above the AI that was tested. It should be noted that the UL is not a recommended intake and, as with other ULs, there is no benefit to consuming levels above the AI.
Among certain groups of individuals who are most sensitive to the blood pressure effects of increased sodium intake (e.g., older persons; African Americans; and individuals with hypertension, diabetes, or chronic kidney disease), their UL may well be lower. These groups also experience an especially high incidence of blood pressure-related cardiovascular disease. In contrast, for individuals who are unacclimatized to prolonged physical activity in a hot environment, their needs may exceed the UL because of sodium sweat losses.
It is well-recognized that the current intake of sodium for most individuals in the United States and Canada greatly exceeds both the AI and UL. Progress in achieving a reduced sodium intake will likely be incremental and will require changes in individual behavior towards salt consumption, replacement of high salt foods with lower salt versions, increased collaboration of the food industry with public health officials, and a broad spectrum of additional research. The latter includes research designed to develop reduced sodium food products while maintaining flavor, texture, consumer acceptability, and low cost.
BACKGROUND INFORMATION
Function
Sodium is the principal cation of the extracellular fluid and functions as the osmotic determinant in regulating extracellular fluid volume and thus plasma volume. Approximately 95 percent of the total sodium content of the body is found in extracellular fluid. Sodium is also an important determinant of the membrane potential of cells and the active transport of molecules across cell membranes. The concentration of sodium within the cell is typically less than 10 percent of that outside cell membranes, and an active, energy-dependent process is required to maintain this concentration gradient. Chloride, in association with sodium (i.e., sodium chloride), is the principal osmotically active anion in the extracellular fluid and is also important in maintaining fluid and electrolyte balance; it also serves as an important component of gastric juice as hydrochloric acid.
Physiology of Absorption and Metabolism
Sodium and chloride ions are typically consumed as sodium chloride. Absorption of sodium and chloride occurs primarily in the
small intestine and is approximately 98 percent across a wide intake range. The majority of ingested sodium chloride is excreted in the urine, provided that sweating is not excessive (Holbrook et al., 1984; Pitts, 1974). In humans who are at “steady-state” conditions of sodium and fluid balance and who have minimal sweat losses, the amount of sodium excreted in urine roughly equals intake. This phenomenon occurs due to the capacity of the normal human kidney to filter some 25,000 mmol of sodium each day and to reabsorb, by extremely precise mechanisms, 99 percent or more of the filtered load (Valtin and Schafer, 1995). Absorbed sodium and chloride remain in the extracellular compartments, which include plasma (at concentrations of 140 mmol/L for sodium and 104 mmol/L for chloride), interstitial fluid (at concentrations of 145 mmol/L for sodium and 115 mmol/L for chloride), and plasma water (at concentrations of 150 mmol/L for sodium and 111 mmol/L for chloride); intracellular concentrations in tissues such as muscle are 3 mmol/L for sodium and 3 mmol/L for chloride (Oh and Uribarri, 1999). Sodium is maintained outside of the cell via the Na+/K+-ATPase pump.
There are various systems and hormones that influence sodium and chloride balance, including the renin-angiotensin-aldosterone axis, the sympathetic nervous system, atrial natriuretic peptide, the kallikrein-kinin system, various intrarenal mechanisms, and other factors that regulate renal and medullary blood flow. Angiotensin II, a potent vasoconstrictor, regulates the proximal tubule of the nephron to promote sodium and chloride retention and also to stimulate the release of aldosterone from the adrenal cortex (Valtin and Schafer, 1995). Aldosterone promotes the renal reabsorption of sodium in the distal tubule of the nephron by mineralocorticoid receptor-mediated exchange for hydrogen and potassium ions. With reduced salt intake, reduced blood volume, or reduced blood pressure, the renin-angiotensin-aldosterone axis is stimulated. When the renin-angiotensin-aldosterone system is less responsive, as with advancing age, there is a greater blood pressure reduction from a reduced intake of sodium chloride (Cappuccio et al., 1985; Weinberger et al., 1993a).
Atrial natriuretic peptide (ANP) is released in response to elevated blood volume and serves as a counter-regulatory system to the renin-angiotensin-aldosterone system. ANP decreases the release of renin and therefore the release of angiotensin II and aldosterone and increases the glomerular filtration rate. These actions contribute to reductions in blood volume and blood pressure.
The sympathetic nervous system is another major regulatory sys-
tem for sodium and chloride excretion through at least three mechanisms: alteration in renal medullary blood flow, release of renin, and direct effects on the renal tubules. Similar to the renin-angiotensin-aldosterone system, the sympathetic nervous system is activated during sodium depletion and suppressed during sodium excess (Luft et al., 1979a). With increased extracellular fluid volume, there is increased blood flow in the medulla (the inner part of the kidney), resulting in a decreased sodium concentration of the fluid delivered to the ascending limb of Henle’s loop in the renal tubule. This decrease leads to reduced sodium reabsorption of the kidney’s nephron so that more sodium is delivered to the distal tubules for excretion.
Intrarenal mechanisms are also important for sodium and chloride homeostasis. These mechanisms include locally released prostaglandins, kinins, angiotensin, endothelial relaxing factor, and other less-well defined factors.
Other Forms of Sodium
Sodium is consumed as sodium chloride (salt), sodium bicarbonate, and as sodium in a variety of forms provided in processed foods (e.g., monosodium glutamate and other food additives, such as sodium phosphate, sodium carbonate, and sodium benzoate). Still, the major form of dietary sodium is sodium chloride (Fregly, 1984; Mattes and Donnelly, 1991), which accounts for approximately 90 percent of the total sodium intake in the United States.
Sodium bicarbonate is used as an ingredient in foods. It can also be used in the treatment of metabolic acidosis because its bicarbonate component induces an increase in plasma bicarbonate concentration, the prime “metabolic” determinant of blood pH (the numerator of the Henderson-Hasselbalch equation3), with the pCO2 concentration being determined by respiration. Normally bicarbonate is the major determinant of plasma alkalinity. Although there is strong evidence that metabolic acidosis, which occurs in chronic renal insufficiency, is an important determinant of deleterious muscle and bone catabolism (Bushinsky, 1998; Mitch, 1998), sodium bicarbonate is not widely used clinically to correct such acido-
sis. This is because large volumes of sodium bicarbonate are required, leading to concern that the sodium load may induce plasma volume overload.
It might be expected that sodium chloride loading rather than sodium bicarbonate loading would substantially expand plasma volume because sodium and chloride are both distributed as osmotic agents almost restrictively within the plasma-containing extracellular fluid. In contrast, bicarbonate is distributed throughout the much larger total body water. However, in a variety of clinical circumstances, sodium bicarbonate and/or sodium citrate appear to induce an expansion of plasma volume, as judged by suppression of plasma renin activity and the plasma concentration of aldosterone (Kurtz et al., 1987; Luft et al., 1990; Schorr et al., 1996; Sharma et al., 1992) and by changes in insulin space (Van Goidsenhoven et al., 1954). Yet, in these studies, sodium loading without chloride (e.g., with sodium bicarbonate) did not raise blood pressure to the same extent as sodium chloride (Luft et al., 1990; Schorr et al., 1996).
INDICATORS CONSIDERED FOR ESTIMATING THE REQUIREMENTS FOR SODIUM AND CHLORIDE
The following section reviews the potential markers for adverse effects resulting from insufficient sodium intake in apparently healthy individuals.
Sodium Balance
When substantial sweating does not occur, total obligatory sodium losses are very small, up to 0.18 g/day or 8 mmol/day (Table 6-1) (Dahl, 1958). For this reason, in a temperate climate or even a
TABLE 6-1 Obligatory Losses of Sodium
|
|
g/d |
mmol/d |
|
Urine |
0.005–0.035 |
0.2–1.5 |
|
Skin (nonsweating) |
0.025 |
1.1 |
|
Feces |
0.010–0.125 |
0.4–5.4 |
|
Total |
0.040–0.185 |
1.7–8.0 |
|
SOURCE: Dahl (1958). |
||
tropical climate, acclimatized persons can survive on extremely low sodium intakes (Kempner, 1948; Oliver et al., 1975).
Urine and Feces
In nonsweating individuals living in a temperate climate who are in a steady-state of sodium and fluid balance, urinary sodium excretion is approximately equal to sodium intake (i.e., 90 to 95 percent of total intake is excreted in urine) (Holbrook et al., 1984; Pietinen, 1982). Obligatory urinary losses of sodium in adults are approximately 23 mg (1 mmol)/day (Dole et al., 1950). This estimated level of excretion is similar to those that have been actually measured in studies of the Yanomamo Indians in Brazil: in one study sodium excretion of 26 men averaged 23.5 ± 34.7 mg (1.02 ±1.51 mmol)/day (Oliver et al., 1975), and in a subsequent study (n = 195), urinary sodium excretion was 20.7 ± 52.9 mg (0.9 ± 2.3 mmol)/day (Rose et al., 1988).
Excretion of sodium in the stool is minimal. When sodium intakes ranged from 0.05 to 4.1 g/day of sodium, only about 0.01 to 0.125 g (0.4 to 5.4 mmol)/day appeared in the stool (Dahl, 1958; Dole et al., 1950; Henneman and Dempsey, 1956). In a sodium balance study with three levels of intake, 1.5, 4.0, and 8.0 g (66, 174, and 348 mmol)/day (Allsopp et al., 1998), fecal sodium excretion increased as sodium intake rose. Still, fecal excretion of sodium was less than 5 percent of intake even at the highest level of sodium intake (Table 6-2).
Skin and Sweat
Daily dermal losses of sodium have been reported to average less than 0.025 g (1.1 mmol)/day (Dahl, 1958; Dahl et al., 1955). In another study, estimated obligatory dermal losses of sodium ranged from 0.046 to 0.09 g (2 to 4 mmol)/day (Fregly, 1984). Sweat sodium loss depends on a number of factors, including: (1) the sweat rate, (2) sodium intake, and (3) heat acclimation (Allsopp et al., 1998). For these reasons, the sodium concentration in sweat varies widely. Most studies that measure sodium content of sweat are short-term (Table 6-3), and report sweat sodium concentrations rather than total sodium lost in sweat. Of note, in these studies intake data on dietary sodium was frequently not given. However, in the three studies where dietary sodium information was provided, dietary intakes were high (up to 8.7 g [378 mmol]/day).
TABLE 6-2 Sodium Balance at Three Levels of Sodium Intake
One study provided detailed information on sweat losses at three levels of dietary sodium intake (Allsopp et al., 1998). Men were exposed to heat in an environmental chamber at 40°C (104°F) for 10 hours/day of the last 5 days of an 8-day experimental period. Sweat sodium loss, as well as fecal and urinary sodium losses, were progressively greater across the three levels of sodium studied (1.5 g [66 mmol], 4 g [174 mmol], or 8 g [348 mmol]/day) (see Table 6-2). By the eighth day, participants on the lowest sodium level were in sodium balance. Plasma aldosterone concentrations were significantly increased during the low sodium condition and significantly decreased during the high sodium condition. Earlier studies, including a 10-day pre-post study, reported similar reductions in sodium sweat loss following exercise in the heat over time (Kirby and Convertino, 1986), as well as decreased sweat sodium concentration with heat acclimation without exercise (Allan and Wilson, 1971).
This reduction in sweat sodium concentration is a protective mechanism to minimize plasma volume loss. Conn (1949) demonstrated that healthy persons sweating 5 to 9 L/day could maintain sodium chloride balance on intakes ranging from as low as 1.9 g (83 mmol)/day to 3.2 g (139 mmol)/day of sodium chloride, the maximum intake provided.
In aggregate, available data indicate that healthy, free-living individuals can achieve sodium balance following acclimation under a variety of conditions, including low sodium intake and extreme heat.
TABLE 6-3 Sweat Sodium Concentration
|
Reference |
Study Design |
|
Adults |
|
|
Consolazio et al., 1963 |
3 men 37.8°C (100°F) 8.7 g/d sodium (378 mmol/d), 16 d |
|
Murakami and Hirayama, 1964 |
16 Japanese adults Ambient temperature No dietary information |
|
Allan and Wilson, 1971 |
3 subjects Unacclimated and acclimated, 40°C (104°F) for 1 h/d No diet information, 3 wk |
|
Kirby and Convertino, 1986 |
10 men 1–2 h postexercise, 40°C (104°F), measured at 1 and 10 d of heat acclimation 3.2–3.5 g/d (141–152 mmol/d) sodium |
|
Barr et al., 1991 |
6 subjects Moderate exercise for 6 h, 30°C (86°F); provided water or saline at 5.8 g/L (25 mmol/L) No dietary information |
|
Meyer et al., 1992 |
16 men and women 42°C (107.6°F) and 40 min cycling No dietary information, 1 d |
|
Allsopp et al., 1998 |
25 men, each on different dietary levels 25°C (77°F) for 3 d, acclimated at 40°C (104°F) for 5 d, 3 levels of sodium intake/d 1.5 g (66 mmol) (9 men) 4.0 g (174 mmol) (9 men) 8.0 g (348 mmol) (7 men), 8 d |
|
Inoue et al., 1999 |
5 men Exercise 90 min/d, 43°C (109.4°F) No dietary information, 8 d |
|
Children |
|
|
Murakmi and Hirayama, 1964 |
193 Japanese children Ambient temperature No dietary information |
|
Meyer et al., 1992 |
18 prepubescent (PP) and 17 pubescent (P) boys and girls 42°C (107.6°F) and 40 min cycling No dietary information, 1 d |
|
Sodium Concentration in Sweat, mmol/L (g/L) |
Sweat Sodium Loss, mmol/d (g/d) |
|
49–180 (1.13–4.20) |
122–265 (2.8–6.1) |
|
21–53 (0.48–1.21) |
Not determined |
|
10–58 (0.23–1.33) |
Not determined |
|
Day 1:75–100 (1.7–2.3) Day 10:40–45 (0.92–1.0) |
Not determined |
|
Water: 33 (0.76) Saline: 36 (0.83) |
Water: 156 (3.6) Saline: 176 (4.0) |
|
35–55 (0.81–1.3) |
Not determined |
|
|
50 (1.2) 78 (1.8) 105 (2.4) |
|
45–60 (1.0–1.4) |
Not determined |
|
5–55 (0.12–1.2) |
Not determined |
|
25–35 (0.58–0.80) (PP) 35–40 (0.80–0.92) (P) |
Not determined |
|
Reference |
Study Design |
|
Mao et al., 2001 |
Chinese soccer players, 16–18 yr 32–37°C (89.6–98.6°F) No dietary information, 8 d |
|
Elderly |
|
|
Inoue et al., 1999 |
9 men, 63–67 yr 90 min/d exercise, 43°C (109.4°F) No dietary information, 8 d |
Chloride Balance
Chloride losses usually accompany sodium losses. Hence conditions and diseases in which sodium is lost are likewise associated with chloride loss. Excess chloride depletion, marked by hypochloremia, results in hypochloremic metabolic alkalosis (a syndrome seen in individuals with significant vomiting), in which loss of hydrochloric acid is the primary form of chloride loss.
Much of the evidence of the effects of chloride deficiency comes from studies in the 1980s of infants who inadvertently consumed formulas that were manufactured incorrectly with low chloride content (CDC, 1979, 1980; Roy and Arant, 1979). Clinical symptoms and signs noted with the ensuing hypochloremia included growth failure, lethargy, irritability, anorexia, gastrointestinal symptoms, and weakness (Grossman et al., 1980). Some infants presented with hypokalemia, metabolic alkalosis, hematuria, hyperaldosteronism, and increased plasma renin levels (Roy, 1984). Long-term consequences to the infants of consuming the infant formulas that were inadequate in chloride have been evaluated as well (Malloy et al., 1991; Roy and Arant, 1981; Willoughby et al., 1990). Developmental screens were used to evaluate the infants (Willoughby et al., 1990), which indicated some delay in speech development. Follow-up after 9 to 10 years in the children indicated that the effects of early growth retardation had vanished and cognitive skills appeared normal, but some deficits in language skills were present in some children (Malloy et al., 1991).
Chloride deficiency is thus rarely seen given that most foods containing sodium also provide chloride, unless special medical products low in chloride are consumed.
|
Sodium Concentration in Sweat, mmol/L (g/L) |
Sweat Sodium Loss, mmol/d (g/d) |
|
55 ± 27 (1.26 ± 0.62) |
Not determined |
|
50–90 (1.2–1.9) |
Not determined |
Serum or Plasma Sodium Concentration
A number of studies have reported the concentrations of serum or plasma sodium by level of dietary sodium intake. Changes in sodium intake can influence serum or plasma levels of sodium, but the changes are relatively small and do not lead to pathological conditions, such as hyponatremia. Studies have shown that low intakes of sodium (0.15 to 0.23 g [6 to 10 mmol]/day) do not result in hyponatremia (defined as plasma sodium levels < 135 mmol/L) in healthy nonhypertensive (Kirkendall et al., 1976; Luft et al., 1979b; Overlack et al., 1995; Roos et al., 1985) or hypertensive individuals (Kempner, 1948; Mark et al., 1975). When observed, hyponatremia is often caused by excessive sodium loss from the body, which occurs with impaired renal function, increased vasopressin release, or excessive consumption of water. Diuretic use is an infrequent cause of hyponatremia. Overall, there is little evidence of any adverse effect of low dietary sodium on serum or plasma sodium concentrations in healthy individuals.
Plasma Renin Activity
Renin is released from the juxtaglomerular cells of the kidney in response to a perceived reduction in blood volume, blood pressure, or tubular sodium concentration. As a result, renin induces the production of angiotensin II, which stimulates renal sodium reabsorption via a direct tubular effect, as well as by increasing the production of aldosterone. In cross-sectional studies, plasma renin activity is inversely associated with sodium intake; the relationship appears to be curvilinear with the greatest rise in plasma renin activ-
ity occurring below a sodium intake of 2.3 g (100 mmol)/day as estimated by urinary sodium excretion (see Figure 6-1). Furthermore, in clinical trials, most of which were brief (2 weeks or less) and had small sample sizes (< 50 participants), reduced sodium intake commonly led to a rise in plasma renin activity (Table 6-4).
Meta-analyses of trials have likewise documented this relationship (Graudal et al., 1998; He and MacGregor, 2002). In a meta-analysis that only included trials lasting for 4 or more weeks and excluding those trials with extremely low sodium intakes, sodium reduction led to an average increase in plasma renin activity of 0.36 ng/mL/hour from a median value of 1.55 ng/mL/hour (He and MacGregor, 2002). In general, groups with the greatest reduction in blood pressure from a reduced sodium intake are those who concomitantly experience less of a rise in plasma renin; these groups include hypertensive individuals (He et al., 2001; Weinberger et al.,
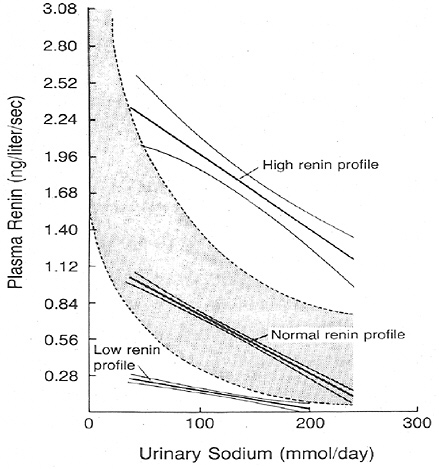
FIGURE 6-1 Association between plasma renin activity and urinary excretion of sodium in patients with hypertension. The normal range of the relation of plasma renin activity to daily urinary sodium is indicated by the shaded band. Reprinted with permission, from Alderman et al. (1991). Copyright 1991 by the Massachusetts Medical Society.
1986), African Americans (He et al., 1998; Weinberger, 1993; Weinberger et al., 1986), and older individuals, both nonhypertensive and hypertensive (Weinberger and Fineberg, 1991). In one prospective observational study, an elevated renin/sodium profile (plasma renin activity of 7.1 ng/mL/hour and urinary sodium excretion of 100 mmol/day or plasma renin activity of 5 ng/mL/hour and 200 mmol/day) was associated with a significantly higher risk for myocardial infarction in hypertensive men (Alderman et al., 1991). However, the number of events was small, just 27, and no other study has replicated these findings. In contrast, in another study of primarily nonhypertensive individuals (Meade et al., 1993), no relationship was found between plasma renin activity and the incidence of myocardial infarction or sudden death from coronary causes. In this study, there were 86 ischemic heart disease events.
Plasma renin activity has also been reported to be associated with left ventricular hypertrophy and insulin resistance (Aronow et al., 1997; Koga et al., 1998, Townsend and Zhao, 1994). A high renin profile has been associated with other cardiovascular risk factors, including elevated plasma cholesterol and triglyceride concentrations and lower high-density lipoprotein concentrations (Allikmets et al., 1996).
The clinical relevance of a rise in plasma renin activity in response to blood pressure reduction is uncertain. Plasma renin activity commonly rises in response to therapies that lower blood pressure and cardiovascular disease risk. For example, thiazide diuretic therapy commonly leads to a rise in plasma renin activity (Niarchos et al., 1984). Yet despite this rise, diuretic therapy has been repeatedly shown to prevent stroke and coronary heart disease (Psaty et al., 2003). In a meta-analysis of 42 trials that compared the effects of seven different classes of antihypertensive medications, the net effects on coronary heart disease of low-dose thiazide diuretics (which raise plasma renin activity) and angiotensin converting enzyme inhibitors (which lower plasma renin activity) were identical (relative risk of 1.0).
Some investigators have interpreted the rise in plasma renin activity from a reduced sodium intake as a deleterious response that mitigates the potential benefits of sodium reduction on blood pressure (Alderman et al., 1991). While this concern is theoretically plausible, there is insufficient evidence in support of this claim. Furthermore, in contrast to blood pressure, which is a well-accepted cardiovascular risk factor, there is no such consensus on the interpretation of plasma renin activity and its role in guiding nonpharmacological or pharmacological therapy for high blood pressure.
TABLE 6-4 Intervention Studies of the Effect of Sodium Intake on Plasma Renin Activity
|
Reference |
Study Designa |
|
Nonhypertensive individuals |
|
|
Grim et al., 1977 |
114 men and women Before and after 2 L intravenous saline infusion |
|
Luft et al., 1979b |
14 men 3-d crossover |
|
Sullivan et al., 1980 |
27 men and women 4-d crossover |
|
Zemel et al., 1986 |
16 African-American men and women 2-wk crossover |
|
Lijnen et al., 1987 |
10 men 16-wk crossover |
|
Lawton et al., 1988 |
13 men and women 6-d crossover |
|
Hargreaves et al., 1989 |
8 men 2-wk parallel |
|
Sagnella et al., 1990 |
6 men and women, low sodium intake for 4 d; sodium increased by 1.2 g/d (50 mmol/d) over a 7-d period to 8.0 g/d (350 mmol/d) 1–2 d |
|
Ruppert et al., 1991 |
98 salt-resistant men and women 7-d crossover |
|
Cappuccio et al., 1997 |
18 men and women 4-wk crossover |
|
Hypertensive individuals |
|
|
Mark et al., 1975 |
6 men with borderline HT 10-d crossover |
|
Dietary Sodium, g/d (mmol/d) |
Urinary Sodium,b g/d (mmol/d) |
Plasma Renin Activity, (ng/mL/h) |
|
3.5 (150) |
3.5 (150) |
1.7 |
|
10.5 (458) |
7.7 (335) |
0.3 |
|
0.23 (10) |
0.34 (15) |
3.9 |
|
6.9 (300) |
6.4 (278) |
0.9 |
|
13.8 (600) |
12.5 (543) |
0.6 |
|
18.4 (800) |
16.2 (706) |
0.4 |
|
27.6 (1,200) |
25.9 (1,122) |
0.2 |
|
34.5 (1,500) |
33.2 (1,443) |
0.2 |
|
0.23 (10) |
0.55 (24) |
3.3c |
|
4.6 (200) |
3.9 (170) |
0.7d |
|
1 (43) |
0.9 (42) |
1.4c |
|
4 (174) |
3.9 (170) |
0.6d |
|
Low (2 weeks) |
0.87(38) |
1.6c |
|
Low (8 weeks) |
5.8 (25) |
1.9c |
|
Regular |
3.4 (147) |
0.7d |
|
0.23 (10) |
0.29 (13) |
3.2 |
|
9.2 (400) |
7.5 (326) |
0.3 |
|
1.2 (50) |
1.1 (49) |
2.6c |
|
3.4 (150) |
3.6 (155) |
1.5d |
|
0.23 (10) |
0.28 (12) |
7.1c |
|
1.2 (50) |
0.29 (13) |
7.5c |
|
2.3 (100) |
0.62 (27) |
3.6d |
|
3.4 (150) |
2.0 (89) |
2.0d |
|
4.6 (200) |
3.9 (169) |
1.8d |
|
5.8 (250) |
6.2 (268) |
1.9d |
|
8.0 (350) |
6.8 (296) |
1.1d |
|
0.46 (20) |
0.39 (17) |
2.5 (estimated from figure) |
|
6.9 (300) |
6.7 (292) |
0.3 |
|
|
2.0 (91) |
1.5c |
|
|
3.8 (167) |
1.2d |
|
0.23 (10) |
|
7.3 |
|
9.4 (410) |
|
1.7 |
|
Reference |
Study Designa |
|
MacGregor et al., 1982a |
19 men and women with essential HT 4-wk crossover |
|
Watt et al., 1983 |
13 men and women with mild HT 4-wk crossover |
|
Resnick et al., 1985 |
12 men and women with essential HT 5-d crossover |
|
Zemel et al., 1986 |
6 African-American men and women 2-wk crossover |
|
MacGregor et al., 1989 |
20 men and women with mild HT 4-wk crossover |
|
Del Rio and Rodriguez-Villamil, 1993 |
30 men and women with essential HT 2-wk crossover |
|
Fotherby and Potter, 1993 |
17 elderly men and women with essential HT 5-wk crossover |
|
Overlack et al., 1995 |
46 men and women with essential HT 1-wk crossover |
|
Cappuccio et al., 1997 |
29 men and women 4-wk crossover |
|
a HT = hypertensive. b SS = salt sensitive, SR = salt resistant. c,d Values with different superscripts differed significantly from lowest intake levels at p < 0.05. |
|
Accordingly, contemporary guidelines have not recommended routine measurement of plasma renin activity as a means to guide selection of antihypertensive therapy (Chobanian et al., 2003). Further research is needed before plasma renin activity can be used as a marker of adequacy for sodium intake.
Elevation in Blood Pressure
While a reduced sodium intake, on average, lowers blood pressure (see later section, “Adverse Effects of Overconsumption”), the
|
Dietary Sodium, g/d (mmol/d) |
Urinary Sodium,b g/d (mmol/d) |
Plasma Renin Activity, (ng/mL/h) |
||
|
|
1.9 (86) |
|
1.7 |
|
|
3.7 (162) |
0.97 |
|||
|
1.4 (59) |
2.2 |
|||
|
3.2 (139) |
1.2 |
|||
|
0.23 (10) |
|
6.0c |
||
|
4.6 (200) |
1.8d |
|||
|
1 (43) |
0.99 (43) |
3.2 |
||
|
4 (174) |
4.9 (215) |
1.9 |
||
|
1.2 (50) |
1.1 (49) |
2.3 |
||
|
2.3 (100) |
2.4 (108) |
1.6 |
||
|
4.6 (200) |
4.4 (190) |
1.4 |
||
|
≈ 0.8 (35) |
1.1 (48) |
3.1c |
||
|
≈ 4.7 (204) |
4.6 (199) |
1.3d |
||
|
|
2.2 (95) |
1.2c |
||
|
4.0 (174) |
0.9d |
|||
|
2.2 (95) |
1.2c |
|||
|
4.0 (174) |
0.9d |
|||
|
0.46 (20) |
SS |
SR |
SS |
SR |
|
6.9 (300) |
0.55 (24) |
0.44 (19) |
1.1c |
2.8c |
|
|
6.1 (264) |
6.2 (269) |
0.1d |
0.4d |
|
2.2 (95) |
|
1.6c |
|
|
|
4.2 (182) |
1.3d |
|||
individual blood pressure response is heterogeneous (see Figures 6-2 and 6-3). Certain groups have greater (or lesser) reductions in blood pressure in response to reduced sodium intake. Those with the greatest reductions in blood pressure have been termed “salt sensitive,” while those with little or no reduction in blood pressure have been termed “salt resistant.” Some investigators have reported that blood pressure might rise in response to sodium reduction, potentially because of activation of the renin-angiotensin-aldosterone system. However, as discussed below, it is difficult to separate a true rise in blood pressure from a rise in blood pressure that occurs because of intrinsic variability in blood pressure. For

FIGURE 6-2a Distribution of blood pressure differences between two points in time when sodium intake was similar. Each 5 mm Hg bar is centered. SBP = systolic blood pressure. Reprinted with permission, from Obarzanek et al. (2003). Copyright 2003 by the American Heart Association.
FIGURE 6-2b Distribution of blood pressure differences between two points in time when sodium intake decreased by 1.8 g/d (77 mmol/d). Each 5 mm Hg bar is centered. SBP = systolic blood pressure. Reprinted with permission, from Obarzanek et al. (2003). Copyright 2003 by the American Heart Association.
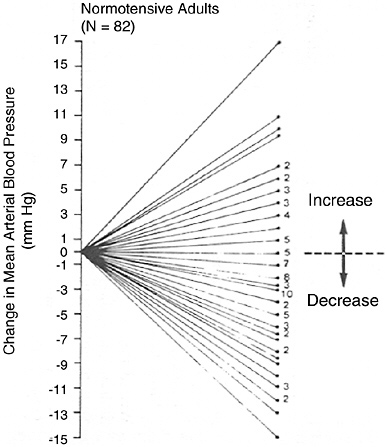
FIGURE 6-3 Mean arterial blood pressure response to dietary sodium reduction. Baseline data is average of five sitting measurements over 12 wk. Change was determined by subtracting baseline from average of six measurements obtained during diet. Reprinted with permission, from Miller et al. (1987). Copyright 1987 by Elsevier Ltd.
the same reason, it is difficult to interpret reductions in blood pressure in a given individual.
In addition to reporting average responses in groups of individuals, some trials have also reported the blood pressure responses of individual participants (Table 6-5). An apparent rise in blood pressure in some individuals when sodium intake is reduced has been interpreted as a pressor response, potentially as a result of an over-active renin-angiotensin-aldosterone system. However, an alternative explanation is that an apparent rise in blood pressure reflects intrinsic blood pressure variability or imprecision in blood pressure measurement. This phenomenon is illustrated by analyses of the Dietary Approaches to Stop Hypertension (DASH)-Sodium trial, which assessed blood pressure change across two points in
TABLE 6-5 Effect of Sodium Reduction on Blood Pressure in Studies Reporting Distribution of Blood Pressure Change in Individuals
|
Reference |
Study Designa |
Dietary Sodium g/d (mmol/d) |
|
Longworth et al., 1980 |
82 HT men, 10 d |
|
|
Miller et al., 1987 |
82 NT men and women, 30–58 yr 12 wk |
|
|
Ruppert et al., 1991 |
147 NT men and women, 19–78 yr 7-d crossover |
6.9 (300) 0.46 (20) |
|
He et al., 2001 |
39 NT and 93 HT men and women 5 d |
≈ 8.0 (350) 0.23–0.46 (10–20) |
|
Obarzanek et al., 2003 |
188 NT and HT men and women 4-wk crossover |
3.2 (141) 2.4 (106) 1.5 (64) |
|
a HT = hypertensive, NT = nonhypertensive. b BP = blood pressure, MAP = mean arterial pressure, SBP = systolic blood pressure. |
||
time, separated by at least a month, when there was no change in diet or sodium level (Figure 6-2a), as well as blood pressure change when sodium was markedly reduced (Figure 6-2b) (Obarzanek et al., 2003). In both situations, there was a wide, Gaussian distribution of blood pressure change. Furthermore, the standard deviation of the distribution of change in blood pressure was similar, 8.4 versus 8.6 mm Hg, respectively, suggesting that much of the variability in blood pressure response to a reduced sodium intake (including an apparent increase in blood pressure in some individuals) results from random factors unrelated to sodium intake. A similar distribution of blood pressure changes was likewise evident in an intervention study (Miller et al., 1987) that measured blood pressure carefully and on multiple occasions pre- and postintervention (see Figure 6-3), as well as in other trials (Ruppert et al., 1991). In such studies, reports that certain individuals experienced a rise in blood pressure (Table 6-5) must be interpreted very carefully. Nonetheless, the group of individuals whose blood pressure
|
Urinary Sodium g/d (mmol/d) |
Findingsb |
|
4.5 (197) → 1.6 (70) |
17% of outpatients and 28% of inpatients has a rise in BP of at least 5 mm Hg |
|
3.6 (157) → 1.6 (68) |
≈ 24 (29%) subjects had a rise in MAP ≈ 5 (6%) subjects had no change in MAP ≈ 53 (65%) subjects had a reduction in blood pressure |
|
≈ 6.6 (288) → ≈ 0.39 (17) |
25 (17%) subjects had a rise in MAP |
|
≈ 6.9 (300) → ≈ 0.48 (21) |
≈ 18/39 (46%) NT subjects had a rise in MAP ≈ 9/93 (10%) HT subjects had a rise in MAP |
|
3.2 (140) → 1.4 (62) |
55% had SBP decrease ≥ 5 mm Hg 6% had SBP increase ≥ 5 mm Hg |
apparently rises likely differs, on average, from the group of individuals whose blood pressure falls. Specifically, those individuals with an apparent rise in blood pressure experience a greater activation of the renin-angiotensin-aldosterone axis than those whose blood pressure falls (Egan et al., 1994; Weinberger et al., 1993a).
Ruppert and colleagues (1991) reported that while a rise in plasma renin activity and aldosterone concentration were observed in all subjects placed on a reduced sodium diet, the largest increases were observed in those whose blood pressure increased. Those who have the greatest reduction in blood pressure as a result of a reduced sodium intake appear to have a less responsive renin-angiotensin-aldosterone system (Cappuccio et al. 1997; He et al., 1998, 2001; Weinberger et al., 1993a).
Given the above considerations, an apparent rise in blood pressure in response to a reduced sodium intake cannot be used as an indicator of adequate sodium intake.
Blood Lipid Concentrations
Several trials have examined the effects of reduced sodium intake on blood lipid concentrations. Most trials tested the effects of an extremely low intake of sodium, typically 0.46 to 0.69 g (20 to 30 mmol)/day (see Table 6-6). For instance, when 15 healthy men were given a low salt diet of 0.46 g (20 mmol)/day of sodium for 3 weeks, total and low density lipoprotein (LDL) cholesterol concentrations increased by approximately 9 and 12 percent, respectively (Sharma et al., 1990).
Some of these effects have been attributed to a reduced plasma volume because rises in hematocrit, total protein, and albumin concentrations have been noted (Weder and Egan, 1991). However, increases in serum total and LDL cholesterol and triglyceride concentrations persist even after adjustment for changes in hematocrit (Ruppert et al., 1994). A meta-analysis documented statistically significant increases in total and LDL cholesterol concentrations in response to the typically extreme reductions in sodium tested in 13 of the 19 trials (Graudal et al., 1998). A subsequent meta-analysis that focused on trials of “modest” sodium reduction (an average of 1.7 g [75 mmol]/day) did not find significant changes in total, LDL, or high density lipoprotein (HDL) cholesterol concentrations (He and MacGregor, 2002). In the only available trial with three levels of sodium intake—1.1 g (50 mmol)/day, 2.3 g (100 mmol)/day, and 3.4 g (150 mmol)/day—there were no significant changes in fasting blood lipid concentrations by sodium level in either a typical American diet (higher in fat) or the DASH diet (lower in fat) (Harsha et al., 2004). This trial was a controlled, isocaloric feeding study.
Insulin Resistance
A possible adverse effect of reduced sodium intake on insulin resistance has been postulated, potentially as a result of increased sympathetic nervous system activity. It has also been hypothesized that this phenomenon might be more prevalent in certain subgroups—those individuals who experience little or no reduction in blood pressure from a reduced sodium intake (salt-resistant individuals) (Egan and Stepniakowski, 1997).
Empirical evidence on this topic is sparse. A few predominantly small trials have evaluated the effects of reduced sodium intake on insulin resistance and glucose intolerance (see Table 6-7). Several of these trials tested the effects of extremely low sodium intakes
(< 0.7 g [30 mmol]/day). None used a glycemic clamp or minimal model technique to assess insulin sensitivity. In a crossover trial with one-week periods, a sodium intake of 0.46 g (20 mmol)/day, when compared with an intake of 4.8 g (208 mmol)/day increased fasting plasma insulin concentrations and thus decreased the glucose: insulin ratio (Weder and Egan, 1991). In another study with 147 nonhypertensive individuals, a sodium intake of 0.46 g (20 mmol)/ day increased serum insulin, but had no effect on serum glucose concentrations compared with an intake of 6.9 g (300 mmol)/day (Ruppert et al., 1991). In a crossover trial with 13 participants, a sodium intake of 0.46 g (20 mmol)/day increased vascular insulin resistance compared with an intake close to 5.5 g (240 mmol)/day (Feldman et al., 1996). These limited data suggest that an extremely low intake of sodium may, in the short-term, be associated with insulin resistance.
Likewise, few studies have examined the effects of sodium intakes at or above 1.2 g (50 mmol)/day. In a randomized crossover study with 34 participants (Grey et al., 1996), there were no significant differences in the glucose:insulin ratio or insulin sensitivity at a sodium intake of 1.2 g (52 mmol)/day and 4.2 g (185 mmol)/day. Two other smaller trials (Boero et al., 2000; Schorr et al., 1996) reported no effects of sodium reduction on measures of insulin resistance from sodium reduction. In contrast, in a crossover study of eight individuals, sodium reduction to 1.7 g (75 mmol)/day from 5.4 g (235 mmol)/day resulted in systemic insulin resistance as assessed by fasting glucose:insulin ratio (Feldman and Schmidt, 1999). In another trial, the total glycemic response to an oral glucose tolerance test was 8 percent lower on the higher of the two sodium intakes (6.1 versus 3.1 g [267 vs. 135 mmol]/day) (Ames et al., 2001).
Overall, available evidence on the effects of sodium reduction on insulin resistance is sparse and inconsistent. Longer-term studies at relevant sodium intakes are needed to assess the effects of sodium intake on insulin resistance.
FACTORS AFFECTING SODIUM AND CHLORIDE REQUIREMENTS
Physical Activity and Temperature
Physical activity can potentially affect sodium chloride balance, mostly from increased losses in sweat. Individuals who exercise
TABLE 6-6 Effect of Sodium Reduction on Blood Cholesterol Concentrations in Order of Increasing Duration of Intervention
|
Sodium Intake or Urinary Sodium g/d (mmol/d) |
Cholesterol Concentration (mmol/L)a |
||
|
300 → 20 |
Total and LDL cholesterol greater in counter-regulators with sodium reduction |
||
|
185 vs. 52 |
No difference in total or LDL cholesterol |
||
|
220 → 20 |
Total cholesterol 4.26 → 4.52b LDL cholesterol 2.86 → 3.13b HDL cholesterol 0.89 → 0.85 |
||
|
105 vs. 175 |
No difference in total, LDL, or HDL cholesterol |
||
|
171 → 34 |
Total cholesterol 5.8 → 6.5b LDL cholesterol 1.46 → 1.7b |
||
|
199 → 48 |
Total cholesterol 5.53 → 5.78 HDL cholesterol 1.24 → 1.17b |
||
|
1.2 (50) 5.8 (250) |
No significant differences in total and HDL cholesterol |
||
|
1.3 (57) |
4.8 |
|
|
|
2.9 (129) |
4.8 |
||
|
143 → 102 |
No significant difference in the serum HDL/total cholesterol ratio |
||
|
DASH Diet |
|
||
|
(n = 197) |
TC |
LDL |
HDL |
|
1.5 (65) |
191 |
124 |
45 |
|
2.4 (106) |
189 |
123 |
45 |
|
3.3 (143) |
191 |
123 |
45 |
|
Control Diet |
|
||
|
(n = 193) |
TC |
LDL |
HDL |
|
1.5 (65) |
208 |
138 |
48 |
|
2.4 (106) |
206 |
135 |
48 |
|
3.3 (143) |
207 |
136 |
49 |
TABLE 6-7 Effect of Sodium Reduction on Glucose Intolerance
|
Reference |
Study Designa |
Sodium Intake g/d (mmol/d) |
|
Ruppert et al., 1991 |
147 NT men and women, 19–78 yr |
|
|
|
7-d crossover |
0.46 (20) 6.9 (300) |
|
Weder and Egan, 1991 |
9 NT and 18 HT men, 23–55 yr |
|
|
|
7-d crossover |
0.46 (20) 4.8 (208) |
|
Feldman et al., 1996 |
5 NT and 8 HT men |
|
|
|
1-wk crossover |
0.46 (20) 5.5 (240) |
|
Grey et al., 1996 |
34 NT men |
|
|
|
1-wk crossover |
|
|
|
1.2 (52) |
|
|
4.2 (185) |
||
|
Schorr et al., 1996 |
21 NT men and women |
2.4 (105) vs. |
|
|
4-wk crossover |
4.0 (175) |
|
Feldman and Schmidt, 1999 |
8 NT men, 25–40 yr |
|
|
|
1-wk crossover |
1.7 (75) 5.4 (235) |
|
Boero et al., 2000 |
13 HT men and women, 21–64 yr |
5.8 (250) 1.2 (50) |
|
|
2-wk crossover |
|
|
Ames et al., 2001 |
21 HT men and women |
3.1 (135) |
|
|
4-wk crossover |
6.1 (267) |
|
a NT = nonhypertensive, HT = hypertensive. b SS = salt sensitive, Hb = hemoglobin, AUC = area under the curve. c Significantly different. |
||
strenuously in the heat on a daily basis can lose substantial amounts of sodium. The loss of sodium in sweat is dependent on a number of factors, including overall diet, sodium intake, sweating rate, hydration status, and degree of acclimatization to the heat (Allan and Wilson, 1971; Allsopp et al., 1998; Brouns, 1991). The amount of sodium lost in sweat is less in those acclimatized to the heat than in
|
Findingsb |
||
|
Insulin (µU/mL) (SS) |
||
|
10.4c |
|
|
|
7.9c |
||
|
No difference in glucose concentration |
||
|
Insulin (µU/mL) |
Glucose (mg/dL) |
Glucose/Insulin Ratio (mIU/mmol) |
|
14.5c |
95.9 |
7.8c |
|
11.5 |
96.6 |
10.9c |
|
Plasma glucose (mmol/L) |
Glycated Hb (%) |
Vascular sensitivity to insulin reduced when fed low salt diet |
|
4.9–5.2 |
3.9–4.8 |
|
|
4.6–5.2 |
4.0–4.9 |
|
|
Plasma glucose (mmol/L) |
|
Glucose/insulin ratio (mIU/mmol) |
|
4.85 |
1.5 |
|
|
4.85 |
1.4 |
|
|
No significant difference in the AUC for glucose or insulin |
||
|
|
Glucose/insulin ratio (mIU/mmol) |
|
|
0.6c |
||
|
1.2c |
||
|
No significant differences in serum glucose concentration |
||
|
Glycemic response on a glucose tolerance test was 8.0% lower during sodium supplementation; p < 0.001 |
||
those who are not (Sawka and Montain, 2000). Sodium sweat loss was reported to be significantly greater when subjects performed a running exercise than when the subjects sat in a climatic chamber at 40°C (104°F) (123.1 ± 33.6 mmol [2.8 ± 0.8 g]/L versus 84.3 ± 31.5 mmol [1.9 ± 0.7 g]/L, respectively) (Fukumoto et al., 1988). Exposure to heat without exercise, however, also alters sweat so-
dium concentration. Overall, sweat sodium concentration averages about 35 mmol/L, with a range from 10 to 70 mmol/L (Sawka and Montain, 2000; Verde et al., 1982).
In a classical study, Consolazio and colleagues (1963) assessed the sweat sodium losses of three healthy young men who were exposed to 37.8°C (100°F) heat for 7.5 hours/day for 16 days. Average sweat sodium losses fell from 487 mmol (11.2 g)/day (day 1) to 71 mmol (1.64 g)/day (day 11). Due to the individual variation of sweat sodium losses, there was not a concomitant decrease from day 1 to day 16; however, there was a decline in sweat loss over time, demonstrating that acclimation that occurred over a short period of time.
The joint effects on sodium loss of physical activity (or temperature) with dietary sodium intake has received little attention. Only one experimental study in Table 6-3 (Allsopp et al., 1998) reported sodium sweat loss in men given one of three different sodium intakes, all of whom were exposed to heat. Sodium sweat loss fell in those on the lowest sodium intake level (1.5 g [66 mmol]/day), and sodium balance was achieved.
Despite the dearth of empirical studies, there is little reason to expect that a reduced sodium intake would affect the ability to perform physical activity. Several isolated, physically active populations have extremely low intakes of sodium (Oliver et al., 1975; Rose et al., 1988).
Effects of Nutrients on Urinary Losses of Sodium
Potassium
Administration of potassium salts has been shown to increase urinary sodium excretion (for review, see Liddle and coworkers, 1953). In normal human volunteers studied under controlled metabolic conditions, both potassium bicarbonate and potassium chloride have demonstrated substantial and comparable effects on increasing urinary sodium excretion (van Buren et al., 1992), at least acutely until equilibration is reached. At a new steady state, sodium intake and excretion become equivalent. Animal experiments suggest that potassium may inhibit sodium reabsorption in the distal tubule of the kidney (Brunette et al., 1992; Vander, 1970; Young et al., 1976). By reducing extracellular volume and plasma volume, this effect is generally considered to be an important component of the antihypertensive effect of potassium, particularly in patients with hypertension.
While some studies have shown increased urinary sodium excretion with increased potassium intakes (Barden et al., 1991; Gu et al., 2001; Krishna et al., 1989; MacGregor et al., 1982b; Matlou et al., 1986; Smith et al., 1992), other studies have not shown a significant effect with potassium supplementation of up to 4.7 g (120 mmol)/ day on urinary sodium excretion (Barden et al., 1986; Brancati et al., 1996; Fotherby and Potter, 1992; Lawton et al., 1990; Overlack et al., 1991; Sacks et al., 2001; Whelton et al., 1995). These studies that have not documented an effect of high potassium intake on sodium excretion may not have measured urinary loss at the appropriate period. The absence of an effect after a new equilibrium was achieved would not preclude an early effect of increased potassium intake.
Calcium
A substantial body of evidence has documented that higher intakes of sodium result in increased urinary excretion of calcium (Breslau et al., 1982; Castenmiller et al., 1985; McCarron et al., 1981). Data on the effect of calcium intake on sodium excretion, however, are limited. When placed for one week each on a low calcium (200 mg/day) diet or a high calcium (1,800 mg/day) diet, there was no difference in the urinary excretion of sodium (Cappuccio et al., 1986). A similar lack of effect of calcium supplementation on urinary sodium excretion was seen over a longer (8 week) period in a crossover trial in which 1.5 g/day of supplemental calcium was compared with a placebo in 46 nonhypertensive and hypertensive subjects (Weinberger et al., 1993b).
Diuretics
Diuretics increase the urinary excretion of water, sodium, and chloride. As a result, hyponatremia and hypochloremia have been observed with the use of diuretics (Gross et al., 1988; Oles and Denham, 1984; Orinius, 1984). In some individuals, typically older white women, severe hyponatremia has been reported as an idiosyncratic response to thiazide-type diuretics (which act on the proximal tubule). This appears to be a consequence of impaired water excretion rather than excessive sodium loss since it can be corrected by water restriction. The hyponatremic affect of thiazide-type diuretics is often observed with the concomitant use of other medications (e.g., furosemide, chlorpropramide, carbamazepine) (Kalksma and Leemhuis, 2002).
Cystic Fibrosis
Cystic fibrosis (CF) is a relatively common genetic disorder in which the body produces abnormally thick and viscous mucus due to the faulty membrane transport of sodium chloride. Several organs, particularly the lungs and pancreas, are affected. As a result, the sodium and chloride content of sweat is very high. In one study, mean sweat sodium or chloride concentrations of CF patients was 104 ± 26 mmol/L compared with 16 ± 7 mmol/L in healthy persons (Pillion and Meezan, 1985). In another study, concentrations ranged from 60 to 150 mmol/L for CF patients while the range was 9 to 72 mmol/L for healthy individuals (Carter et al., 1984). Although the increased amount of sodium and chloride required is unknown in CF patients, the requirement is higher for those CF patients who exercise and therefore have additional losses via sweat (Kriemler et al., 1999).
Diabetes
Diabetes is associated with hyperglycemia and glycosuria when the renal threshold for glucose reabsorption is exceeded. The osmotic effect of glucose on the renal tubule is associated with a passive increase in the renal excretion of sodium and water. In acute situations, when the hyperglycemia is marked (e.g., diabetic ketoacidosis), volume depletion, hypotension, and hyponatremia may occur. This is generally corrected by the intravenous administration of sodium chloride and water, as well as insulin, to reduce the elevated blood glucose levels. While there is some evidence that an extremely reduced sodium intake to 0.46 g (20 mmol)/day can decrease insulin sensitivity, there is little evidence of the adverse effects of sodium reduction to levels of ≈ 1.2 g (50 mmol)/day in nondiabetic populations (Table 6-7). In trials of sodium reduction in diabetics, there was no evidence of a deterioration in glucose control (Dodson et al., 1989; Mulhauser et al., 1996); however, the number of trials was small, as was their sample size.
High blood pressure and blood pressure-related cardiovascular disease are common in individuals with diabetes. As described subsequently, available evidence indicates that diabetics are a salt-sensitive group of the population. Still, sodium reduction would not be beneficial in some individuals with diabetes. Some oral hypoglycemic medications (e.g., chlorpropramide) used for diabetes have been associated with hyponatremia, presumably related to increased free water reabsorption rather than excessive renal so-
dium loss (Gardenswartz and Berl, 1981). In some elderly individuals with diabetes, hyporeninemic hypoaldosteronism may increase renal sodium loss (Schambelan et al., 1972). These individuals are usually identifiable by elevated serum potassium concentrations.
FINDINGS BY LIFE STAGE AND GENDER GROUP
Infants Ages 0 Through 12 Months
Sodium
There has been limited research on sodium requirements for normal growth and development in humans. Growth failure has been recognized in young children with salt-wasting disorders, such as isolated hypoaldosteronism (Rosler, 1984), thus linking the need for adequate sodium in early life to normal growth. The addition of sodium to infant formula and its presence in commercially processed weaning foods has been the focus of debate since the 1970s. Issues debated have been the extent to which sodium is required in infancy for normal growth and the possibility that adult hypertension results from excess sodium intake during early years (Dahl, 1968; de Wardener and MacGregor, 1980). However, while animal studies indicate that sodium is required in normal growth of neonatal rats (Fine et al., 1987; Orent-Keiles and McCollum, 1940) and pigs (Alcantara et al., 1980), no studies were found that evaluated the effects of varying intakes of sodium on growth or other effects in normal, full-term human infants.
For preterm human infants, the few available studies indicate that sodium is indeed required for normal growth (Al-Dahhan et al., 1984; Bower et al., 1988; Chance et al., 1977). Two of these studies were conducted primarily in preterm infants (Al-Dahhan et al., 1984; Chance et al., 1977), while the other was among early and preterm infants with ileostomies (Bower et al., 1988).
When preterm infants born before 34 weeks gestation were given 92 to 115 mg of sodium per kg/day from 4 to 14 days postpartum, there was improved weight gain compared with infants who received 23 to 34 mg/kg/day of sodium (Al-Dahhan et al., 1984). When very-low-birth-weight premature infants were supplemented with sodium, weight gain was increased in a second study (Chance et al., 1977). Measurement of body water space and dynamic skinfold thickness indicated that the weight gain was partially due to water retention, with the remaining due to increases in lean body mass.
Sodium balance and growth was studied in 11 infants born fol-
lowing 25 to 38 weeks gestation and who subsequently had ileostomies due to necrotizing enterocolitis or meconium ileus (Bower et al., 1988). Ileostomy outputs of the 11 infants ranged from 10 to 58 mL/kg/day. Despite the provision of adequate energy and protein intake, growth failure was seen in 6 of 11 infants whose weights ranged from 1.1 to 3.0 kg; however, growth failure was corrected when the sodium content of the formula (which provided on average 46 mg [2 mmol]/kg/day) was increased to provide approximately 90 to 180 mg (4 to 8 mmol)/kg/day of sodium. Urinary sodium excretion associated with weight gain in those supplemented was episodically 10 mmol (230 mg)/L or more. No infant with a urinary sodium concentration consistently greater than 10 mmol/ L had growth impairment in spite of all infants demonstrating metabolic acidosis, thought to be due to the loss of bicarbonate in the ileostomy fluid. Some of the infants also exhibited hyperchloremia, which was corrected with the use of supplemental sodium bicarbonate.
Given that the renal tubules of preterm infants are not mature until near gestational term, causing them to have significant urinary losses of sodium, it is quite possible that the sodium needs of pre-term infants related to growth differ from that of full-term infants. Hence the quantitative impact of sodium intake on growth in healthy, full-term infants cannot be ascertained from the available literature described above.
It has been suggested that changes in extracellular fluid volume in infants in response to sodium intake could be a measure of adequacy of sodium, and possibly excess as well (Bernstein et al., 1990). One study evaluated three groups of full-term infants (> 2.5 kg, born > 37 weeks’ gestation) at 6 weeks. One group had been exclusively fed human milk (n = 43 infants), a second group was fed a lower sodium formula (arbitrarily determined to be < 231 mg [10 mmol]/L) (n = 42 infants), and a third group was fed a higher sodium formula (all those above the cutoff of 231 mg [10 mmol]/L) (n = 39 infants). In this study, there were no measurable differences in extracellular fluid as measured by dynamic skinfold thickness or in blood pressure in the three groups.
Animal studies, however, have shown effects of inadequate sodium intake on extracellular fluid expansion and growth. When pair-fed young rats were fed varying levels of sodium postweaning, the estimated requirement was about 6.9 mg (0.3 mmol) of sodium per day, or 0.06 mmol/g of new tissue (Fine et al., 1987). Lower intake levels resulted in a dose-related slowed growth associated with reduced extracellular fluid volume, while plasma concentrations of
sodium, potassium, and chloride remained normal. Decreased body fat, bone, and muscle mass were seen, along with decreased protein deposition in the sodium-deficient animals. The authors concluded that dietary sodium was required in sufficient quantities to permit normal expansion of the extracellular fluid volume that accompanies tissue growth.
Chloride
As stated earlier, chloride requirements are generally met due to the presence of sodium chloride in processed foods and infant formula. However, out of concern for the possible long-term consequences relative to chronic disease, manufacturers no longer add salt to infant formula at levels above that found in human milk, nor is salt added to weaning foods in the United States or Canada beyond that necessary for processing (FDA, 1985; Health Canada, 2003).
Chloride losses can be substantial in infants, and, while rare, usually occur secondary to diarrhea or vomiting as a result of infection or mechanical obstruction, such as pyloric stenosis in infancy (which results in vomiting), or continuous gastric suction with resulting metabolic alkalosis. Bartter’s Syndrome, a familial autosomal recessive disease characterized by chronic diarrhea and defective chloride reabsorption, also results in hypochloremia, as can renal tubular disorders and cystic fibrosis in which high rates of sweating and resulting loss of chloride in the perspiration cause inordinate loss of chloride (Bartter et al., 1962). In these cases, the loss of chloride is greater than the loss of cations such as sodium, resulting in a hypochloremia without hyponatremia. In response, the extra-cellular fluid (ECF) is decreased, and the metabolic alkalosis results in increased urinary potassium excretion.
Most of the knowledge of chloride deficiency in normal infants comes from reports of 141 infants less than 12 months old who were inadvertently fed infant formulas that were chloride deficient (< 180 mg [5 mmol]/L of chloride). Their symptoms included failure to thrive, weakness, anorexia, and some possible delayed development (Malloy et al., 1991).
Evidence Considered in Setting the AI
In infants there are no functional criteria in use that reflect a response to varying levels of dietary intake of sodium or chloride; thus it is not possible to derive an estimated average requirement
(EAR) for this age group for either nutrient. Following precedents set for other nutrients (see Chapter 1), recommended intakes of sodium and chloride are thus based on an Adequate Intake (AI) that reflects a calculated mean intake of infants principally fed human milk (0 through 6 months of age), or a combination of human milk and complementary foods (7 through 12 months of age).
Ages 0 Through 6 Months. Using the method described in Chapter 2, the AI for sodium during ages 0 through 6 months is based on the average amount of sodium in human milk that is consumed by this age group. A mean intake 0.12 g (5.2 mmol)/day of sodium is estimated based on the average volume of milk intake of 0.78 L/day (see Chapter 2) and an average concentration of sodium in human milk of 0.16 g/L (7.0 mmol/L) produced during the first 6 months of lactation. This mean concentration of sodium in human milk was calculated using a simple average of the sodium concentration values analyzed in human milk and found in Table 6-8. Chloride is assumed to be adequate in equimolar amounts: 5.2 mmol of chloride is equivalent to 0.18 g of chloride.
Ages 7 Through 12 Months. The AI for sodium for older infants is determined by estimating the sodium intake from human milk (sodium concentration × 0.6 L/day) and from complementary foods (Chapter 2). Sodium intake data (n = 51) from complementary foods are estimated to be 0.29 g (13 mmol)/day based on data from the 1994–1996, 1998 Continuing Survey of Food Intakes of Individuals (CSFII) (see Appendix Table E-5). While data were sparse related to the sodium content of human milk produced by lactating women over 3 months postpartum, in all studies examined there was a decline in the sodium content compared with earlier stages of lactation. Thus the average sodium concentration in human milk was obtained from those values of sodium content available from lactation at 20 weeks or longer, resulting in an average sodium concentration of 0.13 g/L (5.6 mmol/L) for months 7 through 12 (Table 6-8).
Assuming an average volume consumed of 0.6 L/day for this age group (Chapter 2), the sodium intake from human milk during the second 6 months is approximately 0.08 g (3.5 mmol)/day (0.13 g/L × 0.6 L)/day. Thus, the total sodium intake, which includes the amount from complementary foods, is approximately 0.37 g (16 mmol)/day (0.29 g + 0.08 g/day). Chloride is assumed to be adequate in equimolar amounts: 16 mmol of chloride is equivalent to 0.57 g of chloride.
TABLE 6-8 Sodium Content of Human Milk
|
References |
Study |
Stage of Lactationa |
Sodium Concentration (g/L)b |
|
Gross et al., 1980 |
18 women |
1 mo pp |
0.20 |
|
Picciano et al., 1981 |
26 women |
1 mo pp |
0.15 |
|
|
2 mo pp |
0.12 |
|
|
3 mo pp |
0.13 |
||
|
Keenan et al., 1982 |
14 women |
3.5–6 wk pp |
0.18 |
|
|
14 women |
8.5–18 wk pp |
0.11 |
|
12 women |
20–32 wk pp |
0.12 |
|
|
Lemons et al., 1982 |
7 women |
1 mo pp |
0.16 |
|
|
13 women |
1.5 mo pp |
0.20 (preterm) |
|
9 women |
> 2 mo pp |
0.16 (preterm) |
|
|
Dewey and Lonnerdal, 1983 |
20 women |
1 mo pp |
0.23 |
|
|
2 mo pp |
0.26 |
|
|
3 mo pp |
0.18 |
||
|
4 mo pp |
0.18 |
||
|
5 mo pp |
0.17 |
||
|
6 mo pp |
0.13 |
||
|
Morriss et al., 1986 |
52 women |
3 wk pp |
0.17 |
|
|
5 mo pp |
0.11 |
|
|
a pp = postpartum. b Bold values also used in determining sodium concentration for months 7 through 12. |
|||
Sodium and Chloride AI Summary, Ages 0 Through 12 Months
|
AI for Sodium for Infants |
|
|
0–6 months |
0.12 g (5 mmol)/day of sodium |
|
7–12 months |
0.37 g (16 mmol)/day of sodium |
|
AI for Chloride for Infants |
|
|
0–6 months |
0.18 g (5 mmol)/day of chloride |
|
7–12 months |
0.57 g (16 mmol)/day of chloride |
Infant Formula
Current regulations for infant formulas are a minimum of 20 mg/100 kcal (≈ 0.14 g [5.9 mmol]/L for sodium content based on 676 kcal/L) to a maximum sodium content of 60 mg/100 kcal (0.40 g
[17.6 mmol]/L based on 676 kcal/L). The current regulation for chloride content for infant formula is a minimum 55 mg/100 kcal (≈ 0.37 g [10.4 mmol]/L based on 676 kcal/L) to a maximum 150 mg/100 kcal (≈ 1.0 g [28.6 mmol]/L based on 676 kcal/L) (FDA, 1985).
Children and Adolescents Ages 1 Through 18 Years
There is no reason to expect that the sodium requirements of children ages 1 through 18 years would be fundamentally different than that of adults given that maturation of kidneys is similar in normal children by age 12 months of age (Seikaly and Arant, 1992). Thus even young children have the ability to conserve sodium in the face of low levels of dietary sodium.
Evidence Considered in Setting the AI
As for adults, an EAR could not be established because of inadequate data from dose-response studies. Hence an AI was set. Given that little data are available indicating that in normal children, inadequate sodium intakes result in specific identifiable markers, and that, as with adults, normal kidney function can maintain sodium balance at extremes of sodium intake, the AI is set based on meeting nutrient needs for other essential nutrients. The AI is thus extrapolated down from the adult AI of 1.5 g/day (65 mmol/day) using relative energy intake, that is, the average of median energy intake levels of the age groups for adults and for children as the basis for extrapolation (see Chapter 2). Relative energy levels are chosen as the method of extrapolation because the AI for adults is based on an intake of sodium from foods found in the Western diet, which allows for consumption of an adequate diet for other required nutrients.
Based on data from the CFSII, the median energy intake for 1- to 3- and 4- to 8-year-old children in the United States was estimated to be 1,372 and 1,757 kcal/day, respectively (IOM, 2002). Median energy intakes for preadolescent (9 to 13 years) and adolescent (14 to 18 years) boys and girls ranged from 1,877 to 2,226 and 1,872 to 2,758 kcal/day, respectively, and thus were near or within the adult range (1,727 to 2,718 kcal/day). Therefore, their AI is the same as that for adults.
Given the estimated adult median intake value of approximately 2,150 kcal, the value for children 1 to 3 years of age is 1.0 g (42 mmol)/day (1,372 kcal ÷ 2,150 kcal × 1.5 g/day) after rounding.
For children 4 to 8 years of age it is 1.2 g (53 mmol)/day (1,757 kcal ÷ 2,150 kcal × 1.5 g/day) after rounding. Chloride is assumed to be adequate in equimolar amounts to sodium; thus the AI for chloride for children 1 to 3 years of age is 1.5 g (42 mmol)/day and for 4 to 8 years of age is 1.9 g (53 mmol)/day.
Sodium and Chloride AI Summary, Ages 1 Through 18 Years
|
AI for Sodium for Children |
|
|
1–3 years |
1.0 g (42 mmol)/day of sodium |
|
4–8 years |
1.2 g (53 mmol)/day of sodium |
|
AI for Sodium for Boys |
|
|
9–13 years |
1.5 g (65 mmol)/day of sodium |
|
14–18 years |
1.5 g (65 mmol)/day of sodium |
|
AI for Sodium for Girls |
|
|
9–13 years |
1.5 g (65 mmol)/day of sodium |
|
14–18 years |
1.5 g (65 mmol)/day of sodium |
|
AI for Chloride for Children |
|
|
1–3 years |
1.5 g (42 mmol)/day of chloride |
|
4–8 years |
1.9 g (53 mmol)/day of chloride |
|
AI for Chloride for Boys |
|
|
9–13 years |
2.3 g (65 mmol)/day of chloride |
|
14–18 years |
2.3 g (65 mmol)/day of chloride |
|
AI for Chloride for Girls |
|
|
9–13 years |
2.3 g (65 mmol)/day of chloride |
|
14–18 years |
2.3 g (65 mmol)/day of chloride |
Adults Ages 19 Through 50 Years
Evidence Considered in Setting the AI
Data are inadequate to set an estimated average requirement (EAR), which requires an indicator of adequacy evaluated at multiple levels of intake, and an assessment of the level at which approximately half of the individuals in the life stage group would demonstrate inadequacy for that indicator. However, available evidence supports an AI of 1.5 g (65 mmol)/day for apparently healthy adults.
First, a diet that provided an average of approximately 1.5 g
(65 mmol)/day of sodium can meet recommended intakes for other nutrients (see Table 6-9) (Craddick et al., 2003; Karanja et al., 1999). The second and third columns of Table 6-9 display the nutrient profiles of two Western-type diets tested in the Dietary Approaches to Stop Hypertension (DASH)-Sodium trial (Sacks et al., 2001): a typical American (control) diet and the DASH diet. Both provided an average sodium intake of approximately 1.5 g (65 mmol)/day (as estimated by mean urinary sodium excretion), while the fourth column provides the current recommended intake for the nutrients listed.
Second, the AI of 1.5 g (65 mmol)/day exceeds the levels of sodium intake (typically < 0.7 g [30 mmol]) that have been associated in some studies with adverse effects on blood lipid concentrations and insulin resistance (Tables 6-6 and 6-7).
Third, this level allows for excess sodium loss in sweat by unacclimatized persons who are exposed to high temperatures or who are moderately physically active. As noted previously, Allsopp and coworkers (1998) documented that heat acclimated persons consuming 1.5 g (66 mmol)/day of sodium achieved sodium balance after 5 days while being exposed to 40°C (104°F) for 10 hours/day (Table 6-2). Extrapolations from this data suggest that on the first day of heat exposure, prior to acclimation, these individuals would have achieved sodium balance if their exposure to 40°C (104°F) heat lasted no more than 6 hours. Specifically, on average, 4.5 mmol (0.1 g) of sodium per hour was lost in sweat during heat exposure prior to acclimation. After 5 days of acclimation, average sodium sweat losses dropped to 2.1 mmol (0.05 g)/hour.
In summary, the AI is set at 1.5 g (65 mmol)/day of sodium for both young men and women based on meeting sodium needs of apparently healthy individuals, as well as that of other important nutrients using foods found in a Western-type diet. It is assumed these individuals are moderately active in temperate climates. This level of sodium is equivalent to 3.8 g/day of sodium chloride, which would also provide 2.3 g (65 mmol) of chloride. This AI does not apply to highly active individuals such as competitive athletes and workers exposed to extreme heat stress because of increased loss of sodium via sweat (see later section, “Special Considerations”).
Sodium and Chloride AI Summary, Ages 19 Through 50 Years
|
AI for Sodium for Men |
|
|
19–30 years |
1.5 g (65 mmol)/day of sodium |
|
31–50 years |
1.5 g (65 mmol)/day of sodium |
TABLE 6-9 Calculated Nutrient Profiles of the Dietary Approaches to Stop Hypertension (DASH) and Typical American (Control) Diets at the Lower Sodium Intake in the DASH-Sodium Triala
|
Nutrientb |
DASH Diet |
Typical American Diet |
RDA or AI*c |
|
Protein, g |
94.3 |
74.5 |
56 |
|
Protein, % kcal |
18.0 |
14.3 |
10–35 |
|
Carbohydrate, g |
306 |
256 |
130 |
|
Carbohydrate, % kcal |
58.5 |
49.0 |
45–65 |
|
Total fat, g |
63.1 |
87.1 |
— |
|
Total fat, % kcal |
27.2 |
37.6 |
20–35 |
|
Saturated fat, g |
14.4 |
35.7 |
— |
|
Saturated fat, % kcal |
6.2 |
15.4 |
ALAPd |
|
Monounsaturated fat, g |
25.9 |
28.5 |
— |
|
Monounsaturated fat, % kcal |
11.2 |
12.3 |
— |
|
Polyunsaturated fat, g |
18.1 |
16.4 |
18.6*e |
|
Polyunsaturated fat, % kcal |
7.8 |
7.1 |
5.5–11f |
|
Cholesterol, mg |
128 |
272 |
ALAP |
|
Total dietary fiber, g |
29.9 |
10.8 |
29.4*g |
|
Potassium, g |
4.5 |
1.7 |
4.7* |
|
Magnesium, g |
0.50 |
0.17 |
0.32 |
|
Calcium, g |
1,260 |
453 |
1,000* |
|
Zinc, mg |
12.1 |
7.7 |
11 |
|
Thiamin, mg |
1.7 |
1.4 |
1.2 |
|
Riboflavin, mg |
2.1 |
1.4 |
1.3 |
|
Niacin, mg |
24.1 |
22.6 |
16 |
|
Vitamin B6, mg |
2.8 |
1.4 |
1.3 |
|
Vitamin B12, µg |
3.8 |
3.1 |
2.4 |
|
Vitamin C, mg |
300 |
143 |
90 |
|
Vitamin E, mg d-α-tocopherol equivalents |
14.0 |
7.9 |
15h |
|
a In the DASH-Sodium trial, the average sodium intake was 1.5 g (65 mmol) as estimated by mean urinary excretion. The sodium intake of each participant was indexed to calorie level (0.9 to 1.8 g/d (39 to 78 mmol, corresponding to 1,600 to 3,600 kcal/d), Svetkey et al. (1999a). b Nutrients not analyzed but for which Recommended Dietary Allowances (RDAs) or Adequate Intakes (AIs) have been established (IOM, 1997, 1998, 2000b, 2001, 2002): chromium, copper, fluoride, iodine, iron, manganese, molybdenum, phosphorus, selenium, vitamin A, vitamin D, vitamin K, folate, pantothenic acid, biotin, and choline. c Average of recommended intake for young adult men and women; AI indicated with *; all others are RDAs. d As low as possible while consuming a nutritionally adequate diet. e AI for men for n-3 fatty acids = 1.6 g; for n-6 fatty acids = 17 g; total = 18.6 g. f n-3 fatty acids = 0.5–1.0 % of kcal; n-6 fatty acids = 5–10% of kcal. g Amount listed is based on 14 g dietary fiber/1,000 kcal. h Vitamin E RDA is 15 mg d-α-tocopherol; 1 mg ≈ 1.2 mg d-α-tocopherol equivalents. SOURCE: Adapted from Craddick et al. (2003) and reprinted with permission. Copyright 2003 by Current Science, Inc. |
|||
|
AI for Sodium for Women |
|
|
19–30 years |
1.5 g (65 mmol)/day of sodium |
|
31–50 years |
1.5 g (65 mmol)/day of sodium |
|
AI for Chloride for Men |
|
|
19–30 years |
2.3 g (65 mmol)/day of chloride |
|
31–50 years |
2.3 g (65 mmol)/day of chloride |
|
AI for Chloride for Women |
|
|
19–30 years |
2.3 g (65 mmol)/day of chloride |
|
31–50 years |
2.3 g (65 mmol)/day of chloride |
Older Adults and the Elderly Ages 51+ Years
Methods Used to Set the AI
Renal Function. The ability of the kidney to conserve sodium decreases with age in response to varying and thus lower intake of salt decreases with age. The ability of apparently healthy older individuals to adapt by decreasing urinary sodium when fed very low sodium diets (in the range of 0.23 g [10 mmol]/day) has been shown to be much slower than the adaptation seen in younger individuals; however, with time, older individuals were able to adapt and reduce urinary sodium excretion to levels less than 10 mmol/day (Epstein and Hollenberg, 1976). In a study in which individuals over 40 years of age were compared with race-, sex-, and body weight-matched controls below 40 years of age, short-term loading via intravenous saline administration demonstrated distinct age-related differences in sodium excretion, which included excreting significantly more sodium during the night than the younger control subjects (Luft et al., 1980, 1982, 1987).
The clinical significance of this impaired response may be considerable when older individuals must quickly adapt to the reduced sodium intakes that are often seen during illnesses or following surgery. The result of a rapid decrease in sodium and fluid intake is a reduction in extracellular fluid volume, which is clinically manifested as a decrease in circulating blood volume. In clearance studies of apparently healthy younger and older subjects, older subjects had a reduced ability to reabsorb sodium at the distal tubule compared with their younger counterparts (Macias-Nuñez et al., 1978). Possible mechanisms by which distal tubule function is affected include development of interstitial fibrosis (Macias-Nuñez et al., 1980) or loss of functioning nephrons. In addition, the hormonal
changes that occur with age in the kidney, include increased blood flow to the medulla, depressed activity of the renin-angiotensin-aldosterone system (Weidmann et al., 1977), and diminution in the activity of Na+/K+-ATPase (Macia-Nuñez et al., 1980), all of which impair distal tubule function.
Alterations in the renin-angiotensin-aldosterone system have been demonstrated with age. In a study of elderly subjects, basal plasma renin concentration was 30 to 50 percent less in the presence of normal levels of renin substrate (angiotensinogen) (Crane and Harris, 1976). Similarly, a 38 percent decrease in plasma aldosterone concentration was noted in 15 elderly, nonhypertensive volunteers (60 to 74 years in age) when reclining while following a lower sodium diet (urinary sodium excretion averaged 124 mmol [2.8 g]/ day) when compared with 28 younger counterparts (19 to 29 years of age; urinary sodium excretion was very similar and averaged 121 mmol [2.8 g]/day) (Weidmann et al., 1977). When young and elderly subjects were put through regimens known to stimulate secretion of renin (e.g., moving from a sitting position to standing upright, a very low sodium diet (0.23 g [10 mmol]/day of sodium intake), or furosemide administration), age differences in plasma renin activity were further magnified (Anderson et al., 1980; Crane and Harris, 1976; Cugini et al., 1987; Hall et al., 1989; Luft et al., 1987; Tsunoda et al., 1986; Weidmann et al., 1975).
The age-related suppression of aldosterone appears to be due to decreased renin response rather than to intrinsic adrenal gland deficits, since both plasma aldosterone and cortisol responses when upright were similar in the elderly and younger subjects (Weidmann et al., 1977). Thus, during sodium reduction, angiotensin II action on renin to increase renal tubular reabsorption of sodium may be impaired to a greater extent in the elderly.
Increased blood pressure has been directly associated with increased sodium intake. Blood pressure, on average, rises with increased sodium intake (see subsequent discussion) and with reduced potassium intake (see Chapter 5). The relationship of blood pressure to electrolyte intake has been more highly correlated with the sodium:potassium ratio than either electrolyte alone (Khaw and Barrett-Connor, 1988). Further, an age gradient is evident, such that the rise in blood pressure per unit change in the sodium:potassium ratio is steeper with increasing age (Khaw and Barrett-Connor, 1990). These data, in conjunction with evidence from clinical trials (Vollmer et al., 2001) indicate that sensitivity to salt increases progressively with age and is not just a phenomenon observed in the elderly.
Several trials have documented that reduced sodium intake lowers blood pressure in older adults (Alam and Johnson, 1999; Appel et al., 2001; Cappuccio et al., 1997; Cobiac et al., 1992; Johnson et al., 2001; Weinberger and Finberg, 1991; Weinberger et al., 1986). Some trials have directly evaluated the effect of age on blood pressure responses to dietary sodium reduction. Greater reduction in blood pressure in response to reducing dietary sodium levels to less than 1.75 g (75 mmol)/day in adults over 40 years of age (up to age 54) compared with younger adults aged 21 to 39 years has been reported (Miller et al., 1987). Significantly greater systolic blood pressure reduction from a lower (versus higher) sodium intake in persons older than 45 years compared with those 45 years of age or younger has also been noted (Vollmer et al., 2001).
Limited evidence suggests that sodium sweat concentrations in the elderly are not different from those of young adults (Inoue et al., 1999) (see Table 6-3).
Overall, the data cited above provide no firm basis to modify the AI for older persons. Thus the AI for older adults is extrapolated from younger adults based on the combined average for men and women of median energy intakes (which do decrease with age). Median energy intakes for older women based on the CSFII were 1,507 and 1,356 kcal for 51 through 70 years and 71 years and older, respectively; for older men, median energy intakes were 2,109 and 1,773 kcal/day for 51 through 70 years and 71 years of age and older, respectively (IOM, 2002). The median energy intakes for both genders were averaged.
In summary, extrapolating from younger individuals based on energy intake, the AI is 1.3 g (55 mmol)/day for men and women 51 to 70 years and 1.2 g (50 mmol)/day for those 71 years and older. Chloride is calculated on an equimolar basis: the AI for those 51 through 70 is 2.0 g (55 mmol)/day; for those 71 years of age and older, 1.8 g (50 mmol)/day.
Sodium and Chloride AI Summary, Ages 51+ Years
|
AI for Sodium for Men |
|
|
51–70 years |
1.3 g (55 mmol)/day of sodium |
|
> 70 years 1.2 |
g (50 mmol)/day of sodium |
|
AI for Sodium for Women |
|
|
51–70 years |
1.3 g (55 mmol)/day of sodium |
|
> 70 years |
1.2 g (50 mmol)/day of sodium |
|
AI for Chloride for Men |
|
|
51–70 years |
2.0 g (55 mmol)/day of chloride |
|
> 70 years |
1.8 g (50 mmol)/day of chloride |
|
AI for Chloride for Women |
|
|
51–70 years |
2.0 g (55 mmol)/day of chloride |
|
> 70 years |
1.8 g (50 mmol)/day of chloride |
Pregnancy
Evidence Considered in Setting the AI
Substantial changes in intracellular and extracellular volume occur during pregnancy. Plasma volume increases approximately 1.3 L, while the interstitial space expands approximately 1.7 L by the end of pregnancy. This increase, plus an increase of approximately 2 L in intercellular water, constitute the absolute physiological hypervolemia of gestation (Chesley, 1978; Hytten, 1980; Lindheimer and Katz, 1985, 2000). There are major differences of opinion on the interpretation of these volume changes that occur during normal pregnancy and their relationship to sodium intake and thus requirements.
Consensus with regard to what constitutes normal kidney function and the role of sodium in maintenance of total body water volume during pregnancy is lacking (Brown and Gallery, 1994; Durr and Lindheimer, 1999; Duvekot et al., 1993; Lindheimer and Katz, 2000; Schrier and Briner, 1991; Steegers et al., 1991a). The mechanism by which the kidneys of pregnant women handle filtered sodium and by which they “sense” volume changes remain uncertain.
Sodium Accretion. Healthy pregnant women gain approximately 16 kg during gestation, most of which is gained during the second and third trimester (13.8 kg) (Carmichael et al., 1997). Not all of this added weight can be accounted for by the products of conception, tissues directly concerned with reproduction, or the gain in total body water, as body fat increases as well.
Pregnancy appears to require an accumulation of an extra 2.1 to 2.3 g (900 to 1,000 mmol) of sodium to maintain the increase in plasma volume (≈ 1.3 L) and interstitial space (≈ 1.7 L), and to provide for the products of conception (Brown and Gallery, 1994; Hytten, 1980; Lindheimer and Katz, 2000). Note that this accumulation occurs over a period of 9 months, and even during the pe-
riod of most rapid accumulation, the gain in body weight is barely 69 to 92 g/day. The amount of additional sodium needed (≈ 0.07 g [3 mmol]/day) would be too small to detect in metabolic balance studies.
Sodium Balance. Some studies have detected increases in the appetite for sodium during gestation (Brown and Toma, 1986). In one small study where sodium intake was reduced to approximately 1.2 g (50 mmol)/day, pregnant women gained less weight and manifested smaller increments in cardiac output, but had gestational outcomes similar to women eating unrestricted diets containing approximately threefold more sodium (Steegers et al., 1991b).
Of interest is a study in which pregnant women decreased their sodium intake to approximately 0.23 g (10 mmol)/day (Bay and Ferris, 1979). Under such severe restriction, it is reasonable that in order to meet the additional needs of pregnancy (i.e., retention of ≈ 0.07 g [3 mmol]/day), the urinary sodium excretion level should have resembled that of the urines of individuals who, based on dietary reduction to a similar low level, virtually eliminate sodium from their urines. The pregnant women did not; they actually excreted 23 to 46 mg (1 to 2 mmol)/day more than control nonpregnant women. The pregnant women also failed to gain the anticipated 0.5 kg of weight during the week of the study and actually lost approximately 1 kg. Thus the data of Bay and Ferris (1979) suggest that pregnant women may be prone to subtle salt wasting. Both before and after infusion of isotonic saline during normal pregnancy in the first trimester, plasma renin activity, as well as aldosterone concentration, were increased, and urinary sodium excretion decreased in the pregnant participants compared with the nonpregnant women studied, suggesting increased sodium retention during pregnancy to meet the additional needs (Weinberger et al., 1977).
Renin-Angiotensin-Aldosterone System. Various studies have focused on the roles of volume-influencing hormones and chronic, as well as acute, sodium loading in pregnant women (Brown and Gallery, 1994; Chesley, 1978; Lindheimer and Katz, 1985, 2000; Weinberger et al., 1977). Though circulating concentrations of all elements of the renin system, as well as plasma aldosterone, are increased in pregnant women compared with that observed in nonpregnant patients with primary aldosteronism, the concentrations change appropriately in response to salt reduction, saline loading, or changes in posture—suggesting, rather than being “high,” that concentrations of the renin-angiotensin-aldosterone system are appropriate
in pregnancy and are able to respond to homeostatic demands (Weinberger et al., 1977). Though disputed (Weinberger et al., 1977), pregnant women appear to handle acute and large saline loads as high as 9.5 g (410 mmol) (Chesley et al., 1958) as well as that seen in nonpregnant women. At the opposite extreme of sodium intake, it is evident that in cultures with virtually no sodium intake (e.g., the Yanomamo Indians), reproduction occurs with markedly higher levels of plasma renin activity and serum aldosterone compared with that observed in nonpregnant women; no evidence of observable adverse effects of such extreme diets on gestational outcome have been reported (Oliver et al., 1981).
Plasma Sodium Concentration. Plasma sodium concentration decreases 4 to 5 mmol/L during normal pregnancy due to the resetting of the osmotic threshold for arginine vasopressin secretion and thirst to a level ≈ 10 mOsm/kg below nonpregnant values (see Chapter 4). Thus pregnant women should not be considered hyponatremic until concentrations fall to 130 mmol/L or lower. In contrast, values exceeding 140 mmol/L should raise suspicion of hypernatremia. Finally, the propensity of pregnant women to vomit in the first trimester and the possibility that their onset of sweating at a lower temperature may mean they have greater sweat loss and thus greater sodium losses (Clapp, 1991) might also affect plasma sodium concentrations and hence sodium requirements.
Plasma sodium concentration decreases during pregnancy despite the small but positive cumulative sodium balance previously discussed (at its greatest, just a few mg/day). There are also many gestational physiological changes. They include increased glomerular filtration rate and therefore increased filtered sodium; alterations in plasma concentration of hormones that influence sodium excretion, thus labeled as natriuretic (e.g., progesterone, atrial natiuretic peptide) and antinatriuretic (e.g., angiotensin II, aldosterone, desoxycorticosterone); and even physical factors (e.g., oncotic pressure). All of these physiological changes are known to influence kidney function, but how they eventually affect renal sodium handling is still obscure.
Summary. There is a lack of evidence to suggest that sodium requirements of preganat women differ from that of nonpregnant women. The median energy intake of pregnant women (1,978 kcal/day [IOM, 2002]) falls within the range of energy consumed by young men and women (IOM, 2002). Therefore, the AI for sodium for pregnant women is equal to the AI for nonpregnant adolescent
girls and young women. The AI for chloride is set at a level equimolar to sodium.
Sodium and Chloride AI Summary, Pregnancy
|
AI for Sodium for Pregnancy |
|
|
14–18 years |
1.5 g (65 mmol)/day of sodium |
|
19–30 years |
1.5 g (65 mmol)/day of sodium |
|
31–50 years |
1.5 g (65 mmol)/day of sodium |
|
AI for Chloride for Pregnancy |
|
|
14–18 years |
2.3 g (65 mmol)/day of chloride |
|
19–30 years |
2.3 g (65 mmol)/day of chloride |
|
31–50 years |
2.3 g (65 mmol)/day of chloride |
Lactation
Evidence Considered in Setting the AI
A small amount of sodium is secreted daily in human milk during the first 6 months of lactation (0.12 g [5.2 mmol]/day) (see earlier section, “Infants Ages 0 Through 12 Months”). There is no evidence to suggest that the sodium requirements of lactating women differ from that of nonlactating women. The estimated median energy intake of lactating women (2,066 kcal/day [IOM, 2002]) falls within the range of energy consumed by young men and women (IOM, 2002). Therefore, the AI for sodium for lactating women is set to be equal to that of nonlactating women. The AI for chloride is set at an equimolar amount based on the AI for sodium.
Sodium and Chloride AI Summary, Lactation
|
AI for Sodium for Lactation |
|
|
14–18 years |
1.5 g (65 mmol)/day of sodium |
|
19–30 years |
1.5 g (65 mmol)/day of sodium |
|
31–50 years |
1.5 g (65 mmol)/day of sodium |
|
AI for Chloride for Lactation |
|
|
14–18 years |
2.3 g (65 mmol)/day of chloride |
|
19–30 years |
2.3 g (65 mmol)/day of chloride |
|
31–50 years |
2.3 g (65 mmol)/day of chloride |
Special Considerations
Influence of Physical Activity or High Temperature on Sodium Requirements
The AIs given above are for individuals who are moderately active in temperate climates. As was discussed in Chapter 4, high levels of activity or exposure to high temperature or humidity results in increased needs for water to replace sweat losses. In these settings, additional sodium above the AI may be required as well, but experimental data are lacking, especially at dietary intakes of 1.5 g (65 mmol)/day.
Still, for most physically active individuals, the AI should be adequate. Of the 1.5 g (65 mmol)/day, only about 0.23 g (10 mmol) is needed to replace insensible losses, exclusive of sweat and urine, in acclimatized individuals. Hence, approximately 1.3 g (55 mmol) is available to replace sodium loss in sweat. This amount should be adequate even in unacclimatized, untrained individuals, depending on the duration of activity and exposure. However, for such individuals who are unacclimatized to a heavy heat load over long periods of time—such as that resulting from infrequent heavy physical activity at high temperature and humidity over several hours—additional sodium may be needed. As stated earlier, the AI does not apply to individuals who lose large volumes of sodium in sweat, such as competitive athletes and workers exposed to extreme heat stress (e.g., foundry workers and fire fighters). Sodium intake invariably rises with increased energy intake in physically active individuals and this increase usually is enough to compensate for sweat sodium losses. However, some individuals in the situations described above can lose excessively large amounts of sodium in sweat and on those occasions they should ingest a diet that contains sodium in excess of the AI.
Impact of the Sodium AI on Iodine Intake
Total iodine intake includes iodine that is naturally present in foods as well as iodine from iodized salt. While iodine from iodized table salt has been available in the United States and Canada since the 1920s, the extent to which iodized salt currently contributes to meeting iodine needs is unknown. Iodide was originally added to table salt in order to address the problem of endemic goiter, a problem found in the Great Lakes region and the Pacific Northwest. Previously, the food supply in these regions was limited to
locally grown foods that were low in iodine due to soil conditions. However, in the United States and Canada, the current food supply is not restricted to locally grown products and now includes foods grown in multiple regions and countries, thus making iodine more available.
A decline in the use of table salt might result in lower levels of iodine intake. However, current national surveys track urinary excretion of iodine, which is considered a good indicator of intake (IOM, 2001). Based on the most recent survey, iodine intake is adequate (CDC, 2002). If iodine intakes appear to decline, food vehicles other than table salt can be considered as a means of providing additional iodine.
INTAKE OF SODIUM
Sources
Sodium chloride (salt) is the primary form of sodium in the diet. Other forms of sodium that contribute to the total sodium content of food include monosodium glutamate (a constituent of soy sauce) and food additives, such as sodium benzoate, sodium nitrite, and sodium acid pyrophosphate. Sodium bicarbonate and sodium citrate (the anion of which is converted in the body to bicarbonate) are ingested as food additives and can be consumed, sometimes in substantial amounts, as antacids and as alkali therapy for correcting or preventing metabolic acidosis, such as that occurring in chronic kidney disease.
Foods that contain higher amounts of naturally occurring sodium are celery (0.10 g [4.3 mmol]/120 g [1 cup diced]), milk (0.12 g [5.2 mmol]/0.24 L [1 cup]), and shellfish, such as scallops (0.072 g [3.1 mmol]/scallop). On average, tap water in the United States contains about 0.05 g (2.2 mmol)/L (0.01 g [0.43 mmol]/8 oz. cup), although the content varies based on geographic location (Hoffman, 1988). Bottled water in the United States generally contains less than 0.01 g (0.5 mmol)/L (0.002 g/8 oz. cup) of sodium (USDA/ARS, 2002). A survey of commercially available North American and European bottled waters found an average sodium content of 0.005 g (0.22 mmol)/L (0.001 g/8 oz. cup) in North American bottled waters, while the average sodium content in European bottled waters was 0.020 g (0.86 mmol)/L (0.004 g/8 oz. cup) (Garzon and Eisenberg, 1998).
Foods that are processed or canned tend to have higher sodium concentrations due to the addition of salt- or sodium-containing
additives during processing. Example of foods that contain high levels of sodium, primarily as sodium chloride added in processing, include luncheon meats and hot dogs (0.55 g/ounce), canned vegetables (0.23 g/one-half cup), processed cheese (0.35 g/slice), and potato chips (0.28 g/oz.). Most breads, baked goods, and breakfast cereals contain about 0.15 to 0.33 g of sodium per serving. For example, a medium (57 g) bagel has 0.30 g of sodium, a serving of cornflakes (21 g) has 0.15 g of sodium, and one slice of bread (28 g) has 0.16 g of sodium.
Sodium chloride and other sodium-containing food additives (such as those mentioned previously) are also present in condiments, such as Worcestershire sauce, soy sauce, ketchup, onion salt, garlic salt, sea salt, and bouillon cubes, usually to enhance the flavor of foods.
While various forms of sodium are often added during food processing to improve flavor, many sodium-containing additives also have functional roles (Marsden, 1980). Sodium chloride added to yeast bread is essential for dough to rise and it helps control the growth of undesirable bacteria and molds. It also functions as a dough conditioner to strengthen the protein in dough (gluten), which allows it to hold air and not collapse. Salt is also added to many frozen foods to preserve texture (Crocco, 1982). Other sodium additives, such as sodium bicarbonate and sodium aluminum phosphate, are used as leavening agents in nonyeast breads.
Sodium chloride decreases the water activity of foods, thus helping to control the growth of pathogenic bacteria (Jay, 1996). Sodium chloride is thus used as a preservative in meats and is necessary to make fermented products (e.g., pickles) (Niven, 1980; Pearson and Wolzak, 1982). A U.S. Food and Drug Administration guidance to the seafood industry for the control of microbiological hazards, The Seafood HACCP Guide, recommends the use of a 3.5 percent sodium chloride solution for the control of the pathogen Clostridium botulinum in smoked fish (CFSAN, 2001). Many other food additives containing sodium, such as sodium benzoate and sodium bisulfate, function as preservatives in processed foods to extend shelf-life and control microbiological growth (IOM, 2003; Niven, 1980).
Only about 12 percent of the total sodium chloride consumed is naturally occurring (Mattes and Donnelly, 1991). It has been further estimated that the majority (77 percent of total salt) is consumed as a result of processing, while 6 percent is added while eating, 5 percent is added during cooking, and less than 1 percent is consumed from tap water. Because salt is naturally present in only a
few foods, salt reduction does not need to result in inadequate intakes of macronutrients and micronutrients (Korhonen et al., 2000).
Table 6-10 shows a one day menu of 2,200 kcal and its resulting sodium content. This intake level of 2,200 kcal/day is the median intake of adult men and women from the Continuing Survey of Food Intake of Individuals (CSFII), taken in 1994–1996 and 1998 (IOM, 2002). This table illustrates that sodium intake at levels between the AI of 1.5 g (65 mmol)/day and the Tolerable Upper Intake Level (UL) for adults of 2.3 g (100 mmol)/day (see next section, “Adverse Results of Overconsumption”) can be achieved by eating a variety of foods and consuming a diet that provides recommended levels of vitamins and mineral elements, as well as recommended amounts of protein, fiber, carbohydrate, and polyunsaturated fatty acids.
Intake
Based on self-reported intake data in the United States from the Third National Health and Nutrition Examination Survey (NHANES III, 1988–1994) (Appendix Table D-8), the estimated median intake of sodium from foods (not including salt added at the table) varied by age group and ranged from 3.1 to 4.7 g (135 to 204 mmol)/day for men and 2.3 to 3.1 g (100 to 135 mmol)/day for women in the United States. These intake ranges are equivalent to 7.8 to 11.8 g/day of sodium chloride for men and 5.8 to 7.8 g/day of sodium chloride for women. The estimated dietary sodium intakes of both white and African American men and women in the United States were similar (Appendix Tables D-9 and D-10). Median intakes for sodium based on survey data on usual intakes of sodium for ten provinces in Canada in 1990–1999 (Appendix Table F-3) ranged from 2.8 to 3.8 g (122 to 165 mmol)/day for men and 2.0 and 2.5 g (87 to 109 mmol)/day for women. These intake ranges are equivalent to 7.1 to 9.7 g/day of sodium chloride for men and 5.1 to 6.4 g/day for women.
It should be emphasized that these estimates of self-reported sodium intake do not include salt added at the table and thus underestimate sodium intake for many individuals. In contrast to the NHANES and Health Canada data sets, other studies have estimated total sodium intake (including table salt) from urinary sodium excretion. Recent (1997–1999) population-based estimates of sodium intake in the United States derived from 24-hour urine collections documented median urinary sodium excretion for those aged 40 to
TABLE 6-10 Daily Sodium Intake from a Diet Providing 2,200 kcal
|
Meal |
Food/Beverage Consumed |
Calories (kcal) |
Sodium (mg) |
|
Breakfast |
Shredded wheat miniatures (1 cup) |
183 |
8 |
|
|
Cantaloupe, cubed (1/2 cup) |
27 |
13 |
|
Milk, 1% (8 oz) |
102 |
122 |
|
|
Orange juice (6 oz) |
82 |
2 |
|
|
White toast (1 slice) with unsalted margarine vegetable oil spread (1 tsp) |
89 |
130 |
|
|
Coffee, black, unsweetened (12 oz) |
13 |
3 |
|
|
Total for meal |
496 |
278 |
|
|
Snack |
Banana (1 medium) |
105 |
1 |
|
|
Water (12 oz) |
0 |
7 |
|
Total for meal |
105 |
8 |
|
|
Lunch |
Sandwich with turkey (2 oz), swiss cheese (1 oz), lettuce (2 leaves), tomato (1/4″ slice), mayonnaise, (1 tbsp) and whole wheat bread (2 slices) |
395 |
499 |
|
|
Baby carrots (8) |
28 |
62 |
|
Fig bar cookies (2) |
111 |
112 |
|
|
Iced tea, brewed, decaffeinated (16 oz) |
5 |
14 |
|
|
Total for meal |
539 |
687 |
|
|
Snack |
Almonds, dry roasted, unsalted (1/4 cup) |
206 |
< 1 |
|
|
Raisins (1/4 cup) |
108 |
4 |
|
Water (12 oz) |
0 |
7 |
|
|
Milk, 1% (8 oz) |
102 |
122 |
|
|
Total for meal |
416 |
134 |
|
|
Dinner |
Baked salmon (3 oz) |
151 |
44 |
|
|
Long-grain brown rice (1/2 cup cooked) |
108 |
5 |
|
Tossed salad (1 1/2 cups) with safflower oil and vinegar dressing (2 tbsp) |
155 |
54 |
|
|
Asparagus (6 spears) |
20 |
13 |
|
|
Dinner roll, whole wheat (1 medium) with unsalted margarine vegetable oil spread (1 tsp) |
101 |
95 |
|
|
Angel food cake (1 slice) with sliced strawberries (1/2 cup) and whipped cream topping (2 tbsp) |
114 |
218 |
59 years of 183 mmol (4.2 g)/day in men and 142 mmol (3.3 g)/ day in women.
Worldwide, there has been even greater variation in sodium intake, ranging from an estimated mean intake of 0.02 g (1.0 mmol)/day in Yanomamo Indians (below the 1st percentile of adults in NHANES III) to over 10.3 g (450 mmol)/day in Northern Japanese (above the 99th percentile of NHANES III) (Oliver et al., 1975; Sasaki, 1964).
There is a lack of data on average sodium intakes during pregnancy and only a few studies have reported sequentially measured urinary sodium excretion. The median sodium intake for pregnant women was 3.48 g (151 mmol)/day in NHANES III (Appendix Table D-8). In the Calcium for Prevention of Preeclampsia study (CPEP), dietary recalls were obtained on the 4,589 participants at recruitment (during weeks 13 to 21 of gestation) (Morris et al., 2001). Daily sodium intake of the 3,125 nonhypertensive pregnant women averaged 4.24 g (184 mmol)/day. Mean sodium excretion in three small serial studies were approximately 2.3 to 3.5 g (100 to 150 mmol)/day (Brown et al., 1988; Steegers et al., 1991b; Wilson et al., 1980). Of note, the populations in the CPEP study
(Morris et al., 2001) and the study conducted by Wilson and colleagues (1980) included a greater proportion of African American and Hispanic women than are in the general population.
In view of the interactive effects of sodium and potassium highlighted in this report, it is useful to examine intakes of sodium and potassium expressed as the ratio of sodium intake (in mmol/day) to potassium intake (mmol/day) for the various lifestage groups. Appendix Table D-11 includes these data from NHANES III. Under 1 year of age, the median sodium:potassium ratio is less than one. The ratio then rises rapidly to just above two for children 4 through 8 years of age, and remains above two into adulthood, but then drops somewhat in middle- and older-aged adults. The progressive rise in this ratio at an early age reflects a greater increase in dietary sodium intake compared with the increase in dietary potassium intake. A similar pattern is present in both men and women.
ADVERSE EFFECTS OF OVERCONSUMPTION
Hazard Identification
Sodium Intake and Blood Pressure
Sodium chloride consumption is one of several dietary factors that contribute to increased blood pressure. Other dietary factors that raise blood pressure are excess weight, inadequate potassium intake, high alcohol consumption, and a suboptimal dietary pattern (see the following sections). Physical inactivity also increases blood pressure. Increased blood pressure is associated with several chronic diseases, including stroke, coronary heart disease, renal disease, and left ventricular hypertrophy.
Cardiovascular Disease and High Blood Pressure. Data from numerous observational studies provide persuasive evidence of the direct relationship between blood pressure and cardiovascular disease. A review of each epidemiologic study is beyond the scope of this report. However, several meta-analyses have aggregated data across these studies (Lewington et al., 2002; MacMahon et al., 1990). The most recent and largest meta-analysis to date pooled data from 61 prospective observational studies that together enrolled almost 1 million adults, including persons with hypertension (Lewington et al., 2002). Individual-level records were available for each participant in each study. Those individuals with pre-existing vascular disease were excluded.
There were 12.7 million person years of follow-up and, of the total number of deaths (122,716), about half occurred as a result of cardiovascular disease (11,960 deaths from stroke, 34,283 from ischemic heart disease, and 10,092 from other vascular causes). As displayed in Figure 6-4, stroke mortality progressively increased with systolic blood pressure (panel A) and diastolic blood pressure (panel B) in each decade of life. Similar patterns were evident for mortality from ischemic heart disease and from other vascular diseases. In analyses that involved time-dependent correction for regression-dilution bias, there were strong, direct relationships between blood pressure and each type of vascular mortality. Importantly, there was no evidence of a blood pressure threshold—that is,
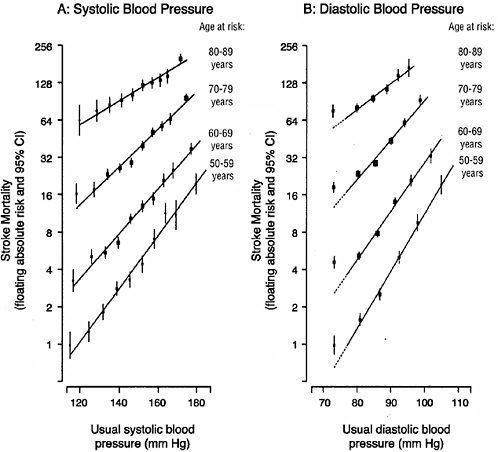
FIGURE 6-4 Stroke mortality rate in each decade of age versus usual blood pressure at the start of that decade. Reprinted with permission, from Lewington et al. (2002). Copyright 2002 by Elsevier Ltd.
vascular mortality increased throughout the range of blood pressures, in both nonhypertensive and hypertensive individuals. Hence, even though currently recommended thresholds for initiation of drug therapy are 140 mm Hg (systolic) and 90 mm Hg (diastolic) for uncomplicated hypertension (Chobanian et al., 2003), these thresholds are operational and do not correspond to a change point in the relationship between blood pressure and cardiovascular disease.
Meta-analyses of clinical trials have conclusively documented that antihypertensive drug therapy reduces the risk of cardiovascular events in hypertensive individuals. For example, reductions in usual diastolic blood pressure of 5, 7.5, and 10 mm Hg were associated with 34, 46, and 56 percent less stroke events, respectively, and 21, 29, and 37 percent less coronary heart disease events, respectively (MacMahon et al., 1990). Overall, the strong direct relationship of blood pressure with cardiovascular disease in nonhypertensive and hypertensive individuals, in conjunction with the well-documented, beneficial effects of antihypertensive therapy, strongly supports efforts to reduce blood pressure in both nonhypertensive and hypertensive individuals and to prevent the age-related rise in blood pressure.
Although only one blood pressure-reduction trial with a clinical endpoint has been conducted in nonhypertensive individuals (PCG, 2001), several analyses have estimated the potential benefits from population-wide application of therapies, such as sodium reduction. For instance, in the United States it has been estimated that a population-wide reduction in systolic blood pressure of 3 mm Hg should reduce mortality from stroke by 8 percent and mortality from coronary heart disease by 5 percent (Stamler, 1991). A 2-mm Hg reduction in diastolic blood pressure would result in a 17 percent decrease in the prevalence of hypertension, as well as a 6 percent reduction in the risk of coronary heart disease and a 15 percent reduction in the risk of stroke and transient ischemic attacks (Cook et al., 1995a). In view of these potential benefits, it is a well-accepted, public health tenet that the optimal strategy to prevent blood pressure-related cardiovascular disease includes population-wide blood pressure reductions through nonpharmacologic therapies in addition to targeted reductions through pharmacologic and nonpharmacologic therapies in hypertensive individuals (Chobanian et al., 2003; Whelton et al., 2002).
Renal Disease and High Blood Pressure. Hypertension is the second leading cause of end-stage renal disease (USRDS, 1999). Observa-
tional studies have shown a direct relationship between blood pressure and renal disease progression (Klag et al., 1996, 1997; Whelton et al., 1996). There is some evidence, albeit inconclusive, that lowering blood pressure may retard the progression of renal disease (Klahr et al., 1994; Peterson et al., 1995). The effect of hypertension on the onset and progression of renal disease has been attributed, in part, to nephrosclerosis (fibrous intimal thickening of the small arteries in the kidney) (Tracy et al., 1988).
Sodium Intake and Blood Pressure: Evidence from Observational Epidemiological Studies. Evidence of a positive association between sodium intake and blood pressure comes from both across-population (ecologic) and within-population observational studies. A strong direct relationship between average salt intake and prevalence of hypertension in a cross-population, ecological study of five geographically diverse communities was reported in 1960 (Dahl, 1960). Subsequently, others have confirmed these findings in larger and more careful studies (Gleibermann, 1973). A strength of these studies is their ability to provide a large contrast in sodium intake, the exposure variable. However, limitations must be acknowledged, including the fact that data were not collected in a standardized fashion. Also, adjustment for potentially confounding variables was either not considered or was inadequate. Despite these constraints, cross-population observational studies tend to indicate that blood pressure and hypertension are lower in societies in which habitual sodium intake is below 1.2 to 2.3 g (50 to 100 mmol)/day, while an increased prevalence of blood pressure and hypertension are observed more frequently in societies with higher habitual levels of sodium intake (Elliott, 1991).
Within-population studies of sodium and blood pressure generally lack statistical power, in large part because of large day-to-day variations in sodium intake and because of imprecise methods (e.g., use of a food-frequency questionnaire rather than a 24-hour urinary sodium excretion to assess sodium intake). Accordingly, results of within-population studies have been inconsistent. Studies with null results include those published by Ascherio and coworkers (1992) and Rastenyte and coworkers (1997) (Table 6-11). Other within-population studies have identified a significant, direct association between urinary sodium excretion (representing dietary intake) and blood pressure (Hajjar et al., 2001; Kesteloot and Joossens, 1988; Khaw and Barrett-Connor, 1988; Liu et al., 2000; Stamler et al., 1997).
As highlighted above, methodological problems hinder an assess-
TABLE 6-11 Epidemiological Studies on Sodium or Salt Intake and Blood Pressure
|
References |
Study Design |
Resultsa |
|
Rose et al., 1988; Stamler et al., 1989 |
Intersalt Study, 10,079 men and women, cross-sectional in 32 countries |
Significant positive correlation with urinary Na and slope of blood pressure with age, but not median BP or prevalence of elevated BP In 4 remote locations where sodium intake was very low, BP was low for all ages |
|
Frost et al., 1991 |
12,773 men and women, cross-sectional data from 14 published studies |
Significant association between blood pressure and sodium intake (p < 0.001) |
|
Ascherio et al., 1992 |
Health Professional Followup Study, 30,681 US men, prospective cohort, 4-yr follow-up, 1,248 incident cases of hypertension, multivariate analysis |
No significant association between hypertension and dietary intake of sodium as assessed by food-frequency questionnaire |
|
Elliott et al., 1996 |
Intersalt Study, 10,074 men and women, cross-sectional |
SBP of individuals was positively associated with sodium excretion |
|
Rastenyte et al., 1997 |
3,326 Finnish men and women, cross-sectional |
No association between urinary sodium and BP in either men or in women |
|
Tunstall-Pedoe, 1999 |
Scottish Heart Health Study, cross-sectional, n = 11,629 men and women |
Weak association between urinary sodium and blood pressure |
|
Liu et al., 2000 |
WHO-CARDIAC Study, 1,151 Chinese and 1,681 Japanese men and women, cross-sectional |
SBP was positively associated with sodium excretion in Japanese, while both SBP and DBP was associated with sodium excretion in Chinese |
|
a Na = Sodium, BP = blood pressure, DBP = diastolic blood pressure, SBP = systolic blood pressure. NOTE: Studies include a sample size of at least 1,000 in which urinary sodium was measured. |
||
ment of the true relationship between sodium intake and blood pressure in observational studies. Indeed, with the exception of weight, diet-related risk factors such as sodium are difficult to measure accurately and precisely in individuals. Interview methods have
limitations in reporting, recording, and analysis. Collection of 24-hour urinary excretion for sodium and potassium are objective but are also inconvenient and inevitably incomplete. Importantly, nutrient intakes vary considerably from day to day, so that accurate characterization of an individual’s usual intake requires repeated observations over time (IOM, 2000a). Likewise, blood pressure, the outcome variable, should be repeatedly measured because of its intrinsic variability (Obarzanek et al., 2003). There must also be a sufficient range of intakes of the dietary factor under study among members of the population to detect associations of the dietary factor with blood pressure. Finally, relevant confounding variables (i.e., physical activity and other dietary factors) must also be measured precisely. Hence observational studies need repeated, high-quality measurements of relevant variables in large samples of individuals.
One of the largest observational epidemiological studies that followed these guidelines and that explored the relationship between sodium intake and blood pressure was conducted by the Intersalt Cooperative Research Group at 52 centers located in 32 countries (Rose et al., 1988). Urinary sodium, blood pressure, and a number of potentially confounding variables were measured in 10,079 men and women, aged 20 to 59 years, from geographically diverse regions around the world with substantial variation in sodium intake. Repeat measurements of blood pressure and urinary sodium were obtained in a random sample of 807 study participants, allowing for correction of the regression dilution bias associated with variation in day-to-day intake of sodium.
Urinary sodium excretion ranged from 0.0046 g (0.20 mmol)/day (Yanomamo Indians of Brazil) to 5.6 g (242 mmol)/day (Northern China) (Rose et al., 1988). After adjustment for age and gender, sodium excretion and systolic blood pressure were positively associated in 39 of the 52 centers (statistically significant in 15) and negatively associated in 15 centers (statistically significantly in 2). Diastolic blood pressure was positively associated with sodium excretion in 33 centers (statistically significant in 4) and negatively associated in 19 centers (statistically significant in 6). Across the 52 centers, a significant linear relationship was shown between urinary sodium excretion and systolic blood pressure (p < 0.01). In cross-population analyses, a highly significant relationship of sodium with the upward slope of blood pressure with age was found across the 52 population samples. The estimated rise in systolic blood pressure with age over a 30-year period (e.g., 25–55 years) was 10 mm Hg less for a 2.3 g (100 mmol)/day lower intake of dietary sodium.
In within-population analyses, after adjustment for age and gender and correction for regression dilution bias, a 2.3-g (100 mmol)/day higher excretion of urinary sodium was associated with a systolic and diastolic blood pressure that was 4.3 and 1.8 mm Hg higher, respectively (Elliott et al., 1996). After additional adjustment for potassium excretion (as an indicator of potassium intake) and alcohol intake, the corresponding values were 6.0 and 2.5 mm Hg. The urinary sodium:potassium ratio was likewise associated with blood pressure and relationships tended to be stronger for this ratio than for sodium alone. Estimates of the association were larger for older compared with younger study participants (Elliott et al., 1996). Cross-population analyses yielded similar results to those noted for the within-person analyses, with a somewhat larger difference in blood pressure for a given difference in urinary sodium excretion.
Effects of Sodium Intake on Blood Pressure: Evidence from Intervention Studies. As previously discussed, a variety of methodological issues complicate the interpretation of observational studies. In this setting, clinical trials are the most appropriate study design to assess the relationship between sodium intake and blood pressure, and numerous trials have evaluated this relationship in nonhypertensive and hypertensive individuals (see Tables 6-12 and 6-13). Trials include controlled feeding studies and behavioral counseling studies. The studies differ in size (< 10 to > 500 persons), duration (range: 3 days to 3 years), extent of sodium reduction, background diet (e.g., intake of potassium), study quality, and documentation. Only 10 trials tested three or more levels of dietary sodium intake (see Appendix I). In the remaining trials, there were just two levels of sodium intake. Study populations also differed in age, race-ethnicity, and other dimensions that might affect the blood pressure response to changes in sodium intake.
Notwithstanding these differences, available trials have provided relatively consistent evidence that a reduced intake of sodium lowers blood pressure in nonhypertensive adults (see Table 6-12). Still, heterogeneity was evident. Some trials did not detect any effect on blood pressure from changes in sodium intake, while other trials recorded substantial reductions in blood pressure. Potential reasons for this heterogeneity include differences in study populations, inadequate statistical power, limited contrast in sodium intake, and other methodological issues. In trials with hypertensive participants (Table 6-13), the extent of blood pressure reduction from a lower intake of sodium was more pronounced than that observed in nonhypertensive participants.
TABLE 6-12 Intervention Studies on Sodium Intake and Blood Pressure in Nonhypertensive Adults in Order of Increasing Duration of Intervention
|
References |
Study Designa |
Sodium (Na) Intake g/d (mmol) |
Na/Potassium (K) Ratio |
|
Crossover studies |
|
||
|
Luft et al., 1979b |
14 men, 3.1 g K (80 mmol) |
0.23 (10) |
0.13 |
|
6.9 (300) |
3.8 |
||
|
|
3–7 d |
13.8 (600) |
7.5 |
|
|
18.4 (800) |
10 |
|
|
27.6 (1,200) |
15 |
||
|
34.5 (1,500) |
19 |
||
|
Sullivan et al., 1980 |
6 subjects, 2.3 g K (60 mmol) |
0.23 (10) |
0.17 |
|
|
4 d |
4.6 (200) |
3.3 |
|
|
|
9.2 (400) |
6.6 |
|
Bruun et al., 1990 |
10 men and women, 3.1 g K (80 mmol) |
1.2 (50) |
0.62 |
|
4.1 (180) |
2.2 |
||
|
|
4 d |
8.7 (380) |
4.8 |
|
Roos et al., 1985 |
8 men and women, 3.1 g K (80 mmol) |
0.46 (20) |
0.3 |
|
4.6 (200) |
2.5 |
||
|
|
5 d |
28.2 (1,228) |
15 |
|
Lawton et al., 1988 |
13 men, 3.9 g K (100 mmol) |
0.23 (10) |
0.1 |
|
9.2 (400) |
4 |
||
|
|
6 d |
|
|
|
Sharma et al., 1991 |
23 men, 2.3 g K (60 mmol) |
0.46 (20) |
0.13 |
|
|
6 d |
5.5 (240) |
1.7 |
|
Burnier et al., 1993 |
23 men, 3.9 g K (100 mmol) |
1.2 (50) |
0.5 |
|
4.6 (200) |
2.0 |
||
|
|
6 d |
|
|
|
Schmid et al., 1990 |
9 men and women |
|
|
|
1 wk |
0.46 (20) |
|
|
|
|
4.6 (200) |
|
|
|
Egan et al., 1991 |
9 men |
|
|
|
1 wk |
0.46 (20) |
||
|
|
|
4.6 (200) |
|
|
Ruppert et al., 1991 |
147 men and women, 2.9 g K (75 mmol) |
|
|
|
|
1 wk |
0.46 (20) |
0.27 |
|
|
|
6.9 (300) |
4 |
|
Urinary Na (mmol/d) |
Urinary K (mmol/d) |
Blood Pressure SBP/DBPb (mm Hg) |
|
|
15 |
|
113/69 |
|
|
278 |
117/70 |
||
|
543 |
119/71 |
||
|
706 |
121/76 |
||
|
1,122 |
125/78 |
||
|
1,443 |
131/85 |
||
|
|
p trend < 0.001 |
||
|
|
DBP |
MAP |
|
|
20 |
56c |
72 |
|
|
143 |
54c |
69c |
|
|
412 |
70d |
83d |
|
|
45 |
77 |
111/68 |
|
|
181 |
80 |
110/65 |
|
|
386 |
78 |
116/69 |
|
|
220 |
67 |
118/76 |
|
|
202 |
60 |
120/74 |
|
|
1,052 |
86 |
121/79 |
|
|
13 |
79 |
110/78 |
|
|
326 |
66 |
112/78 |
|
|
|
SR |
SS |
|
|
19–22 |
61–73 |
||
|
265–269 |
66–84 |
||
|
|
↓ 1/↓ 4.4 |
|
|
|
↓ 3/↑ 3 |
|||
|
MAP |
|||
|
20 |
|
93 |
|
|
210 |
92 |
||
|
|
MAP |
||
|
21 |
81a |
||
|
214 |
80a |
||
|
|
MAP |
||
|
|
SR |
SS |
|
|
17–18 |
86a |
86a |
|
|
280–292 |
86a |
94b |
|
|
References |
Study Designa |
Sodium (Na) Intake g/d (mmol) |
Na/Potassium (K) Ratio |
|
Schwartz et al., 1992 |
11 men, NTN patients; 11 men, HTN patients, 3.9 g K (100 mmol) |
0.23 (10) 4.6 (200) |
0.1 2.0 |
|
|
1 wk |
|
|
|
Fliser et al., 1993 |
16 men and women |
|
|
|
1 wk |
0.46 (20) |
|
|
|
|
4.6 (200) |
|
|
|
Overlack et al., 1993 |
163 white men and women, 2.9 g K (75 mmol) |
0.46 (20) |
0.27 |
|
|
1 wk |
6.9 (300) |
4 |
|
Sharma et al., 1993 |
16 men, 2.3 g K (60 mmol) |
0.46 (20) |
0.3 |
|
5.6 (240) |
4 |
||
|
|
1 wk |
|
|
|
Feldman et al., 1996 |
5 subjects, 2.3 g K (60 mmol) |
0.46 (20) |
0.33 |
|
|
1 wk |
5.5 (240) |
4 |
|
Grey et al., 1996 |
34 nonobese men |
< 1.84 (80) |
|
|
1 wk |
+ 2.7 (120) |
||
|
Fuchs et al., 1987 |
11 men and women at risk for HT |
0.2–0.4 (9–17) |
|
|
|
9 d |
3.1–4.7 (135–204) |
|
|
|
6.2–7.9 (269–343) |
||
|
6 men and women not at risk of HT |
0.2–0.4 (9–17) |
||
|
9 d |
3.1–4.7 (135–204) |
||
|
|
6.2–7.9 (269–343) |
||
|
Skrabal et al., 1981 |
20 men |
1.2 (50)/7.8 (200) K |
0.25 |
|
2 wk |
1.2 (50)/3.1 (80) K |
0.6 |
|
|
|
4.6 (200)/3.1 (80) K |
2.5 |
|
|
4.6 (200)/7.8 (200) K |
1.0 |
||
|
Skrabal et al., 1984b |
52 men, 3.1 g K (80 mmol) |
1.2 (50) |
0.6 |
|
|
2 wk |
4.6 (200) |
2.5 |
|
Skrabal et al., 1985 |
62 subjects, 3.1 g K (80 mmol) |
1.2 (50) |
0.6 |
|
|
2 wk |
4.6 (200) |
2.5 |
|
Urinary Na (mmol/d) |
Urinary K (mmol/d) |
Blood Pressure SBP/DBPb (mm Hg) |
|
|
|
NTN patients |
HTN patients |
|
|
MAP |
|
||
|
18 |
|
80.7c |
|
|
199 |
81.3c |
||
|
|
MAP |
||
|
SR |
SS |
||
|
≈17 |
≈74 |
85.1c |
83.1c |
|
≈289 |
≈71 |
84.6c |
91.2d |
|
16 |
|
|
|
|
240 |
|
||
|
|
MAP |
||
|
6 |
45 |
89c |
|
|
182 |
40 |
84d |
|
|
52 |
|
||
|
185 |
|
||
|
|
At risk |
||
|
16 |
49 |
117/68 |
|
|
110 |
28 |
118/69 |
|
|
239 |
36 |
118/67 |
|
|
|
Not at risk |
||
|
8 |
42 |
111/70 |
|
|
103 |
32 |
117/68 |
|
|
245 |
32 |
116/67 |
|
|
28 |
172 |
123/69 |
|
|
40 |
65 |
122/70 |
|
|
210 |
71 |
125/73 |
|
|
155 |
116 |
123/69 |
|
|
|
SS |
SR |
|
|
≈39 |
≈88 |
||
|
≈191 |
≈69 |
||
|
|
At risk |
Not at risk |
|
|
36–45 |
86–87 |
↓ 5.4/↓ 2.5 |
↓ 1.0/↓ 0.6 |
|
189–199 |
64–74 |
|
|
|
References |
Study Designa |
Sodium (Na) Intake g/d (mmol) |
Na/Potassium (K) Ratio |
|
Zemel et al., 1986 |
16 African-American men and women |
1 (43) |
|
|
|
2 wk |
4 (174) |
|
|
Sowers et al., 1988 |
14 African-American men and women |
0.92 (40) |
|
|
|
2 wk |
4.1 (180) |
|
|
Johnson et al., 2001 |
17 elderly subjects, 0.92 g/d (40 mmol/d) Na diet + sodium dose |
0.92 (40) |
|
|
2.1 (90) |
|||
|
3.2 (140) |
|||
|
5.5 (240) |
|||
|
|
2 wk |
7.8 (340) |
|
|
Sharma et al., 1990 |
15 men, 2.3 g K (60 mmol) |
0.46 (20) |
0.3 |
|
5.1 (220) |
3.7 |
||
|
|
3 wk |
|
|
|
Kirkendall et al., 1976 |
8 men, 3.9 g K (100 mmol) |
0.23 (10) |
0.1 |
|
|
4 wk |
4.8 (210) |
2.1 |
|
|
|
9.4 (410) |
4.1 |
|
Mascioli et al., 1991 |
48 men and women, provided a placebo or sodium tablets, no diet information |
+0 |
|
|
+2.2 (96) |
|||
|
|
4 wk |
|
|
|
Ruppert et al., 1993 |
25 men and women, 2.9 g K (75 mmol) |
1.9 (85) |
1.1 |
|
4.6 (200) |
2.7 |
||
|
|
4 wk |
|
|
|
Schorr et al., 1996 |
21 elderly men and women, provided Na-containing beverage or placebo, reduced dietary salt intake < 2.3 g (100 mmol/d) |
+0 |
|
|
+2.9 g (127) |
|||
|
|
4 wk |
|
|
|
Sacks et al., 2001 |
208 men and women, DASH diet; 204 men and women, control diet |
DASH |
|
|
2.3 (100) → 1.2 (50) |
0.78 → 0.47 |
||
|
3.4 (150) → 2.3 (100) |
1.1 → 0.78 |
||
|
Control |
|||
|
|
4 wk |
2.3 (100) → 1.2 (50) |
1.5 → 0.9 |
|
|
3.4 (150) →2.3 (100) |
2.1 → 1.5 |
|
|
Urinary Na (mmol/d) |
Urinary K (mmol/d) |
Blood Pressure SBP/DBPb (mm Hg) |
|
|
|
SBP |
|
|
|
42 |
|
117c |
|
|
170 |
122d |
||
|
|
MAP |
||
|
40 |
81c |
||
|
185 |
87d |
||
|
75 |
29 |
139.4/78.4 |
|
|
136 |
32 |
145.5/78.7 |
↑ 6.1/↑ 0.3 |
|
184 |
26 |
153.1/82.4 |
↑ 13.7/↑ 4.0 |
|
259 |
35 |
156.6/82.3 |
↑ 17.2/↑ 3.9 |
|
359 |
28 |
155.9/83.9 |
↑ 16.5/↑ 5.5 |
|
19 |
51 |
|
|
|
211 |
55 |
||
|
|
MBP |
||
|
10 |
47 |
90 |
|
|
159 |
64 |
88 |
|
|
307 |
76 |
90 |
|
|
93 |
|
||
|
154 |
|
↑ 3.6/↑ 2.3 |
|
|
82 |
|||
|
199 |
|||
|
105 |
139/84 |
||
|
175 |
140/84 |
||
|
107 → 67 |
81 → 81 |
↓ 1.7/↓ 1.0 |
|
|
144 → 107 |
75 → 81 |
↓ 1.3/↓ 0.6 |
|
|
106 → 64 |
41 → 42 |
↓ 4.6/↓ 2.4 |
|
|
141 → 106 |
40 → 41 |
↓ 2.1/↓ 1.1 |
|
|
References |
Study Designa |
Sodium (Na) Intake g/d (mmol) |
Na/Potassium (K) Ratio |
|
Cappuccio et al., 1997 |
18 elderly men |
≈1.9 (83) |
|
|
8 wk |
≈3.9 (169) |
||
|
Parallel studies |
|||
|
Hargreaves et al., 1989 |
8 men |
1.2 (50) |
|
|
2 wk |
3.5 (150) |
||
|
Cobiac et al., 1992 |
106 elderly men and women |
< 1.6 (70 mmol) |
|
|
4 wk |
3.4 (150) |
||
|
Morgan and Anderson, 1987 |
20 men |
1.2–1.7 (50–75) |
|
|
6 mo |
Normal diet |
||
|
Hypertension Prevention Trial Research Group, 1990 |
841 men and women, aged 25–49 yr |
Na-kcal n = 126 |
|
|
Control |
3.3 |
||
|
6–36 mo |
Na reduction alone |
3.4 |
|
|
|
Na-K n = 196 |
|
|
|
Control |
3.2 |
||
|
|
Na reduction alone |
3.3 |
|
|
Na reduction with increased K |
3.2 |
||
|
Kumanyika et al., 1993 |
744 men and women, no diet information; behavior change counseling |
Control |
156 |
|
Na-reduced diet |
155 |
||
|
|
6–18 mo |
|
|
|
He et al., 2000 |
128 men and women |
|
|
|
18–96 mo |
Control diet |
|
|
|
|
Na-reduced diet |
||
|
TOHP Collaborative Research Group, 1997 |
594 men and women |
|
3.0 |
|
6–36 mo |
|
|
|
|
a NTN = normotensive, HTN = hypertensive. b SBP = systolic blood pressure, DBP = diastolic blood pressure, MAP = mean arterial pressure, SS = salt sensitive, SR= salt resistant. c,d Values with different superscripts differed significantly at p < 0.05. |
|||
|
Urinary Na (mmol/d) |
Urinary K (mmol/d) |
Blood Pressure SBP/DBPb (mm Hg) |
||||||
|
91 |
|
69 |
|
140/81 |
|
|||
|
167 |
65 |
148/85 |
||||||
|
49 |
94 |
|||||||
|
155 |
83 |
|||||||
|
|
|
SBP |
||||||
|
≈74 |
↓ 5.2a |
|||||||
|
≈150 |
↓ 2.4b |
|||||||
|
75c |
||||||||
|
155d |
||||||||
|
Base |
6 mo |
36 mo |
Base |
6 mo |
36 mo |
Base |
6 mo |
36 mo |
|
174 |
157 |
183 |
68 |
69 |
68 |
124.7/83.3 |
↓ 1.8/↓ 2.5 |
↓ 2.6/↓ 2.4 |
|
171 |
141 |
160 |
65 |
69 |
70 |
124.1/82.9 |
↓ 3.6/↓ 3.4 |
↓ 2.3/↓ 2.3 |
|
165 |
150 |
165 |
66 |
66 |
64 |
123.9/83 |
↓ 2.1/↓ 3.0 |
↓ 2.9/↓ 3.0 |
|
163 |
127 |
147 |
64 |
65 |
68 |
124.0/82.6 |
↓ 3.8/↓ 3.4 |
↓ 2.8/↓ 2.8 |
|
160 |
117 |
138 |
63 |
69 |
67 |
124.1/82.3 |
↓ 3.4/↓ 3.7 |
↓ 4.1/↓ 3.7 |
|
159 |
147 |
63 |
|
125.1/83.9 |
↓ 3.8/↓ 2.9 |
↓ 3.0/↓ 3.2 |
||
|
103 |
99 |
62 |
124.8/83.7 |
↓ 5.9/↓ 3.9 |
↓ 5.1/↓ 4.4 |
|||
|
Base |
18 mo |
6–8 yr |
Base |
18 mo |
6–8 yr |
|||
|
148 |
128 |
148 |
122.6/84.2 |
↓ 2.4/↓ 5.6 |
↑ 2.2/↓ 5.3 |
|||
|
148 |
95 |
137 |
122.7/83.8 |
↓ 5.7/↓ 7.2 |
↓ 1.6/↓ 7.5 |
|||
|
Base |
6 mo |
36 mo |
Base |
6 mo |
36 mo |
Base |
6 mo |
36 mo |
|
186 |
108 |
135 |
66.8 |
|
127.7/86.1 |
↓ 5.1/↓ 4.4 |
↓ 0.7/↓ 3.0 |
|
TABLE 6-13 Intervention Studies on Sodium Intake and Blood Pressure in Hypertensive Adults, in Order of Increasing Duration of Intervention
|
References |
Study Designa |
Sodium (Na) Intake g/d (mmol/d) |
Na/Potassium (K) Ratio |
|
Crossover studies |
|||
|
Kempner, 1948 |
Kempner rice diet, 400–500 patients with HT vascular disease |
≈0.15 (6)/2,000 kcal |
|
|
|
4–898 d |
|
|
|
Bruun et al., 1990 |
12 men with essential HT |
1.2 (50) |
0.62 |
|
3.1g K (80 mmol) |
4.1 (180) |
2.2 |
|
|
4 d |
8.7 (380) |
4.7 |
|
|
Resnick et al., 1985 |
12 adults with essential HT |
0.23 (10) |
0.16 |
|
2.3 g K (60 mmol) |
4.6 (200) |
0.3 |
|
|
5 d |
|
||
|
Shore et al., 1988 |
6 adults with essential HT |
0.23 (10) |
0.12 |
|
0.23 g Na (10 mmol) diet plus 2.8 g (120 mmol) Na supplements |
2.9 (130) |
1.6 |
|
|
|
3.1g (80 mmol) K |
|
|
|
5 d |
|||
|
Buckley et al., 1994 |
12 men and women with essential HT |
0.23 (10) |
|
|
|
5 d |
8.0 (350) |
|
|
Lawton et al., 1988 |
9 men with borderline HT |
0.23 (10) |
0.1 |
|
3.9 g K (100 mmol) |
9.2 (400) |
0.25 |
|
|
|
6 d |
|
|
|
Kawasaki et al., 1978 |
19 men and women |
|
|
|
2.7 g K (70 mmol) |
|||
|
|
1 wk |
0.21 (9) |
0.13 |
|
|
|
5.7 (249) |
3.6 |
|
Egan et al., 1991 |
18 men |
|
|
|
1 wk |
0.46 (20) |
|
|
|
|
|
4.6 (200) |
|
|
Zoccali et al., 1994 |
15 men and women with mild HT |
1.2 (50) |
0.77 |
|
|
2.5 g K (65 mmol) |
4.6 (200) |
3.1 |
|
|
1 wk |
|
|
|
Urinary Nab (mmol/d) |
Urinary K (mmol/d) |
Blood Pressure SBP/DBPc (mm Hg) |
||||
|
0.43 mmol/L |
88 mmol/L |
↓ 47/↓ 21 Also associated with weight loss |
||||
|
39 |
|
60 |
|
|||
|
177 |
64 |
|||||
|
370 |
69 |
|||||
|
|
||||||
|
25 |
|
56 |
|
|
||
|
122 |
60 |
↑ 9/↑ 6 |
||||
|
|
|
MAP |
||||
|
38 |
62 |
107d |
||||
|
334 |
67 |
115e |
||||
|
15 |
68 |
|||||
|
343 |
67 |
|||||
|
|
MAP |
|||||
|
SS |
SR |
SS |
SR |
SS |
SR |
|
|
3.7 |
10.5 |
56 |
63 |
105d |
110d |
|
|
215 |
259.7 |
60 |
72 |
124e |
114e |
|
|
|
MAP |
|||||
|
21 |
|
92d |
||||
|
214 |
95d |
|||||
|
|
SS |
SR |
||||
|
54 |
|
68 |
|
|||
|
217 |
60 |
|||||
|
References |
Study Designa |
Sodium (Na) Intake g/d (mmol/d) |
Na/Potassium (K) Ratio |
|
Overlack et al., 1995 |
46 men and women with essential HT |
|
|
|
|
2.9 g K (75 mmol) |
0.46 (20) |
0.27 |
|
|
1-wk crossover |
6.9 (300) |
4 |
|
|
0.46 (20) |
0.27 |
|
|
6.9 (300) |
4 |
||
|
Feldman et al., 1996 |
5 adults |
|
|
|
1 wk |
0.46 (20) |
|
|
|
|
|
5.5 (240) |
|
|
Mark et al., 1975 |
6 men with borderline HT |
0.23 (10) |
0.1 |
|
3.9 g K (100 mmol) |
9.4 (410) |
4.1 |
|
|
|
10 d |
|
|
|
Koolen and van Brummelen, 1984 |
20 men and women with essential HT |
1.2 (50) |
|
|
2 wk |
6.9 (300) |
||
|
Sowers et al., 1988 |
11 HT African-American men and women |
0.92 (40) |
|
|
|
2 wk |
4.1 (180) |
|
|
Del Rio and Rodriguez-Villamil, 1993 |
30 men and women with essential HT |
≈0.8 (35) |
|
|
≈4.7 (204) |
|||
|
2 wk |
|
||
|
Ferri et al., 1996 |
61 men with essential HT, 2.7 g K (70 mmol) |
0.46 (20) |
0.28 |
|
3.2 (140) |
2 |
||
|
|
2 wk |
7.4 (320) |
4.6 |
|
Zemel et al., 1986 |
6 HT African-American men and women |
1 (43) |
|
|
|
2 wk |
4 (174) |
|
|
Weir et al., 1995 |
22 men and women with essential HT |
0.92 (40) |
|
|
|
2 wk |
4.6 (200) |
|
|
Johnson et al., 2001 |
15 elderly subjects ISH, 0.92 g/d (40 mmol/d) Na diet + sodium dose |
0.92 (40) |
|
|
2.1 (90) |
|||
|
|
3.2 (140) |
||
|
|
2 wk |
5.5 (240) |
|
|
|
|
7.8 (340) |
|
|
Urinary Nab (mmol/d) |
Urinary K (mmol/d) |
Blood Pressure SBP/DBPc (mm Hg) |
|||||
|
|
|
MAP |
|||||
|
|
|
SS |
SR |
||||
|
22 |
|
102 |
101 |
||||
|
267 |
|
112 |
102 |
||||
|
|
|
< 45 yr |
> 45 yr |
||||
|
20 |
|
101d |
103d |
||||
|
265 |
|
100d |
108e |
||||
|
|
MAP |
||||||
|
16 |
|
98d |
|||||
|
194 |
96d |
||||||
|
5 |
72 |
||||||
|
310 |
89 |
||||||
|
|
SS |
SR |
|||||
|
57 |
70 |
143/91 |
140/90 |
||||
|
270 |
73 |
||||||
|
|
MAP |
||||||
|
34 |
|
100d |
|
||||
|
196 |
106e |
||||||
|
48 |
62 |
||||||
|
199 |
58 |
||||||
|
27 |
57 |
||||||
|
124 |
53 |
||||||
|
291 |
52 |
||||||
|
|
SBP |
||||||
|
43 |
|
134d |
|||||
|
215 |
138d |
||||||
|
|
SS |
SR |
|||||
|
100 |
|
SBP |
DBP |
MAP |
SBP |
DBP |
MAP |
|
236 |
↑ 8.7 |
↑ 6.8 |
↑ 7.4 |
↓ 4.3 |
↓ 4.1 |
↓ 3.8 |
|
|
68 |
27 |
161.5/81.1 |
↑ 9.0/↓ 0.3 |
||||
|
123 |
30 |
170.5/80.8 |
↑ 10.8/↑ 2.8 |
||||
|
180 |
30 |
172.3/83.9 |
↑ 14.9/↑ 3.1 |
||||
|
262 |
27 |
176.4/84.2 |
↑ 20.9/↑ 6.5 373 28 182.4/87.6 |
||||
|
References |
Study Designa |
Sodium (Na) Intake g/d (mmol/d) |
Na/Potassium (K) Ratio |
|
Johnson et al., 2001 |
8 elderly subjects with SDH, 0.92 g/d (40 mmol/d) Na diet + sodium dose |
0.92 (40) |
|
|
2.1 (90) |
|||
|
3.2 (140) |
|||
|
|
2 wk |
5.5 (240) |
|
|
|
|
7.8 (340) |
|
|
Parijs et al., 1973 |
22 men and women with HT |
|
|
|
|
4-wk crossover |
||
|
MacGregor et al., 1982a |
19 men and women with essential HT, Na-reduced diet + placebo or slow Na supplements |
||
|
|
4 wk |
||
|
Watt et al., 1983 |
13 men and women with mild HT |
||
|
|
4 wk |
||
|
Richards et al., 1984 |
12 men and women with mild essential HT |
1.8 (80) Na/2.3 g (60) K |
1.3 |
|
|
4 wk |
4.1 (180) Na/2.3 g (60) K |
3 |
|
|
|
4.1 (180) Na/7.8 g (200) K |
0.9 |
|
Skrabal et al., 1984a |
9 men and women with mild HT |
Low Na diet |
|
|
Normal diet |
|||
|
|
4 wk |
|
|
|
MacGregor et al., 1989 |
20 men and women with mild HT |
1.1 (50) |
|
|
|
2.3 (100) |
||
|
|
4 wk |
4.6 (200) |
|
|
Benetos et al., 1992 |
20 men and women, reduced sodium diet + placebo or 61 mmol Na supplement |
+0 (0) |
|
|
1.4 (61) |
|||
|
|
4 wk |
|
|
|
Fotherby and Potter, 1993 |
17 elderly men and women, 80–100 mmol Na diet + placebo or 80 mmol Na supplement |
1.8 (80)–2.3 (100) |
|
|
3.7 (160) |
|||
|
4.1(180) |
|||
|
|
5 wk |
|
|
|
Urinary Nab (mmol/d) |
Urinary K (mmol/d) |
Blood Pressure SBP/DBPc (mm Hg) |
|
|
78 |
28 |
156.9/98.8 |
↑ 8.0/↓ 0.4 |
|
140 |
32 |
164.9/98.4 |
↑ 12.1/↑ 0.8 |
|
191 |
29 |
169.0/99.6 |
↑ 17.5/↑ 2.4 |
|
257 |
31 |
174.4/101.2 |
↑ 18.2/↑ 5.4 |
|
376 |
32 |
175.1/104.2 |
|
|
93 |
|
|
|
|
191 |
|||
|
86 |
59 |
||
|
162 |
65 |
||
|
59 |
47 |
139/87 |
|
|
139 |
51 |
139/86 |
|
|
100 |
60 |
145/91 |
|
|
200 |
61 |
150/92 |
|
|
205 |
190 |
148/91 |
|
|
82 |
|
153/91 |
|
|
214 |
147/91 |
||
|
49 |
68 |
||
|
108 |
75 |
||
|
190 |
76 |
||
|
85 |
63 |
||
|
163 |
71 |
||
|
95 |
65 |
||
|
174 |
68 |
||
|
References |
Study Designa |
Sodium (Na) Intake g/d (mmol/d) |
Na/Potassium (K) Ratio |
|
|
Grobbee et al., 1987 |
40 young adult men and women with mildly elevated BP, no diet information, participants given placebo or 2.0 g (90 mmol) Na supplements |
+ 0 (0) |
|
|
|
+ 2.1 (90) |
||||
|
+ 0/2.8 g (72) K supplement |
||||
|
|
6 wk |
|
||
|
Cappuccio et al., 1997 |
29 elderly men |
≈1.9 (83) |
|
|
|
8 wk |
≈3.9 (169) |
|||
|
Weinberger |
114 men and women with et al., 1988 essential HT |
|
||
|
|
30 wk |
|||
|
Parallel studies |
||||
|
Mulhauser et al., 1996 |
16 men and women high normal or mildly elevated BP |
2.1 (90) |
|
|
|
4.4 (190) |
||||
|
|
4 wk |
|
||
|
Dodson et al., 1989 |
34 men and women with mild HT, no diet information |
|
||
|
3 mo |
||||
|
Jula and Karanko, 1994 |
76 men and women with mild to moderate essential HT |
|||
|
12 mo |
||||
|
Appel et al., 2001 |
681 men and women, 60–80 yr, on hypertensive medications |
Reduced sodium |
|
|
|
Usual lifestyle |
||||
|
|
2–3 yr |
|
||
|
a HT = hypertension, ISH = isolated systolic hypertension, SDH = systolic diastolic hypertension. b SBP = systolic blood pressure, DBP = diastolic blood pressure, MAP = mean arterial pressure. c SS = salt sensitive, SR= salt resistant. d,e,f Values with different superscripts differed significantly at p < 0.05. |
||||
Individual trials that tested three or more levels of sodium intake provide the best evidence to assess dose-response relationships between dietary sodium intake and blood pressure. Appendix I graphically displays results from each of the 10 trials available. Most used a randomized, crossover design. To assure fixed contrasts in sodium intake, most trials were feeding studies, which, because of logistic
|
Urinary Nab (mmol/d) |
Urinary K (mmol/d) |
Blood Pressure SBP/DBPc (mm Hg) |
|
57 |
74 |
136/73 |
|
129 |
77 |
137/73 |
|
69 |
131 |
133/72 |
|
95 |
65 |
166/91 |
|
182 |
64 |
172/94 |
|
170 → 94 |
71 → 74 |
137/87 → 127/81 |
|
92 |
85 |
|
|
199 |
94 |
↑ 4.9/↑ 5.3 |
|
137 |
64 |
|
|
181 |
68 |
|
|
109 |
84 |
134/89 |
|
166 |
83 |
135/92 |
|
144 → 99 |
|
↓ 4.3/↓ 2.0 |
|
145 → 140 |
|
|
considerations, are necessarily brief in duration. No trial lasted for more than one month, and several lasted only a few days (see Appendix Table I-2). In most trials, the sample size was small, typically less than 20 persons. Hence there is a substantial risk of inadequate power and false negative results.
Of the available dose-response trials, the study by Luft and col-
leagues (1979b) tested the broadest range of sodium intake (0.23 to 34.5 g [10 to 1500 mmol]/day of sodium), albeit in just 14 individuals. Only two trials (Ferri et al., 1996; Sacks et al., 2001) enrolled over 50 persons, but the trial by Ferri and colleagues only enrolled hypertensive individuals. The trial by MacGregor and coworkers (1989) is a well-controlled trial that documented a direct, progressive relationship between sodium intake and blood pressure, but the trial enrolled only 20 individuals, all of whom were hypertensive. The trial by Johnson and colleagues (2001) tested increasing levels of sodium intake from baseline by giving four different levels of sodium chloride (range of total intake: 0.9 g [40 mmol]/day to 14.8 g [340 mmol]/day) in 46 individuals, 60 years of age and older; in each blood pressure stratum (nonhypertension, isolated systolic hypertension, and systolic-diastolic hypertension), there were significant, progressive, dose-response relationships between sodium intake and blood pressure.
A detailed overview of the trial by Sacks and colleagues (2001) is warranted in view of its size, duration, and other design features. This trial, termed the DASH-Sodium study, was a feeding study designed to test the effects on blood pressure of three levels of sodium intake (an average of 1.2, 2.3, and 3.5 g [50, 100, and 150 mmol]/day of sodium/2,100 kcal) separately in two distinct diets—the DASH (Dietary Approaches to Stop Hypertension) diet and a control diet (See Figure I-14 in Appendix I and corresponding Tables I-1a, b, c). The DASH diet is rich in fruits, vegetables, and low-fat dairy products and is reduced in saturated and total fat; accordingly, it is rich in potassium, magnesium, and calcium (corresponding to the 75th percentile of U.S. intake) (Appel et al., 1997). In contrast, the potassium, magnesium, and calcium levels of the control diet corresponded to the 25th percentile of U.S. intake, while its macronutrient profile and fiber content were similar to average U.S. consumption (Appel et al., 1997; Craddick et al., 2003) (see Table 6-9). A total of 412 participants enrolled; of these, 41 percent were hypertensive, 40 percent were white, and 57 percent were African American (Sacks et al., 2001).
Study participants were randomly assigned to the control or DASH diet, and, within their assigned diet, participants ate higher, intermediate, and lower sodium levels, each for 30 days in random order. By design, in the 2,100-kcal version of the diets, the higher sodium level was 3.5 g (150 mmol)/day of sodium. Thus the higher sodium level reflected typical U.S. adult consumption. The intermediate sodium level was 2.3 g (100 mmol)/day for the 2,100-kcal version, reflecting the upper limit of various recommendations
made in the United States (JNC, 1997). The lower level was 1.2 g (50 mmol)/day for 2,100 kcal (Sacks et al., 2001). The average achieved levels of sodium intake, as reflected by 24-hour urinary sodium excretion, were 142, 107, and 65 mmol/day, respectively, corresponding to approximate intakes of 3.3 g, 2.5 g, and 1.5 g, respectively (Sacks et al., 2001). Urinary potassium excretion averaged 79 and 41 mmol/24 hours on the DASH and control diets, respectively, and did not differ by level of sodium intake.
The main results of the DASH-Sodium trial (Sacks et al., 2001) are displayed in Appendix I—Figure I-14 and Tables I-la,b,c. On the control diet (Figure I-14 and Tables I-1a and 1c), reducing sodium intake from the higher (≈ 3.3 g) to the intermediate level (≈ 2.3 g) lowered systolic blood pressure by an average of 2.1 mm Hg (p < 0.001), while further lowering sodium intake from the intermediate to the lower level of sodium (1.2 g) led to an additional systolic blood pressure reduction of 4.6 mm Hg (p < 0.001). On the DASH diet (Figure I-14, Tables I-1a and 1b), corresponding reductions in systolic blood pressure were 1.3 (p < 0.05) and 1.7 mm Hg (p < 0.01), respectively. Hence decreasing sodium intake by approximately 0.92 g (40 mmol)/day caused a greater lowering of blood pressure when the starting sodium intake was at the intermediate level than when it was at a higher intake similar to the U.S. average.
The trial by Sacks and colleagues (2001) also provided an opportunity to assess the impact of sodium reduction in relevant subgroups (Vollmer et al., 2001; see Table 6-14). On the control diet, significant blood pressure reduction was evident in each subgroup. Reduced sodium intake led to greater systolic blood pressure reduction in individuals with hypertension compared with those classified as nonhypertensive, African Americans compared with non-African Americans, and older individuals (> 45 years old compared with those ≤ 45 years old). On the DASH diet, a qualitatively similar pattern was evident; however, some sub-group analyses did not achieve statistical significance, perhaps as a result of small sample size. Comparing the combined effect of the DASH diet with lower sodium with the control diet with higher sodium, the DASH diet with lower sodium reduced systolic blood pressure by 7.1 mm Hg in nonhypertensive persons and by 11.5 mm Hg in individuals with hypertension.
Other key findings emerged related to the dose-response relationship of sodium with blood pressure from the DASH-Sodium trial. First, the blood pressure response to sodium reduction was nonlinear, that is, there was a steeper decline in blood pressure when sodium was reduced from 2.3 g (100 mmol)/day to 1.2 g (50
TABLE 6-14 Effects on Systolic Blood Pressure of Reducing Dietary Sodium from the Higher to the Lower Levels in the Control Diet and the (DASH) Diet
|
Subgroup |
na |
Effect of Lower Minus Higher Sodium in the Control Diet |
Effect of Lower Minus Higher Sodium in the DASHb Diet |
|
Hypertension statusc |
|||
|
Hypertensive |
85/83 |
−8.3 (−10.0 to −6.6)d |
−4.9 (−6.6 to −3.3)e |
|
Nonhypertensive |
123/121 |
−5.6 (−7.0 to −4.1) |
−1.7 (−3.1 to −0.3) |
|
Race |
|||
|
African American |
119/115 |
−8.0 (−9.4 to −6.5)d |
−3.6 (−5.1 to −2.2) |
|
Non-African American |
89/89 |
−5.1 (−6.7 to −3.4) |
−2.2 (−3.8 to −0.5) |
|
Sex |
|||
|
Female |
123/111 |
−7.5 (−9.0 to −6.0) |
−4.0 (−5.4 to −2.5)d |
|
Male |
85/93 |
−5.7 (−7.3 to −4.1) |
−1.7 (−3.4 to 0.0) |
|
Age |
|||
|
> 45 yr |
111/129 |
−7.5 (−8.9 to −6.1)c |
−4.5 (−6.0 to −3.0) |
|
≤ 45 yr |
97/75 |
−5.3 (−7.0 to −3.5) |
−1.4 (−2.9 to +0.2) |
|
Body mass index |
|||
|
Obese (≥ 30 kg/m2) |
78/82 |
−6.9 (−8.6 to −5.1) |
−1.8 (−3.6 to 0.0) |
|
Nonobese (< 30 kg/m2) |
130/122 |
−6.6 (−8.0 to −5.1) |
−3.7 (−5.1 to −2.3) |
|
a Number in DASH diet arm/number in control diet arm. b DASH = Dietary Approaches to Stop Hypertension. c Hypertensive patients had a SBP ≥ 140 mm Hg or diastolic BP ≥ 90 mm Hg. d p < 0.05 for comparing subgroup differences. e p < 0.01 for comparing subgroup differences. NOTE: Data expressed as mean (95% confidence interval) systolic blood pressure (SBP) mm Hg. All models included adjustment for baseline SBP, site, feeding cohort, and carryover effects. Unadjusted for other subgroups. SOURCE: Adapted with permission from Vollmer et al. (2001). Copyright 2001 by American College of Physicians. |
|||
mmol)/day than when sodium is reduced from 3.4 g (150 mmol)/day to 2.3 g (100 mmol)/day (Sacks et al., 2001). Second, the DASH diet, compared with the control diet, blunted the effects of sodium on blood pressure, that is, over the same range of sodium intake, lowering sodium from 3.4 to 1.2 g (150 to 50 mmol)/day reduced blood pressure to a smaller extent on the DASH diet than on the control diet. Such findings, which may in part be a result of the higher potassium content of the DASH diet, are consistent with other studies that have documented that increased potassium
intake blunts the rise in blood pressure from sodium loading (Morris et al., 1999; see Chapter 5).
In addition to the 10 trials that directly tested three or more levels of sodium intake, the Trials of Hypertension Prevention–Phase 1 (Kumanyika et al., 1993) also assessed dose-response in post-hoc analyses based on achieved levels of sodium reduction (Figure 6-5). In this 18-month randomized trial in which 327 nonhypertensive individuals were assigned to a reduced sodium behavioral intervention and 417 individuals were assigned to a control group, there was a mean net reduction in urinary sodium excretion of 44 mmol (1.0 g)/day, as well as concurrent systolic/diastolic blood pressure reductions of 2.1/1.2 mm Hg. From the lowest quintile of sodium excretion at 18 months (< 65 mmol [1.5 g]/24 hours) to the highest (> 178 mmol [4.0 g]/24 hours), there were significant, direct dose-response relationships for both systolic and diastolic blood pressure. In analyses that corrected for intraperson variability in sodium excretion and blood pressure, the estimated average systolic and diastolic blood pressure reductions per 100 mmol (2.3 g)/
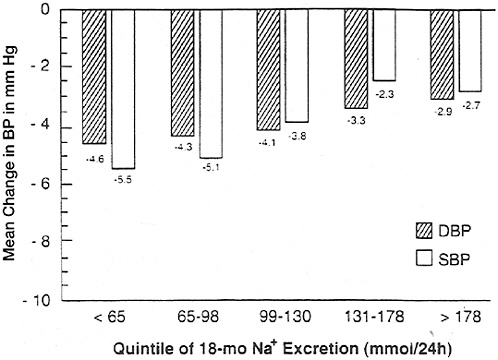
FIGURE 6-5 Mean change in diastolic blood pressure (DBP) and systolic blood pressure (SBP) from baseline for nonhypertensive individuals by quintile of urinary sodium excretion at 18 mo following a reduced sodium behavioral intervention program.
SOURCE: Kumanyika et al. (1993).
24-hour reduction in sodium excretion were 4.4/2.8 mm Hg (Cook et al., 1998).
Overall, available dose-response trials are consistent with a direct, progressive, dose-response relationship between sodium intake and blood pressure across a broad range of intake. This was clearly evident in the DASH-Sodium trial (Sacks et al., 2001), which was the largest trial and the study with the narrowest range of sodium intake (range: 1.2 g to 3.4 g [50 to 150 mmol]/day). A progressive relationship was also apparent in two smaller studies that tested four or more sodium levels across a broader range of sodium intake (range: 0.23 to 34.5 g [10 mmol to 1,500 mmol]/day [Luft et al., 1979b]; range: 0.92 to 7.82 g [40 to 340 mmol]/day [Johnson et al., 2001]). No trial tested multiple sodium levels below 2.3 g (100 mmol)/day. However, observational analyses of the four isolated populations in the Intersalt study suggest a progressive relationship for systolic blood pressure at urinary sodium levels between less than 0.02 g (1 mmol)/day in the Yanomamo Indians and 1.2 g (51 mmol)/day in Kenyans (Mancilha-Carvalho and Souza e Silva, 2003).
Effects of Sodium Intake on Blood Pressure: Evidence from MetaAnalyses of Intervention Studies. Several meta-analyses of clinical trials have been conducted to assess the effects of sodium intake on blood pressure (Table 6-15). Typically, these studies estimate the ratio of the average change in blood pressure to observed average change in sodium intake. However, such ratios cannot be used to assess dose response unless the relationship is linear. For sodium, available evidence indicates that it is nonlinear (Sacks et al., 2001).
The earliest meta-analyses aggregated data across a wide range of study designs, from very brief feeding studies lasting a few days to long-term behavioral intervention studies lasting a year or more. These meta-analyses have provided consistent evidence that a reduced sodium intake lowers systolic and diastolic blood pressure in hypertensive individuals. However, the extent of blood pressure reduction in nonhypertensive individuals is less consistent. In the largest of these meta-analyses (Cutler et al., 1997; Graudal et al., 1998; Midgley et al., 1996), the average decrease in systolic/diastolic blood pressure per 100 mmol (2.3 g) reduction in daily sodium excretion in hypertensive individuals was 5.8/2.5, 3.3/1.6, and 3.7/0.9 mm Hg, respectively. The corresponding reductions in systolic/diastolic blood pressures in nonhypertensive persons were 2.3/1.4, 0.8/0.2, and 1.0/0.1 mm Hg, respectively.
In view of the substantial heterogeneity in study design, subsequent meta-analyses focused on distinct types of trials or popula-
tions. One meta-analysis focused on trials conducted in older-aged persons (mean age close to 60 years) (Alam and Johnson, 1999). In this meta-analysis, which included both nonhypertensive and hypertensive persons, sodium reduction significantly lowered systolic and diastolic blood pressure by 5.58 and 3.5 mm Hg, respectively. The effect was more pronounced in trials that exclusively enrolled individuals older than age 60.
A meta-analysis was conducted to assess the effect of modest sodium reduction to levels that would be relevant to public health decision-making (He and MacGregor, 2002). Trials of brief duration and those with extremely low sodium intakes were excluded. All of the included trials lasted 4 or more weeks, and many were controlled feedings studies. In aggregate, a median sodium reduction of approximately 1.7 g (75 mmol)/day led to significant reductions in systolic and diastolic blood pressure of 2.0 and 1.0 mm Hg in non-hypertensive individuals (11 trials) and 5.0 and 2.7 mg Hg in hypertensive patients (17 trials) (He and MacGregor, 2002).
Another meta-analysis assessed the long-term effects of advice to reduce sodium intake (Hooper et al., 2002). This meta-analysis has also been published as a Cochrane Review (Hooper et al., 2003). Most included trials used intensive behavioral interventions in free-living individuals. By design, the authors included only trials that lasted 6 or more months. The total duration of the trials ranged from 6 months to 7 years. Net reduction in urinary sodium excretion as the result of the behavioral interventions was 35.5 mmol (0.8 g)/24 hours, roughly half the net reduction observed in the metaanalysis by He and MacGregor (2002). On average, systolic and diastolic blood pressure reductions were 1.1 (p = 0.002) and 0.6 (p = 0.19) mm Hg, respectively. This meta-analysis documents the difficulties of sustaining a reduced sodium intake in free-living persons over the long-term. Because of the limited net reduction in sodium intake as evidenced by attained urinary sodium excretion, the efficacy of sodium reduction as a means to lower blood pressure cannot be assessed from this analysis.
Primary Prevention of Hypertension. Almost 50 million adult Americans, or approximately 25 percent of the U.S. adult population, have hypertension, defined as a systolic blood pressure > 140 mm Hg, diastolic blood pressure > 90 mm Hg, and/or current use of antihypertension medication (Burt et al., 1995; Hajjar and Kotchen, 2003). In Canada, approximately 27 percent of adults 35 to 64 years old have hypertension (Wolf-Maier et al., 2003). Above-normal blood pressure in the nonhypertensive range, that is, systolic blood
TABLE 6-15 Meta-analyses of Studies on Sodium/Salt Intake and Blood Pressure
|
Resultsa |
|
Decreased BP by 1.7 ± 1.0; 1.0 ± 0.7 mm Hg (systolic and diastolic, respectively, with 95% confidence limits) in NT individuals and 4.9 ± 1.3; 2.6 ± 0.8 mm Hg in HT subjects |
|
Reducing daily sodium (Na) intake by 1.2 g (50 mmol) in individuals aged 50–59 yr lowered SBP by an average of 5 mm Hg, and by 7 mm Hg in individuals with hypertension (SBP ≥170 mm Hg); a reduction in DBP was about half of the values above |
|
For NT individuals, 2.3 g/d (100 mmol/d) reduction in daily Na excretion resulted in 1.0 mm Hg and 0.1 mm Hg reduction in SBP and DBP, respectively |
|
The decrease in BP for a 100 mmol/d (2.3 g/d) reduction in daily Na excretion was 3.7 mm Hg for SBP and 0.9 mm Hg for DBP for HT individuals |
|
A decrease of 45 mmol/d (1.0 g/d) of urinary Na resulted in a decrease in SBP and DBP by 1.9 and 1.2 mm Hg, respectively |
|
Lowering Na resulted in a reduction in SBP and DBP of: (1) 1.9 and 1.1 mm Hg respectively in NT subjects; (2) 4.8 and 2.5 mm Hg respectively in HT subjects |
|
A reduction in urinary Na excretion was related to decreases in SBP and DBP of: (1) 1.2 and 0.26 mm Hg, respectively, in NT individuals; (2) 3.9 and 1.9 mm Hg respectively in HT patients |
|
A high sodium chloride diet significantly increased SBP and DBP by 5.58 and 3.5 mm Hg, respectively |
|
A median reduction of urinary Na of 1.7 g/d (74 mmol/d) in NT and of 1.8 g/d (78 mmol/d) in HT led to decreased SBP and DBP of 2.0 and 0.97 mm Hg for NT and 4.96 and 2.7 mm Hg for HT |
|
SBP and DBP were reduced by 1.1 and 0.6 mm Hg with a reduced urinary Na of 35 mmol/d (0.8 g/d) |
|
Degree of reduction in Na intake was not related to change in BP |
|
Median reduction of 77 mmol (1.8 g)/d reduced SBP by 4.1 mm Hg and DBP by 2.5 mm Hg |
|
SBP/DBP reduction in HT and NT were 5.2/3.7 mm Hg and 1.3/1.1 mm Hg, respectively |
pressure of 120 to 139 mm Hg or diastolic blood pressure of 80 to 90 mm Hg, has been found to confer excess cardiovascular disease risk (see Figure 6-4). It has been estimated that almost one-third of blood pressure-related deaths from coronary heart disease are estimated to occur in individuals with blood pressure in this range (Stamler et al., 1993).
The prevalence of hypertension rises progressively with age, such that more than half of all Americans 60 years of age or older have hypertension (Hajjar and Kotchen, 2003). Among nonhypertensive adults, the estimated lifetime risk of developing hypertension is 0.9 (Vasan et al., 2002). The rise in blood pressure with age, while commonplace in Western countries, is not universal, as there are non-Western populations, as well as some Western populations (e.g., strict vegetarians), in which the rise in blood pressure with age is minimal or nonexistent (Rose et al., 1988; Sacks et al., 1974). In ecologic observational studies, a reduced intake of sodium and an increased intake of potassium have been associated with a blunted age-related rise in blood pressure (Rose et al., 1988).
Primary prevention of hypertension has been suggested as an opportunity to interrupt and prevent the continuing and costly cycle of managing hypertension and its consequences (NHBPEP, 1993; Whelton et al., 2002). Hypertension can be prevented by complementary application of strategies aimed at achieving a downward shift in the distribution of blood pressure in the general population (population-based strategy) and more intensive targeted strategies aimed at achieving a greater reduction in blood pressure in individuals and groups at greater risk for high blood pressure (intensive targeted strategy) (Whelton et al., 2002). Because the health benefits of a population strategy are applied to large numbers, even small downward shifts in the distribution of blood pressure can be expected to result in a substantial reduction in the burden of illness in the population being targeted (Rose, 1985; Whelton et al., 2002). For example, a downward shift in the population distribution of systolic blood pressure by 2 mm Hg would be expected to result in an annual reduction of 6 percent in mortality from stroke and 4 percent from coronary heart disease (Stamler, 1991). The corresponding estimates would be 8 and 5 percent for a 3-mm Hg downward shift in the population distribution of systolic blood pressure, and 14 and 9 percent for a 5 mm Hg shift (Stamler, 1991). Sodium reduction is one of several nutritional therapies that have been proposed as a means to reduce blood pressure and thereby affect a downward shift of blood pressure in the population (Chobanian et al., 2003). Weight control, moderation of alcohol intake, and con-
sumption of the DASH diet, which is rich in potassium and other minerals, have also been included as part of a comprehensive nutritional approach to reduce blood pressure.
To date, three trials have explored the effects of a reduced sodium intake as a means to prevent hypertension (Hypertension Prevention Trial [HPT], Trial of Hypertension Prevention Phase I [TOHP1], and Phase II [TOHP2]). HPT and TOHP1 were pilot studies, conducted to inform the design of TOHP2. Each study was a controlled trial in which there was a behavioral intervention that focused exclusively on reducing sodium intake. In HPT and TOHP2, there were also groups that simultaneously implemented other interventions: increased potassium intake in HPT and weight loss in TOHP2. As shown in Table 6-16, net reductions in urinary sodium excretion on the sodium reduction arm were modest in the three studies, ranging from 13 to 57 mmol/day, at the end of follow-up. In this setting, the relative risk of incident hypertension associated with a reduced sodium intervention that did not include any other lifestyle change ranged from 0.69 to 0.82.
Results from TOHP2 are especially relevant because this trial was designed to test the effects of a reduced dietary sodium intervention as a means to prevent hypertension. TOHP2 was a randomized, controlled 2 × 2 factorial trial that tested the effects of three behavioral interventions (sodium reduction, weight loss, or combined weight loss and sodium reduction) on blood pressure and incident hypertension over 3 to 4 years of follow-up in overweight individuals aged 30 to 54 years with an initial diastolic blood pressure of 83 to 89 mm Hg and a systolic blood pressure < 140 mm Hg. At 6 months, the height of intervention adherence, the incidence of hypertension was lowest in the combined group (2.7 percent), intermediate in the weight loss (4.2 percent) and sodium reduction (4.5 percent) groups, and highest in the control group (7.3 percent). At 18 months, the pattern persisted. By the end of follow-up, the incidence of hypertension was 18 to 22 percent less in each behavioral intervention group (p < 0.05 compared with control), but not different when compared with each other. Results of this trial indicate that behavioral interventions can prevent hypertension over the long-term. Also, the pattern of incident hypertension at 6 and 18 months suggests that the effects of weight loss and reduced sodium intake, under optimal conditions of adherence, may be additive.
It is important to note that a major barrier to the achievement of greater reductions in blood pressure and reductions in the associated cardiovascular disease complications is reliance on behavioral interventions to reduce dietary intake of sodium. In contrast to the
TABLE 6-16 Effect of Behavioral Interventions Designed to Test the Effect of Sodium Reduction on Preventing Hypertension
|
Study |
n |
Duration (mo) |
Baseline Sodium (Na) Excretion (mmol/d) |
|
Hypertension Prevention Trial (Hypertension Prevention Trial Research Group, 1990) |
|
||
|
Control (overweight stratum) |
126 |
36 |
174 |
|
Sodium reduction alone (overweight stratum) |
126 |
36 |
171 |
|
Control (nonoverweight stratum) |
196 |
|
165 |
|
Sodium reduction alone (nonoverweight stratum) |
196 |
36 |
163 |
|
Sodium reduction with increased potassium (nonoverweight stratum) |
196 |
|
160 |
|
Trials of Hypertension Prevention-Phase I (TOHP Collaborative Research Group, 1992a, 1992b) |
|
||
|
Control |
417 |
|
156 |
|
Sodium reduction alone |
327 |
18 |
154 |
|
Trials of Hypertension Prevention—Phase II (TOHP Collaborative Research Group, 1997) |
|
||
|
Control |
596 |
36–48 |
188 |
|
Sodium reduction alone |
594 |
|
186 |
|
Weight loss alone |
595 |
181 |
|
|
Sodium reduction with weight loss |
597 |
179 |
|
short-term (3-day) feeding trials that could achieve contrasts in sodium intake of nearly 34.3 g (1490 mmol)/day (Luft et al., 1979a, 1979b), the maximum contrast in the primary prevention trials was 1.3 g (57 mmol)/day in TOHP1 (see Table 6-16). Greater and more sustainable reductions in sodium intake could be expected from a diminution in the amount of sodium added during food processing (approximately 80 percent of sodium consumed in westernized countries is derived from food products) rather than via reduction in sodium used during cooking or at the table (Sanchez-
|
Net Achieved Na Excretion (mmol/d) |
Net Na Excretion Reduction (mmol/d) |
Relative Risk of Hypertension Relative to Control Group |
|||
|
6 mo |
End of Follow-up |
6 mo |
End of Follow-up |
||
|
157 |
183 |
|
1.00 |
||
|
141 |
160 |
−19 |
−13 |
0.69 (p = 0.066, comparing all groups in overweight strata) |
|
|
150 |
165 |
|
|||
|
127 |
147 |
−16 |
−21 |
0.73 (p = 0.01, comparing all groups in nonoverweight strata) |
|
|
117 |
138 |
−22 |
−29 |
0.65 |
|
|
159 |
145 |
|
|||
|
98 |
99 |
−72 |
−57 |
0.76 (95% confidence interval: 0.49–1.18) |
|
|
|
6 mo Results |
End of Study Results |
|||
|
177 |
|
1.00 |
1.00 |
||
|
108 |
135 |
−50 |
−40 |
0.61 (p = 0.04) |
0.82 (p = 0.05) |
|
163 |
172 |
9 |
2 |
0.58 (p = 0.02) |
0.79 (p = 0.02) |
|
115 |
145 |
−37 |
−24 |
0.37 (p < 0.001) |
0.78 (p = 0.01) |
Castillo, 1987). Given the current market availability of lower-sodium food products, careful selection is necessary to lower sodium intake.
Stroke and Coronary Heart Disease
A strong positive association between salt intake and cardiovascular disease, especially stroke, has been documented in a variety of animal models (Chen et al., 1997; Coyle, 1988). In humans, a simi-
lar association between salt intake and evidence of stroke has been noted in most cross-sectional studies (Ikeda et al., 1986; Perry and Beevers, 1992; Sasaki et al., 1995; Yamori et al., 1994; Yang et al., 1997) (see Table 6-17). In Japan, a public health campaign to reduce average dietary sodium intake was associated with a significant reduction in the prevalence of hypertension and hemorrhagic stroke, a major cause of death in this population before sodium intake decreased (Yamori and Horie, 1994). Increased sodium intake has also been associated with increased left ventricular mass, a subclinical form of cardiovascular disease (Liebson et al., 1993).
Results of prospective studies have been less consistent, primarily because of methodological limitations. Early reports did not find a significant relationship between dietary sodium intake and risk of stroke (Kagan et al., 1985), but statistical power in these studies was limited. To a large extent, inadequate power reflects the imprecision associated with most approaches to the measurement of habitual sodium intake. In particular, a high ratio of intraindividual to interindividual variation in sodium intake, which is commonplace in westernized populations (Liu et al., 1979), tends to diminish statistical power and the ability to detect even clinically important associations. Hence, large cohorts are needed in order to yield meaningful results.
Two epidemiological studies published by Alderman and coworkers (1995, 1998b) have been interpreted as providing evidence that low sodium diets have an adverse effect on human health. In the first of these studies, Alderman and colleagues (1995) reported the presence of a significant inverse association between urinary sodium excretion and incident myocardial infarction in a prospective cohort study conducted in 2,937 treated hypertensive patients. As indicated in an accompanying editorial and in subsequent communications, however, the assessment of sodium intake and imprecision in the measurement of potentially confounding variables might have contributed to the occurrence of this unexpected finding (Cook et al., 1995b; MacGregor, 1996).
Urinary sodium excretion as obtained and reported in this study did not represent habitual dietary sodium intake. First, participants were advised to reduce their sodium intake prior to the collection of urine. After 5 days on a reduced sodium intake, urinary sodium excretion was measured. Second, there is evidence of differential noncompliance in that creatinine excretion in the lowest quintile of sodium excretion was markedly and unexpectedly lower, thus indicating a high probability of incomplete urine col-
lections. Hence, the interpretation of the urinary sodium data in this study is uncertain.
Other findings from this study complicate its interpretation. The relationship between urinary sodium excretion and myocardial infarction was inverse in men, but direct in women. Plasma renin concentrations did not increase proportionately to the reduction in sodium excretion as might be anticipated. Also, the study was conducted in hypertensive patients who were enrolled in a work-site treatment program, making it difficult to know whether the findings would have general application. While the authors have responded to these concerns (Alderman and Laragh, 1996), interpretation of the findings from this study remains difficult.
In a second study, Alderman and colleagues (1998b) took advantage of the large sample size, nutrient intake database, and prolonged follow-up of participants in the National Health and Nutrition Examination Survey I (NHANES I) Epidemiologic Follow-up Study to examine the relationship between sodium intake as obtained from self-reported dietary information and the subsequent risk of cardiovascular disease. They identified an inverse relationship between sodium intake and mortality from cardiovascular diseases (p = 0.09) and all causes (p < 0.007), but a positive relationship between sodium:calorie ratio and mortality from cardiovascular diseases (p = 0.006) and all causes (p = 0.004).
In addition to the inconsistency between the direction of the association with the two methods of estimating sodium intake (directly, or as adjusted based on estimated energy intake), several methodological concerns make it difficult to interpret the findings. Participants with a baseline history of cardiovascular diseases were included in the main analysis, albeit such participants might be expected to have changed their dietary intake of sodium prior to dietary assessment. Acute rheumatic fever, chronic rheumatic heart disease, and diseases of the pulmonary circulation were included as cardiovascular mortality outcomes, although the biological basis for a relationship between sodium intake and these diseases is not obvious. As in the prior report by Alderman and colleagues, there is again evidence of differential completeness of dietary data. Of greatest concern is the fact that the highly correlated variables of sodium intake, caloric intake, and sodium:calorie ratio were simultaneously included in the same multivariate model. The authors have responded to these criticisms (Alderman et al., 1998a).
In contrast to the studies reported by Alderman and colleagues, other prospective studies either did not identify an association between sodium intake and cardiovascular disease or identified a sig-
TABLE 6-17 Observational Studies of Sodium Intake and Risk of Stroke or Coronary Heart Disease (CHD)
|
Reference |
Study Design |
Sodium (Na) Intakea (g/d) |
|
|
Stroke |
|||
|
Kagan et al., 1985 |
Prospective cohort, 10-yr follow-up, n = 7,895 Japanese men, multivariate analysis |
|
|
|
Perry and Beevers, 1992 |
Intersalt study, cross-sectional, n = 3,942 men and women |
||
|
Yamori et al., 1994 |
CARDIAC Study, cross-sectional, 14 countries |
||
|
Sasaki et al., 1995 |
Cross-sectional data collected from 24 published studies |
||
|
Alderman et al., 1997 |
Prospective cohort, 3.8-yr follow-up, 2,937 men and women |
Urinary Na (mmol/24 h) |
|
|
Men |
|||
|
Q1 |
< 89 |
||
|
Q2 |
89–126 |
||
|
Q3 |
127–174 |
||
|
Q4 |
> 174 |
||
|
Women |
|||
|
Q1 |
< 66 |
||
|
Q2 |
66–97 |
||
|
Q3 |
98–138 |
||
|
Q4 |
> 138 |
||
|
Yang et al., 1997 |
Cross-sectional, 13 target populations in China |
|
|
|
He et al., 1999 |
NHANES I, prospective cohort, n = 9,485, multivariate analysis |
Nonoverweight |
|
|
Q1 |
1.97 |
||
|
Q2 |
3.0 |
||
|
Q3 |
3.87 |
||
|
Q4 |
5.6 |
||
|
Overweight |
|||
|
Q1 |
1.8 |
||
|
Q2 |
2.7 |
||
|
Q3 |
3.5 |
||
|
Q4 |
5.1 |
||
|
Resultsb |
Other Results and Comments |
|
No association was found between urinary Na and incidence of stroke |
|
|
Significant positive association between Na excretion and stroke mortality (p < 0.008) |
|
|
Significant positive correlation between Na excretion and stroke mortality in men (p < 0.01) |
|
|
Positive correlation between urinary Na and rate of stroke mortality (p < 0.01 to p < 0.001) |
|
|
RR for Stroke |
|
|
1.0 |
|
|
1.6 |
|
|
1.0 |
|
|
0.5 |
|
|
Positive correlation between Na intake and stroke mortality (p = 0.029) |
|
|
RR for Stroke |
RR for CHD |
|
1.0 |
1.0 |
|
1.05 |
1.34 |
|
0.93 |
1.05 |
|
0.95 |
1.06 |
|
p trend = 0.47 |
p trend = 0.77 |
|
1.0 |
1.0 |
|
1.28 |
0.96 |
|
1.64 |
1.0 |
|
1.51 |
0.97 |
|
p trend = 0.02 |
p trend = 0.86 |
|
Among overweight individuals, a 2.3-g (100 mmol/d) increase in Na was associated with a 32% increase in stroke incidence (and 89% increase in stroke mortality) |
|
|
Reference |
Study Design |
Sodium (Na) Intakea (g/d) |
|
|
Coronary heart disease |
|||
|
Ikeda et al., 1986 |
Cross-sectional, 1,310 men and women from 49 regions in Japan |
|
|
|
Alderman et al., 1997 |
Prospective cohort, 3.8-yr follow-up, 2,937 men and women |
Urinary Na (mmol/24 h) |
|
|
Men |
|||
|
Q1 |
< 89 |
||
|
|
Q2 |
89–126 |
|
|
Q3 |
127–174 |
||
|
Q4 |
> 174 |
||
|
Women |
|||
|
Q1 |
< 66 |
||
|
Q2 |
66–97 |
||
|
Q3 |
98–138 |
||
|
Q4 |
> 139 |
||
|
Tunstall-Pedoe et al., 1997 |
Scottish Heart Health Study, prospective, n = 11,629 men and women, 7.6 yr of follow-up |
Urinary Na (mmol/L/d) |
|
|
Men |
|||
|
Q1 |
46.8 |
||
|
Q2 |
129.6 |
||
|
|
Q3 |
168.4 |
|
|
Q4 |
204.1 |
||
|
Q5 |
251.3 |
||
|
Women |
|||
|
Q1 |
37.8 |
||
|
Q2 |
98.0 |
||
|
Q3 |
123.4 |
||
|
Q4 |
149.0 |
||
|
Q5 |
187.3 |
||
|
Alderman et al., 1998b |
NHANES I prospective cohort, 17- to 21-yr follow-up, n = 11,346 men and women, not energy adjusted |
Q1 |
1.44 |
|
Q2 |
2.13 |
||
|
Q3 |
2.66 |
||
|
Q4 |
3.83 |
||
|
Tuomilehto et al., 2001 |
Prospective cohort, 2,436 men and women |
|
|
|
a Q = quartile or quintile. b RR = relative risk. c CHD = coronary heart disease. |
|||
|
Other Results and Comments |
|
|
There was a significant positive correlation between Na intake and mortality from CVD, cerebral infarction, and subarachnoid hemorrhage; |
|
|
Also a positive association between Na and Na:Potsssium ratio and ischemic heart disease mortality |
|
|
RR for CVD |
|
|
1.0 |
|
|
2.7 |
|
|
1.0 |
|
|
0.4 |
|
|
RR for CHD |
Over 7.6 yr of follow-up, there was a significant positive association between urinary Na and incidence of CHD in women only (0.01 ≤ p <0.05) |
|
1 |
|
|
1.18 |
|
|
1.11 |
|
|
1.26 |
|
|
1.23 |
|
|
1 |
|
|
0.93 |
|
|
0.97 |
|
|
1.09 |
|
|
1.76 |
|
|
CVD mortality/100 person yr |
|
|
11.8 |
Significant inverse association (p < 0.0019) |
|
10.0 (estimated from graph) |
|
|
10.4 (estimated from graph) |
|
|
9.6 |
|
|
Adjusted hazard ratios for CHD, CVD, and all-cause mortality in men and women associated with a 100 mmol/d increase in urinary Na excretion were 1.56, 1.36, and 1.22, respectively |
Significant, direct relationships of urinary Na excretion with cardiovascular outcomes in overweight persons; nonsignificant in nonoverweight individuals |
nificant direct association. In analyses of the Multiple Risk Factor Intervention Trial (MRFIT), there were no significant relationships between sodium intake (as assessed by multiple 24-hour dietary recalls) and mortality from total cardiovascular disease, coronary heart disease, or stroke (Cohen et al., 1999). During the initial 7.6 years of follow-up in the Scottish Heart Health Study, there was no significant relationship between sodium intake and coronary heart disease events in men, but a significant positive relationship in women (Tunstall-Pedoe et al., 1997); these analyses were only adjusted for age.
Several epidemiological and clinical studies have suggested that overweight persons may be more sensitive to the effects of sodium on blood pressure (Altschul et al., 1981; He et al., 1994; Rocchini et al., 1989). In this setting, two prospective studies examined the effects of sodium intake on cardiovascular outcomes in analyses stratified by overweight status (He et al., 1999; Tuomilehto et al., 2001). He and colleagues (1999) analyzed the relationship between self-reported sodium intake and risk of cardiovascular disease in the NHANES I Epidemiologic Follow-up Study. In contrast to previous analyses using the same database reported by Alderman and colleagues (1998b), He and colleagues (1999) excluded those individuals with a history of cardiovascular disease or its treatment and those who intentionally consumed a low-salt diet. Of the 9,485 remaining participants (113,467 person-years of follow-up), 2,688 were overweight (cut-off for overweight was Body Mass Index [BMI] > 27.8 kg/m2 for men and 27.3 kg/m2 for women). As estimated from a single 24-hour dietary recall that did not include discretionary salt use, baseline median sodium intake in the quintiles (based on the sodium-energy ratio) ranged from 1.2 to 3.3 g (50.5 to 142.5 mmol)/day in the quintiles for the nonoverweight adults, and 1.0 to 3.0 g (45.5 to 129.7 mmol)/day in the quintiles of overweight participants. In the overweight stratum, there were consistent and highly significant positive relationships between baseline dietary intake of sodium and risk of stroke, cardiovascular disease, and total mortality. In multivariate analyses, a 2.3 g (100 mmol)/day higher intake of sodium was associated with a 32 percent increase (relative risk [RR] = 1.32; 95 percent confidence interval [CI] = 1.07−1.64) in stroke incidence, an 89 percent increase (RR = 1.89; 95 percent CI = 1.31−2.74) in stroke mortality, a 44 percent increase (RR = 1.44; 95 percent CI = 1.14−1.81) in coronary heart disease mortality, a 61 percent increase (RR = 1.61; 95 percent CI = 1.32−1.96) in cardiovascular disease mortality, and a 39 percent increase (RR = 1.39; 95 percent CI = 1.23−1.58) in mortality from
all causes in overweight persons. Dietary sodium intake was not significantly associated with nonfatal coronary heart disease in overweight participants or with risk of cardiovascular disease in participants with normal weight. In a subsequent analysis of the NHANES database by He and colleagues (2002), dietary sodium intake was a significant, independent risk factor for congestive heart failure in overweight individuals.
In a prospective study conducted in 1,173 Finnish men and 1,263 women aged 25 to 64 years, the adjusted hazard ratios for coronary heart disease, cardiovascular disease, and all-cause mortality, associated with a 100 mmol (2.3 g) higher level of 24-hour urinary sodium excretion, were 1.56 (95 percent CI = 1.15−2.12), 1.36 (1.05−1.76) and 1.22 (1.02−1.47), respectively (Tuomilehto et al., 2001). There was an interaction between sodium excretion and BMI for cardiovascular and total mortality, with sodium intake being a significant predictor of cardiovaslcular disease and total mortality in men who were overweight (RR = 1.44 and 1.56, respectively), and a nonsignificant predictor of both outcomes in the normal-weight subset (RR = 1.23 and 0.98, respectively).
Overall, observational studies, particularly ecological studies, suggest that higher levels of sodium intake increase the risk of cardiovascular disease, especially stroke. Of the available prospective observational studies, those with the most rigorous methods have likewise documented a positive relationship, which was evident in overweight individuals. Still, conclusive evidence of a causal relationship typically depends on results of appropriately designed clinical trials that test the effects of sodium reduction on clinical cardiovascular outcomes. While some persons have advocated such a trial, the feasibility of such an endeavor is uncertain, especially in view of the well-documented difficulties in establishing and maintaining a large contrast in sodium intake over the long-term (Table 6-16).
Left Ventricular Mass
Increased left ventricular mass or wall thickness (left ventricular hypertrophy) is a subclinical form of cardiovascular disease that is a powerful predictor of cardiovascular morbidity and mortality, including myocardial infarction, stroke, congestive heart failure, and sudden death (Bikkina et al., 1994; Casale et al., 1986; Koren et al., 1991; Levy et al., 1990; Messerli and Soria, 1994). Echocardiography is a sensitive diagnostic technique that is used to estimate left ventricular mass. In the Framingham Heart Study, elevated left ventricular mass as measured by echocardiography was associated
with an increased incidence of cardiovascular disease in both men and women, after adjustment for traditional cardiovascular risk factors (Levy et al., 1990). The 5-year mortality for electrocardiographic left ventricular hypertrophy was 33 percent for men and 21 percent for women (Kannel, 1991).
Increased left ventricular mass is thought to be, in part, a structural adaptation of the heart as a compensatory mechanism for increased blood pressure and wall stress. Increased blood pressure is one of the strongest correlates of left ventricular mass (Liebson et al., 1993). Not surprisingly, factors associated with elevated blood pressure are also associated with increased left ventricular mass, including obesity (de Simone et al., 1994; Schmieder and Messerli, 1993), aging (Alderman et al., 1995; Ghali et al., 1997), African-American race (Harshfield et al., 1992), and, as discussed subsequently, sodium intake.
Several cross-sectional studies have examined the relationship between sodium intake, typically as measured by urinary sodium excretion, and left ventricular mass or hypertrophy, as measured by echocardiography. Other cross-sectional studies have documented associations between sodium intake and cardiac function, such as impaired diastolic filling (Langenfeld et al., 1998).
Most reports used correlation or regression analyses and did not report left ventricular mass by level of urinary sodium excretion. Available studies predominantly enrolled hypertensive adults, but some enrolled nonhypertensive individuals (du Cailar et al., 2002; Kupari et al., 1994) or children (Daniels et al., 1990; Harshfield et al., 1994). With the exception of the study by Alderman and colleagues, which assessed left ventricular hypertrophy by electrocardiography and did not detect an association, each study documented a statistically significant, positive relationship between urinary sodium excretion and left ventricular mass (Daniels et al., 1990; du Cailar et al., 1989, 1992, 2002; Gerdts et al., 1996; Kupari et al., 1994; Langenfeld et al., 1998; Liebson et al., 1993; Schmieder et al., 1988, 1990, 1996). Figure 6-6 displays results from the report of Schmieder and coworkers (1988), who were the first to report an association between sodium intake and left ventricular hypertrophy. The only two studies that reported left ventricular mass by level of dietary sodium are included in Table 6-18.
In most studies, the association between urinary sodium excretion and left ventricular mass persisted after adjustment for other determinants of left ventricular mass, including blood pressure (du Cailar et al., 2002; Liebson et al., 1993). Such findings, in conjunction with animal studies, raise the possibility that sodium may have a
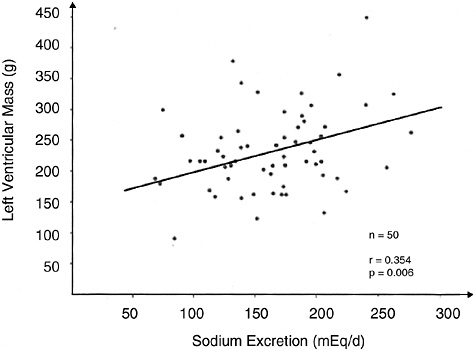
FIGURE 6-6 Relationship of dietary salt intake to left ventricular mass. Reprinted with permission from Schmieder et al. (1988). Copyright 1988 by Lippincott, Williams, and Wilkins.
trophic effect—a direct effect on left ventricular mass apart from indirect effects mediated through blood pressure. Potential mechanistic pathways by which sodium might exert a direct effect on left ventricular mass include the renin-angiotensin system, the sympathetic nervous system, and fluid-volume homeostasis (Beil et al., 1994).
Four clinical trials assessed the effects of a reduced sodium intake on left ventricular mass in hypertensive individuals. In three trials, the comparison group received antihypertensive drug therapy (Fagerberg et al., 1991; Ferrara et al., 1984; Liebson et al., 1995). In two of these trials, the nonpharmacological intervention included weight loss, as well as sodium reduction (Fagerberg et al., 1991; Liebson et al., 1995). In each of the three trials with an active drug treatment comparison group, reductions in left ventricular mass were similar in the pharmacological and nonpharmacological intervention groups. In view of the well-documented effects of antihypertensive drug therapy on left ventricular mass in controlled trials (Klingbeil et al., 2003), these three studies suggest that the nonpharmacological interventions are likewise effective. However, because two of the trials included weight loss in the nonpharmacological interventions, one cannot attribute the effects to a reduced sodium intake.
TABLE 6-18 Observational Studies Relating Left Ventricular Mass or Left Ventricular Hypertrophy to Sodium Intake
|
Reference |
Study Design |
Urinary Sodiuma |
% LVH by Electrocardiogramb |
||
|
|
g/d |
mmol/d |
|||
|
Alderman et al., 1997 |
Cross-sectional analyses of baseline data, n = 1,900 men and 1,037 women |
Men |
|||
|
Q1 |
< 2 |
< 89 |
12 |
||
|
Q2 |
2–2.9 |
89–126 |
11 |
||
|
Q3 |
3–4 |
127–174 |
9 |
||
|
Q4 |
≥ 4 |
≥ 175 |
11 |
||
|
|
p = 0.68 |
||||
|
|
Women |
||||
|
Q1 |
< 1.5 |
< 66 |
5 |
||
|
Q2 |
1.5–2.2 |
66–97 |
4 |
||
|
Q3 |
2.2–3.2 |
98–138 |
4 |
||
|
Q4 |
> 3.2 |
> 138 |
5 |
||
|
|
p = 0.84 |
||||
|
du Cailar et al., 2002 |
Cross-sectional, n = 839 men and women, multivariate analysis |
Men |
LVM (g/m2.7) |
||
|
Q1 |
0.74–2.5 |
32–110 |
46 |
||
|
Q2 |
2.6–3.3 |
111–142 |
47 |
||
|
Q3 |
3.3–3.9 |
143–172 |
48 |
||
|
Q4 |
4.0–5.1 |
173–220 |
50 |
||
|
Q5 |
5.1–9.5 |
221–415 |
55 |
||
|
|
p = 0.007 |
||||
|
|
Women |
||||
|
Q1 |
0.41–1.9 |
18–86 |
38 |
||
|
Q2 |
2.0–2.5 |
87–110 |
42 |
||
|
Q3 |
2.6–3.0 |
111–131 |
44 |
||
|
Q4 |
3.0–3.9 |
132–168 |
44 |
||
|
Q5 |
3.9–7.1 |
169–310 |
46 |
||
|
|
p = 0.006 |
||||
|
a Q = quartile or quintile. b LVH = left ventricular hypertrophy, LVM = left ventricular mass. NOTE: Sodium intake estimated to be approximately equal to urinary excretion. |
|||||
Only one trial tested a reduced sodium intervention and compared its effects with that of a nonintervention control group (Jula and Karanko, 1994). In this randomized trial that enrolled 76 hypertensive individuals, mean urinary sodium excretion decreased from 195 mmol (4.5 g)/day at baseline to 109 mmol (2.5 g)/day at 12 months in the treatment group, while the corresponding change in the control group was 181 mmol (4.2 g)/day to 166 mmol (3.8 g)/day. Compared with the control group, which experienced no change in left ventricular mass, the reduced-sodium group experi-
enced a mean reduction in left ventricular mass of 5.4 percent (from 238 to 225 g, p < 0.05 compared with the control).
In summary, available data from cross-sectional studies in hypertensive individuals are consistent in documenting a progressive, direct, and independent relationship between sodium intake and left ventricular mass. Furthermore, sodium may have a direct effect apart from an indirect effect mediated through blood pressure. While one controlled trial suggests that the association between sodium intake and left ventricular mass is causal, additional trials are needed.
Calcium Excretion, Bone Mineral Density, and Kidney Stones
Numerous intervention studies have demonstrated that increased sodium chloride intake induces a substantial increase in the urinary excretion of calcium (Table 6-19). Sodium chloride-induced hypercalciuria also appears to be accompanied by an increased intestinal calcium absorption (Breslau et al., 1982). However, the effects of sodium intake on biochemical markers of bone resorption (urinary pyridinoline and deoxypyridinoline) and bone formation (serum osteocalcin and bone-specific alkaline phosphatase) are uncertain. These markers were not affected by increasing sodium chloride intake in young women (Evans et al., 1997; Ginty et al., 1998), whereas sodium chloride-induced bone resorption was observed in postmenopausal women (Evans et al., 1997). A reduced sodium intake lowered serum osteocalcin in participants consuming the DASH diet but not those consuming a typical American diet (Lin et al., 2003). Compared with sodium chloride, sodium citrate “loading” induces the opposite effect on urinary calcium (Kurtz et al., 1987). Similarly, differing pressor and calciuric effects of sodium chloride and sodium bicarbonate or citrate have been widely reported (Kotchen, 1999; Luft et al., 1990; Sharma et al., 1992). However, when dietary sodium chloride is not reduced, dietary sodium bicarbonate loading has little effect on the urinary excretion of calcium (Lemann et al., 1989). In postmenopausal women in whom calcium excretion was increased by a high protein diet, replacing dietary sodium chloride with an equimolar amount of sodium bicarbonate promptly induced a sharp and sustained decrease in the urinary excretion of calcium (Lutz, 1984). In animals, bicarbonate acts directly on the renal tubule to increase its reclamation of calcium (Bomsztyk and Calalb, 1988).
While the effect of sodium intake on urinary calcium excretion is evident, calcium absorption was not tracked in these studies. Thus
TABLE 6-19 Intervention Studies on the Effect of Sodium Intake on Calcium Excretion
|
Calcium (Ca) Excretion (mg/d) |
|
|
59 |
|
|
124 |
|
|
178 |
|
|
262 |
|
|
110 ± 14a |
|
|
167 ± 16b |
|
|
Low calcium diet (mmol Ca/mmol creatinine) |
High calcium diet (mmol Ca/mmol creatinine) |
|
0.25a |
0.28a |
|
0.31b |
0.33b |
|
83a |
|
|
106b |
|
|
128a |
|
|
148b |
|
|
152b |
|
|
Significant increase in Ca excretion with the addition of +1.2 g/d Na No difference between 1.2 g and 2.3 g/d Na |
|
|
126a |
|
|
192b |
|
|
136 |
|
|
144 |
|
|
176 |
|
|
109a |
|
|
157b |
|
|
Premenopausal |
Postmenopausal |
|
0.38a |
0.42a |
|
0.52b |
0.62b |
|
160a |
|
|
180b |
|
|
Salt-sensitive (mmol Ca/mmol creatinine) |
Nonsensitive (mmol Ca/mmol creatinine) |
|
0.15a |
0.15a |
|
0.26b |
0.14a |
|
Control diet (mg Ca/g creatinine) |
DASH diet (mg Ca/g creatinine) |
|
88a |
92a |
|
97a |
96a |
|
110b |
104b |
the overall impact on calcium balance is unclear, as is the role of sodium intake on bone mineral density (Table 6-20). Although some epidemiological studies have reported an inverse effect of sodium intake on bone mineral density (Devine et al., 1995; Martini et al., 2000), this relationship was not apparent in other studies (Jones et al., 1997; Matkovic et al., 1995). The effects of a reduced sodium intake in preventing bone fractures has not been tested.
Hypercalciuria is a common risk factor for the formation of renal stones (Strauss et al., 1982). Individuals who were found to form calcium stones were reported to have a higher sodium chloride intake (14 g [239 mmol]/day) compared with healthy subjects (8 g [136 mmol]/day) (Martini et al., 1998). A prospective cohort study showed a significant trend (p < 0.001) for the risk of renal stones with increased sodium intake (Curhan et al., 1997). The risk of renal stones has been reported to increase with an increased sodium:potassium ratio (Stamler and Cirillo, 1997).
Pulmonary Function
Several studies have examined the relationship between sodium intake and bronchial responsiveness to agents (e.g., histamines) that cause airway constriction. In two surveys, bronchial reactivity was strongly and directly related to urinary sodium excretion after adjusting for age and cigarette smoking (Burney et al., 1986; Tribe et al., 1994). In analysis of NHANES III data (Schwartz and Weiss, 1990), bronchitis was positively associated with the dietary sodium:potassium ratio. However, other cross-sectional studies have not found a relationship (Britton et al., 1994; Zoia et al., 1995).
A low salt diet (3.75 g/day, containing 1.5 g [65 mmol] of sodium) improved while a high salt diet (13.75 g/day, containing 5.5 g [239 mmol] of sodium) worsened postexercise pulmonary function in subjects with exercise-induced asthma (Gotshall et al., 2000). When asthmatic patients were given 4.6 g (200 mmol)/day of dietary sodium, all measures of severity of asthma were adversely affected (Carey et al., 1993). Furthermore, salt loading (6.1 g/day, containing 2.4 g [105 mmol] of sodium) was found to worsen the symptoms of asthma (Medici et al., 1993).
Gastric Cancer
It has been hypothesized that high doses of salt can result in destruction of the mucosal barrier of the stomach such that the mucus membrane is easily invaded by carcinogens (Correa et al., 1975).
Indirect support for this hypothesis comes from observational studies of Helicobacter pylori infection. Specifically, seropositivity for H. pylori was directly related to gastric cancer mortality (Eurogast Study Group, 1993), and the prevalence of H. pylori has been associated with the intake of salty foods (Tsugane et al., 1994).
Evidence in laboratory animals indicates that high intakes of salt may increase the incidence of gastric cancer when animals are exposed to various carcinogens (Cohen and Roe, 1997). It has been suggested that salt exerts an enhancing effect on both the initiation and promotion steps of gastric carcinogenesis (Takahashi and Hasegawa, 1986). The evidence in humans is less clear because the source of available data is limited to epidemiological studies.
A number of cross-sectional studies have been conducted to evaluate the association between salt intake and risk of gastric cancer. A significant positive association was observed between sodium or salt intake (or sodium excretion) and incidence of gastric cancer in most (Bernstein and Henderson, 1985; Kneller et al., 1992; La Vecchia et al., 1997; Lee et al., 1995; Montes et al., 1985; Palli et al., 2001; Tsubono et al., 1997; Tsugane et al., 1991), but not all (Honjo et al., 1994; Ikeda et al., 1988) of these studies. More recently, the Intersalt study correlated gastric cancer mortality with sodium intake from 24 countries (Joossens et al., 1996). Multiple regression analysis of these data yielded a significant positive correlation (p < 0.001) of urinary sodium excretion with evidence of a threshold. Specifically, there was no increased incidence of cancer mortality below 117 mmol (2.7 g)/day in men and 91 mmol (2.1 g)/day in women. The RR for gastric cancer as determined from case-control studies ranged from 1.4 to 6.7 with higher intakes of salt (Boeing et al., 1991; Coggon et al., 1989; Graham et al., 1990; Hoshiyama and Sasaba, 1992; Lee et al., 1995; Nazario et al., 1993; Tuyns, 1983; You et al., 1988).
In the one available prospective study, salt intake was significantly and directly associated in a dose-response fashion with gastric cancer in men, but not in women (Tsugane et al., 2004).
Dose-Response Assessment
Adults
Data Selection. The model for establishing Tolerable Upper Intake Levels (ULs) (see Chapter 3) depends upon being able to identify a hazard or adverse effect associated with consumption of a nutrient at levels above an individual’s requirement for the nutri-
TABLE 6-20 Epidemiological Studies on the Effect of Sodium Intake on Calcium Excretion, Bone Mineral Density, and Kidney Stones
|
Reference |
Study Designa |
Effectb |
|
Urinary calcium excretion |
||
|
Short et al., 1988 |
12 men and women on 4 levels of Na and constant Ca |
+ |
|
|
3-d planned diet |
|
|
Nordin et al., 1993 |
220 women |
+ |
|
Itoh and Suyama, 1996 |
Randomized population survey |
+ |
|
410 men, 476 women |
|
|
|
Dawson-Hughes et al., 1996 |
Cross-sectional |
+ |
|
249 men, 665 women |
|
|
|
Bone density |
||
|
Greendale et al., 1994 |
Longitudinal |
NS |
|
258 women, 169 men |
|
|
|
Matkovic et al., 1995 |
Cross-sectional |
+ |
|
381 women |
|
|
|
Devine et al., 1995 |
Longitudinal |
+ |
|
124 women |
|
|
|
Jones et al., 1997 |
Population-based study |
NS |
|
34 men, 120 women |
|
|
|
Kidney stones |
||
|
Burtis et al., 1994 |
124 subjects |
+ |
|
1,000 mg Ca and defined diet or 1,000 mg Ca and usual diet |
|
|
|
Curhan et al., 1997 |
Prospective cohort |
+ |
|
903,849 subjects |
|
|
|
Findingsc |
|
Urinary Na and Ca excretion were positively correlated in young men and women |
|
Significant linear relationship between urinary Na and urinary Ca observed for both normal (n = 88) and osteoporotic (n = 132) postmenopausal women |
|
Significant positive correlation between urinary Na and Ca in men and women |
|
Urinary Na and Ca excretion were associated at moderate and high intakes of Ca but not low intakes in elderly men and women |
|
No association between Na intake and BMD in men and women |
|
Urinary Na found to be the most important determinant of urinary Ca excretion for 8- to 13-yr-old girls |
|
Urinary Ca (mmol/d) = 0.01154 × urinary Na (mmol/d) + 0.823, whereas Ca intake had relatively little impact |
|
No association with bone mass |
|
Urinary Na excretion was significantly and negatively correlated with change (decrease) in bone density at the hip bone (−0.003 × urinary Na + 6.33) and interocanter site (−0.003 × urinary Na + 7.86) in postmenopausal women |
|
Urinary Na correlated with urinary deoxypyridinoline and urinary Ca in men and women |
|
Urinary Na correlated with bone mineral content and density, but the association disappeared when adjusted for other confounders, especially body weight Urinary Ca excretion increased by 0.77 mg/23 mg of Na excreted in individuals with Ca oxalate kidney stones |
|
Relative risk for renal stones increased with increased intake of Na |
|
Q1 = 1.6 g/d Na, RR = 1.0 |
|
Q2 = 2.3 g/d Na, RR = 1.08 |
|
Q3 = 2.8 g/d Na, RR = 1.15 |
|
Q4 = 3.6 g/d Na, RR = 1.10 |
|
Q5 = 4.9 g/d Na, RR = 1.30 |
|
Reference |
Study Designa |
Effectb |
|
Stamler and Cirillo, 1997 |
1,658 men, 1,967 women |
+ |
|
Martini et al., 2000 |
47 men, 38 women |
+ |
|
a Na = sodium; K = potassium, Ca = calcium. b + means Na had a significant impact on Ca excretion or BMD. NS means Na did not have a significant effect on Ca excretion or BMD. c Q = quartile or quintile, RR = relative risk, BMD = bone mineral density. |
||
ent. The preferred type of adverse effect is a clinical outcome, such as evidence of mortality or serious morbidity that has been observed to occur in a few sensitive individuals as a direct result of consuming a nutrient above his or her needs. In situations in which the adverse effect is a chronic disease, it is possible to use clinical outcomes, such as total mortality, cause-specific mortality, or serious morbidity. The ideal type of study is an appropriately designed, long-term trial with multiple levels of nutrient intake.
However, for most nutrients, and particularly for those where adverse effects are related to chronic disease, trials with such endpoints are unavailable, especially dose-response trials that test multiple levels of intake. For sodium, trials with relevant clinical outcomes (e.g., fatal and nonfatal stroke, coronary heart disease, end-stage renal disease, kidney stones, or bone fractures) have not been conducted. In the absence of trials with clinical outcomes, a synthesis of evidence from available trials, observational studies, dose-response trials that link sodium to a well-accepted surrogate endpoint, and observational studies that link the chosen surrogate endpoint with specific clinical outcomes, must be used.
Blood Pressure as the Endpoint. Among the endpoints considered in the previous section, blood pressure stands apart in terms of the research database supporting its use as a biomarker for several diseases of substantial public health importance. Results from the most rigorous dose-response trials (see Appendix I) have documented a progressive, direct effect of dietary sodium intake on blood pressure in nonhypertensive and hypertensive individuals. Furthermore,
|
Findingsc |
|
An increased Na:K ratio was significantly (p < 0.05) and independently associated with increased prevalence of renal stones |
|
Multiple regression analysis showed that a high salt intake (> 16 g/d) was an independent predictor of risk for low BMD in stone-forming men and premenopausal women estimated by food-frequency questionnaire |
persuasive evidence from large-scale observational studies has documented a direct relationship between blood pressure and the risk of cardiovascular diseases (specifically stroke and coronary heart disease) and end-stage renal disease. The relationship of blood pressure to these diseases has been characterized as “strong, continuous, graded, consistent, independent, predictive, and etiologically significant” (JNC, 1997).
Other Possible Endpoints. Other endpoints or adverse effects were considered, including clinical cardiovascular outcomes (i.e., stroke and coronary heart disease), subclinical cardiovascular outcomes (i.e., left ventricular mass), and noncardiovascular outcomes (e.g., urinary calcium excretion, osteoporosis, gastric cancer, and asthma). For left ventricular mass, cross-sectional studies consistently document an association between urinary sodium excretion and left ventricular mass, but only one small, controlled trial assessed the effects of sodium reduction on this endpoint. For urinary calcium excretion, numerous trials documented that a reduced sodium intake lowers urinary calcium excretion, but urinary calcium excretion by itself is not a well-accepted surrogate marker for bone mineral density or dietary induced osteoporosis. Evidence that links sodium intake with gastric cancer is reasonably strong, but still insufficient to establish a UL. Data on the relationship between sodium intake and asthma are sparse.
Identification of a Lowest-Observed-Adverse-Effect Level (LOAEL). In aggregate, the relationship between sodium intake and blood pres-
sure is direct. While it would be best to have a marker for which a normal range has been accepted as not enhancing risk, based on data available there is no apparent threshold below which there is no increased risk for cardiovascular diseases across the range of blood pressures (≥ 115/70 mm Hg) typically observed in the United States and Canada (Burt et al., 1995; Joffres et al., 2001; Wolf-Maier et al., 2003). Recent studies on the relationship of blood pressure changes to subsequent risk of cardiovascular disease have documented increased risk in nonhypertensive persons, including those termed “prehypertensive.” New guidelines from the Joint National Committee on Prevention, Detection, Evaluation, and Treatment of High Blood Pressure for classification of blood pressure and for hypertension prevention and management have been issued (Chobanian et al., 2003) that include a new category designated “prehypertension.” This category combines the “normal” and “borderline” categories used in previous guidelines (JNC, 1997). Individuals with a systolic blood pressure of 120 to 139 mm Hg or diastolic blood pressure of 80 to 89 mm Hg are now termed prehypertensive.4 Prehypertensive individuals are at increased risk for progression to hypertension and for blood pressure-related cardiovascular diseases (Lewington et al., 2002).
The relationship between sodium intake and blood pressure is direct and progressive. Supportive evidence comes from observational studies and clinical trials (see Tables 6-11, 6-12, 6-13, and 6-15; Figure 6-5; and Appendix Table I). However, the potential for confounding, even in otherwise well-designed observational studies, is a concern. Likewise, the assessment of dose-response relationships in meta-analyses is subject to confounding. In this setting, the best available dose-response evidence comes from individual trials that specifically examined this issue (i.e., randomized trials that test the effects of three or more levels of sodium intake on blood pressure). In these dose-response studies, the lowest level of sodium intake spanned from approximately 0.23 g to 1.5 g (10 mmol to 65 mmol)/day, while the highest level spanned from approximately 3.2 g to over 34 g (140 mmol to 1,500 mmol)/day. The range (highest level minus lowest level) was thus 1.7 g (75 mmol)/day (Sacks et al., 2001) to 34.3 g (1,490 mmol)/day (Luft et al., 1979b). In all these dose-response trials, the average blood pressure at the lowest level of intake would not be considered low, even at a sodium intake
of 0.23 g (10 mmol), an amount that is below the Adequate Intake (AI) for younger adults.
Most relevant to determining a UL are the three trials in which the lowest level of dietary sodium intake was close to the AI (Johnson et al., 2001; MacGregor et al., 1989; Sacks et al., 2001). When dietary sodium was provided at the average level of 1.2 g (50 mmol)/day, blood pressure was significantly less than when the target average sodium intake was 2.3 g (100 mmol)/day (Sacks et al., 2001). This pattern of findings was evident in the control diet, which was typical of what many Americans eat, as well as in the DASH diet, which was close to recent dietary guidelines. Blood pressure reductions from a reduced sodium intake were also demonstrated in pertinent subgroups (see Table 6-14).
Two other dose-response trials included levels of sodium intake that were close to 1.2 and 2.3 g (50 and 100 mmol)/day (Johnson et al., 2001; MacGregor et al., 1989). Both of these trials documented reduced blood pressure across this span of sodium intake; however, both trials were considerably smaller in size than the trial by Sacks and colleagues, and the trial by MacGregor and colleagues enrolled only individuals with hypertension.
In view of the results from these three trials, the lowest-observed-adverse-effect level (LOAEL) for dietary sodium is set at 2.3 g/day (100 mmol/day). It is recognized that the term LOAEL as applied to dietary sodium is a point on a continuous relationship with blood pressure, a point that corresponds to the next level above the AI that was tested in dose-response trials. As with other nutrients, a no-observed-adverse-effect level (NOAEL) would have been preferable. However, in the setting of a progressive, dose-response relationship without a threshold, a NOAEL cannot be set. Note that the UL is not a recommended intake. As with other ULs, there is no apparent benefit to consuming levels above the AI.
Uncertainty Assessment. Identification of the NOAEL for sodium is complicated. Available data strongly support the desirability of reducing blood pressure as a means to reduce the risk of cardiovascular disease. Recent evidence indicates that blood pressures as low as 115/70 mm Hg should be cardioprotective. However, in addition to sodium intake, several dietary and nondietary factors also affect blood pressure. Furthermore, the rise in blood pressure in response to increased dietary sodium intake is heterogeneous and is blunted in the setting of dietary potassium intakes in the range of the AI (4.7 g [120 mmol]/day) (Morgan et al., 1982; Morris et al., 1999; Weinberger et al., 1982), a mineral-rich diet (Sacks et al., 2001),
and perhaps other dietary factors, such as high dietary calcium intake (Rich et al., 1991; Saito et al., 1989).
Nondietary factors, such as age, race, specific genes, and the presence of hypertension, diabetes, or kidney disease, also affect the blood pressure response to changes in dietary sodium intake. Specifically, older-age persons, African-Americans, hypertensive individuals, and persons with diabetes or chronic kidney disease tend to be more salt sensitive than their counterparts. There is also demonstrated heterogeneity in the extent of cardiovascular disease risk reduction from a given reduction in blood pressure.
In the UL model (see Chapter 3), when there is concern that adverse effects may occur at levels of intake lower than the LOAEL or NOAEL, an uncertainty factor (UF) is used to adjust downward the LOAEL or NOAEL in order to derive the UL. The UL is defined as the highest level of intake consumed on a chronic basis at which no increased risk of serious adverse effects will occur. As indicated in Chapter 3, the UF is set at 1.0 when there is convincing evidence that the identified adverse effects do not occur at the observed NOAEL, but do occur at higher levels. The UF is set at greater than 1.0 when there is less convincing evidence that a true NOAEL has been demonstrated—there remains the possibility that adverse effects may occur at intakes below the NOAEL, even though they have not been documented. The UF is also greater than 1.0 when data demonstrating a NOAEL are unavailable, but data indicating a LOAEL are available.
For sodium, the UF could be set at greater than 1.0, because there are large numbers of persons who would achieve an even lower blood pressure by reducing their sodium intake from the LOAEL to lower levels. However, the actual NOAEL for these individuals is unknown. Choosing a level of sodium intake at which no one would experience a rise in blood pressure would be difficult because there is heterogeneity in both the extent of blood pressure reduction that would be achieved and in the extent of cardiovascular disease risk reduction. Also, consuming a diet with sodium intake level at the NOAEL may well result in a diet inadequate in other essential nutrients, particularly for those with lower levels of energy expenditure. Lastly, a UF of approximately 1.6 or higher would lead to a UL below the AI. In view of these considerations, the UF for sodium is set at 1.0.
Derivation of a UL. The LOAEL of 2.3 g (100 mmol)/day was divided by the UF of 1.0 to derive a UL of 2.3 g (40 mmol)/day for total sodium intake.
Similar to the sodium AI, the sodium UL is based on moderate physical activity (nonstrenuous physical activity) and based on usual energy intakes as cited for each age group under “Findings by Life Stage and Gender Group.”
Sodium and Chloride UL Summary, Ages 19 Through 50 Years
Much of the data used to set the UL were derived from trials that included both young and middle-aged adults. Hence this UL applies to men and women ages 19 to 50 years. Since chloride is assumed to be in foods in equimolar amounts, the UL for chloride is set at an equimolar basis, 3.6 g (100 mmol)/day.
|
UL for Sodium for Adults |
|
|
19–50 years |
2.3 g (100 mmol)/day of sodium |
|
UL for Chloride for Adults |
|
|
19–50 years |
3.6 g (100 mmol)/day of chloride |
Older Adults and the Elderly Ages 51+ Years
In observational studies, the rise in blood pressure in response to higher sodium intake increases with age (Law et al., 1991a). In trials, middle- and older-age persons (> 45 years) have greater sensitivity to changes in sodium intake than younger adults (Vollmer et al., 2001). As documented previously, elderly persons are especially sensitive to changes in sodium intake (Johnson et al., 2001). Common problems in aging are excessive retention of sodium and volume overload. In elderly, the capacity to excrete sodium, as well as the diurnal variation in its excretion, are altered. Both the decrease in glomerular filtration rate and reduced responsiveness of the renin-angiotensin-aldosterone system seen with aging are major factors that limit the ability of the kidney to excrete an acute sodium load. Other factors, such as dopamine, prostaglandins, intrarenal hemodynamics, activity of the α-adrenergic system within the kidney, and renal nerve activity, may also play a role.
Sodium and Chloride UL Summary, Ages 51+ Years
Because of increased salt sensitivity in the elderly and due to the higher risk of blood pressure-related cardiovascular disease, the UL
for sodium should be less than 2.3 g (100 mmol)/day. However, data are insufficient to precisely define this level, and many in this age group are under medical supervision due to hypertension, and thus the UL would not apply. In this setting, the UL for sodium and for chloride remain the same as for younger individuals.
|
UL for Sodium for Older Adults |
|
|
51+ years |
2.3 g (100 mmol)/day of sodium |
|
UL for Chloride for Older Adults |
|
|
51+ years |
3.6 g (100 mmol)/day of chloride |
Pregnancy and Lactation
According to some authorities, pregnant women retain sodium. Hence salt restriction and prophylactic diuretics have been prescribed to avoid the appearance of de novo hypertension during gestation (Brown and Gallery, 1994; Chesley, 1978; Collins et al., 1985; Lindheimer and Katz, 1985, 2000; Steegers et al., 1991a). Alternatively, data suggest that the pregnant woman may be prone to subtle salt wasting and thus providing additional sodium has been suggested in order to avoid preeclampsia (Robinson, 1958). Still another view is that pregnant women handle ingested sodium similar to the way they do in the nonpregnant state, albeit around new set points for extracellular volume and for volume-influencing hormones (Brown and Gallery, 1994; Lindheimer and Katz, 2000; Weinberger et al., 1977).
Hypertensive disorders during pregnancy are an important cause of maternal and perinatal morbidity and mortality. Among these disorders are chronic hypertension that antedates the pregnancy, gestational hypertension, and preeclampsia. Preeclampsia is a serious condition characterized by the occurrence of hypertension, edema, and proteinuria after 20 weeks of gestation in previously nonhypertensive women. While the pathogenesis of preeclampsia remains uncertain, in the past attention has focused on nutritional factors, particularly a high sodium intake and low calcium intake as possible etiological factors. In fact, low sodium diets have been routinely prescribed as a means to prevent preeclampsia and its complications (Churchill and Beevers, 1999).
However, recent clinical research that included both observational studies (Franx et al., 1999; Morris et al., 2001) and clinical trials (Knuist et al., 1998; Steegers et al., 1991b; van der Maten et
al., 1997) has documented that sodium reduction had no apparent benefit in lowering blood pressure or preventing pregnancy-induced hypertension or its complications. Neither was there any evidence of adverse effects on obstetrical outcomes from sodium reduction in these studies. In the three clinical trials, the mean urinary sodium excretion values in the control and reduced sodium groups were approximately 130 mmol (2.9 g)/day versus 60 mmol (1.4 g)/day (Steegers et al., 1991b), 124 mmol (2.8 g)/day versus 84 mmol (1.9 g)/day (Knuist et al., 1998), and 142 mmol (3.3 g)/day versus 61 mmol (1.4 g)/day (van der Maten et al., 1997). Hence, available evidence indicates that reducing sodium intake has little impact on preventing hypertensive disorders of pregnancy or their complications.
Overall, there is inadequate evidence to support a different upper intake level for sodium intake in pregnant women from that of nonpregnant women as a means to prevent hypertensive disorders of pregnancy. Also, there are inadequate data to justify a different UL for lactating women. Therefore, the ULs for sodium for pregnant and for lactating women are the same as for nonpregnant women. Similarly, there is no data to indicate that chloride is handled differently during pregnancy or lactation; thus the ULs for chloride remain the same as for the nonpregnant and nonlactating states.
Sodium and Chloride UL Summary, Pregnancy and Lactation
|
UL for Sodium, Pregnancy |
|
|
14–18 years |
2.3 g (100 mmol)/day of sodium |
|
19–50 years |
2.3 g (100 mmol)/day of sodium |
|
UL for Sodium, Lactation |
|
|
14–18 years |
2.3 g (100 mmol)/day of sodium |
|
19–50 years |
2.3 g (100 mmol)/day of sodium |
|
UL for Chloride, Pregnancy |
|
|
14–18 years |
3.6 g (100 mmol)/day of chloride |
|
19–50 years |
3.6 g (100 mmol)/day of chloride |
|
UL for Chloride, Lactation |
|
|
14–18 years |
3.6 g (100 mmol)/day of chloride |
|
19–50 years |
3.6 g (100 mmol)/day of chloride |
Infants
Little information is available on the effects of sodium on blood pressure in infants. The effect of two levels of dietary sodium on blood pressure and dynamic skinfold thickness was examined in 124 infants (Bernstein et al., 1990). Newborn infants were fed one of three diets: 43 infants were exclusively fed human milk (0.15 g of sodium [6.6 mmol]/L), 42 infants were fed a low sodium formula containing 0.23 g of sodium [10.2 mmol/L]), and 39 infants were fed a formula containing 0.31 g of sodium (13.9 mmol)/L. There were no significant differences among the three groups for either dynamic skinfold thickness or blood pressure at 6 weeks of age.
The data on the role of sodium intake during infancy on blood pressure in later years are also very limited. The most rigorous study was conducted with infants in Holland with a subsequent follow-up 15 years later. In this randomized, controlled trial of 476 Dutch infants fed a usual (≈ 0.33 g [≈ 14.3 mmol]/day) or low sodium (≈ 0.12 g [≈ 5.1 mmol]/day) formula, there was a small but significant reduction in blood pressure at 6 months among infants fed the low sodium formula (Hofman et al., 1983). After 25 weeks of age, systolic blood pressure in the low sodium group was 2.1 mm Hg lower (p < 0.01) than the normal sodium group. A 15-year follow-up of these children revealed that adjusted systolic and diastolic blood pressures were 3.6 mm Hg and 2.2 mm Hg lower, respectively, in children who had been assigned the low sodium diet during infancy (Geleijnse et al., 1997).
Although not frequently seen, hypernatremic dehydration has been reported in exclusively breast-fed infants (Kini et al., 1995; LSRO, 1998; Peters, 1989; Sofer et al., 1993). Sodium concentrations of the human milk consumed by some of these infants with hypernatremic dehydration ranged from 0.71 to 2.1 g (31 to 92 mmol)/L, which is significantly above the estimated typical content of human milk (0.13 to 0.16 g [5.6 to 7.0 mmol]/L) (see Table 6-8) (Kini et al., 1995; LSRO, 1998).
For infants, a UL could not be established because of insufficient data documenting the adverse effects of chronic intakes of overconsumption of sodium in this age group. To prevent high levels of sodium chloride intake, the only source of intake for infants should be human milk (or formula) and food to which as little sodium as possible is added during processing. Although evidence is limited, the potential long-term effects of reduced sodium formulas on blood pressure measured 15 years later (Geleijnse et al., 1997) suggest persistent adverse effects. Hence, as with other nu-
trients, an intake of sodium or chloride markedly above the AI is not warranted.
Sodium and Chloride UL Summary, Infants
|
UL for Sodium for Infants |
|
|
0–12 months |
Not possible to establish; source of intake should be from human milk (or formula) and food only. |
|
UL for Chloride for Infants |
|
|
0–12 months |
Not possible to establish; source of intake should be from human milk (or formula) and food only. |
Children and Adolescents
Concerns about adverse effects related to sodium intake in children are focused in two areas: first, does a higher level of dietary sodium result in increased blood pressure in children—to the extent that there is a definable increase in risk of cardiovascular disease in children, and second, does increased dietary intake of sodium during childhood track to increased blood pressure during adulthood and thus increased risk for subsequent cardiovascular disease.
The extent to which blood pressure in childhood affects subsequent blood pressure and chronic disease risk in adulthood has been evaluated in a number of studies. Studies that have examined the effects of sodium intake on blood pressure in children include observational studies (Cooper et al., 1983; Geleijnse et al., 1990; Robertson, 1984; Simon et al., 1994; Tucker et al., 1989) and, to a lesser extent, randomized, controlled-design clinical trials (Calabrese and Tuthill, 1985; Cooper et al., 1984; Ellison et al., 1989; Gillum et al., 1981; Howe et al., 1985, 1991; Sinaiko et al., 1993), as well as a study of twins and siblings (Miller and Weinberger, 1986; Miller et al., 1988). A recent review of these studies has been published (Simons-Morton and Obarzanek, 1997).
Many of these studies had methodological limitations, including small sample size, suboptimal blood pressure measurements, and limited experimental contrast. A longitudinal cohort of 233 children (5 to 17 years of age) did not reveal an association between sodium excretion and change in blood pressure over time (Geleijnse et al., 1990). When sodium intake was reduced to less than 1.4 g (60 mmol)/day in 149 nonhypertensive children ages 2.6 to 19.8 years, a small decrease in the average systolic, diastolic, or
mean arterial blood pressure was seen (Miller and Weinberger, 1986; Miller et al., 1988). In another trial of 80 hypertensive children (6 to 9 years old) with sodium intakes of 2.0 g (87 mmol)/day versus 2.9 g (130 mmol)/day, there were no significant reductions in blood pressure (Gillum et al., 1981), possibly because of the limited contrast in sodium intake.
In a controlled trial of adolescents, a 3-year reduced sodium intervention lowered the age-related increase in systolic and diastolic blood pressure in girls, but not in boys (Sinaiko et al., 1993). As in other trials, the contrast in urinary sodium excretion was small.
Overall, available evidence on the effects of sodium reduction on blood pressure in children is limited and inconsistent. Hence there are insufficient data to directly set a UL based on expected blood pressure change. Therefore, the ULs for children and adolescents were determined by extrapolating from the adult ULs based on averages of median energy intakes as was used for setting the AIs for children.
Extrapolation of the adult UL to children is appropriate. Numerous observational studies have documented that blood pressure tracks with age from childhood into the adult years (Bao et al., 1995; Dekkers et al., 2002; Gillman et al., 1993; Van Lenthe et al., 1994). Further, it is increasingly recognized that the antecedents of chronic conditions in adults, such as elevated blood pressure and atherosclerosis, occur in childhood.
The median energy intake for adults was 2,150 kcal/day. For children 1–3, 4–8, and 9–13 years of age, the median energy intakes were 1,372, 1,757, and 2,042 kcal/day, respectively. The ULs for children are extrapolated from the adult UL of 2.3g (100 mmol)/day based on these estimated energy intakes, after rounding. Since the estimated energy intake for adolescents is in the same range as adults, the ULs for this age group are the same as those for adults.
Sodium and Chloride UL Summary, Ages 1 Through 18 Years
|
UL for Sodium for Children |
|
|
1–3 years |
1.5 g (65 mmol)/day of sodium |
|
4–8 years |
1.9 g (83 mmol)/day of sodium |
|
9–13 years |
2.2 g (95 mmol)/day of sodium |
|
UL for Sodium for Adolescents |
|
|
14–18 years |
2.3 g (100 mmol)/day of sodium |
|
UL for Chloride for Children |
|
|
1–3 years |
2.3 g (65 mmol)/day of chloride |
|
4–8 years |
2.9 g (83 mmol)/day of chloride |
|
9–13 years |
3.4 g (95 mmol)/day of chloride |
|
UL for Chloride for Adolescents |
|
|
14–18 years |
3.6 g (100 mmol)/day of chloride |
Factors Affecting the Tolerable Upper Intake Level
Salt Sensitivity
As discussed previously, blood pressure, on average, is directly related to dietary sodium intake. However, evidence from a variety of studies, including observational studies and clinical trials, has demonstrated heterogeneity in the blood pressure responses to sodium intake. Those individuals with the greatest reductions in blood pressure in response to decreased sodium intake are termed “salt sensitive” (Kawasaki et al, 1978; Miller et al., 1983; Morris et al., 1999; Sullivan et al., 1980; Weinberger, 1996) (see Box 6-1). Some studies have documented that salt sensitivity is reproducible over time (Weinberger and Fineberg et al., 1991) and that salt sensitivity as assessed by two different techniques is highly correlated (Weinberger et al., 1993a).
A variety of factors influence the blood pressure response to changes in sodium intake. Some factors, particular dietary factors, are modifiable, while other factors are fixed, such as genetic factors. Several factors are acquired, such as advanced age and chronic medical conditions, specifically, hypertension, diabetes, and chronic kidney disease.
Salt-sensitive hypertensive individuals are at an increased risk for cardiovascular events (Morimoto et al., 1997). Salt sensitivity, even in those who are nonhypertensive, also increases the risk of incident hypertension and cardiovascular death (Weinberger et al., 2001). At present, an agreed upon definition and practical tools to measure salt sensitivity in individuals are unavailable. Hence even though individuals who are considered salt sensitive should benefit from a level of sodium intake below the UL of 2.3 g (100 mmol)/ day, there is no practical strategy to identify such individuals, except perhaps by identifying specific subgroups of the population with a high prevalence of salt sensitivity (i.e., older-aged individuals, African Americans, and individuals with hypertension, diabetes, or chronic kidney disease).
|
BOX 6-1 Definition of Salt Sensitivity The prevalence of salt sensitivity depends on the definition. Relevant aspects of the definition include the type of blood pressure measured (systolic, diastolic, or mean arterial pressure), the types of thresholds reported (absolute mm Hg or percent change), the classification scheme (common categories are “salt sensitive” and “salt resistant”), the thresholds applied to the classification categories, the contrast in sodium intake tested (lowest and highest levels), and the mode of sodium delivery (diet versus rapid intravenous infusion). In one study, 73 percent of African Americans with hypertension and 56 percent of hypertensive white subjects were found to be salt sensitive, whereas in normotensive African-American and white subjects, only 36 and 29 percent, respectively, were salt sensitive (Weinberger et al., 1986). Despite the use of the terms salt sensitive and salt resistant to classify individuals in research studies, the change in blood pressure in response to a change in salt intake is not binary. Rather, the reduction in blood pressure from a reduced sodium intake has a continuous distribution with individuals having greater or lesser degrees of blood pressure reduction. Hence, persons termed salt resistant may actually achieve some blood pressure reduction, just less than that achieved in salt-senstive persons. |
In these groups, which together comprise a large fraction of the population of the United States and Canada, the UL should be lower than 2.3 g (100 mmol)/day. However, it is not possible at this time to precisely define such a level.
Interaction with Other Dietary Factors
In addition to sodium intake, the intake of potassium and perhaps other electrolytes (calcium and magnesium) also affects blood pressure. Further, the intake of these electrolytes, particularly potassium, may influence the blood pressure response to changes in dietary sodium intake. Sodium intake may also influence urinary excretion of these electrolytes.
Potassium. In observational studies, the ratio of sodium to potassium intake is often more strongly associated with blood pressure than either sodium intake alone (Rose et al., 1988) or potassium intake alone, especially in older-aged individuals (Khaw and Barrett-Connor, 1988). In clinical trials, increased potassium intake lowers blood pressure, and the effects of potassium in reducing blood pressure appear to be greatest when sodium is concurrently high (see
Chapter 5). Increased potassium intake also reduces the sensitivity of blood pressure to changes in sodium intake (Morris et al., 1999). The level of sodium intake does not appear to influence potassium excretion (Bruun et al., 1990; Castenmiller et al., 1985; Overlack et al., 1993; Sharma et al., 1990; Sullivan et al., 1980), except at levels of sodium intake above 6.9 g (300 mmol)/day, at which net loss of potassium has been demonstrated (Kirkendall et al., 1976).
Calcium. In observational studies, an inverse association between calcium intake and blood pressure has been reported (Cutler and Brittain, 1990; Witteman et al., 1989). Pooled analysis of clinical trials showed reductions in systolic and diastolic blood pressure of 0.89 to 1.44 mm Hg and 0.18 to 0.84 mm Hg, respectively, with calcium supplementation (400 to 2,000 mg/day) (Allender et al., 1996; Bucher et al., 1996; Griffith et al., 1999).
The level of sodium intake may affect the blood pressure response to increased calcium intake, and conversely, the level of calcium intake may affect the blood pressure response to sodium. In a small cross-sectional study, sodium intake was associated with increased blood pressure only at a low calcium intake (Hamet et al., 1991). In three small trials, calcium supplementation attenuated the effect of a high sodium intake on blood pressure (Rich et al., 1991; Saito et al., 1989; Zemel et al., 1986). In a crossover trial that tested the effects on blood pressure of calcium supplementation, only individuals previously classified as salt sensitive had a significant reduction in blood pressure, whereas persons classified as nonsalt-sensitive experienced no such reduction (Weinberger et al., 1993b). As described previously, higher levels of sodium intake increase the urinary excretion of calcium. Such observations highlight the complex interactions of dietary sodium and calcium on blood pressure.
Magnesium. Magnesium has been reported to lower blood pressure. While studies have been inconsistent, an analysis of 29 observational studies concluded that there was an inverse association between dietary magnesium and blood pressure (Mizushima et al., 1998). However, in a pooled analysis of 20 randomized clinical trials, there was no clear effect of magnesium intake on blood pressure (Jee et al., 2002). Data on the effects of sodium intake on magnesium excretion are limited. One study concluded that salt reduction (at levels of 1 to 2 g [43 to 87 mmol]/day) for 3 days did not influence magnesium excretion (Murayama and Taguchi, 1988).
Interactions Among Electrolytes. Interactions among all dietary electrolytes may be relevant. In the DASH diet, which was rich in potassium, calcium, and magnesium, sodium reduction lowered blood pressure, but to a lesser extent than that observed when subjects consumed a typical American diet that was comparatively low in these nutrients (Sacks et al., 2001). While this interaction and the previously described interactions of dietary potassium and calcium raise the possibility that the UL for sodium should be modified, available evidence is insufficient to adjust the UL based on concurrent intakes of these other nutrients.
Weight
A substantial body of evidence has documented that weight is directly related to blood pressure and that weight loss reduces blood pressure (Neter et al., 2003). There is also a strong biological basis for believing that increased weight should modify the blood pressure response to sodium intake. Obesity increases sympathetic nervous system activity, activates the renin-angiotensin-aldosterone system, and increases renal medullary compression, each of which increases tubular reabsorption of sodium and impairs sodium excretion (Hall et al., 2003). However, empirical evidence is inconsistent. In some studies, overweight was associated with an increased blood pressure response to a high sodium intake (Rocchini et al., 1989). In contrast, in a large trial that explicitly tested for an interaction, sodium reduction lowered blood pressure similarly in both nonobese and obese participants (see Table 6-14).
Overall, it is unclear whether obese individuals are more salt sensitive than nonobese individuals. Available evidence is insufficient to adjust the UL based on obesity status.
Gender
Observational studies and clinical trials provide some evidence that the blood pressure response to a reduced sodium intake may differ by gender. In the Intersalt study, an observational study that enrolled men and women aged 20 to 59 years, the direct association of blood pressure with 24-hour urinary sodium excretion was greater in women than in men (Stamler et al., 1991). In another large international study, blood pressure was directly and significantly associated with sodium intake in men, but nonsignificantly in women (Yamori et al., 1990). In subsequent analyses of this study, stratified by menopausal status, the direct relationship of blood pres-
sure to sodium intake was significant in postmenopausal women, but nonsignificant in premenopausal women (Yamori et al., 2001).
Evidence from clinical trials is likewise inconsistent. In subgroup analyses of Phase 1 of the Trials of Hypertension Prevention, which enrolled adults aged 30 to 54 years, a reduced sodium intervention led to significantly greater systolic blood pressure reduction in women compared with men; this finding may have resulted from a lower achieved level of sodium intake in women (Kumanyika et al., 1993). In the DASH-Sodium trial (see Table 6-14), sodium reduction lowered blood pressure in both men and women in both a typical American diet and the DASH diet. In the DASH diet, the systolic blood pressure reduction in women was significantly greater than that of the men. In a meta-analysis that explored the effects of gender on the blood pressure response to a reduced sodium intake, there was no significant difference in the blood pressure response in trials that enrolled at least 50 percent women versus those that enrolled less than 50 percent women (Geleijnse et al., 2003).
Overall, it is unclear whether women are more salt sensitive than men. Thus, the UL is set at the same level for men and women.
Hypertension
As previously described, a substantial body of evidence has documented that sodium reduction lowers blood pressure to a greater extent in hypertensive than in nonhypertensive individuals. These studies were typically conducted in hypertensive individuals not on medication. In individuals on antihypertensive drug therapy, sodium reduction can further lower blood pressure (Appel et al., 2001). In the setting of hypertension, the UL should be lower than 2.3 g (100 mmol)/day. However, it is not possible at this time to precisely define such a level.
Diabetes
Individuals with diabetes have increased total body sodium, increased renal tubular sodium reabsorption, and an impaired ability to excrete a sodium load compared with individuals without diabetes (de Chatel et al., 1977; Roland et al., 1986). Inadequate suppression of the renin-angiotensin-aldosterone system may be partly responsible for these effects (de Chatel et al., 1977). Increased salt sensitivity, as well as increased weight, may contribute to the high prevalence of hypertension in diabetics (Tuck et al., 1990). Few randomized trials have tested the effects of sodium reduction on
blood pressure in diabetics. In a trial of 16 type 1 diabetic patients with nephropathy who increased their normal intake by 2.3 g (100 mmol)/day, a significant rise in diastolic blood pressure and a nonsignificant rise in systolic blood pressure were observed (Mulhauser et al., 1996). In a trial of 34 individuals with type 2 diabetes with hypertension, a reduction of sodium intake from approximately 4.6 to 3.1 g (199 to 137 mmol)/day significantly lowered systolic blood pressure by 11.9 mm Hg, but did not lower diastolic blood pressure (Dodson et al., 1989). In a trial of 20 individuals with type 2 diabetes, which tested the effects of sodium reduction in the setting of drug therapy (i.e., an angiotensin-II receptor blocker), sodium reduction further lowered both systolic and diastolic blood pressure (Houlihan et al., 2002). Overall, available data indicate that persons with diabetes should be salt sensitive. In this setting, the UL should be lower than 2.3 g (100 mmol)/day. However, it is not possible at this time to precisely define such a level.
Chronic Kidney Disease
Animal studies and a variety of clinical research studies have documented that altered renal sodium handling occurs in the setting of chronic kidney disease (Strazzullo et al., 2003). It has also been postulated that subtle, acquired defects in renal sodium handling cause hypertension prior to the onset of chronic kidney disease (Johnson et al., 2002). In chronic kidney disease, sodium retention can raise blood pressure and may have detrimental effects on kidney function by inducing hyperfiltration and increasing filtration fraction and glomerular pressure. In a cross-sectional study of 839 nonhypertensive and hypertensive individuals, there was a direct, positive relationship between sodium intake and urinary albumin excretion (du Cailar et al., 2002). However, no randomized trial has specifically examined the effects of different levels of sodium intake on blood pressure and kidney function in the setting of chronic kidney disease.
Despite the absence of empirical evidence from controlled trials, available data suggest that as chronic kidney disease progresses, salt sensitivity increases. Dietary sodium reduction is routinely recommended as a way to reduce volume expansion and lower blood pressure in patients with chronic kidney disease, particularly at advanced stages. In the setting of chronic kidney disease, the UL should be lower than 2.3 g (100 mmol)/day. However, it is not possible at this time to precisely define such a level.
Genetic Factors
A rapidly increasing body of evidence indicates that genetic factors affect blood pressure levels and the blood pressure response to a reduced sodium intake. Several genotypes that influence blood pressure have been identified. Most of these genotypes influence the renin-angiotensin-aldosterone axis or renal salt handling. Consequently, these genotypes likely affect salt sensitivity. In a line of investigation that focused on Mendelian diseases associated with either high or low blood pressure, six genes associated with higher blood pressure and another eight genes associated with lower blood pressure have been identified (Lifton et al., 2002). It is noteworthy that each of these genes regulates renal sodium chloride handling—mutations that increase net sodium chloride reabsorption raised blood pressure, while mutations that reduce sodium chloride reabsorption lowered blood pressure.
Glucocorticoid-remediable aldosteronism is an example of a disease associated with increased sodium reabsorption. In this autosomal-dominant condition associated with severe hypertension, chronic aldosterone secretion leads to increased intravascular volume. An example of a Mendelian disease associated with salt wasting is Gitelman’s syndrome. In analyses that compared blood pressure and urinary sodium excretion in individuals from a large group of related persons who carried zero, one, or two copies of the mutant gene, lower blood pressure was seen in those with two copies of the mutant gene (homozygotes) compared with those with no copy (wildtype) or one copy (heterozygotes). Both the homozygotes and heterozygotes consumed more salt than their wild-type relatives, indicating dietary compensation for their renal salt losses. Hence, although renal salt wasting leads to lower blood pressure in Gitelman’s syndrome, there was actually an inverse relationship between salt intake and blood pressure. These Mendelian conditions, while uncommon, demonstrate the importance of renal sodium chloride handling as a determinant of blood pressure.
Three trials have tested whether certain genotypes modify the blood pressure response to a reduced salt intake. In subgroup analyses (n = 1,509) from Phase II of the Trials of Hypertension Prevention (Hunt et al., 1998), a reduced sodium intervention significantly lowered the risk of developing hypertension over 3 years in those with the AA genotype of the angiotensinogen gene, but not those with the GG genotype. Those individuals with the AG genotype tended to have an intermediate phenotype. Because the GG genotype is uncommon in African Americans, this study focused only on
white subjects, of whom 20 percent had the AA genotype, 48 percent the AG genotype, and 32 percent the GG genotype.
In a separate trial of 86 hypertensive men and women, genotypic variation in the M235T locus of the angiotensinogen gene was evaluated to determine if it affects the blood pressure response to a low-sodium mineral salt (Hunt et al., 1999). Over the 6 months of follow-up, those with the TT and MT genotypes had greater blood pressure reductions than those with the MM genotype. In a third trial that enrolled 46 persons aged 60 years and older, there was a direct dose-response between reported salt intake and both systolic and diastolic blood pressure (Johnson et al., 2001). Angiotensinogen genotypes appeared to influence the effects of sodium intake on diastolic blood pressure, but not systolic blood pressure.
Genetic variation of the angiotensinogen gene appears to modulate the blood pressure response to other nonpharmacologic interventions. Specifically, the AA genotype compared with the GG genotype has been associated with a greater blood pressure reduction from weight loss (Hunt et al., 1998) and from the DASH diet (Svetkey et al., 2001).
While it is interesting to speculate that genotyping might assist in developing nutritional guidelines to target those most likely, or those least likely, to benefit from a reduced sodium intake, currently available data are insufficient to modify the UL.
Risk Characterization
Data from the Third National Health and Nutrition Examination Survey (NHANES III) (Appendix Table D-8) indicate that more than 95 percent of men and 75 percent of women in the United States consumed in excess of the Tolerable Upper Intake Level (UL). Because estimates of sodium intake in NHANES III do not include sodium directly added to foods while eating (e.g., from the salt shaker), it is likely that a higher percentage of adults have intakes that exceed the UL. In phase I of the same survey (Burt et al., 1995), 24.7 percent of men and 24.3 percent of women 18 years of age and older had hypertension, meaning that a substantial number of individuals appear to experience this adverse effect identified in the risk assessment related to sodium.
Data on Canadian consumption (Appendix Table F-3) indicate that 90 to 95 percent of younger men (aged 19 to 50 years) and between 50 and 75 percent of younger women had usual intakes above the UL. Again, this does not include discretionary salt usage.
RESEARCH RECOMMENDATIONS
The effects of sodium on health have been debated, often vociferously (Alderman, 2002; deWardener, 1999; Perry, 2003). Over the past decade, key evidence has emerged that has informed this debate and which has, in general, strengthened the case for sodium reduction in the general population. Specific developments include: (1) dose-response trials that have documented a direct, progressive relationship between sodium intake and blood pressure in a broad range of individuals, including nonhypertensive persons, and (2) appropriately designed, prospective observational studies that have linked sodium intake with subsequent cardiovascular disease. Still, others argue that sodium reduction has adverse metabolic effects (e.g., increased plasma renin activity and perhaps insulin resistance), that sodium reduction has little or no effect on blood pressure in many individuals, and that other dimensions of diet (e.g., increased potassium intake or adoption of a mineral-rich diet) mitigate the harmful effects of dietary sodium on blood pressure in some individuals. Conversely, proponents of sodium reduction argue that sodium reduction could have benefits beyond blood pressure, including a reduced risk of left ventricular hypertrophy, osteoporosis, and gastric cancer.
Given the issues outlined above, some have argued for a large-scale, long-term trial that tests the effects of sodium reduction on clinical outcomes, including total mortality—while many have argued that such an undertaking is not feasible. Indeed, one major aspect of the sodium debate pertains to the level of evidence that is sufficient to guide policy in the absence of definitive trials that might be impossible to conduct.
As for most other nutrients, the absence of such a trial does not preclude the identification of reference values for dietary sodium intake. Given available evidence, it is concluded that a reduced sodium intake lowers blood pressure and that lower levels of blood pressure should reduce the risk of cardiovascular disease. Evidence of other potential benefits of sodium reduction was either inconclusive or insufficient to set reference values. Importantly, there was no credible evidence of harm from sodium intakes at or above the Adequate Intake (AI).
It is well-recognized that the current intake of sodium for most individuals in the United States and Canada greatly exceeds both the AI and the Tolerable Upper Intake Level (UL). Progress in achieving a reduced sodium intake will be challenging and will likely be incremental. Changes in individual behavior toward salt con-
sumption will be required, as will replacement of higher salt foods with lower salt versions. This will require increased collaboration of the food industry with public health officials, and a broad spectrum of additional research. The latter includes research to develop reduced sodium food products that maintain flavor, texture, consumer acceptability, and low cost. Such efforts will require the collaboration of food scientists, food manufacturers, behavioral scientists, and public health officials.
In reviewing the literature, gaps have been identified and the following are recommendations for additional research:
-
Development of public health strategies to achieve and sustain a reduced sodium and increased potassium intake in the general population, including behavioral change studies in individuals, and community-based intervention studies.
-
Development of alternative processing technologies to reduce the sodium content of foods, with a special emphasis on maintaining flavor, texture, consumer acceptability, safety, and low cost.
-
Assessment of the feasibility of a large-scale, long-term clinical trial designed to assess the impact of sodium reduction on clinical cardiovascular outcomes.
-
Main and interactive effects of sodium and potassium intake on noncardiovascular clinical outcomes, specifically bone mineral density, osteoporosis, and kidney disease progression.
-
Assessment of genetic and dietary factors that affect salt sensitivity.
-
Assessment of the clinical relevance of sodium-induced changes in plasma renin activity.
-
Main and interactive effects of sodium and potassium intake on plasma renin activity.
-
Main and interactive effects of sodium and potassium intake on insulin resistance.
-
Development of practical tools to measure intakes of sodium and potassium and to assess total body levels of sodium and potassium.
-
Development of practical tools to define and measure salt sensitivity.
-
Better characterization of salt sensitivity as a phenotype and determination of its relationship to cardiovascular outcomes.
-
Influence of sodium intake during infancy and childhood on blood pressure later in life.
-
Main and interactive effects of sodium and potassium intake on the age-related rise in blood pressure.
-
Sodium and potassium balance studies to provide estimates of electrolyte loss (sweat concentrations and total sweat loss) by physical activity level, climatic conditions, and dietary electrolyte intake in broad populations.
-
Sodium and potassium balance studies during pregnancy.
REFERENCES
Alam S, Johnson AG. 1999. A meta-analysis of randomized controlled trials (RCT) among healthy normotensive and essential hypertensive elderly patients to determine the effect of high salt (NaCl) diet of blood pressure. J Hum Hypertens 13:367–374.
Alcantara PF, Hanson LE, Smith JD. 1980. Sodium requirements, balance and tissue composition of growing pigs. J Animal Sci 50:1092–1101.
Al-Dahhan J, Haycock GB, Chantler C, Stimmler L. 1984. Sodium homeostasis in term and preterm neonates. III. Effect of salt supplementation. Arch Dis Child 59:945–950.
Alderman MH. 2002. Salt, blood pressure and health: A cautionary tale. Int J Epidemiol 31:311–315.
Alderman MH, Laragh JH. 1996. Low urinary sodium and myocardial infarction. Hypertension 27:156–157.
Alderman MH, Madhavan S, Ooi WL, Cohen H, Sealey JE, Laragh JH. 1991. Association of the renin-sodium profile with the risk of myocardial infarction in patients with hypertension. N Engl J Med 324:1098–1104.
Alderman MH, Madhavan S, Cohen H, Sealey JE, Laragh JH. 1995. Low urinary sodium is associated with greater risk of myocardial infarction among treated hypertensive men. Hypertension 25:1144–1152.
Alderman M, Sealey J, Cohen H, Madahavan S, Laragh J. 1997. Urinary sodium excretion and myocardial infarction in hypertensive patients: A prospective cohort study. Am J Clin Nutr 65:682S–686S.
Alderman MH, Cohen H, Madhavan S. 1998a. Dietary sodium intake and mortality: NHANES. Lancet 352:987–988.
Alderman MH, Cohen H, Madhavan S. 1998b. Dietary sodium intake and mortality: The National Health and Nutrition Examination Survey (NHANES I). Lancet 351:781–785.
Allan JR, Wilson CG. 1971. Influence of acclimatization on sweat sodium concentration. J Appl Physiol 30:708–712.
Allender PS, Cutler JA, Follmann D, Cappuccio FP, Pryer J, Elliott P. 1996. Dietary calcium and blood pressure: A meta-analysis of randomized trials. Ann Intern Med 124:825–831.
Allikmets K, Parik T, Teesalu R. 1996. Association between plasma renin activity and metabolic cardiovascular risk factors in essential hypertension. J Intern Med 239:49–55.
Allsopp AJ, Sutherland R, Wood P, Wootton SA. 1998. The effect of sodium balance on sweat sodium secretion and plasma aldosterone concentration. Eur J Applied Physiol 78:516–521.
Altschul AM, Ayers WR, Grommet JK, Slotkoff L. 1981. Salt sensitivity in experimental animals and man. Int J Obes 5:27S–38S.
Ames RP. 2001. The effect of sodium supplementation on glucose tolerance and insulin concentrations in patients with hypertension and diabetes mellitus. Am J Hypertens 14:I653–I659.
Anderson G, Springer J, Randall P, Streeten DH, Blakeman N. 1980. Effect of age on diagnostic usefulness of stimulated plasma renin activity and saralasin test in detection of renovascular hypertension. Lancet 2:821–824.
Appel LJ, Moore TJ, Obarzanek E, Vollmer WM, Svetkey LP, Sacks FM, Bray GA, Vogt TM, Cutler JA, Windhauser MM, Lin PH, Karanja N. 1997. A clinical trial of the effects of dietary patterns on blood pressure. N Engl J Med 336:1117–1124.
Appel LJ, Espeland MA, Easter L, Wilson AC, Folmar S, Lacy CR. 2001. Effects of reduced sodium intake on hypertension control in older individuals. Arch Intern Med 161:685–693.
Aronow WS, Ahn C, Kronzon I, Gutstein H. 1997. Association of plasma renin activity and echocardiographic left ventricular hypertrophy with frequency of new coronary events and new atherothrombotic brain infarction in older persons with systemic hypertension. Am J Cardiol 79:1543–1545.
Ascherio A, Rimm EB, Giovannucci EL, Colditz GA, Rosner B, Willett WC, Sacks F, Stampfer MJ. 1992. A prospective study of nutritional factors and hypertension among US men. Circulation 86:1475–1484.
Bao W, Threefoot SA, Srinivasan SR, Berenson GS. 1995. Essential hypertension predicted by tracking of elevated blood pressure from childhood to adulthood: The Bogalusa Heart Study. Am J Hypertens 8:657–665.
Barden AE, Vandongen R, Beilin LJ, Margetts B, Rogers P. 1986. Potassium supplementation does not lower blood pressure in normotensive women. J Hypertens 4:339–343.
Barden A, Beilin LJ, Vandongen R, Puddey IB. 1991. A double-blind placebo-controlled trial of the effects of short-term potassium supplementation on blood pressure and atrial natriuretic peptide in normotensive women. Am J Hypertens 4:206–213.
Barr SB, Costill DL, Fink WJ. 1991. Fluid replacement during prolonged exercise: Effects of water, saline, or no fluid. Med Sci Sports Exerc 23:811–817.
Bartter FC, Pronove P, Gill JR, MacCardle RC. 1962. Hyperplasia of the juxtaglomerular complex with hyperaldosteronism and hypokalemic alkalosis. A new syndrome. Am J Med 33:811–828.
Bay WH, Ferris TF. 1979. Factors controlling plasma renin and aldosterone during pregnancy. Hypertension 1:410–415.
Beil AH, Schmieder RE, Messerli FH. 1994. Salt intake, blood pressure, and cardiovascular structure. Cardiovasc Drugs Ther 8:425–432.
Benetos A, Yang-Yan X, Cuche JL, Hannaert P, Safar M. 1992. Arterial effects of salt restriction in hypertensive patients. A 9-week, randomized, double-blind, crossover study. J Hypertens 10:355–360.
Bernstein HM, Cooper PA, Turner MJ. 1990. Dynamic skinfold thickness measurement in infants fed breast milk, low or high sodium formula. S Afr Med J 78:644–646.
Bernstein L, Henderson BE. 1985. Studies comparing population differences in sodium intake and gastric cancer rates. J Cancer Res Clin Oncol 110:184.
Bikkina M, Levy D, Evans JC, Larson MG, Benjamin EJ, Wolf PA, Castelli WP. 1994. Left ventricular mass and risk of stroke in an elderly cohort: The Framingham Heart Study. J Am Med Assoc 272:33–36.
Boeing H, Jedrychowski W, Wahrendorf J, Popiela T, Tobiasz-Adamczyk B, Kulig A. 1991. Dietary risk factors in intestinal and diffuse types of stomach cancer: A multicenter case-control study in Poland. Cancer Causes Control 2:227–233.
Boero R, Pignataro A, Bancale E, Campo A, Morelli E, Nigra M, Novarese M, Possamai D, Prodi E, Quarello F. 2000. Metabolic effects of changes in dietary sodium intake in patients with essential hypertension. Minerva Urol Nefrol 52:13–16.
Bomsztyk K, Calalb MB. 1988. Bicarbonate absorption stimulates active calcium absorption in the rat proximal tubule. J Clin Invest 81:1455–1461.
Bower TR, Pringle KC, Soper RT. 1988. Sodium deficit causing decreased weight gain and metabolic acidosis in infants with ileostomy. J Pediatr Sur 23:567–572.
Brancati FL, Appel LJ, Seidler AJ, Whelton PK. 1996. Effect of potassium supplementation on blood pressure in African Americans on a low-potassium diet: A randomized, double-blind, placebo-controlled trial. Arch Intern Med 156:61–67.
Breslau NA, McGuire JL, Zerwekh JE, Pak CYC. 1982. The role of dietary sodium on renal excretion and intestinal absorption of calcium and on vitamin D metabolism. J Clin Endocrinol Metab 55:369–373.
Britton J, Pavord I, Richards K, Knox A, Wisniewski A, Weiss S, Tattersfield A. 1994. Dietary sodium intake and the risk of airway hyperreactivity in a random adult population. Thorax 49:875–880.
Brouns F. 1991. Heat-sweat-dehydration-rehydration: A praxis oriented approach. J Sports Sci 9:143–152.
Brown JE, Toma RB. 1986. Taste changes during pregnancy. Am J Clin Nutr 43:414–418.
Brown MA, Gallery EDM. 1994. Volume homeostasis in normal pregnancy and preeclampsia: Physiology and clinical implications. Clin Obstet Gynaecol (Bailleres) 8:287–310.
Brown MA, Gallery EDM, Ross MR, Esber RP. 1988. Sodium excretion in normal and hypertensive pregnancy: A prospective study. Am J Obstet Gynecol 159:297–307.
Brunette MG, Mailloux J, Lajeunesse D. 1992. Calcium transport through the luminal membrane of the distal tubule. I. Interrelationship with sodium. Kidney Int 41:281–288.
Brunner E, White I, Thorogood M, Bristow A, Curle D, Marmot M. 1997. Can dietary interventions change diet and cardiovascular risk factors? A meta-analysis of randomized controlled trials. Am J Public Health 87:1415–1422.
Bruun NE, Skott P, Nielsen MD, Rasmussen S, Schutten HJ, Leth A, Pedersen EB, Giese J. 1990. Normal renal tubular response to changes of sodium intake in hypertensive man. J Hypertens 8:219–227.
Bucher HC, Cook RJ, Guyatt GH, Lang JD, Cook DJ, Hatala R, Hunt D. 1996. Effects of dietary calcium supplementation on blood pressure. A meta-analysis of randomized clinical trials. J Am Med Assoc 275:1016–1022.
Buckley MG, Markandu ND, Sagnella GA, MacGregor GA. 1994. Brain and atrial natriuretic peptides: A dual peptide system of potential importance in sodium balance and blood pressure regulation in patients with essential hypertension. J Hypertens 12:809–813.
Burney PG, Britton JR, Chinn S, Tattersfield AE, Platt HS, Papacosta AO, Kelson MC. 1986. Response to inhaled histamine and 24 hour sodium excretion. Br Med J 292:1483–1486.
Burnier M, Rutschmann B, Nussberger J, Versaggi J, Shahinfar S, Waeber B, Brunner HR. 1993. Salt-dependent renal effects of an angiotensin II antagonist in healthy subjects. Hypertension 22:339–347.
Burt VL, Whelton P, Roccella EJ, Brown C, Cutler JA, Higgins M, Horan MJ, Labarthe D. 1995. Prevalence of hypertension in the United States adult population. Hypertension 25:305–313.
Burtis WJ, Gay L, Insogna KL, Ellison A, Broadus AE. 1994. Dietary hypercalcemia in patients with calcium oxalate kidney stones. Am J Clin Nutr 60:424–429.
Bushinsky DA. 1998. Acid-base imbalance and the skeleton. In: Burckhardt PB, Dawson-Hughes B, Heaney RP, eds. Nutritional Aspects of Osteoporosis. New York: Springer-Verlag. Pp. 208–217.
Calabrese EJ, Tuthill RW. 1985. The Massachusetts Blood Pressure Study, Part 3. Experimental reduction of sodium in drinking water: Effects on blood pressure. Toxicol Ind Health 1:19–34.
Cappuccio FP, Markandu ND, Sagnella GA, MacGregor GA. 1985. Sodium restriction lowers high blood pressure through a decreased response of the renin system—Direct evidence using saralasin. J Hypertens 3:243–247.
Cappuccio FP, Markandu ND, Beynon GW, Shore AC, MacGregor GA. 1986. Effect of increasing calcium intake on urinary sodium excretion in normotensive subjects. Clin Sci 71:453–456.
Cappuccio FP, Markandu ND, Carney C, Sagnella GA, MacGregor GA. 1997. Double-blind randomized trial of modest salt restriction in older people. Lancet 350:850–854.
Carey OJ, Locke C, Cookson JB. 1993. Effect of alterations of dietary sodium on the severity of asthma in men. Thorax 48:714–718.
Carmichael S, Abrams B, Selvin S. 1997. The pattern of maternal weight gain in women with good pregnancy outcomes. Am J Public Health 87:1984–1988.
Carter EP, Barrett AD, Heeley AF, Kuzemko JA. 1984. Improved sweat test method for the diagnosis of cystic fibrosis. Arch Dis Child 59:919–922.
Casale PN, Devereux RB, Milner M, Zullo G, Harshfield GA, Pickering TG, Laragh JH. 1986. Value of echocardiographic measurement of left ventricular mass in predicting cardiovascular morbid events in hypertensive men. Ann Intern Med 105:173–178.
Castenmiller JJM, Mensink RP, van der Heijden L, Kouwenhoven T, Hautvast J, de Leeuw PW, Schaafsma G. 1985. The effect of dietary sodium on urinary calcium and potassium excretion in normotensive men with different calcium intakes. Am J Clin Nutr 41:52–60.
CDC (Centers for Disease Control and Prevention). 1979. Infant metabolic alkalosis and soy-based formula. Morb Mortal Wkly Rep 28:358–359.
CDC. 1980. Follow-up on formula-associated illness in children. Morb Mortal Wkly Rep 29:124–129.
CDC. 2002. Iodine Level, United States, 2000. Online. Available at http://www.cdc.gov/nchs/products/pubs/pubd/hestats/iodine.htm. Accessed February 2, 2004.
CFSAN (Center for Food Safety and Applied Nutrition). 2001. Fish and Fisheries Products Hazards and Controls Guidance, 3rd ed. Rockville, MD: Food and Drug Administration.
Chan ELP, Ho CS, MacDonald D, Ho SC, Chan TYK, Swaminathan R. 1992. Interrelationships between urinary sodium, calcium, hydroxyproline and serum PTH in healthy subjects. Acta Endocrinol 127:242–245.
Chance GW, Radde IC, Willis DM, Roy RN, Park E, Ackerman I. 1977. Postnatal growth of infants of <1.3 kg birth weight: Effects of metabolic acidosis, of
caloric intake, and of calcium, sodium, and phosphate supplementation. J Pediatr 91:787–793.
Chen J, Delaney KH, Kwiecien JM, Lee RM. 1997. The effects of dietary sodium on hypertension and stroke development in female stroke-prone spontaneously hypertensive rats. Exp Mol Pathol 64:173–183.
Chesley LC. 1978. Hypertensive Disorders in Pregnancy. New York: Appleton-Century-Crofts.
Chesley LC, Velenti C, Rein H. 1958. Excretion of water loads by nonpregnant and pregnant normal, hypertensive, and pre-eclamptic women. Metabolism 7:575–588.
Chobanian AV, Bakris GL, Black HR, Cushman WC, Green LA, Izzo JL Jr, Jones DW, Materson BJ, Oparil S, Wright JT Jr, Roccella EJ, National High Blood Pressure Education Program Coordinating Committee. 2003. Seventh report of the Joint National Committee on Prevention, Detection, Evaluation, and Treatment of High Blood Pressure. Hypertension 42:1206–1252.
Churchill D, Beevers DG. 1999. Hypertension in Pregnancy. London: British Medical Association.
Clapp JF. 1991. The changing thermal response to endurance exercise during pregnancy. Am J Obstet Gynecol 165:1684–1689.
Cobiac L, Nestel PJ, Wing LMH, Howe PRC. 1992. A low-sodium diet supplemented with fish oil lowers blood pressure in the elderly. J Hypertens 10:87–92.
Coggon D, Barker DJP, Cole RB, Nelson M. 1989. Stomach cancer and food storage. J Natl Cancer Inst 81:1178–1182.
Cohen AJ, Roe FJC. 1997. Evaluation of the aetiological role of dietary salt exposure in gastric and other cancers in humans. Food Chem Toxicol 35:271–293.
Cohen JD, Grandits G, Cutler J, Neaton JD, Kuller LH, Stamler J. 1999. Dietary sodium intake and mortality: MRFIT follow up study results. Circulation 100:2758.
Collins R, Yusuf S, Peto R. 1985. Overview of randomized trials of diuretics in pregnancy. Br Med J 290:17–23.
Conn JW. 1949. The mechanism of acclimatization to heat. Adv Intern Med 3:373–393.
Consolazio CF, Matoush LO, Nelson RG, Harding RS, Canham JE. 1963. Excretion of sodium, potassium, magnesium and iron in human sweat and the relation of each to balance and requirements. J Nutr 79:407–415.
Cook NR, Cutler JA, Hennekens CH. 1995a. An unexpected result from sodium—Causal or casual? Hypertension 25:1153–1154.
Cook NR, Cohen J, Hebert PR, Taylor JO, Hennekens CH. 1995b. Implications of small reductions in diastolic blood pressure for primary prevention. Arch Intern Med 155:701–709.
Cook NR, Kumanyika SK, Cutler JA. 1998. Effect of change in sodium excretion on change in blood pressure corrected for measurement error: The Trials of Hypertension Prevention, Phase I. Am J Epidemiol 148:431–444.
Cooper R, Liu K, Trevisan M, Miller W, Stamler J. 1983. Urinary sodium excretion and blood pressure in children: Absence of a reproducible association. Hypertension 5:135–139.
Cooper R, Van Horn L, Liu K, Trevisan M, Nanas S, Ueshima H, Larbi E, Yu CS, Sempos C, LeGrady D, Stamler J. 1984. A randomized trial on the effect of decreased dietary sodium intake on blood pressure in adolescents. J Hypertens 2:361–366.
Correa P, Haenszel W, Cuello C, Tannenbaum S, Archer M. 1975. A model for gastric cancer epidemiology. Lancet 2:58–60.
Coyle P. 1988. High NaCl predisposes Dahl rats to cerebral infarction after middle cerebral artery occlusion. Hypertension 12:96–101.
Craddick SR, Elmer PJ, Obarzanek E, Vollmer WM, Svetkey LP, Swain MC. 2003. The DASH diet and blood pressure. Curr Atheroscler Rep 5:484–491.
Crane MG, Harris JJ. 1976. Effect of aging on renin activity and aldosterone excretion. J Lab Clin Med 87:947–959.
Crocco SC. 1982. The role of sodium in food processing. J Am Diet Assoc 80:36–39.
Cugini P, Murano G, Lucia P, Letizia C, Scavo D, Halberg F, Schramm H. 1987. The gerontologic decline of the renin-aldosterone system: A chronobiological approach extended to essential hypertension. J Gerontol 42:461–465.
Curhan GC, Willett WC, Speizer FE, Spiegelman D, Stampfer MJ. 1997. Comparison of dietary calcium with supplemental calcium and other nutrients as factors affecting the risk of kidney stones in women. Ann Intern Med 126:497–504.
Cutler JA, Brittain E. 1990. Calcium and blood pressure. An epidemiologic perspective. Am J Hypertens 3:137S–146S.
Cutler JA, Follmann D, Elliott P, Suh I. 1991. An overview of randomized trials of sodium reduction and blood pressure. Hypertension 17:I34S–I35S.
Cutler JA, Follmann D, Allender PS. 1997. Randomized trials of sodium reduction: An overview. Am J Clin Nutr 65:643S–651S.
Dahl LK. 1958. Salt intake and salt need. N Engl J Med 258:1152–1156.
Dahl LK. 1960. Possible role of salt intake in the development of essential hypertension. In: Block KD, Cottier PT, eds. Essential Hypertension, an International Symposium. Berlin: Springer-Verlag. Pp. 53–65.
Dahl LK. 1968. Salt in processed baby foods. Am J Clin Nutr 21:787–792.
Dahl LK, Stall BG, Cotzias GC. 1955. Metabolic effects of marked sodium restriction in hypertensive patients: Skin electrolyte losses. J Clin Invest 34:462–470.
Daniels SD, Meyer RA, Loggie JM. 1990 Determinants of cardiac involvement in children and adolescents with essential hypertension. Circulation 82:1243–1248.
Dawson-Hughes B, Fowler SE, Dalsky G, Gallagher C. 1996. Sodium excretion influences calcium homeostasis in elderly men and women. J Nutr 126:2107–2112.
de Chatel R, Weidmann P, Flammer J, Ziegler WH, Beretta-Piccoli C, Vetter W, Reubi FC. 1977. Sodium, renin, aldosterone, catecholamines, and blood pressure in diabetes mellitus. Kidney Int 12:412–421.
Dekkers JC, Snieder H, Van Den Oord EJ, Treiber FA. 2002. Moderators of blood pressure development from childhood to adulthood: A 10-year longitudinal study. J Pediatr 141:770–779.
Del Rio A, Rodriguez-Villamil JL. 1993. Metabolic effects of strict salt restriction in essential hypertensive patients. J Intern Med 233:409–414.
de Simone G, Devereux RB, Roman MJ, Alderman MH, Laragh JH. 1994. Relation of obesity and gender to left ventricular hypertrophy in normotensive and hypertensive adults. Hypertension 23:600–606.
Devine A, Criddle AR, Dick IM, Kerr DA, Prince RL. 1995. A longitudinal study of the effect of sodium and calcium intakes on regional bone density in postmenopausal women. Am J Clin Nutr 62:740–745.
de Wardener HE. 1999. Salt reduction and cardiovascular risk: The anatomy of a myth. J Hum Hypertens 13:1–4.
de Wardener HE, MacGregor GA. 1980. Dahl’s hypothesis that a saluretic substance may be responsible for a sustained rise in arterial pressure: Its possible role in essential hypertension. Kidney Int 18:1–9.
Dewey KG, Lonnerdal B. 1983. Milk and nutrient intake of breast-fed infants from 1 to 6 months: Relation to growth and fatness. J Pediatr Gastroenterol Nutr 2:497–506.
Dodson PM, Beevers M, Hallworth R, Webberley MJ, Fletcher RF, Taylor KG. 1989. Sodium restriction and blood pressure in hypertensive type II diabetics: Randomized blind controlled and crossover studies of moderate sodium restriction and sodium supplementation. Br Med J 298:227–230.
Dole VP, Dahl LK, Cotzias GC, Eder HA, Krebs ME. 1950. Dietary treatment of hypertension: Clinical and metabolic studies of patients on the rice-fruit diet. J Clin Invest 39:1189–1206.
du Cailar G, Ribstein J, Grolleau R, Mimran A. 1989. Influence of sodium intake on left ventricular structure in untreated essential hypertensives. J Hypertens 7:S258–S289.
du Cailar GD, Ribstein J, Daures JP, Mimran A. 1992. Sodium and left ventricular mass in untreated hypertensive and normotensive subjects. Heart Circ Physiol 32:H177–H181.
du Cailar G, Ribstein J, Mimran A. 2002. Dietary sodium and target organ damage in essential hypertension. Am J Hypertens 15:222–229.
Durr JA, Lindheimer MD. 1999. Control of volume and body tonicity. In: Lindheimer, MD, Roberts JM, Cunningham FG, eds. Chesley’s Hypertensive Disorders in Pregnancy, 2nd ed. Stamford, CT: Appleton & Lange. Pp. 103–166.
Duvekot JJ, Cheriex EC, Peters FAA, Menheere PP, Peeters LH. 1993. Early pregnancy changes in hemodynamics and volume homeostasis are consecutive adjustments triggered by a primary fall in systemic vasculature tone. Am J Obstet Gynecol 169:1382–1392.
Egan BM, Stepniakowski KT. 1997. Adverse effects of short-term, very-low-salt diets in subjects with risk-factor clustering. Am J Clin Nutr 65:671S–677S.
Egan BM, Weder AB, Petrin J, Hoffman RG. 1991. Neurohormonal and metabolic effects of short-term dietary NaCl restriction in men. Am J Hypertens 4:416–421.
Egan BM, Stepniakowski K, Goodfriend TL. 1994. Renin and aldosterone are higher and the hyperinsulinemic effect of salt restriction greater in subjects with risk factors clustering. Am J Hypertens 7:886–893.
Elliott P. 1991. Observational studies of salt and blood pressure. Hypertension 17:I3S–I8S.
Elliott P, Stamler J, Nichols R, Dyer AR, Stamler R, Kesteloot H, Marmot M. 1996. Intersalt revisited: Further analyses of 24 hour sodium excretion and blood pressure within and across populations. Br Med J 312:1249–1253.
Ellison RC, Capper AL, Stephenson WP, Goldberg RJ, Hosmer DW Jr, Humphrey KF, Ockene JK, Gamble WJ, Witschi JC, Stare FJ. 1989. Effects on blood pressure of a decrease in sodium use in institutional food preparation: The Exeter-Andover Project. J Clin Epidemiol 42:201–208.
Epstein M, Hollenberg NK. 1976. Age as a determinant of renal sodium conservation in normal man. J Lab Clin Med 87:411–417.
Eurogast Study Group. 1993. An international association between Helicobacter pylori infection and gastric cancer. Lancet 341:1359–1362.
Evans CEL, Chughtai AY, Blumsohn A, Giles M, Eastell R. 1997. The effect of dietary sodium on calcium metabolism in premenopausal and postmenopausal women. Eur J Clin Nutr 51:393–399.
Fagerberg B, Berglund A, Andersson OK, Berglund G, Wikstrand J. 1991. Cardiovascular effects of weight reduction versus antihypertensive drug treatment: A comparative, randomized, 1-year study of obese men with mild hypertension. J Hypertens 9:431–439.
FDA (Food and Drug Administration). 1985. Nutrient requirements for infant formula. Fed Regis 50:45106–45108.
Feldman RD, Schmidt ND. 1999. Moderate dietary salt restriction increases vascular and systemic insulin resistance. Am J Hypertens 12:643–647.
Feldman RD, Logan AG, Schmidt ND. 1996. Dietary salt restriction increases vascular insulin resistance. Clin Pharmacol Ther 60:444–451.
Ferrara LA, de Simone G, Pasanisi F, Mancini M, Mancini M. 1984. Left ventricular mass reduction during salt depletion in arterial hypertension. Hypertension 6:755–759.
Ferri C, Bellini C, Carlomagno A, Desideri G, Santucci A. 1996. Active kallikrein response to changes in sodium-chloride intake in essential hypertensive patients. J Am Soc Nephrol 7:443–453.
Fine BP, Ty A, Lestrange N, Levine OR. 1987. Sodium deprivation growth failure in the rat: Alterations in tissue composition and fluid spaces. J Nutr 117:1623–1628.
Fliser D, Nowack R, Allendorf-Ostwald N, Kohl B, Hubinger A, Ritz E. 1993. Serum lipid changes on low salt diet. Effects of α1-adrenergic blockade. Am J Hypertens 6:320–324.
Fotherby MD, Potter JF. 1992. Potassium supplementation reduces clinic and ambulatory blood pressure in elderly hypertensive patients. J Hypertens 10:1403–1408.
Fotherby MD, Potter JF. 1993. Effects of moderate sodium restriction on clinic and twenty-four-hour ambulatory blood pressure in elderly hypertensive subjects. J Hypertens 11:657–663.
Franx A, Steegers EAP, de Boo T, Thien T, Merkus JMWM. 1999. Sodium-blood pressure interrelationship in pregnancy. J Hum Hypertens 13:159–166.
Fregly MJ. 1984. Sodium and potasium. In: Nutrition Reviews’ Present Knowledge in Nutrition, 5th ed. Washington, DC: The Nutrition Foundation. Pp. 439–458.
Frost CD, Law MR, Wald NJ. 1991. By how much does dietary salt reduction lower blood pressure? II. Analysis of observational data within populations. Br Med J 302:815–818.
Fuchs FD, Wannmacher CM, Wannmacher L, Guimaraes FS, Rosito GA, Gastaldo G, Hoeffel CP, Wagner EM. 1987. Effect of sodium intake on blood pressure, serum levels and renal excretion of sodium and potassium in normotensives with and without familial predisposition to hypertension. Braz J Med Biol Res 20:25–34.
Fukumoto T, Tanaka T, Fujioka H, Yoshihara S, Ochi T, Kuroiwa A. 1988. Differences in composition of sweat induced by thermal exposure and by running exercise. Clin Cardiol 11:707–709.
Gardenswartz MH, Berl T. 1981. Drug-induced changes in water excretion. Kidney 14:19–26.
Garzon P, Eisenberg MJ. 1998. Variation in the mineral content of commercially available bottled waters: Implications for health and disease. Am J Med 105:125–130.
Geleijnse JM, Grobbee DE, Hofman A. 1990. Sodium and potassium intake and blood pressure change in childhood. Br Med J 300:899–902.
Geleijnse JM, Witteman JC, Bak AA, den Breejen JH, Grobbee DE. 1995. Long-term moderate sodium restriction does not adversely affect the serum HDL/total cholesterol ratio. J Hum Hypertens 9:975–979.
Geleijnse JM, Hofman A, Witteman JCM, Hazebroek AAJM, Valenburg HA, Grobbee DE. 1997. Long-term effects of neonatal sodium restriction on blood pressure. Hypertension 29:913–917.
Geleijnse JM, Kok FJ, Grobbee DE. 2003. Blood pressure response to changes in sodium and potassium intake: A metaregression analysis of randomised trials. J Hum Hypertens 17:471–480.
Gerdts E, Myking OL, Omvik P. 1996. Factors influencing left ventricular mass in hypertensive type-1 diabetic patients. Am J Hypertens 9:65A.
Ghali JK III, Liao Y, Cooper RS. 1997. Left ventricular hypertrophy in the elderly. Am J Geriatr Cardiol 6:38–49.
Gillman MW, Cook NR, Rosner B, Evans DA, Keough ME, Taylor JO, Hennekens CH. 1993. Identifying children at high risk for the development of essential hypertension. J Pediatr 122:837–846.
Gillum RF, Elmer PJ, Prineas RJ. 1981. Changing sodium intake in children. The Minneapolis Children’s Blood Pressure Study. Hypertension 3:698–703.
Ginty F, Flynn A, Cashman KD. 1998. The effects of dietary sodium intake on biochemical markers of bone metabolism in young women. Br J Nutr 79:343–350.
Gleibermann L. 1973. Blood pressure and dietary salt in human populations. Ecol Food Nutr 2:143–156.
Gotshall RW, Mickleborough TD, Cordain L. 2000. Dietary salt restricition improves pulmonary function in exercise-induced asthma. Med Sci Sports Exerc 32:1815–1819.
Graham S, Haughey B, Marshall J, Brasure J, Zielezny M, Freudenheim J, West D, Nolan J, Wilkinson G. 1990. Diet in the epidemiology of gastric cancer. Nutr Cancer 13:19–34.
Graudal NA, Galloe AM, Garred P. 1998. Effects of sodium restriction on blood pressure, renin, aldosterone, catecholamines, cholesterols, and triglyceride. A meta-analysis. J Am Med Assoc 279:1383–1391.
Greendale GA, Barrett-Connor E, Edelstein S, Ingles, Haile R. 1994. Dietary sodium and bone mineral density: Results of a 16 year follow-up. J Am Geriatr Soc 42:1050–1055.
Grey A, Braatvedt G, Holdaway I. 1996. Moderate dietary salt restriction does not alter insulin resistance or serum lipids in normal men. Am J Hypertens 9:317–322.
Griffith LE, Guyatt GH, Cook RJ, Bucher HC, Cook DJ. 1999. The influence of dietary and nondietary calcium supplementation on blood pressure: An updated metaanalysis of randomized controlled trials. Am J Hypertens 12:84–92.
Grim CE, Weinberger MH, Higgins JT Jr, Kramer NJ. 1977. Diagnosis of secondary forms of hypertension: A comprehensive protocol. J Am Med Assoc 237:1331–1335.
Grobbee DE, Hofman A, Roelandt JT, Boomsma F, Schalekamp MA, Valkenburg HA. 1987. Sodium restriction and potassium supplementation in young people with mildly elevated blood pressure. J Hypertens 5:115–119.
Gross P, Ketteler M, Hausmann C, Reinhard C, Schomig A, Hackenthal E, Ritz E, Rascher W. 1988. Role of diuretics, hormonal derangements, and clinical setting of hyponatremia in medical patients. Klin Wochenschr 66:662–669.
Gross SJ, David RJ, Bauman L, Tomarelli RM. 1980. Nutritional composition of milk produced by mothers delivering preterm. J Pediatr 96:641–644.
Grossman H, Duggan E, McCamman S. 1980. The dietary chloride deficiency syndrome. Pediatrics 66:366–374.
Gu D, He J, Wu X, Duan X, Whelton PK. 2001. Effect of potassium supplementation on blood pressure in Chinese: A randomized, placebo-controlled trial. J Hypertens 19:1325–1331.
Hajjar I, Kotchen TA. 2003. Trends in prevalence, awareness, treatment, and control of hypertension in the United States, 1988-2000. J Am Med Assoc 290:199–206.
Hajjar IM, Grim CE, George V, Kotchen TA. 2001. Impact of diet on blood pressure and age-related changes in blood pressure in the US population. Arch Intern Med 161:589–593.
Hall JE, Coleman TG, Guyton AC. 1989. The renin–angiotensin system: Normal physiology and changes in older hypertensives. J Am Geront Soc 37:801–813.
Hall JE, Kuo JJ, da Silva AA, de Paula RB, Liu J, Tallam L. 2003. Obesity-associated hypertension and kidney disease. Curr Opin Nephrol Hypertens 12:195–200.
Hamet P, Mongeau E, Lambert J, Bellavance F, Daignault-Gelinas M, Ledoux M, Whissell-Cambiotti L. 1991. Interactions among calcium, sodium, and alcohol intake as determinants of blood pressure. Hypertension 17:I150–I154.
Hargreaves M, Morgan TO, Snow R, Guerin M. 1989. Exercise tolerance in the heat on low and normal salt intakes. Clin Sci 76:553–557.
Harsha DW, Sacks FM, Obarzanek E, Svetkey LP, Lin PH, Bray GA, Aickin M, Colin PR, Miller ER III, Appell LJ. 2004. Effect of dietary sodium intake on blood lipids. Results from the DASH-Sodium Trial. Hypertension 43:393–398.
Harshfield GA, Alpert BS, Becker JA. 1992. Correlates of LV mass index in healthy adolescents. Hypertension 20:422.
Harshfield GA, Koelsch DW, Pulliam DA, Alpert BS, Richey PA, Becker JA. 1994. Racial differences in the age-related increase in left ventricular mass in youths. Hypertension 24:747–751.
He FJ, MacGregor GA. 2002. Effects of modest salt reduction on blood pressure: A meta-analysis of randomized trials. Implications for public health. J Hum Hypertens 16:761–770.
He FJ, Markandu ND, Sagnella GA, MacGregor GA. 1998. Importance of the renin system in determining blood pressure fall with salt restriction in black and white hypertensives. Hypertension 32:820–824.
He FJ, Markandu ND, MacGregor GA. 2001. Importance of the renin system in determining blood pressure fall with acute salt restriction in hypertensive and normotensive whites. Hypertension 38:321–325.
He J, Klag MJ, Coresh J, Whelton PK. 1994. Age, body mass, and dietary intake of protein and fiber modify the salt-blood pressure relationship. Circulation 90:I503.
He J, Ogden LG, Vupputuri S, Bazzano L, Loria C, Whelton PK. 1999. Dietary sodium intake and subsequent risk of cardiovascular disease in overweight adults. J Am Med Assoc 282:2027–2034.
He J, Whelton PK, Appel LJ, Charleston J, Klang MJ. 2000. Long-term effects of weight loss and dietary sodium reductions on incidence of hypertension. Hypertension 35:544–549.
He J, Ogden LG, Bazzano LA, Vupputuri S, Loria C, Whelton PK. 2002. Dietary sodium intake and incidence of congestive heart failure in overweight US men and women: First National Health and Nutrition Examination Survey Epidemiologic Follow-up study. Arch Intern Med 162:1619–1624.
Health Canada. 2003. Food Program. Consolidation of the Food and Drug Act and the Food and Drug Regulations. Division 25 Infant Foods, Infant Formula. Online. Available at http://www.hc-sc.gc.ca/food-aliment/friia-raaii/food_drugs-aliments_drogues/act-loi/e_index.html. Accessed January 13, 2004.
Henneman PH, Dempsey EF. 1956. Factors determining fecal electrolyte excretion. J Clin Invest 35:711.
Hoffman CJ. 1988. Does the sodium level in drinking water affect blood pressure levels? J Am Diet Assoc 88:1432–1435.
Hofman A, Hazebroek A, Valkenburg HA. 1983. A randomized trial of sodium intake and blood pressure in newborn infants. J Am Med Assoc 250:370–373.
Holbrook JT, Patterson KY, Bodner JE, Douglas LW, Veillon C, Kelsay JL, Mertz W, Smith JC. 1984. Sodium and potassium intake and balance in adults consuming self-selected diets. Am J Clin Nutr 40:786–793.
Honjo S, Kono S, Yamaguchi M. 1994. Salt and geographic variation in stomach cancer mortality in Japan. Cancer Causes Control 5:285–286.
Hooper L, Bartlett C, Smith GD, Ebrahim S. 2002. Systematic review of long term effects of advice to reduce dietary salt in adults. Br Med J 325:628–637.
Hooper L, Bartlett C, Davey SM, Ebrahim S. 2003. Reduced dietary salt for prevention of cardiovascular disease. Cochrane Database Syst Rev 1: CD003656.
Hoshiyama Y, Sasaba T. 1992. A case-control study of single and multiple stomach cancers in Saitama Prefecture, Japan. Jpn J Cancer Res 83:937–947.
Houlihan CA, Allen TJ, Baxter AL, Panangiotopoulos S, Casley DJ, Cooper ME, Jerums G. 2002. A low-sodium diet potentiates the effects of Losartan in type 2 diabetes. Diabetes Care 25:663–671.
Howe PR, Cobiac L, Smith RM. 1991. Lack of effect of short-term changes in sodium intake on blood pressure in adolescent schoolchildren. J Hypertens 9:181–186.
Howe PRC, Jureidini KF, Smith RM. 1985. Sodium and blood pressure in children—A short term dietary intervention study. Proc Nutr Soc Aust 10:121–124.
Hunt SC, Cook NR, Oberman A, Cutler JA, Hennekens CH, Allender PS, Walker WG, Whelton PK, Williams RR. 1998. Angiotensinogen genotype, sodium reduction, weight loss, and prevention of hypertension: Trials of Hypertension Prevention, Phase II. Hypertension 32:393–401.
Hunt SC, Geleijnse JM, Wu LL, Witteman JCM, Williams RR, Grobbee DE. 1999. Enhanced blood pressure response to mild sodium reduction in subjects with the 235T variant of the angiotensinogen gene. Am J Hypertens 12:460–466.
Hypertension Prevention Trial Research Group. 1990. The Hypertension Prevention Trial: Three-year effects of dietary changes on blood pressure. Arch Intern Med 150:153–162.
Hytten FE. 1980. Weight gain in pregnancy. In: Hytten FE, Chamberlain G, eds. Clinical Physiology in Obstetrics. Oxford: Blackwell Scientific. Pp. 193–230.
Ikeda M, Kasahara M, Koizumi A, Watanabe T. 1986. Correlation of cerebrovascular disease standardized mortality ratios with dietary sodium and the sodium/potassium ratio among the Japanese population. Prev Med 15:46–59.
Ikeda M, Nakatsuka H, Watanabe T. 1988. The absence of correlation between Na in diet duplicates and stomach cancer mortality in Japan. Tohoku J Exp Med 155:285–294.
Inoue Y, Havenith G, Kenney WL, Loomis JL, Buskirk ER. 1999. Exercise- and methylcholine-induced sweating responses in older and younger men: Effect of heat acclimation and aerobic fitness. Int J Biometeorol 42:210–216.
IOM (Institute of Medicine). 1997. Dietary Reference Intakes for Calcium, Phosphorus, Magnesium, Vitamin D, and Fluoride. Washington, DC: National Academy Press.
IOM. 1998. Dietary Reference Intakes for Thiamin, Riboflavin, Niacin, Vitamin B6, Folate, Vitamin B12, Pantothenic Acid, Biotin, and Choline. Washington, DC: National Academy Press.
IOM. 2000a. Dietary Reference Intakes: Applications in Dietary Assessment. Washington, DC: National Academy Press.
IOM. 2000b. Dietary Reference Intakes for Vitamin C, Vitamin E, Selenium, and Carotenoids. Washington, DC: National Academy Press.
IOM. 2001. Dietary Reference Intakes for Vitamin A, Vitamin K, Arsenic, Boron, Chromium, Copper, Iodine, Iron, Manganese, Molybdenum, Nickel, Silicon, Vanadium, and Zinc. Washington, DC: National Academy Press.
IOM. 2002/2005. Dietary Reference Intakes for Energy, Carbohydrate, Fiber, Fat, Fatty Acids, Cholesterol, Protein, and Amino Acids. Washington, DC: The National Academies Press.
IOM. 2003. Food Chemicals Codex, 5th ed. Washington, DC: The National Academies Press.
Itoh R, Suyama Y. 1996. Sodium excretion in relation to calcium and hydroxyproline excretion in a healthy Japanese population. Am J Clin Nutr 63:735–740.
Jay JM. 1996. Modern Food Microbiolog. 5th ed. New York: Chapman and Hall.
Jee SH, Miller ER, Guallar E, Singh VK, Appel LJ, Klag MJ. 2002. The effect of magnesium supplementation on blood pressure: A meta-analysis of randomized clinical trials. Am J Hypertens 15:691–696.
JNC (Joint National Committee on Prevention, Detection, Evaluation, and Treatment of High Blood Pressure). 1997. The sixth report of the Joint National Committee on Prevention, Detection, Evaluation, and Treatment of High Blood Pressure. Arch Intern Med 157:2413–2446.
Joffres MR, Hamet P, MacLean DR, L’italien GJ, Fodor G. 2001. Distribution of blood pressure and hypertension in Canada and the United States. Am J Hypertens 14:1099–1105.
Johnson AG, Nguyen TV, Davis D. 2001. Blood pressure is linked to salt intake and modulated by the angiotensinogen gene in normotensive and hypertensive elderly subjects. J Hypertens 19:1053–1060.
Johnson RJ, Herrera-Acosta J, Schreiner GF, Rodriguez-Iturbe B. 2002. Subtle acquired renal injury as a mechanism of salt-sensitive hypertension. N Engl J Med 346:913–923.
Jones G, Beard T, Parameswaran V, Greenaway T, von Witt R. 1997. A population-based study of the relationship between salt intake, bone resorption and bone mass. Eur J Clin Nutr 51:561–565.
Joossens JV, Hill ML, Elliott P, Stamler R, Stamler J, Lesaffre E, Dyer A, Nichols R, Kesteloot H. 1996. Dietary salt, nitrate and stomach cancer mortality in 24 countries. Int J Epidemiol 25:494–504.
Jula AM, Karanko HM. 1994. Effects on left ventricular hypertrophy of long-term nonpharmacological treatment with sodium restriction in mild to moderate essential hypertension. Circulation 89:1023–1031.
Kagan A, Popper JS, Rhoads GG, Yano K. 1985. Dietary and other risk factors for stroke in Hawaiian Japanese men. Stroke 16:390–396.
Kalksma R, Leemhuis MP. 2002. Hyponatremia caused by thiazide diuretics: Be aware of drug combinations which enhance this effect. Ned Tijdschr Geneeskd 146:1521–1525.
Kannel WB. 1991. Left ventricular hypertrophy as a risk factor: The Framingham experience. J Hypertens 9:3S–8S.
Karanja NM, Obarzanek E, Lin PH, McCullough ML, Phillips KM, Swain JF, Champagne CM, Hoben KP. 1999. Descriptive characteristics of the dietary patterns used in the Dietary Approaches to Stop Hypertension Trial. J Am Diet Assoc 99:19S–27S.
Kawasaki T, Delea CS, Bartter FC, Smith H. 1978. The effect of high sodium and low sodium intakes on blood pressure and other related variables in human subjects with idiopathic hypertension. Am J Med 64:193–198.
Keenan BS, Buzek SW, Garza C, Potts E, Nichols BL. 1982. Diurnal and longitudinal variations in human milk sodium and potassium: Implication for nutrition and physiology. Am J Clin Nutr 35:527–534.
Kempner W. 1948. Treatment of hypertensive vascular disease with rice diet. Am J Med 4:545–577.
Kesteloot H, Joossens JV. 1988. Relationship of dietary sodium, potassium, calcium, and magnesium with blood pressure. Hypertension 12:594–599.
Khaw KT, Barrett-Connor E. 1988. The association between blood pressure, age, and dietary sodium and potassium: A population study. Circulation 77:53–61.
Khaw KT, Barrett-Connor E. 1990. Increasing sensitivity of blood pressure to dietary sodium and potassium with increasing age: A population study using casual urine specimens. Am J Hypertens 3:505–511.
Kini N, Zahn S, Werlin SL. 1995. Hypernatremic dehydration in breast-fed infants. Wis Med J 94:143–145.
Kirby CR, Convertino VA. 1986. Plasma aldosterone and sweat sodium concentrations after exercise and heat acclimation. J Appl Physiol 61:967–970.
Kirkendall WM, Conner EW, Abboud F, Rastogi SP, Anderson TA, Fry M. 1976. The effect of dietary sodium chloride on blood pressure, body fluids, electrolytes, renal function, and serum lipids of normotensive man. J Lab Clin Med 87:418–434.
Klag MJ, Whelton PK, Randall BL, Neaton JD, Brancati FL, Ford CE, Shulman NB, Stamler J. 1996. Blood pressure and end-stage renal disease in men. N Engl J Med 334:13–18.
Klag MJ, Whelton PK, Randall BL, Neaton JD, Brancati FL, Stamler J. 1997. End-stage renal disease in African-American and white men: 16-year MR-FIT findings. J Am Med Assoc 277:1293–1298.
Klahr S, Levey AS, Beck GJ, Caggiula AW, Hunsicker L, Kusek JW, Striker G. 1994. The effects of dietary protein restriction and blood pressure control on the progression of chronic renal disease. N Engl J Med 330:877–884.
Klingbeil AU, Schneider M, Martus P, Messerli FH, Schmieder RE. 2003. A metaanalysis of the effects of treatment on left ventricular mass in essential hypertension. Am J Med 115:41–46.
Kneller RW, Guo WD, Hsing AW, Chen JS, Blot WJ, Li JY, Forman D, Fraumeni JF. 1992. Risk factors for stomach cancer in sixty-five Chinese counties. Cancer Epidemiol Biomarkers Prev 1:113–118.
Knuist M, Bonsel GJ, Zondervan HA, Treffers PE. 1998. Low sodium diet and pregnancy-induced hypertension: A multi-centre randomized controlled trial. Br J Obstet Gynaecol 105:430–434.
Koga M, Sasaguri M, Miura S, Tashiro E, Kinoshita A, Ideishi M, Arakawa K. 1998. Plasma renin activity could be a useful predictor of left ventricular hypertrophy in essential hypertensives. J Hum Hypertens 12:455–461.
Koolen MI, van Brummelen P. 1984. Sodium sensitivity in essential hypertension: Role of the renin-angiotensin-aldosterone system and predictive value of an intravenous frusemide test. J Hypertens 2:55–59.
Koren MJ, Devereux RB, Casale PN, Savage DD, Laragh JH. 1991. Relation of left ventricular mass and geometry to morbidity and mortality in uncomplicated essential hypertension. Ann Intern Med 114:345–352.
Korhonen MH, Jarvinen MK, Sarkkinen ES, Uusitupa MIJ. 2000. Effects of a salt-restricted diet on the intake of other nutrients. Am J Clin Nutr 72:414–420.
Kotchen TA. 1999. To salt, or not to salt? Am J Physiol 276:H1807–H1810.
Kriemler S, Wilk B, Schurer W, Wilson WM, Bar-Or O. 1999. Preventing dehydration in children with cystic fibrosis who exercise in the heat. Med Sci Sports Exerc 31:774–779.
Krishna GG, Miller E, Kapoor S. 1989. Increased blood pressure during potassium depletion in normotensive men. N Engl J Med 320:1177–1182.
Kumanyika SK, Hebert PR, Cutler JA, Lasser VI, Sugars CP, Steffen-Batey L, Brewer AA, Cameron M, Shepak LD, Cook NR, Miller ST. 1993. Feasibility and efficacy of sodium reduction in the Trials of Hypertension Prevention, Phase I. Hypertension 22:502–512.
Kupari M, Koskinen P, Virolainen J. 1994. Correlates of left ventricular mass in a population sample aged 36 to 37 years: Focus on lifestyle and salt intake. Circulation 89:1041–1050.
Kurtz TW, Al-Bander HA, Morris RC. 1987. “Salt-sensitive” essential hypertension in men. N Engl J Med 317:1043–1048.
Langenfeld MRW, Schobel H, Veelken R, Weihprecht H, Schmieder RE. 1998. Impact of dietary sodium intake on left ventricular diastolic filling in early essential hypertension. Eur Heart J 19:951–958.
La Vecchia C, Negri E, Franceschi S, Decarli A. 1997. Case-control study on influence of methionine, nitrate, and salt on gastric carcinogenesis in Northern Italy. Nutr Cancer 27:65–68.
Law MR, Frost CD, Wald NJ. 1991a. By how much does dietary salt reduction lower blood pressure? I—Analysis of observational data among populations. Br Med J 302:811–815.
Law MR, Frost CD, Wald NJ. 1991b. By how much does dietary salt reduction lower blood pressure? III—Analysis of data from trials of salt reduction. Br Med J 302:819–824.
Lawton WJ, Sinkey CA, Fitz AE, Mark AL. 1988. Dietary salt produces abnormal renal vasoconstrictor responses to upright posture in borderline hypertensive subjects. Hypertension 11:529–536.
Lawton WJ, Fitz AE, Anderson EA, Sinkey CA, Coleman RA. 1990. Effect of dietary potassium on blood pressure, renal function, muscle sympathetic nerve activity, and forearm vascular resistance and flow in normotensive and borderline hypertensive humans. Circulation 81:173–184.
Lee JK, Park BJ, Yoo KY, Ahn YO. 1995. Dietary factors and stomach cancer: A case-control study in Korea. Int J Epidemiol 24:33–41.
Lemann J Jr, Gray RW, Pleuss JA. 1989. Potassium bicarbonate, but not sodium bicarbonate, reduces urinary calcium excretion and improves calcium balance in healthy men. Kidney Int 35:688–695.
Lemons JA, Moye L, Hall D, Simmons M. 1982. Differences in the composition of preterm and term human milk during early lactation. Pediatr Res 16:113–117.
Levy D, Garrison RJ, Savage DD, Kannel WB, Castelli WP. 1990. Prognostic implications of echocardiographically determined left ventricular mass in the Framingham Heart Study. N Engl J Med 322:1561–1566.
Lewington S, Clarke R, Qizilbash N, Peto R, Collins R. 2002. Age-specific relevance of usual blood pressure to vascular mortality: A meta-analysis of individual data for one million adults in 61 prospective studies. Lancet 360:1903–1913.
Liddle GW, Bennett LL, Forsham PH. 1953. The prevention of ACTH-induced sodium retention by the use of potassium salts: A quantitative study. J Clin Invest 32:1197–1207.
Liebson PR, Grandits G, Prineas R, Dianzumba S, Flack JM, Cutler JA, Grimm R,
Stamler J. 1993. Echocardiographic correlates of left ventricular structure among 844 mildly hypertensive men and women in the Treatment of Mild Hypertension Study (TOMHS). Circulation 87:476–486.
Liebson PR, Grandits GA, Dianzumba S, Prineas RJ, Grimm Jr RH, Neaton JD, Stamler J. 1995. Comparison of five antihypertensive monotherapies and placebo for change in left ventricular mass in patients receiving nutritional-hygienic therapy in the treatment of mild hypertension study (TOMHS). Circulation 91:698–706.
Lietz G, Avenell A, Robins S. 1997. Short-term effects of dietary sodium intake on bone metabolism in postmenopausal women measured using urinary deoxypyridinoline excretion. Br J Nutr 78:73–82.
Lifton RP, Wilson FH, Choate KA, Geller DS. 2002. Salt and blood pressure: New insight from human genetic studies. Cold Spring Harb Symp Quant Biol 67:445–450.
Lijnen P, M’Buyamba-Kabangu JR, Fagard R, Staessen J, Lissens W, Goossens W, Amery A. 1987. Dietary sodium variation, erythrocyte cationic transport and plasma rennin-aldosterone in men. Methods Find Exp Clin Pharmacol 9:55–62.
Lin PH, Ginty F, Appel LJ, Aickin M, Bohnannon A, Garnero P, Barclay D, Svetkey L. 2003. The DASH diet and sodium reduction improve markers of bone turnover and calcium metabolism in adults. J Nutr 133:3130–3136.
Lindheimer MD, Katz AI. 1985. Fluid and electrolyte metabolism in normal and abnormal pregnancy. In: Arieff AI, DeFronzo RA, eds. Fluid, Electrolyte, and Acid-Base Disorders. New York: Churchill Livingstone. Pp. 1041–1086.
Lindheimer MD, Katz AI. 2000. Renal physiology and disease in pregnancy. In: Seldin DW, Giebisch G, eds. The Kidney: Physiology and Pathophysiology, 3rd ed. New York: Lippincott Williams & Wilkins. Pp. 2597–2644.
Liu K, Cooper R, McKeever J, McKeever P, Byington R, Soltero I, Stamler R, Gosch F, Stevens E, Stamler J. 1979. Assessment of the association between habitual salt intake and high blood pressure: Methodological problems. Am J Epidemiol 110:219–226.
Liu L, Mizushima S, Ikeda K, Hattori H, Miura A, Gao M, Nara Y, Yamori Y. 2000. Comparative studies of diet-related factors and blood pressure among Chinese and Japanese: Results from the China-Japan cooperative research of the WHO-Cardiac study. Hypertens Res 23:413–420.
Longworth DL, Drayer JI, Weber MA, Laragh JH. 1980. Divergent blood pressure responses during short-term sodium restriction in hypertension. Clin Pharmacol Ther 27:544–546.
LSRO (Life Sciences Research Office). 1998. Assessment of nutrient requirements for infant formulas. J Nutr 128:2059S–2293S.
Luft FC, Rankin LI, Bloch R, Grim CE, Weyman AE, Murray RH, Weinberger MH. 1979a. Plasma and urinary norepinephrine values at extremes of sodium intake in normal man. Hypertension 1:261–266.
Luft FC, Rankin LI, Bloch R, Weyman AE, Willis LR, Murray RH, Grim CE, Weinberger MH. 1979b. Cardiovascular and humoral responses to extremes of sodium intake in normal black and white men. Circulation 60:697–706.
Luft FC, Fineberg NS, Miller JZ, Rankin LI, Grim CE, Weinberger MH. 1980. The effects of age, race, and heredity on glomerular filtration rate following volume expansion and contraction in normal man. Am J Med Sci 279:15–24.
Luft FC, Weinberger MH, Grim CE. 1982. Sodium sensitivity and resistance in normotensive humans. Am J Med 72:726–736.
Luft FC, Weinberger MH, Fineberg MS, Miller JZ, Grim CE. 1987. Effect of age on renal sodium homeostasis and its relevance to sodium sensitivity. Am J Med 82:9S–15S.
Luft FC, Zemel MB, Sowers JA, Fineberg NS, Weinberger MH. 1990. Sodium bicarbonate and sodium chloride: Effects on blood pressure and electrolyte homeostasis in normal and hypertensive man. J Hypertens 8:663–670.
Lutz J. 1984. Calcium balance and acid-base status of women as affected by increased protein intake and by sodium bicarbonate ingestion. Am J Clin Nutr 39:281–288.
MacGregor GA. 1996. Low urinary sodium and myocardial infarction. Hypertension 127:156.
MacGregor GA, Markandu ND, Best FE, Elder DM, Cam JM, Sagnella GA, Squires M. 1982a. Double-blind randomized crossover trial of moderate sodium restriction in essential hypertension. Lancet 1:351–355.
MacGregor GA, Markandu ND, Singer DR, Cappuccio FP, Shore AC, Sagnella GA. 1982b. Moderate potassium supplementation in essential hypertension. Lancet 2:567–570.
MacGregor GA, Markandu ND, Sagnella GA, Singer DRJ, Cappuccio FP. 1989. Double-blind study of three sodium intakes and long-term effects of sodium restriction in essential hypertension. Lancet 2:1244–1247.
Macias-Nuñez JF, Garcia-Iglesias C, Bonda-Roman A, Rodriguez-Commes JL, Corbacho-Becerra L, Tabernero-Romo JM, De Castro-De Pozo S. 1978. Renal handling of sodium in old people: A functional study. Age Ageing 7:178–181.
Macias-Nuñez JF, Garcia Iglesias C, Tabernero-Romo JM, Rodriquez Commes JL, Corbacho Bercerra L, Sanchez Tomero JA. 1980. Renal management of sodium under indomethacin and aldosterone in the elderly. Age Ageing 9:165–172.
MacMahon S, Peto R, Cutler J, Collins R, Sorlie P, Neaton J, Abbott R, Godwin J, Dyer A, Stamler J. 1990. Blood pressure, stroke, and coronary heart disease. Part 1, prolonged differences in blood pressure: Prospective observational studies corrected for the regression dilution bias. Lancet 335:765–774.
Malloy MH, Graubard B, Moss H, McCarthy M, Gwyn S, Vietze P, Willoughby A, Rhoads GG, Berendes H. 1991. Hypochloremic metabolic alkalosis from ingestion of a chloride-deficient infant formula: Outcome 9 and 10 years later. Pediatrics 87:811–822.
Mancilha-Carvalho JdeJ, Souza e Silva NA. 2003. The Yanomami Indians in the INTERSALT Study. Arq Bras Cardiol 80:289–300.
Mao IF, Chen ML, Ko YC. 2001. Electrolyte loss in sweat and iodine deficiency in a hot environment. Arch Environ Health 56:271–277.
Mark AL, Lawton WJ, Abboud FM, Fitz AE, Connor WE, Heistad DD. 1975. Effects of high and low sodium intake on arterial pressure and forearm vascular resistance in borderline hypertension. Circ Res 36:I194–I198.
Marsden JL. 1980. Sodium-containing additives in processed meats: A technological overview. In: White PL, Crocco SC, eds. Sodium and Potassium in Food and Drugs. Chicago: American Medical Association.
Martini LA, Cuppar L, Cunha MA, Schor N, Heilberg IP. 1998. Potassium and sodium intake and excretion in calcium stone forming patients. J Ren Nutr 8:127–131.
Martini LA, Cuppari L, Colugnati FAB, Sigulem DM, Szejnfeld VL, Schor N, Heilberg IP. 2000. High sodium chloride intake is associated with low density in calcium in stone-forming patients. Clin Nephrol 54:85–93.
Mascioli S, Grimm R, Launer C, Svendsen K, Flack J, Gonzalez N, Elmer P, Neaton J. 1991. Sodium chloride raises blood pressure in normotensive subjects. Hypertension 17:I21–I26.
Masugi F, Ogihara T, Hashizume K, Hasegawa T, Sakaguchi K, Kumahara Y. 1988. Changes in plasma lipids and uric acid with sodium loading and sodium depletion in patients with essential hypertension. J Hum Hypertens 1:293–298.
Matkovic V, Ilich JZ, Andon MB, Hsieh LC, Tzagournis MA, Lagger BJ, Goel PK. 1995. Urinary calcium, sodium, and bone mass of young females. Am J Clin Nutr 62:417–425.
Matlou SM, Isles CG, Higgs A, Milne FJ, Murray GD, Schultz E, Starke IF. 1986. Potassium supplementation in blacks with mild to moderate essential hypertension. J Hypertens 4:61–64.
Mattes RD, Donnelly D. 1991. Relative contributions of dietary sodium sources. J Am Coll Nutr 10:383–393.
McCarron DA, Rankin LI, Bennett WM, Krutzik S, McClung MR, Luft F. 1981. Urinary calcium excretion at extremes of sodium intake in normal man. Am J Nephrol 1:84–90.
McParland BE, Goulding A, Campbell AJ. 1989. Dietary salt affect biochemical markers of resorption and formation of bone in elderly women. Br Med J 299:834–835.
Meade TW, Cooper JA, Peart WS. 1993. Plasma renin activity and ischemic heart disease. N Engl J Med 329:616–619.
Medici TC, Schmid AZ, Hacki M, Vetter W. 1993. Are asthmatics salt-sensitive? A preliminary controlled study. Chest 104:1138–1143.
Messerli FH, Soria F. 1994. Ventricular dysrhythmias, left ventricular hypertrophy, and sudden death. Cardiovasc Drugs Ther 8:557S–5563S.
Meyer F, Bar-Or O, MacDougall D, Heigenhauser GJF. 1992. Sweat electrolyte loss during exercise in the heat: Effects of gender and maturation. Med Sci Sports Exerc 24:776–781.
Midgley JP, Matthew AG, Greenwood CMT, Logan AG. 1996. Effect of reduced dietary sodium on blood pressure: A meta-analysis of randomized controlled trials. J Am Med Assoc 275:1590–1597.
Miller JZ, Weinberger MH. 1986. Blood pressure response to sodium restriction and potassium supplementation in healthy normotensive children. Clin Exp Hypertens 8:823–827.
Miller JZ, Daughtery SA, Weinberger MH, Grim CE, Christian JC, Lang CL. 1983. Blood pressure response to dietary sodium restriction in normotensive adults. Hypertension 5:790–795.
Miller JZ, Weinberger MH, Daugherty SA, Fineberg NS, Christian JC, Grim CE. 1987. Heterogeneity of blood pressure response to dietary sodium restriction in normotensive adults. J Chronic Dis 40:245–250.
Miller JZ, Weinberger MH, Daugherty SA, Fineberg NS, Christian JC, Grim CE. 1988. Blood pressure response to dietary sodium restriction on healthy normotensive children. Am J Clin Nutr 47:113–119.
Mitch WE. 1998. Robert H. Herman Memorial Award in Clinical Nutrition Lecture, 1997. Mechanisms causing loss of lean body mass in kidney disease. Am J Clin Nutr 67:359–366.
Mizushima S, Cappuccio FP, Nichols R, Elliott P. 1998. Dietary magnesium intake and blood pressure: A qualitative overview of the observational studies. J Hum Hypertens 12:447–453.
Montes G, Cuello C, Correa P, Zarama G, Liuzza G, Zavala D, de Marin E, Haenszel W. 1985. Sodium intake and gastric cancer. J Cancer Res Clin Oncol 109:42–45.
Morgan T, Anderson A. 1987. Sodium restriction can delay the return of hypertension in patients previously well-controlled on drug therapy. Can J Physiol Pharmacol 65:1752–1755.
Morgan TO. 1982. The effect of potassium and bicarbonate ions on the rise in blood pressure caused by sodium. Clin Sci 63:407S–409S.
Morimoto A, Uzu T, Fujii T, Nishimura M, Kuroda S, Nakamura S, Inenaga T, Kimura G. 1997. Sodium sensitivity and cardiovascular events in patients with essential hypertension. Lancet 350:1734–1737.
Morris CD, Jacobson S-L, Anand R, Ewell MG, Hauth JC, Curet LB, Catalano PM, Sibai DM, Levine RJ. 2001. Nutrient intake and hypertensive disorders of pregnancy: Evidence from a large prospective cohort. Am J Obstet Gynecol 184:643–651.
Morris RC Jr, Sebastian A, Forman A, Tanaka M, Schmidlin O. 1999. Normotensive salt-sensitivity: Effects of race and dietary potassium. Hypertension 33:18–23.
Morriss FH, Brewer ED, Spedale SB, Riddle L, Temple DM, Caprioli RM, West MS. 1986. Relationship of human milk pH during course of lactation to concentrations of citrate and fatty acids. Pediatrics 78:458–464.
Mulhauser I, Prange K, Sawicki PT, Bender R, Dworschak A, Schaden W, Berger M. 1996. Effects of dietary sodium on blood pressure in IDDM patients with nephropathy. Diabetologia 39:212–219.
Murakami K, Hirayama T. 1964. Study of sweat electrolytes in Japanese children. Paediatr Indones 4:161S–168S.
Murayama T, Taguchi H. 1988. Clinical studies of the recurrence of urolithiasis. Influence of sodium intake on urinary excretion of calcium, uric acid, oxalate, phosphate and magnesium. Hinyokika Kiyo 34:1537–1541.
Nazario CM, Szklo M, Diamond E, Roman-Franco A, Climent C, Suarez E, Conde JG. 1993. Salt and gastric cancer: A case-control study in Puerto Rico. Int J Epidemiol 22:790–797.
Neter JE, Stam BE, Kok FJ, Grobbee DE, Geleijnse JM. 2003. Influence of weight reduction on blood pressure: A meta-analysis of randomized controlled trials. Hypertension 42:878–884.
NHBPEP (National High Blood Pressure Education Program). 1993. National High Blood Pressure Education Program Working Group report on primary prevention of hypertension. Arch Intern Med 153:186–208.
Niarchos AP, Weinstein DL, Laragh JH. 1984. Comparison of the effects of diuretic therapy and low sodium intake in isolated systolic hypertension. Am J Med 77:1061–1068.
Niven CF. 1980. Technology of sodium in processed foods: General bacteriological principles, with emphasis on canned fruits and vegetables, and diary foods. In: White PL, Crocco SC, eds. Sodium and Potassium in Food and Drugs. Chicago: American Medical Association.
Nordin BEC, Need AG, Morris HA, Horowitz M. 1993. The nature and significance of the relationship between urinary sodium and urinary calcium in women. J Nutr 123:1615–1622.
Obarzanek E, Proschan MA, Vollmer WM, Moore TJ, Sacks FM, Appel LJ, Svetkey LP, Most-Windhauser MM, Cutler JA. 2003. Individual blood pressure responses to changes in salt intake: Results from the DASH-Sodium Trial. Hypertension 42:459–467.
Oh MS, Uribarri J. 1999. Electrolytes, water, and acid-base balance. In: Shils ME, Olson JA, Shike M, Ross AC, eds. Modern Nutrition in Health and Disease, 9th ed. Baltimore: Williams and Wilkins. Pp. 105-139.
Oles KS, Denham JW. 1984. Hyponatremia induced by thiazide-like diuretics in the elderly. South Med J 77:1314–1315.
Oliver WJ, Cohen EL, Neel JV. 1975. Blood pressure, sodium intake, and sodium related hormones in the Yanomamo Indians, a “no-salt” culture. Circulation 52:146–151.
Oliver WJ, Neel JV, Grekin RJ, Cohen EL. 1981. Hormonal adaptation to the stress imposed on sodium balance by pregnancy and lactation in Yanomama Indians, a culture without salt. Circulation 63:1210–1216.
Orent-Keiles E, McCollum EV. 1940. Mineral metabolism of rats on an extremely sodium-deficient diet. J Biol Chem 133:75–81.
Orinius E. 1984. Hyponatremia in congestive heart failure treated with diuretics. Acta Pharmacol Toxicol 54:S115–S117.
Overlack A, Conrad H, Stumpe KO. 1991. The influence of oral potassium citrate/ bicarbonate on blood pressure in essential hypertension during unrestricted salt intake. Klin Wochenschr 69:79–83.
Overlack A, Ruppert M, Kolloch R, Gobel B, Kraft K, Diehl J, Schmitt W, Stumpe K. 1993. Divergent hemodynamic and hormonal responses to varying salt intake in normotensive subjects. Hypertension 22:331–338.
Overlack A, Ruppert M, Kolloch R, Kraft K, Stumpe KO. 1995. Age is a major determinant of the divergent blood pressure responses to varying salt intake in essential hypertension. Am J Hypertens 8:829–836.
Palli D, Russo A, Decarli A. 2001. Dietary patterns, nutrient intake and gastric cancer in a high-risk area of Italy. Cancer Causes Control 12:163–172.
Parijs J, Joossens JV, Van der Linden L, Verstreken G, Amery AK. 1973. Moderate sodium restriction and diuretics in the treatment of hypertension. Am Heart J 85:22–34.
PCG (PROGRESS Collaborative Group). 2001. Randomized trial of perindopril-based blood pressure lowering regimen among 6,105 individuals with previous stroke or transient ischaemic attack. Lancet 358:1033–1041.
Pearson AM, Wolzak AM. 1982. Salt—Its use in animal products—A human health dilemma. J Anim Sci 54:1263–1278.
Perry IJ. 2003. Salt, science and politics. J Hum Hypertens 17:1–3.
Perry IJ, Beevers DG. 1992. Salt intake and stroke: A possible direct effect. J Hum Hypertens 6:23–25.
Peters JM. 1989. Hypernatremia in breast-fed infants due to elevated breast milk sodium. J Am Osteopath Assoc 89:1165–1170.
Peterson JC, Adler S, Burkart JM, Greene T, Hebert LA, Hunsicker LG, King AJ, Klahr S, Massry SG, Seifter JL. 1995. Blood pressure control, proteinuria, and the progression of renal disease. Ann Intern Med 123:754–762.
Picciano MF, Calkins EJ, Garrick JR, Deering RH. 1981. Milk and mineral intakes of breastfed infants. Acta Paediatr Scand 70:189–194.
Pietinen P. 1982. Estimating sodium intake from food consumption data. Ann Nutr Metab 26:90–99.
Pillion DJ, Meezan E. 1985. Liquid-chromatographic determination of chloride in sweat from cystsic fibrosis patients and normal persons. Clin Chem 31:1155–1157.
Pitts RF. 1974. Physiology of the Kidney and Body Fluids. 3rd ed. Chicago: Year Book Medical Publishers.
Psaty BM, Lumley T, Furberg CD, Schellenbaum G, Pahor M, Alderman MH, Weiss NS. 2003. Health outcomes associated with various antihypertensive therapies used as first-line agents. A network meta-analysis. J Am Med Assoc 289:2534–2544.
Rastenyte D, Tuomilehto J, Moltchanov V, Lindtrson J, Pietinen P, Nissinen A. 1997. Association between salt intake, heart rate and blood pressure. J Hum Hypertens 11:57–62.
Resnick LM, Nicholson JP, Laragh JH. 1985. Alterations in calcium metabolism mediate dietary salt sensitivity in essential hypertension. Trans Assoc Am Physicians 98:313–321.
Rich GM, McCullough M, Olmedo A, Malarick C, Moore TJ. 1991. Blood pressure and renal blood flow responses to dietary calcium and sodium intake in humans. Am J Hypertens 4:642S–645S.
Richards AM, Nicholls MG, Espiner EA, Ikram H, Maslowski AH, Hamilton EJ, Wells JE. 1984. Blood-pressure response to moderate sodium restriction and to potassium supplementation in mild essential hypertension. Lancet 1:757–761.
Robertson JS. 1984. Water sodium, urinary electrolytes, and blood pressure of adolescents. J Epidemiol Community Health 38:186–194.
Robinson MR. 1958. Salt in pregnancy. Lancet 1:178–181.
Rocchini AP, Key J, Bondie D, Chico R, Moorehead C, Katch V, Martin M. 1989. The effect of weight loss on the sensitivity of blood pressure to sodium in obese adolescents. N Engl J Med 32:580–585.
Roland JM, O’Hare JP, Walters G, Corrall RJ. 1986. Sodium retention in response to saline infusion in uncomplicated diabetes mellitus. Diabetes Res 3:213–215.
Roos JC, Koomans HA, Dorhout-Mees EJ, Delawi IMK. 1985. Renal sodium handling in normal humans subjected to low, normal, and extremely high sodium supplies. Am J Physiol 249:F941–F947.
Rose G. 1985. Sick individuals and sick populations. Int J Epidemiol 14:32–38.
Rose G, Stamler J, Stamler R, Elliott P, Marmot M, Pyorala K, Kesteloot H, Joossens J, Hansson L, Mancia G, Dyer A, Kromhout D, Laaser U, Sans S. 1988. Intersalt: An international study of electrolyte excretion and blood pressure. Results for 24 hour urinary sodium and potassium excretion. Br Med J 297:319–328.
Rosler A. 1984. The natural history of salt-wasting disorders of adrenal and renal origin. J Clin Endocrinol Metab 59:689–700.
Roy S. 1984. The chloride depletion syndrome. Adv Pediatr 31:235–257.
Roy S, Arant B. 1979. Alkalosis from chloride-deficient Neo-Mull-Soy. N Engl J Med 301:615.
Roy S, Arant B. 1981. Hypokalemic metabolic alkalosis in normotensive infants with elevated plasma rennin activity and hyperaldosteronism: Role of dietary chloride deficiency. Pediatrics 79:851–857.
Ruppert M, Diehl J, Kolloch R, Overlack A, Kraft K, Gobel B, Hittel N, Stumpe KO. 1991. Short-term dietary sodium restriction increases serum lipids and insulin in salt-sensitive and salt-resistant normotensive adults. Klin Wochenschr 69:51–57.
Ruppert M, Overlack A, Kolloch R, Kraft K, Gobel B, Stumpe KO. 1993. Neurohormonal and metabolic effects of severe and moderate salt restriction in nonobese normotensive adults. J Hypertens 11:743–749.
Ruppert M, Overlack A, Kolloch R, Kraft K, Lennarz M, Stumpe KO. 1994. Effects of severe and moderate salt restriction on serum lipid in nonobese normotensive adults. Am J Med Sci 307:87S–90S.
Sacks FM, Rosner B, Kass EH. 1974. Blood pressure in vegetarians. Am J Epidemiol 100:390–398.
Sacks FM, Svetkey LP, Vollmer WM, Appel LJ, Bray GA, Harsha D, Obarzanek E, Conlin PR, Miller ER, Simons-Morton DG, Karanja N, Lin PH. 2001. Effects of blood pressure of reduced dietary sodium and the Dietary Approaches to Stop Hypertension (DASH) diet. N Engl J Med 344:3–10.
Sagnella GA, Markandu ND, Buckley MG, Miller MA, Singer DRJ, MacGregor GA. 1990. Plasma atrial natriuretic peptide, aldosterone, and plasma renin activity responses to gradual changes in dietary sodium intake. Am J Hypertens 3:863–865.
Saito K, Sano H, Furuta Y, Fukuzaki H. 1989. Effect of oral calcium on blood pressure response in salt-loaded borderline hypertensive patients. Hypertension 13:219–226.
Sakhaee K, Harvey JA, Padalino PK, Whitson P, Pak CYC. 1993. The potential role of salt abuse on the risk for kidney stone formation. J Urol 150:310–312.
Sanchez-Castillo CP, Warrender S, Whitehead TP, James WP. 1987. An assessment of the sources of dietary salt in a British population. Clin Sci 72:95–102.
Sasaki N. 1964. The relationship of salt intake to hypertension in the Japanese. Geriatrics 19:735–744.
Sasaki S, Zhang X-H, Kesteloot HK. 1995. Dietary sodium, potassium, saturated fat, alcohol, and stroke mortality. Stroke 26:783–789.
Sawka MN, Montain SJ. 2000. Fluid and electrolyte supplementation for exercise heat stress. Am J Clin Nutr 72:564S–572S.
Schambelan M, Stockigt JR, Biglieri EG. 1972. Isolated hypoaldosteronism in adults. A renin-deficiency syndrome. N Engl J Med 287:573–578.
Schmid M, Mann JFE, Stein G, Herter M, Nussberger J, Klingbeil A, Ritz E. 1990. Natriuresis-pressure relationship in polycystic kidney disease. J Hypertens 8:277–283.
Schmieder RE, Messerli FH. 1993. Does obesity influence early target organ damage in hypertensive patient? Circulation 87:1482–1488.
Schmieder RE, Grube E, Impelmann V, Ruddel H, Schulte W. 1990. Determinants of myocardial hypertrophy in mild essential hypertension. Impact of dietary salt intake on left ventricular hypertrophy. Z Kardiol 79:557–564.
Schmieder RE, Langenfeld MR, Friedrich A, Schobel HP, Gatzka CD, Weihprecht H. 1996. Angiotensin II Related to sodium excretion modulates left ventricular structure in human essential hypertension. Circulation 94:1304–1309.
Schmieder RE, Messerli FH, Ruddel H, Garavaglia GG, Grube E, Nunez BD, Schulte W. 1988. Sodium intake modulates left ventricular hypertrophy in essential hypertension. J Hypertens 6:S148–S150.
Schorr U, Distler A, Sharma AM. 1996. Effect of sodium chloride- and sodium bicarbonate-rich mineral water on blood pressure and metabolic parameters in elderly normotensive individuals: A randomized double-blind crossover trial. J Hypertens 14:131–135.
Schrier RW, Briner VA. 1991. Peripheral vasodilation hypothesis of sodium and water retension in pregnancy: Implications for the pathogenesis of preeclampsia. Obstet Gynecol 77:632–639.
Schwartz GL, Turner ST, Sing CF. 1992. Twenty-four-hour blood pressure profiles in normotensive sons of hypertensive parents. Hypertension 20:834–840.
Schwartz J, Weiss ST. 1990. Dietary factors and their relation to respiratory symptoms. Am J Epidemiol 132:67–76.
Seikaly MG, Arant BS. 1992. Development of renal hemodynamics: Glomerular filtration and renal blood flow. Clin Perinatol 19:1–13.
Sharma AM, Arntz HR, Kribben A, Schattenfroh S, Distler A. 1990. Dietary sodium restriction: Adverse effect on plasma lipids. Klin Wochenschr 68:664–668.
Sharma AM, Ruland K, Spies KP, Distler A. 1991. Salt sensitivity in young normotensive subjects is associated with a hyperinsulinemic response to oral glucose. J Hypertens 9:329–335.
Sharma AM, Schattenfroh S, Thiede H-M, Oelkers W, Distler A. 1992. Effects of sodium salts on pressor reactivity in salt-sensitive men. Hypertension 19:541–548.
Sharma AM, Schorr U, Thiede HM, Distler A. 1993. Effect of dietary salt restriction on urinary serotonin and 5-hydroxyindolacetic acid excretion in man. J Hypertens 11:1381–1386.
Shore AC, Markandu ND, MacGregor GA. 1988. A randomized crossover study to compare the blood pressure response to sodium loading with and without chloride in patients with essential hypertension. J Hypertens 6:613–617.
Shortt C, Madden A, Flynn A, Morrissey PA. 1988. Influence of dietary sodium intake on urinary calcium excretion in selected Irish individuals. Eur J Clin Nutr 42:595–603.
Simon JA, Obarzanek E, Daniels SR, Frederick MM. 1994. Dietary cation intake and blood pressure in black girls and white girls. Am J Epidemiol 139:130–140.
Simons-Morton DG, Obarzanek E. 1997. Diet and blood pressure in children and adolescents. Pediatr Nephrol 11:244–249.
Sinaiko AR, Gomez-Marin O, Prineas RJ. 1993. Effect of low sodium diet or potassium supplementation on adolescent blood pressure. Hypertension 21:989–994.
Skrabal F, Aubock J, Hortnagl H. 1981. Low sodium/high potassium diet for prevention of hypertension: Probable mechanisms of action. Lancet 2:895–900.
Skrabal F, Gasser RW, Finkenstedt G, Rhomberg HP, Lochs A. 1984a. Low-sodium diet versus low-sodium/high-potassium diet for treatment of hypertension. Klin Wochenschr 62:124–128.
Skrabal F, Herholz H, Neumayr M, Hamberger L, Ledochowski M, Sporer H, Hortngal H, Schwarz S, Schonitzer D. 1984b. Salt sensitivity in humans is linked to enhanced sympathetic responsiveness and to enhanced proximal tubular reabsorption. Hypertension 6:152–158.
Skrabal F, Hamberger L, Cerny E. 1985. Salt sensitivity in normotensive with and salt resistance in normotensives without heredity of hypertension. Scan J Clin Lab Invest 176:47–57.
Smith SR, Klotman PE, Svetkey LP. 1992. Potassium chloride lowers blood pressure and causes natriuresis in older patients with hypertension. J Am Soc Nephrol 2:1302–1309.
Sofer S, Ben-Ezer D, Dagan R. 1993. Early severe dehydration in young breast-fed newborn infants. Isr J Med Sci 29:85–89.
Sowers JR, Zemel MB, Zemel P, Beck FW, Walsh MF, Zawada ET. 1988. Salt sensitivity in blacks: Salt intake and natriuretic substances. Hypertension 12:485–490.
Stamler R. 1991. Implications of the INTERSALT Study. Hypertension 17:I16S–I20S.
Stamler J, Cirillo M. 1997. Dietary salt and renal stone disease. Lancet 349:506–507.
Stamler J, Rose G, Stamler R, Elliott P, Dyer A, Marmot M. 1989. Intersalt study findings. Public health and medical care implications. Hypertension 14:570–577.
Stamler J, Rose G, Elliott P, Dyer A, Marmot M, Kesteloot H, Stamler R. 1991. Findings of the international cooperative INTERSALT study. Hypertension 17:I9S–I15S.
Stamler J, Stamler R, Neaton JD. 1993. Blood pressure, systolic and diastolic, and cardiovascular risks: U.S. population data. Arch Intern Med 153:598–615.
Stamler J, Caggiula AW, Granditis GA. 1997. Relation of body mass and alcohol, nutrient, fiber, and caffeine intakes to blood pressure in the special intervention and usual care groups in the Multiple Risk Factor Intervention Trial. Am J Clin Nutr 65:338S–365S.
Steegers EAP, Eskes TKAB, Jongsma HW, Hein PR. 1991a. Dietary sodium restriction during pregnancy: An historical review. Eur J Obstet Gynecol Reprod Biol 40:83–90.
Steegers EAP, Van Lakwijk HPJM, Jongsma HW, Fast JH, DeBoo T, Eskes TK, Hein PR. 1991b. (Patho)physiological implications of chronic dietary sodium restriction during pregnancy: A longitudinal prospective randomized study. Br J Obstet Gynaecol 98:980–987.
Strauss AL, Coe FL, Deutsch L, Parks JH. 1982. Factors that predict relapse of calcium nephrolithiasis during treatment. Am J Med 72:17–24.
Strazzullo P, Galletti F, Barba G. 2003. Altered renal handling of sodium in human hypertension: Short review of the evidence. Hypertension 41:1000–1005.
Sullivan JM, Ratts TE, Taylor JC, Kraus DH, Barton BR, Patrick DR, Reed SW. 1980. Hemodynamic effects of dietary sodium in man. Hypertension 2:506–514.
Svetkey LP, Simons-Morton D, Vollmer WM, Appel LJ, Conlin PR, Ryan DH, Ard J, Kennedy BM. 1999. Effects of dietary patterns on blood pressure: Subgroup analysis of the Dietary Approaches to Stop Hypertension (DASH) randomized clinical trial. Arch Int Med 159:285–293.
Svetkey LP, Moore TJ, Simons-Morton DG, Appel LJ, Bray GA, Sacks FM, Ard JD, Mortensen RM, Mitchell SR, Conlin PR, Kesari M. 2001. Angiotensinogen genotype and blood pressure response in the Dietary Approaches to Stop Hypertension (DASH) study. J Hypertens 19:1949–1956.
Takahashi M, Hasegawa R. 1986. Enhancing effects of dietary salt on both initiation and promotion stages of rat gastric carcinogenesis. In: Hayashi Y, Nagao M, Sugimura T. Diet, Nutrition, and Cancer. Tokyo: Japan Scientific Societies Press. Pp. 169–182.
TOHP (Trials of Hypertension Prevention) Collaborative Research Group. 1992a. The effects of nonpharmacologic interventions on blood pressure of persons with high normal levels. Results of the Trials of Hypertension Prevention, Phase I. J Am Med Assoc 267:1213–1220.
TOHP Collaborative Research Group. 1992b. Erratum. The effects of nonpharmacologic interventions on blood pressure of persons with high normral levels. Results of the Trials of Hypertension Prevention, Phase I. J Am Med Assoc 267:2330.
TOHP Collaborative Research Group. 1997. Effects of weight loss and sodium reduction intervention on blood pressure and hypertension incidence in overweight people with high-normal blood pressure. The Trials of Hypertension Prevention, Phase II. Arch Intern Med 157:657–667.
Townsend RR, Zhao H. 1994. Plasma renin activity and insulin sensitivity in normotensive subjects. Am J Hypertens 7:894–898.
Tracy RE, MacLean CJ, Reed DM, Hayashi T, Gandia M, Strong JP. 1988. Blood pressure, nephrosclerosis, and age autopsy findings from the Honolulu Heart Program. Mod Pathol 1:420–427.
Tribe RM, Barton JR, Poston L, Burney P. 1994. Dietary sodium intake, airway responsiveness and cellular sodium transport. J Respir Crit Care Med 149:1426–1433.
Tsubono Y, Takahashi T, Iwase Y, Iitoi Y, Akabane M, Tsugane S. 1997. Nutrient consumption and gastric cancer mortality in five regions of Japan. Nutr Cancer 27:310–315.
Tsugane S, Akabane M, Inami T, Matsushima S, Ishibashi T, Ichinowatari Y, Miyajima Y, Watanabe S. 1991. Urinary salt excretion and stomach cancer mortality among four Japanese populations. Cancer Causes Control 2:165–168.
Tsugane S, Tei Y, Takahashi T, Watanabe S, Sugano K. 1994. Salty food intake and risk of Helicobacter pylori infection. Jpn J Cancer Res 85:474–478.
Tsugane S, Sasazuki S, Kobayashi M, Sasaki S. 2004. Salt and salted food intake and subsequent risk of gastric cancer among middle-aged Japanese men and women. Br J Cancer 90:128–134.
Tsunoda K, Abe K, Goto T, Yasujima M, Sato M, Omata K, Seino M, Yoshinaga K. 1986. Effect of age on the renin-angiotensin-aldosterone system in normal subjects: Simultaneous measurement of active and inactive renin, renin substrate, and aldosterone in plasma. J Clin Endocrinol Metab 62:384–389.
Tuck M, Corry D, Trujillo A. 1990. Salt-sensitive blood pressure and exaggerated vascular reactivity in the hypertension of diabetes mellitus. Am J Med 88:210–216.
Tucker DT, Smothers M, Lewis C, Feldman H. 1989. Effects of decreased dietary salt intake on blood pressure in preschool children. J Natl Med Assoc 81:299–302.
Tunstall-Pedoe H. 1999. Does dietary potassium lower blood pressure and protect against coronary heart disease? Findings from the Scottish Heart Health Study. Semin Nephrol 19:500–502.
Tunstall-Pedoe H, Woodward M, Tavendale R, A’Brook R, McCluskey MK. 1997. Comparison of the prediction by 27 different factors of coronary heart disease and death in men and women of the Scottish Heart Health Study: Cohort study. Br Med J 315:722–729.
Tuomilehto J, Jousilahti P, Rastenyte D, Moltchanov V, Tanskanen A, Pietinen P, Nissinen A. 2001. Urinary sodium excretion and cardiovascular mortality in Finland: A prospective study. Lancet 357:848–851.
Tuyns AJ. 1983. Sodium chloride and cancer of the digestive tract. Nutr Cancer 4:198–205.
USDA/ARS (U.S. Department of Agriculture/Agricultural Research Service). 2002. USDA National Nutrient Database for Standard Reference, Release 15. Online. Available at http://www.nal.usda.gov/fnic/foodcomp. Accessed June 30, 2003.
USRDS (U.S. Renal Data System). 1999. USRDS 1999 Annual Data Report. Online. National Institue of Diabetes and Digestive and Kidney Diseases. Available at http://www.usrds.org/adr_1999.htm. Accessed September 1, 2004.
Valtin H, Schafer JA. 1995. Renal Function: Mechanisms Preserving Fluid and Solute Balance in Health. 3rd ed. Boston: Little Brown.
van Buren M, Rabelink TJ, van Rijn HJ, Koomans HA. 1992. Effects of acute NaCl, KCl and KHCO3 loads on renal electrolyte excretion in humans. Clin Sci 83:567–574.
Vander AJ. 1970. Direct effects of potassium on renin secretion and renal function. Am J Physiol 219:455–459.
van der Maten GD, van Raaij JM, Visman L, van der Heijden LJ, Oosterbaan HP, de Boer R, Eskes TK, Hautvast JG. 1997. Low-sodium diet in pregnancy: Effects on blood pressure and maternal nutritional status. Br J Nutr 77:703–720.
Van Goidsenhoven GMT, Gray OV, Price AV, Sanderson PH. 1954. The effect of prolonged administration of large doses of sodium bicarbonate in man. Clin Sci 13:383–401.
Van Lenthe FJ, Kemper HCG, Twisk JWR. 1994. Tracking of blood pressure in children and youth. Am J Hum Biol 6:389–399.
Vasan RS, Beiser A, Seshadri S, Larson MG, Kannel WB, D’Agostino RB, Levey D. 2002. Residual lifetime risk for developing hypertension in middle-aged women and men: The Framingham Heart Study. J Am Med Assoc 287:1003–1010.
Verde T, Shephard RJ, Corey P, Moore R. 1982. Sweat composition in exercise and in heat. J Appl Physiol 53:1540–1545.
Vollmer WM, Sacks FM, Ard J, Appel LJ, Bray GA, Simons-Morton DG, Conlin PR, Svetkey LP, Erlinger TP, Moore TJ, Karanja N. 2001. Effects of diet and sodium intake on blood pressure: Subgroup analysis of the DASH-sodium trial. Ann Intern Med 135:1019–1028.
Watt GCM, Edwards C, Hart JT, Hart M, Walton P, Foy CJW. 1983. Dietary sodium restriction for mild hypertension in general practice. Br Med J 286:432–436.
Weder AN, Egan BM. 1991. Potential deleterious impact of dietary salt restriction on cardiovascular risk factors. Klin Wochenschr 69:45–50.
Weidmann P, De Myttenaere-Bursztein S, Maxwell MH, de Lima J. 1975. Effect of aging on plasma renin and aldosterone in normal man. Kidney Int 8:325–333.
Weidmann P, de Chatel R, Schiffmann A, Bachmann E, Beretta-Piccoli C, Reubi FC, Ziegler WH, Vetter W. 1977. Interrelations between age and plasma renin, aldosterone and cortisol, urinary catecholamines, and the body sodium/volume state in normal man. Klin Wochenschr 55:725–733.
Weinberger MH. 1993. Racial differences in renal sodium excretion: Relationship to hypertension. Am J Kidney Dis 21:41–45.
Weinberger MH. 1996. Salt sensitivity of blood pressure in humans. Hypertension 27:II481–II490.
Weinberger MH, Fineberg NS. 1991. Sodium and volume sensitivity of blood pressure. Age and pressure change over time. Hypertension 18:67–71.
Weinberger MH, Kramer NJ, Grim CE, Petersen LP. 1977. The effect of posture and saline loading on plasma renin activity and aldosterone concentration in pregnant, non-pregnant and estrogen-treated women. J Clin Endocrinol Metab 44:69–77.
Weinberger MH, Luft FC, Bloch R, Henry DP, Pratt JH, Weyman AE, Rankin LI, Murray RH, Willis LR, Grim CE. 1982. The blood pressure-raising effects of high dietary sodium intake: Racial differences and the role of potassium. J Am Coll Nutr 1:139–148.
Weinberger MH, Miller JZ, Luft FC, Grim CE, Fineberg NS. 1986. Definitions and characteristics of sodium sensitivity and blood pressure resistance. Hypertension 8:II127–II134.
Weinberger MH, Cohen SJ, Miller JZ, Lift FC, Grim CE, Fineberg NS. 1988. Dietary sodium restriction as adjunctive treatment of hypertension. J Am Med Assoc 259:2561–2565.
Weinberger MH, Stegner JE, Fineberg NS. 1993a. A comparison of two tests for the assessment of blood pressure responses to sodium. Am J Hypertens 6:I179–I184.
Weinberger MH, Wagner UL, Fineberg NS. 1993b. The blood pressure effects of calcium supplementation in humans of known sodium responsiveness. Am J Hypertens 6:799–805.
Weinberger MH, Fineberg NS, Fineberg SE, Weinberger M. 2001. Salt sensitivity, pulse pressure, and death in normal and hypertensive humans. Hypertension 37:II429–II432.
Weir MR, Dengel DR, Behrens T, Goldberg AP. 1995. Salt-induced increases in systolic blood pressure affect renal hemodynamics and proteinuria. Hypertension 25:1339–1344.
Whelton PK, Buring J, Borhani NO, Cohen JD, Cook N, Cutler JA, Kiley JE, Kuller LH, Satterfield S, Sacks FM, Taylor JO. 1995. The effect of potassium supplementation in persons with a high-normal blood pressure: Results from phase I of the Trials of Hypertension Prevention (TOHP). Ann Epidemiol 5:85–95.
Whelton PK, Perneger TV, He J, Klag MJ. 1996. The role of blood pressure as a risk factor for renal disease: A review of the epidemiological evidence. J Hum Hypertens 10:683–689.
Whelton PK, He J, Appel LJ, Cutler JA, Havas S, Kotchen TA, Roccella EJ, Stout R, Vallbona C, Winston MC, Karimbakas J. 2002. Primary prevention of hypertension: Clinical and public health advisory from the National High Blood Pressure Education Program. J Am Med Assoc 288:1882–1888.
Willoughby A, Graubard BI, Hocker A, Storr C, Vietze P, Thackaberry JM, Gerry MA, McCarthy M, Gist NF, Magenheim M, Berendes H, Rhoads GG. 1990. Population-based study of the developmental outcome of children exposed to chloride-deficient infant formula. Pediatrics 85:485–490.
Wilson M, Morganti AA, Zervoudakis J, Letcher RL, Romney BM, Von Oeyon P, Papera S, Sealey JE, Laragh JH. 1980. Blood pressure, the renin-aldosterone system and sex steroids throughout normal pregnancy. Am J Med 68:97–104.
Witteman JC, Willett WC, Stampfer MJ, Colditz GA, Sacks FM, Speizer FE, Rosner B, Hennekens CH. 1989. A prospective study of nutritional factors and hypertension among us women. Circulation 8:1320–1327.
Wolf-Maier K, Cooper RS, Banegas JR, Giampaoli S, Hense HW, Joffres M, Kastarinen M, Poulter N, Primatesta P, Rodriguez-Artalejo F, Stegmayr B, Thamm M, Tuomilehto J, Vanuzzo D, Vescio F. 2003. Hypertension prevalence and blood pressure levels in 6 European countries, Canada, and the United States. J Am Med Assoc 289:2363–2369.
Yamori Y, Horie R. 1994. Community-based prevention of stroke: Nutritional improvement in Japan. Health Rep 6:181–188.
Yamori Y, Nara Y, Mizushima S, Mano M, Sawamura M, Kihara M, Horie R. 1990. International cooperative study on the relationship between dietary factors and blood pressure: A report from the Cardiovascular Diseases and Alimentary Comparison (CARDIAC) study. J Cardiovasc Pharmacol 16:43S–47S.
Yamori Y, Nara Y, Mizushima S, Sawamura M, Horie R. 1994. Nutritional factors for stroke and major cardiovascular diseases: International epidemiological comparison of dietary prevention. Health Rep 6:22–27.
Yamori Y, Liu L, Ikeda K, Mizushima S, Nara Y, Simpson FO. 2001. Different associations of blood pressure with 24-hour urinary sodium excretion among pre-and post-menopausal women. J Hypertens 19:535–538.
Yang J, Zhang H, Zhao L, Zhou B, Wu Y, Zhang X. 1997. Protein, salt and stroke mortality. Can J Cardiol 13:44B.
You WC, Blot WJ, Chang YS, Ershow AG, Yang ZT, An Q, Henderson B, Xu GW, Fraumeni JF, Wang TG. 1988. Diet and high risk of stomach cancer in Shandong, China. Cancer Res 48:3518–3523.
Young DB, McCaa RE, Pan YJ, Guyton AC. 1976. The natriuretic and hypotensive effects of potassium. Circ Res 38:84S–89S.
Zarkadas M, Gougeon-Reyburn R, Marliss EB, Block E, Alton-Mackey M. 1989. Sodium chloride supplementation and urinary calcium excretion in postmenopausal women. Am J Clin Nutr 50:1088–1094.
Zemel MB, Gualdoni SM, Sowers JR. 1986. Sodium excretion and plasma rennin activity in normotensive and hypertensive black adults as affected by dietary calcium and sodium. J Hypertens 4:343S–345S.
Zhou BF, Stamler J, Dennis B, Moag-Stahlberg A, Okuda N, Robertson C, Zhao L, Chan Q, Elliott P. 2003. Nutrient intakes of middle-aged men and women in China, Japan, United Kingdom, and United States in the late 1990s: The INTERMAP Study. J Hum Hypertens 17: 623–630.
Zoccali C, Mallamaci F, Parlongo S. 1994. The influence of salt intake on plasma calcitonin gene-related peptide in subjects with mild essential hypertension. J Hypertens 12:1249–1253.
Zoia MC, Fanfulla F, Bruschi C, Basso O, De Marco R, Casali L, Cerveri I. 1995. Chronic respiratory symptoms, bronchial responsiveness and dietary sodium and potassium: A population based study. Monaldi Arch Chest Dis 50:104–108.


