
8
Applications of Dietary Reference Intakes for Electrolytes and Water
OVERVIEW
This chapter presents a general discussion of the appropriate uses of the Dietary Reference Intakes (DRIs) in the assessment and planning of diets for individuals and for groups. It also provides guidance for the use of the DRIs developed for nutrients presented in this report, including specific examples and special considerations.
The DRIs may be used for many purposes, most of which fall into two broad categories: assessing current nutrient intakes and planning for future nutrient intakes. Each category may be further subdivided into uses related to the diet of an individual and uses related to the diets of groups (Figure 8-1).
In the past, Recommended Dietary Allowances (RDAs) in the United States and Recommended Nutrient Intakes (RNIs) in Canada were the primary reference standards available to health professionals for assessing and for planning diets of individuals and groups and for making judgments about inadequate and excessive intake. However, neither the former RDAs nor the RNIs were ideally suited for many of these purposes (IOM, 1994). The DRIs provide a more complete set of reference values. The transition from using the former RDAs and RNIs to using all of the DRIs appropriately will require time and effort by health professionals and others.
Only Adequate Intakes (AI) and, in some cases, Tolerable Upper Intake Levels (UL), have been established for the nutrients presented in this report. This chapter provides a brief description of the appropriate uses of each of the new reference value categories.
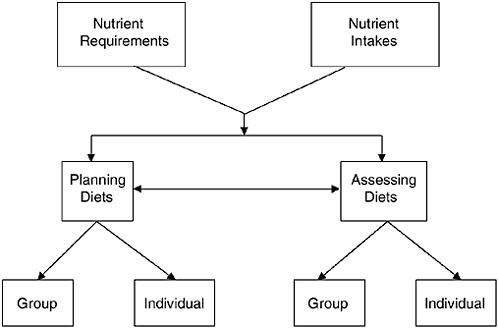
FIGURE 8-1 Conceptual framework—Uses of Dietary Reference Intakes. Nutrient intakes include all sources of nutrients: foods, beverages, and dietary supplements.
Extensive detail on the application of all of the various DRI values can be found in the reports on the application of the DRIs in assessment (IOM, 2000) and in planning (IOM, 2003).
Included in this chapter are specific applications to the nutrients discussed in this report. Details on how the DRIs are set with reference to specific life stages and gender and the criterion that defines adequacy and excess for each of these nutrients are given in Chapters 4 through 7.
ASSESSING NUTRIENT INTAKES OF INDIVIDUALS
Dietary assessment methods have several inherent inaccuracies. One is that individuals underreport their intakes (Mertz et al., 1991; Schoeller, 1995; Schoeller et al., 1990), and it appears that obese individuals often do so to a greater extent than do normal-weight individuals (Heitmann and Lissner, 1995). Presently, a method for adjusting intakes to account for underreporting by individuals is not available and much work is needed to develop an acceptable method. Another important inherent inaccuracy is the quality of food composition databases and their applicability to what is or will actually be consumed when estimating intake or planning diets.
Furthermore, large day-to-day variations in intake, which are exhibited by almost all individuals, mean that it often takes a prohibitively large number of days of intake measurement to approximate usual intake (Basiotis et al., 1987; IOM, 2000). As a result, caution is indicated when interpreting nutrient assessments based on self-reported dietary data covering only a few days of intake. Data on nutrient intakes should be interpreted in combination with information on typical food usage patterns to determine if the recorded intakes are representative of an individual’s usual intake.
Finally, because there is considerable variation in intakes both within and between individuals, as well as variation associated in estimating requirements, other factors must be evaluated in conjunction with the diet. The appropriate DRIs should be used in conjunction with other data in assessing the adequacy of the diet of a specific individual. The nutritional status of an individual can be definitively determined only by a combination of dietary, anthropometric, physiological, and biochemical data.
Using the Estimated Average Requirement and the Recommended Dietary Allowance for Assessment of Individuals
As is discussed in each chapter covering a specific nutrient, there were insufficient data to establish an Estimated Average Requirement (EAR) and therefore a Recommended Dietary Allowance (RDA) for the nutrients discussed in this report. Nevertheless, because these categories of DRIs exist for other nutrients, their use in the assessment of individuals will be described briefly.
The EAR is defined as estimating the median of the distribution of requirements for a specific life stage and gender group, but it is not possible to know where an individual’s requirement falls within this distribution without further anthropometric, physiological, or biochemical measures. Thus from dietary data alone, it is only possible to estimate the likelihood of nutrient adequacy or inadequacy. The EAR is an amount that would meet the needs as defined for a chosen criterion of adequacy for half the individuals in the group to which the EAR is applied. The RDA is the amount that would meet the needs of almost all members of the group.
For practical purposes, many users of the DRIs may find it useful to consider that when observed intakes are below the EAR, they very likely need to be improved (because the probability of adequacy is 50 percent or less), and those between the EAR and the RDA probably need to be improved (because the probability of adequacy is less than 97 to 98 percent). Only if intakes have been
observed for a large number of days and are at the RDA, or observed intakes for fewer days are well above the RDA, should one have a high level of confidence that the intake is adequate. Such considerations are not applicable in the case of energy intake, which should match energy expenditure in individuals maintaining desirable body weight.
Using the Adequate Intake for Assessment of Individuals
Adequate Intakes (AIs) have been set for all nutrients discussed in this report for all life stage and gender groups, with the exception of sulfate. Equations that can be used to estimate the degree of confidence that an individual’s usual intake meets or exceeds the AI have been developed (IOM, 2000). Usual individual intakes that are equal to or above the AI can be assumed to be adequate. However, the likelihood of inadequacy of usual intakes below the AI cannot be determined. For example, an adult with a usual potassium intake of 5 g/day could be assessed as having an adequate intake since intake exceeds the AI of 4.7 g/day. However, no conclusions regarding the adequacy of an intake of 3.5 g/day (i.e., below the AI) can be made since, by definition, when an AI is set there is insufficient information about the distribution of requirements. Accordingly, whether an intake below the AI meets an individual’s requirement cannot be assessed since the requirement distribution is not known.
Using the Tolerable Upper Intake Level for Assessment of Individuals
The Tolerable Upper Intake Level (UL) is used to examine the possibility of over-consumption of a nutrient. Equations have been developed to determine the degree of confidence that an individual’s estimated intake is actually below the UL (IOM, 2000). If an individual’s usual nutrient intake remains below the UL, there is little risk of the identified adverse effect occurring from excessive intake. At chronic intakes above the UL, the potential for risk of adverse effects increases. However, the intake at which a given individual will develop the adverse effects associated with taking large amounts of one or more nutrients is not known with certainty. In this report, a UL has been established only for sodium. However, there is no established benefit to almost all healthy individuals who chronically consume amounts of nutrients that exceed the AI; it should be noted that acute adverse effects, which should be avoided,
do occur with excessive intakes of potassium, sulfate, and water, as discussed in the nutrient chapter.
ASSESSING NUTRIENT INTAKES OF GROUPS
The assessment of nutrient adequacy for groups of people requires unbiased, quantitative information on the intake of the nutrient of interest by individuals in the group. Care must be taken to ensure the quality of the information upon which assessments are made so that they are not underestimates or overestimates of nutrient intake. Estimates of total nutrient intake, including amounts from supplements, should be obtained. It is also important to use appropriate food composition tables with accurate nutrient values for the foods as consumed.
To assess the intake of a group, several steps must be taken. First, the intake distribution must be adjusted to remove the effect of day-to-day variation of individual intake. The statistical adjustments are based on assumptions about the day-to-day variation derived from repeat measurements of a representative subset of the group under study (Nusser et al., 1996). The resulting adjusted intake distribution narrows, giving a more precise estimate of the proportion of the group with usual intakes below the estimated requirements (Figure 8-2). An explanation of this adjustment procedure has been presented in previous reports (IOM, 2000, 2003).
For nutrients with an EAR, the prevalence of inadequacy in the population group for the nutrient evaluated is approximately the percent of the population evaluated whose intakes fall below the EAR, provided certain critical assumptions are met (IOM, 2000). Thus it is preferable to be able to establish an EAR where requirement data are available. However, for the nutrients in this report, inadequate or insufficient data on requirements of these nutrients for the indicators of adequacy prohibited establishing EARs.
Using the Adequate Intake in Group Assessment
In this report, Adequate Intakes (AIs) are assigned for total water, potassium, and sodium for all life stage and gender groups. Groups with median intakes equal to or above the AI for total water, potassium, and sodium can be assumed to have a low prevalence of inadequacy as determined by the criteria used to evaluate adequacy (provided that intake variability does not exceed that of the healthy group used to establish the AI). This would be particularly true for water, as the AI was set as a median intake of a presumably healthy
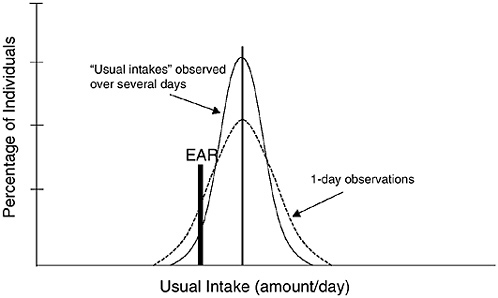
FIGURE 8-2 Comparison of 1-day and usual intakes for estimating the proportion of a group consuming below the Estimated Average Requirement (EAR).
group that demonstrated little evidence of dehydration. However, the AIs for sodium and potassium were not based on the median intakes of apparently healthy groups as there is a significant proportion of the population in the United States and Canada with hypertension and cardiovascular disease. Their AIs were based on experimental observations of intakes in small groups of people (frequently subjects in experimental trials) that appeared to meet the needs for a defined indicator of adequacy or functional outcome, such as lowered blood pressure. Thus, confidence in the assessment that the prevalence of inadequacy is low when median intake exceeds the AI will be less than it would be if the AIs represented the median intake of a healthy group (IOM, 2000).
Group median intakes below the AI, however, cannot be assumed to be inadequate. The reason for this is the same as discussed earlier for individuals, namely that when the distribution of requirements for the chosen criterion is not known, the adequacy of an intake below a “recommended level” cannot be determined. For example, although median intakes of potassium are considerably below the AI, no statements regarding the adequacy of potassium intakes of individuals in Canada and the United States can be made.
One can only point to the percent of individuals at or above the AI as indisputably having an adequate intake.
Using the Tolerable Upper Intake Level in Group Assessment
The proportion of the population with usual intakes below the Tolerable Upper Intake Level (UL) is likely to be at no risk of adverse effects due to overconsumption, assuming the data used to establish the UL accurately estimate the intake level at which a threshold for the adverse effect occurs. In the case where a threshold is not apparent, such as with sodium, lack of data may mean that a proportion of the population consuming intakes below the UL may potentially be at some risk. Thus, for sodium, for which the UL is 2.3 g/day, approximately 95 percent of men and 75 to 90 percent of women in the United States and Canada have sodium intakes above the UL (and probably even greater percentages will be above the UL given that salt added to foods at the table is not included in the estimated intake data), and could be considered to be at potential risk of increased blood pressure (the adverse effect used to set the UL for sodium). This coincides with that put the probability of becoming hypertensive at some point in the future at over 90 percent for individuals 55 years of age (Vasan et al., 2002).
The mean intake of a population cannot be used to evaluate the prevalence of intakes above the UL. A distribution of usual intakes, including intakes from supplements, is required to assess the proportion of the population that might be at risk of overconsumption. However, if the mean or median intake is equal to or greater than the UL, as is the case for sodium, it suggests that the number of individuals with excessive intake is high and warrants further investigation.
PLANNING NUTRIENT INTAKES OF INDIVIDUALS
Using the Adequate Intake in Planning for Individuals
Adequate Intakes (AIs) are set for all nutrients in this report but sulfate. The AI for term infants is based on human milk, which provides adequate amounts in the case of most nutrients, so it is not necessary to plan additional sources of intakes for infants exclusively fed human milk. Likewise, an infant formula with a nutrient profile similar to human milk (after adjustment for differences in bioavailability) should supply adequate nutrients for an infant. Other age groups (children, adolescents, and adults) should use
the AI as their goal for intake of water, potassium, and sodium chloride. Guidance for using AIs for labeling was recently developed (IOM, 2003).
Using the Tolerable Upper Intake Level in Planning for Individuals
In this report, a Tolerable Upper Intake Level (UL) was set only for sodium. Thus individuals should plan their intakes to remain below the UL for sodium. Guidance for how to incorporate ULs when establishing dietary values for nutrition labels was recently proposed (IOM, 2003).
PLANNING NUTRIENT INTAKES OF GROUPS
Using the Adequate Intake in Planning for Groups
Planning a group median intake that meets the Adequate Intake (AI) should, by definition, be associated with a low prevalence of inadequacy when the AI is set as the median intake of a healthy group and the group being planned for has characteristics similar to the group used to establish the AI (IOM, 2000). If the AI is not set as the median intake of a healthy group (e.g., the AIs for sodium and potassium were not set in this way), one would have less confidence that the prevalence of inadequacy would be low if the group’s median intake met the AI.
Using the Tolerable Upper Intake Level in Planning for Groups
In order to minimize the proportion of the population at potential risk of adverse effects from excessive nutrient intake, the distribution of usual intakes should be planned so that the prevalence of intakes above the Tolerable Upper Intake Level (UL) is acceptably low (IOM, 2003). Since a large majority of the population has usual intakes of sodium above the UL, this will necessitate a dramatic reduction in population sodium intakes.
NUTRIENT-SPECIFIC CONSIDERATIONS
Water
The Adequate Intake (AI) for total (drinking water, beverages, and food) water set in this report is derived from the median total water intakes from U.S. dietary survey data expressed as absolute amounts (liters/day), and varies by age and gender. For example,
the AI for men 19 to 30 years of age is set at 3.7 L/day of total water (from foods and fluids), while for women in the same age group, the AI is set at 2.7 L/day. In dietary survey data (Appendix Tables D-3 and F-1), water from food provided 19 percent of total water intake, or 0.7 L/day for men and 0.5 L/day for women in the United States (Appendix Table D-4). Fluids (drinking water and beverages) consumed were 3.0 L (about 12 cups)/day and 2.2 L (91/4 cups)/day for 19- to 30-year-old men and women, respectively, which represented about 81 percent of total water intake (Appendix Table D-3). Individuals who meet the recommended 60 minutes per day of moderate physical activity (IOM, 2002/2005) can easily meet the AI for total water through drinking water, beverages, and food (see Table 4-15).
A number of foods (especially fruits and vegetables) contain a substantial amount of water (moisture) (see Table 4-14). Unlike most other nutrients, intake of water is driven by need, as well as other factors. Because excessive water consumption does not occur in healthy people, no Tolerable Upper Intake Level (UL) was set. It is possible to meet the AI for total water by consuming little or no plain water, but instead by consuming a mixed diet (including fruits and vegetables, most of which are over 90 percent water by weight; meat, fish, and poultry, which contain about 60 to 70 percent water by weight; and other beverages, such as fruit juices and milk [see Table 4-14]).
As discussed in Chapter 4, it is important to note that water requirements cannot be considered in isolation from macronutrient and electrolyte consumption because these nutrients are critical to water balance. In addition, an individual’s water requirement can vary extensively due to physical activity levels and exposure to varied environments. The majority of body water is associated with fat-free mass (70 to 75 percent) in adults. Total body water averages approximately 60 percent of body weight with a range of 45 to 75 percent due primarily to differences in body composition. Total body water deficits of as little as 2 percent of body weight (e.g., a loss of 1.4 kg [about 1.4 L] in a 70-kg adult) can significantly impair both cognitive function and motor control.
Diet composition, physical activity level, environmental exposure, pathophysiological factors (e.g., diabetes mellitus, cystic fibrosis, renal disease), and use of diuretics or other medications all impact water needs, which vary daily.
The increase in solute loads of various beverages (e.g., milk or sports drinks) are minimal in terms of need to adjust the volume to correct for additional excretory load. Ingestion of fluids containing
caffeine and alcohol, known to result in diuresis, are not associated with increased incidence of dehydration or body water deficits; thus their consumption can contribute to the total body water needs of individuals (IOM, 2001; Taivainen et al., 1995).
Potassium
As described in detail in Chapter 5, potassium is the major intracellular cation and is required for normal cellular function. An AI of 4.7 g (120 mmol)/day has been established for potassium for all adults. This level is based on an intake of naturally occurring potassium from dietary sources, primarily fruits and vegetables, which has been shown to be beneficial in reducing the adverse effects of sodium intake on blood pressure and possibly in reducing the risk of kidney stones. Bicarbonate or its precursors (organic anions typically associated with potassium in foods) may neutralize an excess acid load seen in typical Western-style diets, and may diminish bone turnover. Because potassium intakes from naturally occurring dietary sources above the AI have not been found to result in increased risk of adverse effects in generally healthy individuals with normal kidney function (excess potassium is readily excreted in the urine), no UL was set. Caution is warranted, however, in the consumption of potassium by individuals whose kidney function may be insufficient to excrete potassium adequately; in individuals taking medications known to decrease renal excretion of potassium (e.g., angiotensin converting enzyme [ACE] inhibitors and angiotensin II-blockers [ARBs]); and in individuals who have diseases known to alter potassium metabolism, such as diabetes.
In assessing and planning for potassium intakes of individuals, important considerations that impact potassium requirements include the effects of environmental heat exposure and physical activity levels on potassium loss through sweat and the use of diuretics or other drug therapies commonly prescribed for the treatment of hypertension and congestive heart failure. These factors have the potential to influence potassium needs because they increase potassium losses in urine and sweat.
In most cases, however, losses in sweat are unlikely to be extreme, and the AI should provide an appropriate amount of potassium. Individuals who use diuretics should follow advice from their physician regarding potassium intake and the need for supplements since the type of diuretic used can affect whether appreciable amounts of potassium are lost in the urine.
In contrast, there are some clinical situations in which potassium is retained and a high intake could pose a risk. These include individuals with chronic renal insufficiency, end-stage renal disease, severe heart failure, diabetes, adrenal insufficiency, and ACE inhibitor therapy. For these individuals, the AI may be too high a level to consume. Once again, medical advice should be obtained, and use of potassium-containing salt substitutes should be undertaken only when advised by a physician.
In planning diets for individuals and for groups, the dietary source of potassium is also important. Naturally occurring potassium is the cation found most abundantly in vegetable fruits (e.g., tomatoes, cucumbers, zucchini, eggplant), leafy greens, and roots (e.g., carrots, radishes, turnips, onions) and is present with bicarbonate, citrate, or other organic anions. In contrast, the potassium added to foods or found in supplements is primarily in the form of potassium chloride. Potassium bicarbonate administration produces lower levels of calcium in urine compared with potassium chloride, suggesting that potassium bicarbonate or citrate are the forms most conducive to a reduced risk of renal stones. Because bicarbonate, but not chloride, can neutralize the acid generated from the metabolism of diets high in animal proteins, resulting in less bone turnover, potassium chloride also would not be expected to promote bone health as would be predicted with potassium bicarbonate. Although neither of these potential health benefits (i.e., reduced risk of renal stones and bone loss) can be attributed to potassium per se, they occur as a consequence of consuming diets rich in natural sources of potassium.
While the U.S. population and, to a lesser extent, the Canadian population consume diets well below the AI of 4.7 g/day recommended for adults, increasing intake of good sources of potassium, such as fruits and vegetables, should enable individuals to meet the AI for potassium (see Table 5-8).
Sodium Chloride
Sodium is the principle cation of the extracellular fluids and is the primary regulator of extracellular fluid volume and body water. Sodium and chloride are normally consumed together as sodium chloride (salt) in food. For this reason, Chapter 6 presents data on recommended intakes and effects of sodium as sodium chloride and assumes it applies to chloride unless otherwise noted. However, for planning purposes, the AI is presented as grams per day of so-
dium rather than of sodium chloride. While the minimal amount of sodium required to replace insensible losses is estimated to be 0.18 g (7.8 mmol)/day under conditions of maximal adaptation and without sweating, the sodium AI has been set at 1.5 g/day. Sodium intake at this level would be adequate to cover losses from sweating among those who are moderately active, as recommended (IOM, 2002/2005), as well as to meet nutrient needs for other important nutrients using dietary patterns typical of the United States and Canada. Since median intakes of the U.S. population are well above the AI, the prevalence of inadequacy is likely to be extremely low.
Approximately 98 percent of sodium chloride consumed is absorbed over a wide range of intakes, and approximately 90 to 95 percent of sodium excretion occurs through the urine, with losses in sweat being minimal among those who do not experience sweat loss due to exercise. However, physical activity levels can have a substantial impact on sweat sodium losses; therefore, the AI of 1.5 g/day does not apply to individuals who lose large volumes of sodium in sweat, such as competitive athletes and workers exposed to extreme heat stress (e.g., foundry workers and fire fighters). For example, sweat losses during exercise in the heat may easily exceed 1 L/hour with a sodium concentration of greater than 35 to 50 mmol (0.8 to 1.15 g)/L. Thus it would be prudent for individuals who exercise strenuously on a daily basis to carefully monitor their electrolyte intake as well as their water intake.
As sodium chloride intake increases, several dose-dependent changes occur. Increased sodium chloride intake increases blood pressure, and it is associated with an increased risk of cardiovascular outcomes (particularly left ventricular hypertrophy and stroke), and possibly with an increased risk of asthma and gastric cancer. It also causes increased urinary excretion not only of sodium chloride, but also of calcium. For these reasons, a UL of 2.3 g (100 mmol)/day has been set for sodium. As described earlier, a large majority of the U.S. population has sodium intakes in excess of the UL. Reducing sodium intakes to levels below the UL will be challenging because of the ubiquitous presence of salt in processed foods. For example, although the menu in Table 6-10 is below the UL with about 1.6 g of sodium, this was attained only by minimizing the use of processed foods; by using unsalted margarine; by preparing vegetables and rice without the addition of salt to cooking water; and by avoiding the use of salt at the table.
Although the AI is not dependent on energy intake, from a practical viewpoint, the more individuals eat, the more sodium they consume, unless they purposely choose foods lower in sodium. For ex-
ample, in the DASH-sodium trial, sodium intakes were adjusted by energy level. At the lowest level of sodium intake, individuals consuming 1,600 kcal received 0.90 g (40 mmol)/day of sodium; at 2,100 kcal, 1.15 g (50 mmol)/day of sodium; at 2,600 kcal, 1.38 g (60 mmol)/day; at 3,100 kcal, 1.60 g (70 mmol)/day of sodium; and at 3,600 kcal/day, 1.8 g (80 mmol)/day of sodium (Svetkey et al., 1999).
The median range of estimated energy intakes for men and women 19 to 50 years of age in the latest Continuing Survey of Food Intake by Individuals (CSFII) (1994–1996, 1998) was ≈ 2,476 to 2,718 kcal/day and 1,659 to 1,757 kcal/day, respectively (IOM, 2002/2005), or an average overall median energy intake of 2,150 kcal/day. An active lifestyle has been recommended that requires approximately 3,100 and 2,400 kcal/day for young men and women, respectively (IOM, 2002/2005). Those individuals who are more physically active and therefore require more energy than median intakes observed in the CSFII data (IOM, 2002/2005) will likely consume sodium in excess of the AI. In contrast, those individuals who consume a lower intake of energy (e.g., 1,600 kcal/day) and who are physically inactive would likely have an adequate sodium intake with intakes below the AI. Of course, with restricted energy intake, careful dietary planning would be needed to meet recommended intakes for other nutrients.
Sodium chloride needs may be affected in a number of clinical conditions. For example, use of diuretics has been reported to lead to hyponatremia, although this appears to be a consequence of impaired water excretion rather than of excessive sodium loss since it can be corrected by water restriction. Other clinical states that can lead to increased renal salt losses include adrenal cortical insufficiency, intrinsic renal disorders (e.g., oliguric renal failure, medullary cystic disease, nephrocalcinosis), and certain diseases (e.g., cystic fibrosis, diabetes). In these situations, sodium should not be unduly restricted, and medical advice appropriate for the individual should be obtained.
SUMMARY
Dietary Reference Intakes (DRIs) may be used to assess nutrient intakes as well as for planning nutrient intakes. Box 8-1 summarizes the appropriate uses of the DRIs for individuals and groups.
|
BOX 8-1 Uses of Dietary Reference Intakes for Healthy Individuals and Groups
|
REFERENCES
Basiotis PP, Welsh SO, Cronin FJ, Kelsay JL, Mertz W. 1987. Number of days of food intake records required to estimate individual and group nutrient intakes with defined confidence. J Nutr 117:1638–1641.
Heitmann BL, Lissner L. 1995. Dietary underreporting by obese individuals—Is it specific or non-specific? Br Med J 311:986–989.
IOM (Institute of Medicine). 1994. How Should the Recommended Dietary Allowances Be Revised? Washington, DC: National Academy Press.
IOM. 2000. Dietary Reference Intakes: Applications in Dietary Assessment. Washington, DC: National Academy Press.
|
||||||||||||||
IOM. 2001. Caffeine for the Sustainment of Mental Task Performance. Washington, DC: National Academy Press.
IOM. 2002/2005. Dietary Reference Intakes for Energy, Carbohydrate, Fiber, Fat, Fatty Acids, Cholesterol, Protein, and Amino Acids. Washington, DC: The National Academies Press.
IOM. 2003. Dietary Reference Intakes: Applications in Dietary Planning. Washington, DC: The National Academies Press.
Mertz W, Tsui JC, Judd JT, Reiser S, Hallfrisch J, Morris ER, Steele PD, Lashley E. 1991. What are people really eating? The relation between energy intake derived from estimated diet records and intake determined to maintain body weight. Am J Clin Nutr 54:291–295.
Nusser SM, Carriquiry AL, Dodd KW, Fuller WA. 1996. A semiparametric transformation approach to estimating usual daily intake distributions. J Am Stat Assoc 91:1440–1449.
Schoeller DA. 1995. Limitations in the assessment of dietary energy by self-report. Metabolism 44:18–22.
Schoeller DA, Bandini LG, Dietz WH. 1990. Inaccuracies in self-reported intake identified by comparison with the doubly labelled water method. Can J Physiol Pharmacol 68:941–949.
Taivainen H, Laitinen R, Tahtela R, Kiianmaa K, Valimaki MJ. 1995. Role of plasma vasopressin in changes of water balance accompanying acute alcohol intoxication. Alcohol Clin Exp Res 19:759–762.
Vasan RS, Beiser A, Seshadri S, Larson MG, Kannel WB, D’Agostino RB, Levey D. 2002. Residual lifetime risk for developing hypertension in middle-aged women and men: The Framingham Heart Study. J Am Med Assoc 287:1003–1010.


