
2
Overview and Methods
SUMMARY
The general methods for examining and interpreting the evidence on requirements for nutrients are presented in this chapter, with special attention given to approaches used to provide Dietary Reference Intakes (DRIs) where data are lacking for specific subgroups of the population (typically for infants, children, pregnant and lactating women, and older adults). Included as well are discussions of methodological problems in assessing requirements and estimating intakes from dietary survey data. Relevant detail is provided in the nutrient chapters that follow.
BACKGROUND
This report focuses on water, potassium, sodium, chloride, and sulfate. Those that provide a specific beneficial role in human physiological processes and health include water, potassium, sodium, and chloride. Sulfate, while essential for specific metabolic functions, can be formed in sufficient quantities from adequate intakes of sulfur-containing amino acids. Water is the largest single constituent of the human body and is essential for cellular homeostasis and life. Water provides the solvent for biochemical reactions, is the medium for material transport, has unique physical properties (e.g., high specific heat) to absorb metabolic heat, and is essential to maintain blood volume to support cardiovascular function and renal filtration. Potassium is the major intracellular cation and is re-
quired for normal cellular function. Severe potassium deficiency is characterized by hypokalemia, and its adverse consequences include cardiac arrhythmias, muscle weakness, and insulin resistance. More subtle deficiency signs of potassium are increased blood pressure, increased sensitivity of blood pressure to sodium intake (“salt sensitivity”), increased risk of kidney stones, and increased bone turnover. Sodium chloride is required to maintain fluid and electrolyte balance, extracellular volume, and serum osmolality.
METHODOLOGICAL CONSIDERATIONS
Types of Data Used
The scientific data for developing the Dietary Reference Intakes (DRIs) have essentially come from observational and experimental studies in humans. Observational studies include single-case and case-series reports and cross-sectional, cohort, and case-control studies. Experimental studies include randomized and nonrandomized prevention trials and controlled dose-response, balance, turnover, and depletion-repletion physiological studies. Results from animal experiments are generally not applicable to the establishment of DRIs, but selected animal studies are considered in the absence of human data.
Animal Models
Basic research using experimental animals affords considerable advantage in terms of control of nutrient exposures, environmental factors, and even genetics. In contrast, the relevance to free-living humans may be unclear. In addition, dose levels and routes of administration that are practical in animal experiments may differ greatly from those relevant to humans. Nevertheless, animal feeding experiments were sometimes included in the evidence reviewed to determine the ability to specify DRIs.
Human Feeding Studies
Controlled feeding studies, usually in a confined setting such as a metabolic unit, can yield valuable information on the relationship between nutrient consumption and health-related biomarkers. Much of the understanding of human nutrient requirements to prevent deficiencies is based on studies of this type. Studies in which the subjects are confined allow for close control of both in-
take and activities. Complete collections of nutrient losses through urine and feces are possible, as are recurring sampling of biological materials such as blood. Nutrient balance studies measure nutrient status in relation to intake. Depletion-repletion studies, by contrast, measure nutrient status while subjects are maintained on diets containing marginally low or deficient levels of a nutrient; then the deficit is corrected with measured amounts of that nutrient. Unfortunately, these two types of studies have several limitations. Typically they are limited in time to a few days or weeks, and so longer-term outcomes cannot be measured with the same level of accuracy. In addition, subjects may be confined, and findings are therefore not always generalizable to free-living individuals. Finally, the time and expense involved in such studies usually limit the number of subjects and the number of doses or intake levels that can be tested.
In spite of these limitations, feeding studies play an important role in understanding nutrient needs and metabolism. Such data were considered in the DRI process and were given particular attention in the absence of reliable data to directly relate nutrient intake to disease risk.
Observational Studies
In comparison to human feeding studies, observational epidemiological studies are frequently of direct relevance to free-living humans, but they lack the controlled setting. Hence they are useful in establishing evidence of an association between the consumption of a nutrient and disease risk but are limited in their ability to ascribe a causal relationship. A judgment of causality may be supported by a consistency of association among studies in diverse populations, and it may be strengthened by the use of laboratory-based tools to measure exposures and confounding factors, such as personal interviews, rather than other means of data collection. In recent years, rapid advances in laboratory technology have made possible the increased use of biomarkers of exposure, susceptibility, and disease outcome in molecular epidemiological research. For example, one area of great potential in advancing current knowledge of the effects of diet on health is the study of genetic markers of disease susceptibility (especially polymorphisms in genes encoding metabolizing enzymes) in relation to dietary exposures. This development is expected to provide more accurate assessments of the risk associated with different levels of intake of both nutrients and nonnutritive food constituents.
While analytic epidemiological studies (studies that relate exposure to disease outcomes in individuals) have provided convincing evidence of an associative relationship between selected nondietary exposures and disease risk, there are a number of other factors that limit study reliability in research relating nutrient intakes to disease risk.
First, the variation in nutrient intake may be rather limited in populations selected for study. This feature alone may yield modest relative risk trends across intake categories in the population, even if the nutrient is an important factor in explaining large disease rate variations among populations.
A second factor, one that gives rise to particular concerns about confounding, is the human diet’s complex mixture of foods and nutrients that includes many substances that may be highly correlated. Third, many cohort and case-control studies have relied on self-reports of diet, typically food records, 24-hour recalls, or diet history questionnaires. Repeated application of such instruments to the same individuals shows considerable variation in nutrient consumption estimates from one time period to another with correlations often in the 0.3 to 0.7 range (e.g., Willett et al., 1985). In addition, there may be systematic bias in nutrient consumption estimates from self-reports as the reporting of food intakes and portion sizes may depend on individual characteristics such as body mass, ethnicity, and age. For example, total energy consumption may tend to be substantially underreported (30 to 50 percent) among obese persons, with little or no underreporting among lean persons (Heitmann and Lissner, 1995). Such systematic bias, in conjunction with random measurement error and limited intake range, has the potential to greatly impact analytic epidemiological studies based on self-reported dietary habits. Note that cohort studies using objective (biomarker) measures of nutrient intake may have an important advantage in the avoidance of systematic bias, though important sources of bias (e.g., confounding) may remain.
Randomized Clinical Trials
By randomly allocating subjects to the (nutrient) exposure of interest, clinical trials eliminate the confounding that may be introduced in observational studies by self-selection. The unique strength of randomized trials is that, if the sample is large enough, the study groups will be similar with respect not only to those confounding variables known to the investigators, but also to any unknown factors that might be related to risk of the disease. Thus, randomized
trials achieve a degree of control of confounding that is simply not possible with any observational design strategy, and thus they allow for the testing of small effects that are beyond the ability of observational studies to detect reliably.
Although randomized controlled trials represent the accepted standard for studies of nutrient consumption in relation to human health, they too possess important limitations. Specifically, persons agreeing to be part of a randomized trial may be a select subset of the population of interest, thus limiting the generalization of trial results. For practical reasons, only a small number of nutrients or nutrient combinations at a single intake level are generally studied in a randomized trial (although a few intervention trials to compare specific dietary patterns have been initiated in recent years). In addition, the follow-up period will typically be short relative to the preceding time period of nutrient consumption that may be relevant to the health outcomes under study, particularly if chronic disease endpoints are sought. Also, dietary intervention or supplementation trials tend to be costly and logistically difficult, and the maintenance of intervention adherence can be a particular challenge.
Because of the many complexities in conducting studies among free-living human populations and the attendant potential for bias and confounding, it is the totality of the evidence from both observational and intervention studies, appropriately weighted, that must form the basis for conclusions about causal relationships between particular exposures and disease outcomes.
Weighing the Evidence
As a principle, only studies published in peer-reviewed journals have been used in this report. However, studies published in other scientific journals or readily available reports were considered if they appeared to provide important information not documented elsewhere. To the extent possible, original scientific studies have been used to derive the DRIs. On the basis of a thorough review of the scientific literature, clinical, functional, and biochemical indicators of nutritional adequacy and excess were evaluated for each nutrient.
The quality of the study was considered in weighing the evidence. The characteristics examined included the study design and the representativeness of the study population; the validity, reliability, and precision of the methods used for measuring intake and indicators of adequacy or excess; the control of biases and confounding
factors; and the power of the study to demonstrate a given difference or correlation. Publications solely expressing opinions were not used in setting DRIs. The assessment acknowledged the inherent reliability of each type of study design as described above, and it applied standard criteria concerning the strength, dose-response, and temporal pattern of estimated nutrient-disease or adverse effect associations, the consistency of associations among studies of various types, and the specificity and biological plausibility of the suggested relationships (Hill, 1971). For example, biological plausibility would not be sufficient in the presence of a weak association and lack of evidence that exposure preceded the effect.
Data were examined to determine whether similar estimates of the requirement resulted from the use of different indicators and different types of studies. In the DRI model described in Chapter 1, for a single nutrient, the criterion for setting the Estimated Average Requirement (EAR) may differ from one life stage group to another because the critical function or the risk of disease may be different. When no or very poor data are available for a given life stage group, extrapolation is made from the EAR or Adequate Intake (AI) set for another group (see later section on extrapolation); explicit and logical assumptions on relative requirements were made. Because EARs can be used for multiple purposes, unlike AIs, they are established whenever sufficient supporting data were available.
Data Limitations
Although the reference values in these DRI reports are based on data, the data were often scanty or drawn from studies that had limitations in addressing the various questions that confronted the panel. Therefore, many of the questions raised about the requirements for and recommended intakes of these nutrients cannot be answered fully because of inadequacies in the present database. Apart from studies of overt deficiency diseases, there is a dearth of studies that address specific effects of inadequate intakes on specific indicators of health status, and thus a research agenda is proposed (see Chapter 9). For many of the nutrients in the DRI reports, estimated requirements are based on factorial, balance, and biochemical indicator data because there is little information relating health status indicators to functional sufficiency or insufficiency.
Thus, after careful review and analysis of the evidence, including examination of the extent of congruent findings, scientific judg-
ment was used to determine the basis for establishing the values. The reasoning used is described for each nutrient in Chapters 4 through 7.
Method for Determining the Adequate Intake for Infants
The AI for young infants is generally taken to be the average intake by full-term infants who are born to healthy, well-nourished mothers and who are exclusively fed human milk. The extent to which intake of a nutrient from human milk may exceed the actual requirements of infants is not known, and ethics of experimentation preclude testing the levels known to be potentially inadequate. Using the infant exclusively fed human milk as a model is in keeping with the basis for earlier recommendations for intake (e.g., Health Canada, 1990; IOM, 1991). It also supports the recommendation that exclusive intake of human milk is the preferred method of feeding for normal full-term infants for the first 4 to 6 months of life. This recommendation has been made by the Canadian Paediatric Society (Health Canada, 1990), the American Academy of Pediatrics (AAP, 1997), the Institute of Medicine (IOM, 1991), and many other expert groups, even though most U.S. babies no longer receive human milk by age 6 months.
In general, this report does not cover possible variations in physiological need during the first month after birth or the variations in intake of nutrients from human milk that result from differences in milk volume and nutrient concentration during early lactation.
In keeping with the decision made by the Standing Committee on the Scientific Evaluation of Dietary Reference Intakes, specific recommended intakes to meet the needs of formula-fed infants have not been proposed in this report. The use of formula introduces a large number of complex issues, one of which is the bioavailability of different forms of the nutrient in different formula types.
Ages 0 Through 6 Months
To derive the AI for infants ages 0 through 6 months, the mean intake of a nutrient was calculated based on (1) the average concentration of the nutrient from 2 to 6 months of lactation using consensus values from several reported studies, if possible, and (2) an average volume of milk intake of 0.78 L/day. This volume was reported from studies that used test weighing of full-term infants. In this procedure, the infant is weighed before and after each feeding (Butte et al., 1984; Chandra, 1984; Hofvander et al., 1982;
Neville et al., 1988). Because there is variation in both the composition of milk and the volume consumed, the computed value represents the mean. It is expected that infants will consume increased volumes of human milk during growth spurts.
Ages 7 Through 12 Months
During the period of infant growth and gradual weaning to a mixed diet of human milk and solid foods from ages 7 through 12 months, there is no evidence for markedly different nutrient needs. The AI can be derived for this age group by calculating the sum of (1) the content of the nutrient provided by 0.6 L/day of human milk, which is the average volume of milk reported from studies of infants receiving human milk in this age category (Heinig et al., 1993) and (2) that provided by the usual intakes of complementary weaning foods consumed by infants in this age category. Such an approach is in keeping with the current recommendations of the Canadian Paediatric Society (Health Canada, 1990), the American Academy of Pediatrics (AAP, 1997), and the Institute of Medicine (IOM, 1991) for continued feeding of infants with human milk through 9 to 12 months of age with appropriate introduction of solid foods. The World Health Organization recommends the introduction of solid foods after 6 months of age (WHO, 2002). In this report the amounts of potassium and sodium from complementary foods were estimated National Health and Nutrition Examination Survey (NHANES) III data and are presented in the nutrient chapters.
For some of the nutrients in other DRI reports, two other approaches were considered as well: (1) extrapolation downward from the EAR for young adults by adjusting for metabolic or total body size and growth and adding a factor for variability and (2) extrapolation upward from the AI for infants ages 0 through 6 months by using the same type of adjustment. Both of these methods are described below. The results of the methods are evaluated in the process of setting the AI.
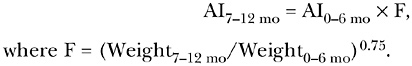
Method for Extrapolating Data from Younger to Older Infants
When information is not available on the nutrient intake of older infants, intake data can be extrapolated from young to older infants. Using the metabolic weight ratio method to extrapolate data from younger to older infants involves metabolic scaling but does not include an adjustment for growth because it is based on a value
for a growing infant. To extrapolate from the AI for infants ages 0 through 6 months to an AI for infants ages 7 through 12 months, the following formula is used:
Method for Extrapolating Data from Adults to Infants and Children
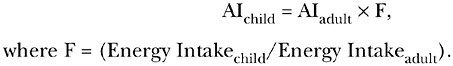
Setting the AI for Children
For water, potassium, and sodium, data were not available to set the EAR and Recommended Dietary Allowance (RDA) for children ages 1 year and older and for adolescents. In the case of sodium and potassium, the AI was extrapolated down from adults by using the average of median energy intakes for both genders for each age group from NHANES II data (IOM, 2002/2005). Extrapolating on the basis of energy intake was used rather than on the basis of body weight because high levels of physical activity have an effect on losses of electrolytes in sweat.
The formula for the extrapolation is
Setting the Tolerable Upper Intake Level for Children
Because data were not available to set the Tolerable Upper Intake Level (UL) for sodium for children, the UL for adults was extrapolated down using the median energy intakes (kcal/day for each age group) (IOM, 2002/2005):
Energy intake was used as the basis for extrapolation rather than body weight because this method was not used in the nutrients included in the report.
Method for Extrapolating Data from Younger Adults to Older Adults
For sodium the AI for older adults is extrapolated from younger adults based on the combined average of median energy intakes for
men and women. Median energy intakes ranged from 1,507 to 2,109 kcal/day for men and women (51–70 years) to 1,356 to 1,978 kcal/day (> 70 years) based on NHANES III data (IOM, 2002/2005). The average of these ranges was used to extrapolate from younger adults who consumed more energy than older adults. However, for potassium the intake was not adjusted down for older adults because of the increased risk of elevated blood pressure with aging.
Methods for Determining Increased Needs for Pregnancy
It is known that the placenta actively transports certain nutrients from the mother to the fetus against a concentration gradient (Hytten and Leitch, 1971). However, for many nutrients, including sodium and potassium, experimental data that could be used to set an EAR and RDA or an AI for pregnancy are lacking. In these cases, the potential increased need for these nutrients during pregnancy is based on theoretical considerations, including obligatory fetal transfer, if data are available, and on increased maternal needs related to increases in energy or protein metabolism, as applicable. Because there was insufficient evidence to suggest that an AI for potassium or sodium during pregnancy should be quantitatively different from that of nonpregnant women and because pregnant women consumed within the energy range of nonpregnant women, an AI was not set differently for pregnant women.
Methods for Determining Increased Needs for Lactation
It is assumed that the total nutrient requirement for sodium, potassium, and water for lactating women equals the requirement for nonpregnant, nonlactating women of similar age plus an increment to cover the amount needed for milk production. Details are provided in each nutrient chapter.
ESTIMATES OF NUTRIENT INTAKE
Reliable and valid methods of food composition analysis are crucial in determining the intake of a nutrient needed to meet a requirement. For nutrients such as sodium, estimating intake has been challenging because of the difficulty in assessing the amount of sodium chloride (salt) added to foods during cooking and during eating.
Methodological Considerations
The quality of nutrient intake data varies widely across studies. The most valid intake data are those collected from the metabolic study protocols in which all food is provided by the researchers, amounts consumed are measured accurately, and the nutrient composition of the food is determined by reliable and valid laboratory analyses. Such protocols are usually possible with only a few subjects. Thus, in many studies, intake data are self-reported (e.g., through 24-hour recalls of food intake, diet records, or food frequency questionnaires).
Potential sources of error in self-reported intake data include over-or underreporting of portion sizes and frequency of intake, omission of foods, and inaccuracies related to the use of food composition tables (IOM, 2000; Lichtman et al., 1992; Mertz et al., 1991). In addition, because a high percentage of the food consumed in the United States and Canada is not prepared from scratch in the home, errors can occur due to a lack of information on how a food was manufactured, prepared, and served. Therefore, the values reported by nationwide surveys or studies that rely on self-report are often inaccurate and possibly biased, with a greater tendency to underestimate actual intake (IOM, 2000).
Because of day-to-day variation in dietary intakes, the distribution of 1-day (or 2-day) intakes for a group is wider than the distribution of usual intakes even though the mean of the intakes may be the same. To reduce this problem, statistical adjustments have been developed (NRC, 1986; Nusser et al., 1996) that require at least 2 days of dietary data from a representative subsample of the population of interest. However, no accepted method is available to adjust for the underreporting of intake, which may average as much as 20 percent for energy (Mertz et al., 1991).
DIETARY INTAKES IN THE UNITED STATES AND CANADA
Sources of Dietary Intake Data
The major sources of current dietary intake data for the U.S. population are the Third National Health and Nutrition Examination Survey (NHANES III), which was conducted from 1988 to 1994 by the U.S. Department of Health and Human Services, and the Continuing Survey of Food Intakes by Individuals (CSFII), which was conducted by the U.S. Department of Agriculture (USDA) from
1994 to 1996. NHANES III examined 30,000 subjects aged 2 months and older. A single 24-hour diet recall was collected for all subjects. A second recall was collected for a 5 percent nonrandom subsample to allow adjustment of intake estimates for day-to-day variation. NHANES III also collected various biochemical data on a subset of subjects. The 1994 to 1996 CSFII collected two nonconsecutive 24-hour recalls from approximately 16,000 subjects of all ages. Both surveys used the food composition database developed by USDA to calculate nutrient intakes (Perloff et al., 1990) and were adjusted by the method of Nusser et al. (1996). National survey data for Canada for these nutrients have been collected in 10 provinces.
Appendixes D and E provide the mean and the fifth through ninety-ninth percentiles of dietary intakes of sodium, potassium, and water from NHANES III and CFSII, adjusted by methods described by the National Research Council (NRC, 1986) and by Feinleib and coworkers (1993) and adjusted for day-to-day variation by the method of Nusser and coworkers (1996). Appendix F provides means and selected percentiles of dietary intakes for adults in 10 provinces.
Food Sources
For some nutrients, two types of information are provided about food sources: identification of the foods that are the major contributors of the nutrients to diets in the United States and Canada and identification of the foods that contain the highest amounts of the nutrient. The determination of foods that are major contributors depends on both nutrient content of a food and the total consumption of the food (amount and frequency). Therefore, a food that has a relatively low concentration of the nutrient might still be a large contributor to total intake if that food is consumed in relatively large amounts.
REFERENCES
AAP (American Academy of Pediatrics). 1997. Breastfeeding and the use of human milk. Pediatrics 100:1035–1039.
Butte NF, Garza C, Smith EO, Nichols BL. 1984. Human milk intake and growth in exclusively breast-fed infants. J Pediatr 104:187–195.
Chandra RK. 1984. Physical growth of exclusively breast-fed infants. Nutr Res 2:275–276.
Feinleib M, Rifkind B, Sempos C, Johnson C, Bachorik P, Lippel K, Carroll M, Ingster-Moore L, Murphy R. 1993. Methodological issues in the measurement of cardiovascular risk factors: Within-person variability in selected se-
rum lipid measures—Results from the Third National Health and Nutrition Survey (NHANES III). Can J Cardiol 9:87D–88D.
Health Canada. 1990. Nutrition Recommendations. The Report of the Scientific Review Committee 1990. Ottawa: Canadian Government Publishing Centre.
Heinig MJ, Nommsen LA, Peerson JM, Lonnerdal B, Dewey KG. 1993. Energy and protein intakes of breast-fed and formula-fed infants during the first year of life and their association with growth velocity: The DARLING Study. Am J Clin Nutr 58:152–161.
Heitmann BL, Lissner L. 1995. Dietary underreporting by obese individuals—Is it specific or non-specific? Br Med J 311:986–989.
Hill AB. 1971. Principles of Medical Statistics, 9th ed. New York: Oxford University Press.
Hofvander Y, Hagman U, Hillervik C, Sjolin S. 1982. The amount of milk consumed by 1–3 months old breast- or bottle-fed infants. Acta Paediatr Scand 71:953–958.
Hytten FE, Leitch I. 1971. The Physiology of Human Pregnancy, 2nd ed. Oxford: Blackwell Scientific.
IOM (Institute of Medicine). 1991. Nutrition During Lactation. Washington, DC: National Academy Press.
IOM. 2000. Dietary Reference Intakes: Applications in Dietary Assessment. Washington, DC : National Academy Press.
IOM. 2002/2005. Dietary Reference Intakes for Energy, Carbohydrate, Fiber, Fat, Fatty Acids, Cholesterol, Protein, and Amino Acids. Washington, DC: The National Academies Press.
Lichtman SW, Pisarska K, Berman ER, Pestone M, Dowling H, Offenbacher E, Weisel H, Heshka S, Matthews DE, Heymsfield SB. 1992. Discrepancy between self-reported and actual caloric intake and exercise in obese subjects. N Engl J Med 327:1893–1898.
Mertz W, Tsui JC, Judd JT, Reiser S, Hallfrisch J, Morris ER, Steele PD, Lashley E. 1991. What are people really eating? The relation between energy intake derived from estimated diet records and intake determined to maintain body weight. Am J Clin Nutr 54:291–295.
Neville MC, Keller R, Seacat J, Lutes V, Neifert M, Casey C, Allen J, Archer P. 1988. Studies in human lactation: Milk volumes in lactating women during the onset of lactation and full lactation. Am J Clin Nutr 48:1375–1386.
NRC (National Research Council). 1986. Nutrient Adequacy. Assessment Using Food Consumption Surveys. Washington, DC: National Academy Press.
Nusser SM, Carriquiry AL, Dodd KW, Fuller WA. 1996. A semiparametric transformation approach to estimating usual daily intake distributions. J Am Stat Assoc 91:1440–1449.
Perloff BP, Rizek RL, Haytowitz DB, Reid PR. 1990. Dietary intake methodology. II. USDA’s Nutrient Data Base for Nationwide Dietary Intake Surveys. J Nutr 120:1530–1534.
WHO (World Health Organization). 2002. The Optimal Duration of Exclusive Breastfeeding. Report of an Expert Consultation. WHO/NHD/01.09. Geneva: WHO.
Willett WC, Sampson L, Stampfer MJ, Rosner B, Bain C, Witschi J, Hennekens CH, Speizer FE. 1985. Reproducibility and validity of a semiquantitative food frequency questionnaire. Am J Epidemiol 122:51–65.


