
B
Origin and Framework of the Development of Dietary Reference Intakes
This report is the sixth in a series of publications resulting from the comprehensive effort being undertaken by the Food and Nutrition Board’s (FNB) Standing Committee on the Scientific Evaluation of Dietary Reference Intakes (DRI Committee) and its panels and subcommittees.
ORIGIN
This initiative began in June 1993, when FNB organized a symposium and public hearing entitled, “Should the Recommended Dietary Allowances Be Revised?” Shortly thereafter, to continue its collaboration with the larger nutrition community on the future of the Recommended Dietary Allowances (RDAs), FNB took two major steps: (1) it prepared, published, and disseminated the concept paper, “How Should the Recommended Dietary Allowances Be Revised?” (IOM, 1994), which invited comments regarding the proposed concept, and (2) it held several symposia at nutrition-focused professional meetings to discuss FNB’s tentative plans and to receive responses to the initial concept paper. Many aspects of the conceptual framework of the DRIs came from the United Kingdom’s report, Dietary Reference Values for Food Energy and Nutrients for the United Kingdom (COMA, 1991).
The five general conclusions presented in FNB’s 1994 concept paper were:
-
Sufficient new information has accumulated to support a reassessment of the RDAs.
-
Where sufficient data for efficacy and safety exist, reduction in the risk of chronic degenerative disease is a concept that should be included in the formulation of future recommendations.
-
Upper levels of intake should be established where data exist regarding risk of toxicity.
-
Components of food of possible benefit to health, although not meeting the traditional concept of a nutrient, should be reviewed, and if adequate data exist, reference intakes should be established for these components.
-
Serious consideration must be given to developing a new format for presenting future recommendations.
Subsequent to the symposium and the release of the concept paper, FNB held workshops at which invited experts discussed many issues related to the development of nutrient-based reference values, and FNB members have continued to provide updates and engage in discussions at professional meetings. In addition, FNB gave attention to the international uses of the earlier RDAs and the expectation that the scientific review of nutrient requirements should be similar for comparable populations.
Concurrently, Health Canada and Canadian scientists were reviewing the need for revision of the Recommended Nutrient Intakes (RNIs) (Health Canada, 1990). Consensus following a symposium for Canadian scientists, cosponsored by the Canadian National Institute of Nutrition and Health Canada in April 1995, was that the Canadian government should pursue the extent to which involvement with the developing FNB process would benefit both Canada and the United States in leading toward harmonization.
Based on extensive input and deliberations, FNB initiated action to provide a framework for the development and possible international harmonization of nutrient-based recommendations that would serve, where warranted, for all of North America. To this end, in December 1995, FNB began a close collaboration with the government of Canada and took action to establish the DRI Committee.
THE CHARGE TO THE COMMITTEE
In 1995, the DRI Committee was appointed to oversee and conduct this project. To accomplish this task over a decade, the DRI Committee devised a plan involving the work of seven or more ex-
pert nutrient group panels and two overarching subcommittees (Figure B-1). The process described below for this report is expected to be used for subsequent reports.
The Panel on DRIs for Electrolytes and Water, composed of experts on these nutrients, was asked to (1) review the scientific literature regarding water and dietary potassium, sodium, chloride, and sulfate to determine the roles, if any, they play in health; (2) review selected components of food that may influence the bioavailability of these compounds, as well as their interaction with each other; (3) develop estimates of dietary intake of these compounds that are compatible with good nutrition throughout the lifespan and that may decrease risk of chronic disease where data indicate they play a role; (4) determine Tolerable Upper Intake Levels (ULs) for each compound where scientific data are available in specific population subgroups; and (5) identify research needed to improve the knowledge of the role of electrolytes and water in health.
The panel was charged with analyzing the literature, evaluating possible criteria or indicators of adequacy, and providing substantive rationales for their choices of each criterion. Using the crite-
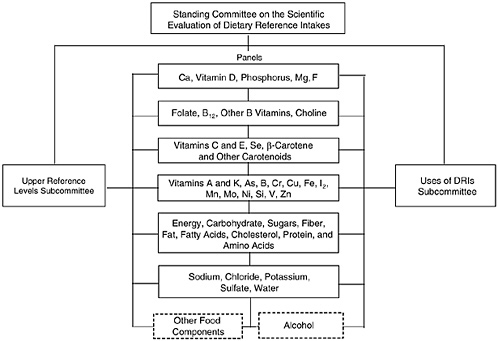
FIGURE B-1 Dietary Reference Intakes project structure.
rion chosen for each stage of the lifespan, the panel estimated the average requirement for each nutrient or food component reviewed, assuming that adequate data were available. As the panel members reviewed data on ULs, they also interacted with the Subcommittee on Upper Reference Levels of Nutrients (UL Subcommittee), which assisted the panel in applying the risk assessment model to each selected nutrient. The DRI values in this report are a product of the joint efforts of the panel and the DRI Committee.
ISSUES OF RELEVANCE FROM PAST DIETARY REFERENCE INTAKE REPORTS
Methodology to Develop Estimated Average Requirements and Recommended Dietary Allowances When Requirements for Nutrients Are Not Normally Distributed
For most of the nutrients for which Estimated Average Requirements (EARs) have been established, the required assumption of distribution of requirements among the groups for which the EAR was developed is that of symmetry about the mean. In the case of iron, a nutrient of concern in many subgroups in the population in the United States, Canada, and other areas, requirements are known to follow a non-normal distribution. Thus a different method was needed to determine the intake of iron at which half of the individuals would be expected to be inadequate in the criterion used to establish adequacy (the EAR), and also to construct an intake level at which only a small percentage of the population would be inadequate (the RDA).
If the requirement of a nutrient is not normally distributed but can be transformed to normality, its EAR and RDA can be estimated by transforming the data, calculating the 50th and 97.5th percentiles, and transforming these percentiles back into the original units. In this case, the difference between the EAR and the RDA cannot be used to obtain an estimate of the standard deviation of the coefficient of variation because skewing is usually present.
Where factorial modeling is used to estimate the distribution of requirement from the distributions of the individual components of requirement, as was done in the case of the iron recommendations (IOM, 2001), it is necessary to add the individual distributions (convolutions). This is easy to do given that the average requirement is simply the sum of the averages of the individual component distributions, and a standard deviation of the combined distribution can be estimated by standard statistical techniques. The 97.5th
percentile can then be estimated (for a further elaboration of this method, see Chapter 9 and Appendix I of Dietary Reference Intakes for Vitamin A, Vitamin K, Arsenic, Boron, Chromium, Copper, Iodine, Iron, Manganese, Molybdenum, Nickel, Silicon, Vanadium, and Zinc [IOM, 2001]).
If normality cannot be assumed for all of the components of requirement, then Monte Carlo simulation is used for the summation of the components. This approach models the distributions of the individual distributions and randomly assigns values to a large simulated population. The total requirement is then calculated for each individual and the median and the 97.5th percentile are calculated directly. As was the case for iron (IOM, 2001), the underlying joint distribution is approximated and a large number of individuals (100,000) is randomly generated. Information about the distribution of values for the requirement components is modeled on the basis of known physiology. Monte Carlo approaches may be used in the simulation of the distribution of components, or where large data sets exist for similar populations (e.g., growth rates in infants), estimates of relative variability may be transferred to the component in the simulated population (Gentle, 1998). At each step, the goal is to achieve distribution values for the component that not only reflect known physiology or known direct observations, but that can also be transformed into a distribution that can be modeled and used in selecting random members to contribute to the final requirement distribution. When the final distribution representing the convolution of components has been derived, then the median and 97.5th percentile of the distribution can be directly estimated. It is recognized that in its simplest form, the Monte Carlo approach ignores possible correlation among components. In the case of iron, however, expected correlation is built into the modeling of requirement where components are linked to a common variable, such as growth rate, so that not all sources of correlation are neglected.
Reference Height and Weights Used in Extrapolating Dietary Reference Intakes for Vitamins and Elements
The most up-to-date data providing heights and weights of individuals in the United States and Canada when the DRI process was initiated in 1995 were limited to anthropometric data from the 1988–1994 Third National Health and Nutrition Examination Survey (NHANES III) in the United States and older data from Canada. Reference values derived from the NHANES III data and used in
TABLE B-1 Reference Heights and Weights for Children and Adults in the United States Used in the Vitamin and Element Dietary Reference Intake Reportsa
|
Sex |
Age |
Median Body Mass Index (kg/m2) |
Reference Height, cm (in) |
Reference Weightb kg (lb) |
|
Male, female |
2–6 mo |
— |
64 (25) |
7 (16) |
|
|
7–11 mo |
— |
72 (28) |
9 (20) |
|
1–3 yr |
— |
91 (36) |
13 (29) |
|
|
4–8 yr |
15.8 |
118 (46) |
22 (48) |
|
|
Male |
9–13 yr |
18.5 |
147 (58) |
40 (88) |
|
|
14–18 yr |
21.3 |
174 (68) |
64 (142) |
|
19–30 yr |
24.4 |
176 (69) |
76 (166) |
|
|
Female |
9–13 yr |
18.3 |
148 (58) |
40 (88) |
|
|
14–18 yr |
21.3 |
163 (64) |
57 (125) |
|
19–30 yr |
22.8 |
163 (64) |
61 (133) |
|
|
a IOM (1997, 1998, 2000a, 2000b, 2001). Adapted from the Third National Health and Nutrition Examination Survey, 1988–1994. b Calculated from body mass index and height for ages 4 through 8 years and older. |
||||
previous reports are given in Table B-1. Given the increasing prevalence of obesity in adults and children (DHHS, 1996), use of such population data is of concern. Thus recent data providing heights and body mass indexes (BMIs) for adults (Kuczmarski et al., 2000) and new growth charts for infants and children have allowed the development of new reference heights and weights in this report that should more closely approximate actual weights based on low risk of chronic disease and adequate growth for children. These new values are used in this report when reference values are needed, and are discussed in Chapter 1 (see Table 1-1).
The earlier values were obtained as follows: the median heights for the life stage and gender groups through age 30 years were identified, and the median weights for these heights were based on reported median BMI for the same individuals. Since there is no evidence that weight should change as adults age if activity is maintained, the reference weights for adults aged 19 through 30 years were applied to all adult age groups.
The most recent nationally representative data available for Canadians (from the 1970–1972 Nutrition Canada Survey [Demirjian, 1980]) were also reviewed. In general, median heights of children
from 1 year of age in the United States were greater by 3 to 8 cm (≈ 1 to 2.5 in) than those of children of the same age in Canada measured two decades earlier (Demirjian, 1980). This difference could be partly explained by approximations necessary to compare the two data sets, but more likely by a continuation of the secular trend of increased heights for age noted in the Nutrition Canada Survey when it compared data from that survey with an earlier (1953) national Canadian survey (Pett and Ogilvie, 1956).
Similarly, median weights beyond age 1 year derived from the recent survey in the United States (NHANES III, 1988–1994) were also greater than those obtained from the older Canadian survey (Demirjian, 1980). Differences were greatest during adolescence, ranging from 10 to 17 percent higher. The differences probably reflect the secular trend of earlier onset of puberty (Herman-Giddens et al., 1997) rather than differences in populations. Calculations of BMI for young adults (e.g., a median of 22.6 for Canadian women compared with 22.8 for U.S. women) resulted in similar values, thus indicating greater concordance between the two surveys by adulthood.
The reference weights used in the previous DRI reports (IOM, 1997, 1998, 2000a, 2000b, 2001) were thus based on the most recent data set available from either country, with recognition that earlier surveys in Canada indicated shorter stature and lower weights during adolescence than did surveys in the United States.
REFERENCES
COMA (Committee on Medical Aspects of Food Policy). 1991. Dietary Reference Values for Food Energy and Nutrients for the United Kingdom. Report on Health and Social Subjects, No. 41. London: HMSO.
Demirjian A. 1980. Anthropometry Report. Height, Weight, and Body Dimensions: A Report from Nutrition Canada. Ottawa: Minister of National Health and Welfare, Health and Promotion Directorate, Health Services and Promotion Branch.
DHHS (U.S. Department of Health and Human Services). 1996. Physical Activity and Health: A Report of the Surgeon General. Atlanta, GA: DHHS, Centers for Disease Control and Prevention, National Center for Chronic Disease Prevention and Health Promotion.
Gentle JE. 1998. Random Number Generation and Monte Carlo Methods. New York: Springer-Verlag.
Health Canada. 1990. Nutrition Recommendations. The Report of the Scientific Review Committee 1990. Ottawa: Canadian Government Publishing Centre.
Herman-Giddens ME, Slora EJ, Wasserman RC, Bourdony CJ, Bhapkar MV, Koch GG, Hasemeier CM. 1997. Secondary sexual characteristics and menses in young girls seen in office practice: A study from the Pediatric Research in Office Settings network. Pediatrics 99:505–512.
IOM (Institute of Medicine). 1994. How Should the Recommended Dietary Allowances be Revised? Food and Nutrition Board. Washington, DC: National Academy Press.
IOM. 1997. Dietary Reference Intakes for Calcium, Phosphorus, Magnesium, Vitamin D, and Fluoride. Washington, DC: National Academy Press.
IOM. 1998. Dietary Reference Intakes for Thiamin, Riboflavin, Niacin, Vitamin B6, Folate, Vitamin B12, Pantothenic Acid, Biotin, and Choline. Washington, DC: National Academy Press.
IOM. 2000a. Dietary Reference Intakes: Applications for Dietary Assessment. Washington, DC: National Academy Press.
IOM. 2000b. Dietary Reference Intakes for Vitamin C, Vitamin E, Selenium, and Carotenoids. Washington, DC: National Academy Press.
IOM. 2001. Dietary Reference Intakes for Vitamin A, Vitamin K, Arsenic, Boron, Chromium, Copper, Iodine, Iron, Manganese, Molybdenum, Nickel, Silicon, Vanadium, and Zinc. Washington, DC: National Academy Press.
Kuczmarski RJ, Ogden CL, Grummer-Strawn LM, Flegal KM, Guo SS, Wei R, Mei Z, Curtin LR, Roche AF, Johnson CL. 2000. CDC growth charts: United States. Adv Data 314:1–28.
Pett LB, Ogilvie GH. 1956. The Canadian Weight-Height Survey. Hum Biol 28:177–188.


