
3
A Model for the Development of Tolerable Upper Intake Levels
BACKGROUND
The Tolerable Upper Intake Level (UL) refers to the highest level of daily nutrient intake that is likely to pose no risk of adverse health effects for almost all individuals in the general population. As intake increases above the UL, the potential risk of adverse effects increases. The term tolerable is chosen because it connotes a level of intake that can, with high probability, be tolerated biologically by individuals; it does not imply acceptability of that level in any other sense. The setting of a UL does not indicate that nutrient intakes greater than the Recommended Dietary Allowance (RDA) or Adequate Intake (AI) are recommended as being beneficial to an individual.1 The UL is not meant to apply to individuals who are treated with the nutrient under medical supervision or to individuals with predisposing conditions that modify their sensitivity to the nutrient. This chapter describes a model for developing ULs.
The term adverse effect is defined as any significant alteration in the structure or function of the human organism (Klaassen et al., 1986) or any impairment of a physiologically important function that could lead to a health effect that is adverse, in accordance with the definition set by the joint World Health Organization (WHO),
Food and Agriculture Organization of the United Nations (FAO), and International Atomic Energy Agency Expert Consultation in Trace Elements in Human Nutrition and Health (WHO, 1996). In the case of nutrients, it is exceedingly important to consider the possibility that the intake of one nutrient may alter, in detrimental ways, the health benefits conferred by another nutrient. Any such alteration (referred to as an adverse nutrient-nutrient interaction) is considered an adverse health effect. When evidence for such adverse interactions is available, it is considered in establishing a nutrient’s UL.
ULs are useful because of the increased interest in and availability of fortified foods, the increased use of dietary supplements, and the growing recognition of the health consequences of excesses, as well as inadequacies, of nutrient intakes. ULs are based on total intake of a nutrient from food, water, and supplements if adverse effects have been associated with total intake. However, if adverse effects have been associated with intake from supplements or food fortificants only, the UL is based on a nutrient intake from those sources only, not on total intake. The UL applies to chronic daily use.
For many nutrients, there are insufficient data on which to develop a UL. This does not mean that there is no potential for adverse effects resulting from high intake. When data about adverse effects are extremely limited, extra caution may be warranted.
Like all chemical agents, nutrients can produce adverse health effects if their intake from a combination of food, water, nutrient supplements, and pharmacological agents is excessive. Some lower level of nutrient intake will ordinarily pose no likelihood (or risk) of adverse health effects in normal individuals even if the level is above that associated with any benefit. It is not possible to identify a single risk-free intake level for a nutrient that can be applied with certainty to all members of a population. However, it is possible to develop intake levels that are unlikely to pose risks of adverse health effects for most members of the general healthy population, including sensitive individuals. For some nutrients, these intake levels may pose a risk to subpopulations with extreme or distinct vulnerabilities.
It is not well documented whether routine, long-term intake above the UL is safe. Although members of the general population should not routinely exceed the UL, intake above the UL may be appropriate for investigation within well-controlled clinical trials. Clinical trials of doses above the UL should not be discouraged, as long as subjects participating in these trials have signed informed consent
documents regarding possible toxicity and as long as these trials employ appropriate safety monitoring of trial subjects.
A MODEL FOR THE DERIVATION OF TOLERABLE UPPER INTAKE LEVELS
The possibility that the methodology used to derive Tolerable Upper Intake Levels (ULs) might be reduced to a mathematical model that could be generically applied to all nutrients was considered. Such a model might have several potential advantages, including ease of application and assurance of consistent treatment of all nutrients. It was concluded, however, that the current state of scientific understanding of toxic phenomena in general, and nutrient toxicity in particular, is insufficient to support the development of such a model. Scientific information about various adverse effects and their relationships to intake levels varies greatly among nutrients and depends on the nature, comprehensiveness, and quality of available data. The uncertainties associated with the unavoidable problem of extrapolating, from the circumstances under which data are developed (e.g., in the laboratory or clinic) to other circumstances (e.g., the healthy population), adds to the complexity.
Given the current state of knowledge, any attempt to capture in a mathematical model all of the information and scientific judgments that must be made to reach conclusions about ULs would not be consistent with contemporary risk assessment practices. Instead, the model for the derivation of ULs consists of a set of scientific factors that always should be considered explicitly. The framework by which these factors are organized is called risk assessment. Risk assessment (NRC, 1983, 1994) is a systematic means of evaluating the probability of occurrence of adverse health effects in humans from excess exposure to an environmental agent (in this case, a nutrient) (FAO/WHO, 1995; Health Canada, 1993). The hallmark of risk assessment is the requirement to be explicit in all of the evaluations and judgments that must be made to document conclusions.
RISK ASSESSMENT AND FOOD SAFETY
Basic Concepts
Risk assessment is a scientific undertaking having as its objective a characterization of the nature and likelihood of harm resulting from human exposure to agents in the environment. The characteriza-
tion of risk typically contains both qualitative and quantitative information and includes a discussion of the scientific uncertainties in that information. In the present context, the agents of interest are nutrients, and the environmental media are food, water, and nonfood sources such as nutrient supplements and pharmacological preparations.
Performing a risk assessment results in a characterization of the relationships between exposure to an agent and the likelihood that adverse health effects will occur in members of exposed populations. Scientific uncertainties are an inherent part of the risk assessment process and are discussed below. Deciding whether the magnitude of exposure is acceptable or tolerable in specific circumstances is not a component of risk assessment; this activity falls within the domain of risk management. Risk management decisions depend on the results of risk assessments but may also involve the public health significance of the risk, the technical feasibility of achieving various degrees of risk control, and the economic and social costs of this control. Because there is no single scientifically definable distinction between safe and unsafe exposures, risk management necessarily incorporates components of sound, practical decision making that are not addressed by the risk assessment process (NRC, 1983, 1994).
Risk assessment requires that information be organized in rather specific ways but does not require any specific scientific evaluation methods. Rather, risk assessors must evaluate scientific information using what they judge to be appropriate methods and must make explicit the basis for their judgments, the uncertainties in risk estimates, and, when appropriate, alternative scientifically plausible interpretations of the available data (NRC, 1994; OTA, 1993).
Risk assessment is subject to two types of scientific uncertainties: those related to data and those associated with inferences that are required when directly applicable data are not available (NRC, 1994). Data uncertainties arise during the evaluation of information obtained from the epidemiological and toxicological studies of nutrient intake levels that are the basis for risk assessments. Examples of inferences include the use of data from experimental animals to estimate responses in humans and the selection of uncertainty factors to estimate inter- and intraspecies variabilities in response to toxic substances. Uncertainties arise whenever estimates of adverse health effects in humans are based on extrapolations of data obtained under dissimilar conditions (e.g., from experimental animal studies). Options for dealing with uncertainties are discussed below and in detail in Appendix K.
Steps in the Risk Assessment Process
The organization of risk assessment is based on a model proposed by the National Research Council (NRC, 1983, 1994) that is widely used in public health and regulatory decision making. The steps of risk assessment as applied to nutrients follow (see also Figure 3-1).
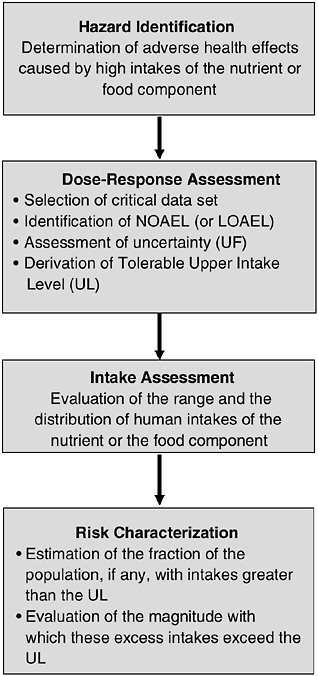
FIGURE 3-1 Risk assessment model for nutrient toxicity.
-
Step 1. Hazard identification involves the collection, organization, and evaluation of all information pertaining to the adverse effects of a given nutrient. It concludes with a summary of the evidence concerning the capacity of the nutrient to cause one or more types of toxicity in humans.
-
Step 2. Dose-response assessment determines the relationship between nutrient intake (dose) and adverse effect (in terms of incidence and severity). This step concludes with an estimate of the Tolerable Upper Intake Level (UL)—it identifies the highest level of daily nutrient intake that is likely to pose no risks of adverse health effects for almost all individuals in the general population. Different ULs may be developed for various life stage groups.
-
Step 3. Intake assessment evaluates the distribution of usual total daily nutrient intakes for members of the general population. In cases where the UL pertains only to supplement use and does not pertain to usual food intakes of the nutrient, the assessment is directed at supplement intakes only. Step 3 does not depend on Step 1 or 2.
-
Step 4. Risk characterization summarizes the conclusions from Steps 1 and 2 with Step 3 to determine the risk. The risk is generally expressed as the fraction of the exposed population, if any, having nutrient intakes (Step 3) in excess of the estimated UL (Steps 1 and 2). If possible, characterization also covers the magnitude of any such excesses. Scientific uncertainties associated with both the UL and the intake estimates are described so that risk managers understand the degree of scientific confidence they can place in the risk assessment.
The risk assessment contains no discussion of recommendations for reducing risk; these are the focus of risk management.
Thresholds
A principal feature of the risk assessment process for noncarcinogens is the long-standing acceptance that no risk of adverse effects is expected unless a threshold dose (or intake) is exceeded. The adverse effects that may be caused by a nutrient almost certainly occur only when the threshold dose is exceeded (NRC, 1994; WHO, 1996). The critical issues concern the methods used to identify the approximate threshold of toxicity for a large and diverse human population. Because most nutrients are not considered to be carcinogenic in humans, approaches used for carcinogenic risk assessment are not discussed here.
Thresholds vary among members of the general population (NRC, 1994). For any given adverse effect, if the distribution of thresholds in the population could be quantitatively identified, it would be possible to establish ULs by defining some point in the lower tail of the distribution of thresholds that would protect some specified fraction of the population. The method for identifying thresholds for a general population described here is designed to ensure that almost all members of the population will be protected, but it is not based on an analysis of the theoretical (but practically unattainable) distribution of thresholds. By using the model to derive the threshold, however, there is considerable confidence that the threshold, which becomes the UL for nutrients or food components, lies very near the low end of the theoretical distribution and is the end representing the most sensitive members of the population. For some nutrients, there may be subpopulations that are not included in the general distribution because of extreme or distinct vulnerabilities to toxicity. Data relating to the effects observed in these groups are not used to derive ULs. Such distinct groups, whose conditions warrant medical supervision, may not be protected by the UL.
The Joint FAO/WHO Expert Committee on Food Additives and various national regulatory bodies have identified factors (called uncertainty factors [UFs]) that account for interspecies and intraspecies differences in response to the hazardous effects of substances and for other uncertainties (WHO, 1987). UFs are used to make inferences about the threshold dose of substances for members of a large and diverse human population using data on adverse effects obtained in epidemiological or experimental studies. These factors are applied consistently when data of specific types and quality are available. They are typically used to derive acceptable daily intakes for food additives and other substances for which data on adverse effects are considered sufficient to meet minimum standards of quality and completeness (FAO/WHO, 1982). These adopted or recognized UFs have sometimes been coupled with other factors to compensate for deficiencies in the available data and other uncertainties regarding data.
When possible, the UL is based on a no-observed-adverse-effect level (NOAEL), which is the highest intake (or experimental oral dose) of a nutrient at which no adverse effects have been observed in the individuals studied. This is identified for a specific circumstance in the hazard identification and dose-response assessment steps of the risk. If there are no adequate data demonstrating a NOAEL, then a lowest-observed-adverse-effect level (LOAEL) may be used. A LOAEL is the lowest intake (or experimental oral dose)
at which an adverse effect has been identified. The derivation of a UL from a NOAEL (or LOAEL) involves a series of choices about what factors should be used to deal with uncertainties. Uncertainty factors are applied in an attempt to deal both with gaps in data and with incomplete knowledge about the inferences required (e.g., the expected variability in response within the human population). The problems of both data and inference uncertainties arise in all steps of the risk assessment. A discussion of options available for dealing with these uncertainties is presented below and in greater detail in Appendix K.
A UL is not, in itself, a description or estimate of human risk. It is derived by application of the hazard identification and dose-response evaluation steps (steps 1 and 2) of the risk assessment model. To determine whether populations are at risk requires an intake or exposure assessment (step 3, evaluation of intakes of the nutrient by the population) and a determination of the fractions of these populations, if any, whose intakes exceed the UL. In the intake assessment and risk characterization steps (steps 3 and 4), the distribution of usual intakes for the population is used as a basis for determining whether and to what extent the population is at risk (Figure 3-1). A discussion of other aspects of the risk characterization that may be useful in judging the public health significance of the risk and in risk management decisions is provided in the final section of this chapter, “Risk Characterization.”
APPLICATION OF THE RISK ASSESSMENT MODEL TO NUTRIENTS
This section provides guidance for applying the risk assessment framework (the model) to the derivation of Tolerable Upper Intake Levels (ULs) for nutrients.
Special Problems Associated with Substances Required for Human Nutrition
Although the risk assessment model outlined above can be applied to nutrients to derive ULs, it must be recognized that nutrients possess some properties that distinguish them from the types of agents for which the risk assessment model was originally developed (NRC, 1983). In the application of accepted standards for risk assessment of environmental chemicals to risk assessment of nutrients, a fundamental difference between the two categories must be recognized: within a certain range of intakes, nutrients are essential
for human well-being and usually for life itself. Nonetheless, they may share with other chemicals the production of adverse effects at excessive exposures. Because the consumption of balanced diets is consistent with the development and survival of humankind over many millennia, there is less need for the large uncertainty factors that have been used for the risk assessment of nonessential chemicals. In addition, if data on the adverse effects of nutrients are available primarily from studies in human populations, there will be less uncertainty than is associated with the types of data available on nonessential chemicals.
There is no evidence to suggest that nutrients consumed at the recommended intake (the Recommended Dietary Allowance or Adequate Intake) present a risk of adverse effects to the general population.2 It is clear, however, that the addition of nutrients to a diet through the ingestion of large amounts of highly fortified food or nonfood sources such as supplements or both may (at some level) pose a risk of adverse health effects. The UL is the highest level of daily nutrient intake that is likely to pose no risks of adverse health effects for almost all individuals in the general population. As intake increases above the UL, the risk of adverse effects increases.
If adverse effects have been associated with total intake, ULs are based on total intake of a nutrient from food, water, and supplements. For cases in which adverse effects have been associated with intake only from supplements and food fortificants, the UL is based on intake from those sources only, rather than on total intake. The effects of nutrients from fortified foods or supplements may differ from those of naturally occurring constituents of foods because of the chemical form of the nutrient, the timing of the intake and amount consumed in a single bolus dose, the matrix supplied by the food, and the relation of the nutrient to the other constituents of the diet.
Nutrient requirements and food intake are related to the metabolizing body mass, which is also at least an indirect measure of the space in which the nutrients are distributed. This relation between food intake and space of distribution supports homeostasis, which
maintains nutrient concentrations in that space within a range compatible with health. However, excessive intake of a single nutrient from supplements or fortificants may compromise this homeostatic mechanism. Such elevations alone may pose risks of adverse effects; imbalances among the vitamins may also be possible. These reasons and those discussed previously support the need to include the form and pattern of consumption in the assessment of risk from high nutrient or food component intake.
Consideration of Variability in Sensitivity
The risk assessment model outlined in this chapter is consistent with classical risk assessment approaches in that it must consider variability in the sensitivity of individuals to adverse effects of nutrients or food components. A discussion of how variability is dealt with in the context of nutritional risk assessment follows.
Physiological changes and common conditions associated with growth and maturation that occur during an individual’s lifespan may influence sensitivity to nutrient toxicity. For example, sensitivity increases with the declines in lean body mass and with declines in renal and liver function that occur with aging; sensitivity changes in direct relation to intestinal absorption or intestinal synthesis of nutrients; sensitivity in the newborn infant is also increased because of rapid brain growth and limited ability to secrete or biotransform toxicants; and sensitivity increases with decreases in the rate of metabolism of nutrients. During pregnancy, the increase in total body water and glomerular filtration results in lower blood levels of water-soluble vitamins dose for dose and therefore results in reduced susceptibility to potential adverse effects. However, in the unborn fetus this may be offset by active placental transfer, accumulation of certain nutrients in the amniotic fluid, and rapid development of the brain. Examples of life stage groups that may differ in terms of nutritional needs and toxicological sensitivity include infants and children, the elderly, and women during pregnancy and lactation.
Even within relatively homogeneous life stage groups, there is a range of sensitivities to toxic effects. The model described below accounts for normally expected variability in sensitivity but excludes subpopulations with extreme and distinct vulnerabilities. Such subpopulations consist of individuals needing medical supervision; they are better served through the use of public health screening, product labeling, or other individualized health care strategies. Such populations may not be at negligible risk when their intakes reach the UL developed for the healthy population. The decision to treat
identifiable vulnerable subgroups as distinct (not protected by the UL) is a matter of judgment and is discussed in individual nutrient chapters as applicable.
Bioavailability
In the context of toxicity, the bioavailability of an ingested nutrient can be defined as its accessibility to normal metabolic and physiological processes. Bioavailability influences a nutrient’s beneficial effects at physiological levels of intake and also may affect the nature and severity of toxicity due to excessive intakes. The concentration and chemical form of the nutrient, the nutrition and health of the individual, and excretory losses all affect bioavailability. Bioavailability data for specific nutrients must be considered and incorporated by the risk assessment process.
Some nutrients may be less readily absorbed when they are part of a meal than when consumed separately. Supplemental forms of some nutrients may require special consideration if they have higher bioavailability and therefore may present a greater risk of producing adverse effects than equivalent amounts from the natural form found in food.
Nutrient-Nutrient Interactions
A diverse array of adverse health effects can occur as a result of the interaction of nutrients. The potential risks of adverse nutrient-nutrient interactions increase when there is an imbalance in the intake of two or more nutrients. Excessive intake of one nutrient may interfere with absorption, excretion, transport, storage, function, or metabolism of a second nutrient. Possible adverse nutrient-nutrient interactions are considered as a part of setting a UL. Nutrient-nutrient interactions may be considered either as a critical endpoint on which to base a UL or as supportive evidence for a UL based on another endpoint.
Other Relevant Factors Affecting the Bioavailability of Nutrients
In addition to nutrient interactions, other considerations have the potential to influence nutrient bioavailability, such as the nutritional status of an individual and the form of intake. These issues are considered in the risk assessment. ULs must therefore be based on nutrients as part of the total diet, including the contribution from water. Nutrient supplements that are taken separately from
food require special consideration, because they are likely to have different bioavailabilities and therefore may represent a greater risk of producing adverse effects.
STEPS IN THE DEVELOPMENT OF THE TOLERABLE UPPER INTAKE LEVEL
Hazard Identification
Based on a thorough review of the scientific literature, the hazard identification step outlines the adverse health effects that have been demonstrated to be caused by the nutrient. The primary types of data used as background for identifying nutrient hazards in humans are as follows:
-
Human studies. Human data provide the most relevant kind of information for hazard identification and, when they are of sufficient quality and extent, are given the greatest weight. However, the number of controlled human toxicity studies conducted in a clinical setting is very limited because of ethical reasons. Such studies are generally most useful for identifying very mild (and ordinarily reversible) adverse effects. Observational studies that focus on well-defined populations with clear exposures to a range of nutrient intake levels are useful for establishing a relationship between exposure and effect. Observational data in the form of case reports or anecdotal evidence are used for developing hypotheses that can lead to knowledge of causal associations. Sometimes a series of case reports, if it shows a clear and distinct pattern of effects, may be reasonably convincing on the question of causality.
-
Animal data. Most of the available data used in regulatory risk assessments come from controlled laboratory experiments in animals, usually mammalian species other than humans (e.g., rodents). Such data are used in part because human data on nonessential chemicals are generally very limited. Moreover, there is a long-standing history of the use of animal studies to identify the toxic properties of chemical substances, and there is no inherent reason why animal data should not be relevant to the evaluation of nutrient toxicity. Animal studies offer several advantages over human studies. They can, for example, be readily controlled so that causal relationships can be recognized. It is possible to identify the full range of toxic effects produced by a chemical over a wide range of exposures and to establish dose-response relationships. The effects of chronic exposures can be identified in far less time than they can
|
BOX 3-1 Development of Tolerable Upper Intake Levels (ULs) COMPONENTS OF HAZARD IDENTIFICATION
COMPONENTS OF DOSE-RESPONSE ASSESSMENT
|
-
be with the use of epidemiological methods. All these advantages of animal data, however, may not always overcome the fact that species differences in response to chemical substances can sometimes be profound, and any extrapolation of animal data to predict human response needs to take into account this possibility.
Key issues that are addressed in the data evaluation of human and animal studies are described below (see Box 3-1).
Evidence of Adverse Effects in Humans
The hazard identification step involves the examination of human, animal, and in vitro published evidence addressing the likelihood of a nutrient eliciting an adverse effect in humans. Decisions about which observed effects are adverse are based on scientific judgments. Although toxicologists generally regard any demonstrable structural or functional alteration as representing an adverse effect, some alterations may be considered to be of little or self-limiting biological importance. As noted earlier, adverse nutrient-nutrient interactions are considered in the definition of an adverse effect.
Causality
The identification of a hazard is strengthened by evidence of causality. As explained in Chapter 2, the criteria of Hill (1971) are considered in judging the causal significance of an exposure-effect association indicated by epidemiological studies.
Relevance of Experimental Data
Consideration of the following issues can be useful in assessing the relevance of experimental data.
Animal Data. Some animal data may be of limited utility in judging the toxicity of nutrients because of highly variable interspecies differences in nutrient requirements. Nevertheless, relevant animal data are considered in the hazard identification and dose-response assessment steps where applicable, and, in general, they are used for hazard identification unless there are data demonstrating they are not relevant to human beings or if it is clear that the available human data are sufficient.
Route of Exposure.3 Data derived from studies involving oral exposure (rather than parenteral, inhalation, or dermal exposure) are most useful for the evaluation of nutrients. Data derived from studies involving parenteral, inhalation, or dermal routes of exposure may be considered relevant if the adverse effects are systemic and data are available to permit interroute extrapolation.
Duration of Exposure. Because the magnitude, duration, and frequency of exposure can vary considerably in different situations, consideration needs to be given to the relevance of the exposure scenario (e.g., chronic daily dietary exposure versus short-term bolus doses) to dietary intakes by human populations.
Pharmacokinetic and Metabolic Data
When available, data regarding the rates of nutrient absorption, distribution, metabolism, and excretion may be important in the derivation of Tolerable Upper Intake Levels (ULs). Such data may provide significant information regarding the interspecies differ-
ences and similarities in nutrient behavior and thus may assist with identifying relevant animal data. They may also assist with identifying life-stage differences in response to nutrient toxicity.
In some cases, there may be limited or even no significant data relating to nutrient toxicity. It is conceivable that, in such cases, pharmacokinetic and metabolic data may provide valuable insights into the magnitude of the UL. Thus, if there are significant pharmacokinetic and metabolic data over the range of intakes that meet nutrient requirements, and if it is shown that this pattern of pharmacokinetic and metabolic data does not change in the range of intakes greater than those required for nutrition, it may be possible to infer the absence of toxic risk in this range. In contrast, an alteration of pharmacokinetics or metabolism may suggest the potential for adverse effects. There has been no case encountered thus far in which sufficient pharmacokinetic and metabolic data are available for establishing ULs in this fashion, but it is possible such situations may arise in the future.
Mechanisms of Toxic Action
Knowledge of molecular and cellular events underlying the production of toxicity can assist with addressing the problems of extrapolation between species and from high to low doses. It may also aid in understanding whether the mechanisms associated with toxicity are those associated with deficiency. In most cases, however, because knowledge of the biochemical sequence of events resulting from toxicity and deficiency is still incomplete, it is not yet possible to state with certainty whether these sequences share a common pathway.
Quality and Completeness of the Database
The scientific quality and quantity of the database are evaluated. Human or animal data are reviewed for suggestions that the substances have the potential to produce additional adverse health effects. If suggestions are found, additional studies may be recommended.
Identification of Distinct and Highly Sensitive Subpopulations
The ULs are based on protecting the most sensitive members of the general population from adverse effects of high nutrient intake. Some highly sensitive subpopulations have responses (in terms of
incidence, severity, or both) to the agent of interest that are clearly distinct from the responses expected for the healthy population. The risk assessment process recognizes that there may be individuals within any life stage group who are more biologically sensitive than others, and thus their extreme sensitivities do not fall within the range of sensitivities expected for the general population. The UL for the general population may not be protective for these subgroups. As indicated earlier, the extent to which a distinct subpopulation will be included in the derivation of a UL for the general population is an area of judgment to be addressed on a case-by-case basis.
Dose-Response Assessment
The process for deriving the UL is described in this section and outlined in Box 3-1. It includes selection of the critical data set, identification of a critical endpoint with its no-observed-adverse-effect level (NOAEL) or lowest-observed-adverse-effect level (LOAEL), and assessment of uncertainty.
Data Selection and Identification of Critical Endpoints
The data evaluation process results in the selection of the most appropriate or critical data sets for deriving the UL. Selecting the critical data set includes the following considerations:
-
Human data, when adequate to evaluate adverse effects, are preferable to animal data, although the latter may provide useful supportive information.
-
In the absence of appropriate human data, information from an animal species with biological responses most like those of humans is most valuable. Pharmacokinetic, metabolic, and mechanistic data may be available to assist with the identification of relevant animal species.
-
If it is not possible to identify such a species or to select such data, data from the most sensitive animal species, strain, and gender combination are given the greatest emphasis.
-
The route of exposure that most resembles the route of expected human intake is preferable. This consideration includes the digestive state (e.g., fed or fasted) of the subjects or experimental animals. Where this is not possible, the differences in route of exposure are noted as a source of uncertainty.
-
The critical data set defines a dose-response relationship be-
-
tween intake and the extent of the toxic response known to be most relevant to humans. Data on bioavailability are considered and adjustments in expressions of dose-response are made to determine whether any apparent differences in response can be explained.
-
The critical data set documents the route of exposure and the magnitude and duration of the intake. Furthermore, the critical data set documents the NOAEL (or LOAEL).
Identification of NOAEL (or LOAEL)
A nutrient can produce more than one toxic effect (or endpoint), even within the same species or in studies using the same or different exposure durations. The NOAELs and LOAELs for these effects will ordinarily differ. The critical endpoint used to establish a UL is the adverse biological effect exhibiting the lowest NOAEL (e.g., the most sensitive indicator of a nutrient’s toxicity). Because the selection of uncertainty factors (UFs) depends in part on the seriousness of the adverse effect, it is possible that lower ULs may result from the use of the most serious (rather than most sensitive) endpoint. Thus, it is often necessary to evaluate several endpoints independently to determine which one leads to the lowest UL.
For some nutrients, there may be inadequate data on which to develop a UL. The lack of reports of adverse effects following excess intake of a nutrient does not mean that adverse effects do not occur. As the intake of any nutrient increases, a point (see Figure 3-2) is reached at which intake begins to pose a risk. Above this point, increased intake increases the risk of adverse effects. For some nutrients and for various reasons, there are inadequate data to identify this point or even to estimate its location.
Because adverse effects are almost certain to occur for any nutrient at some level of intake, it should be assumed that such effects may occur for nutrients for which a scientifically documentable UL cannot now be derived. Until a UL is set or an alternative approach to identifying protective limits is developed, intakes greater than the Recommended Dietary Allowance or Adequate Intake should be viewed with caution.
The absence of sufficient data to establish a UL points to the need for studies suitable for developing them.
Uncertainty Assessment
Several judgments must be made regarding the uncertainties and thus the uncertainty factor (UF) associated with extrapolating from
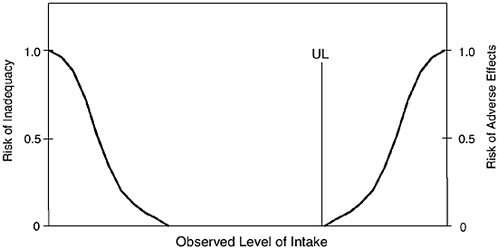
FIGURE 3-2 Theoretical description of health effects of a nutrient as a function of level of intake. The Tolerable Upper Intake Level (UL) is the highest level of daily nutrient intake that is likely to pose no risks of adverse health effects for almost all individuals in the general population. At intakes above the UL, the risk of adverse effects increases.
the observed data to the general population (see Appendix K). Applying a UF to a NOAEL (or LOAEL) results in a value for the derived UL that is less than the experimentally derived NOAEL, unless the UF is 1.0. The greater the uncertainty, the larger the UF and the smaller the resulting UL. This is consistent with the ultimate goal of the risk assessment: to provide an estimate of a level of intake that will protect the health of virtually all members of the healthy population (Mertz et al., 1994).
Although several reports describe the underlying basis for UFs (Dourson and Stara, 1983; Zielhuis and van der Kreek, 1979), the strength of the evidence supporting the use of a specific UF will vary. Because the imprecision of these UFs is a major limitation of risk assessment approaches, considerable leeway must be allowed for the application of scientific judgment in making the final determination. Because data are generally available regarding intakes of nutrients in human populations, the data on nutrient toxicity may not be subject to the same uncertainties as are data on nonessential chemical agents. The resulting UFs for nutrients and food components are typically less than the factors of 10 often applied to nonessential toxic substances. The UFs are lower with higher quality data and when the adverse effects are extremely mild and reversible.
In general, when determining a UF, the following potential
sources of uncertainty are considered and combined in the final UF:
-
Interindividual variation in sensitivity. Small UFs (close to 1) are used to represent this source of uncertainty if it is judged that little population variability is expected for the adverse effect, and larger factors (close to 10) are used if variability is expected to be great (NRC, 1994).
-
Extrapolation from experimental animals to humans. A UF to account for the uncertainty in extrapolating animal data to humans is generally applied to the NOAEL when animal data are the primary data set available. While a default UF of 10 is often used to extrapolate animal data to humans for nonessential chemicals, a lower UF may be used because of data showing some similarities between the animal and human responses (NRC, 1994).
-
LOAEL instead of NOAEL. If a NOAEL is not available, a UF may be applied to account for the uncertainty in deriving a UL from the LOAEL. The size of the UF involves scientific judgment based on the severity and incidence of the observed effect at the LOAEL and the steepness (slope) of the dose response.
-
Subchronic NOAEL to predict chronic NOAEL. When data are lacking on chronic exposures, scientific judgment is necessary to determine whether chronic exposure is likely to lead to adverse effects at lower intakes than those producing effects after subchronic exposures (exposures of shorter duration).
Derivation of a UL
The UL is derived by dividing the NOAEL (or LOAEL) by a single UF that incorporates all relevant uncertainties. ULs, expressed as amount per day, are derived for various life stage groups using relevant databases, NOAELs, LOAELs, and UFs. In cases where no data exist with regard to NOAELs or LOAELs for the group under consideration, extrapolations from data in other age groups or animal data are made on the basis of known differences in body size, physiology, metabolism, absorption, and excretion of the nutrient.
Generally, any age group adjustments are made based solely on differences in body weight, unless there are data demonstrating age-related differences in nutrient pharmacokinetics, metabolism, or mechanism of action.
The derivation of the UL involves the use of scientific judgment to select the appropriate NOAEL (or LOAEL) and UF. As shown in
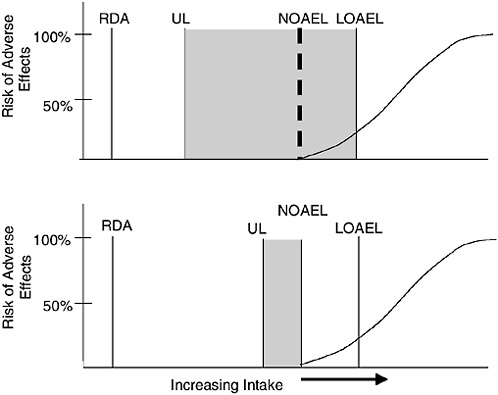
FIGURE 3-3 Effect of uncertainty assessment on UL. Dashed line represents hypothetical NOAEL. Solid lines represent available data used to set the UL. The gray area represents theoretical range of uncertainty. UL = Tolerable Upper Intake Level; NOAEL = no-observed-adverse-effect level; LOAEL = lowest-observed-adverse-effect level; RDA = Recommended Dietary Allowance.
Figure 3-3, when using the same critical endpoint there is a greater level of uncertainty in setting the UL based on a LOAEL as compared with a NOAEL. The risk assessment requires explicit consideration and discussion of all choices made, regarding both the data used and the uncertainties accounted for. These considerations are discussed in the chapters on nutrients and food components.
Characterization of the Estimate and Special Considerations
If the data review reveals the existence of subpopulations having distinct and exceptional sensitivities to a nutrient’s toxicity, these subpopulations are explicitly discussed and concerns related to adverse effects are noted; however, the use of the data is not included in the identification of the NOAEL or LOAEL on which the UL for the general population is based.
Circumstances in Which No UL Is Established
There are two general conditions under which ULs are not established. In some cases the lack of sufficient evidence regarding a nutrient’s capacity to cause adverse effects prohibits the application of the UL model. In other cases, the evidence is available but meeting the UL derived from such evidence will necessarily result in the introduction of undesirable health effects because of the required adjustments in dietary patterns.
Insufficient Evidence of Adverse Effects
The scientific evidence relating to adverse effects of nutrient excess varies greatly among nutrients. The type of data and evidence of causation used to derive ULs have been described in the earlier sections of this chapter, but such data and evidence are simply unavailable for some nutrients. In some cases, some data relating to adverse effects may be available but are of such uncertain relevance to human health that their use in deriving ULs is scientifically insupportable. In every instance in which ULs are not derived because of lack of adequate evidence, the specific limitations in the database are described.
INTAKE ASSESSMENT
To assess the risk of adverse effects, information on the range of nutrient intakes in the general population is required. As noted earlier, in cases where the Tolerable Upper Intake Level pertains only to supplement use and does not pertain to usual food intakes of the nutrient, the assessment is directed at supplement intakes only.
RISK CHARACTERIZATION
As described earlier, the question of whether nutrient intakes create a risk of toxicity requires a comparison of the range of nutrient intakes (food, supplements, and other sources or supplements alone, depending on the basis for the Tolerable Upper Intake Level [UL]) with the UL.
Figure 3-4 illustrates a distribution of chronic nutrient intakes in a population; the fraction of the population experiencing chronic intakes above the UL represents the potential at-risk group. A policy decision is needed to determine whether efforts should be made
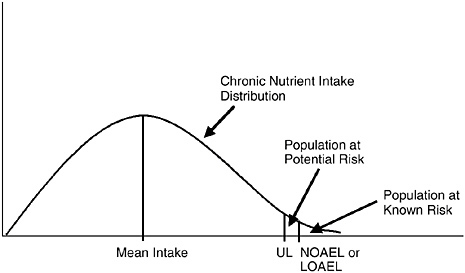
FIGURE 3-4 Illustration of the population at risk from excessive nutrient intakes. The fraction of the population consistently consuming a nutrient at intake levels in excess of the UL is potentially at risk of adverse health effects. See text for a discussion of additional factors necessary to judge the significance of the risk. LOAEL = lowest-observed-adverse-effect level; NOAEL = no-observed-adverse-effect level; UL = Tolerable Upper Intake Level.
to reduce risk. Few precedents for nutrients are available for such policy choices, although in the area of food additive or pesticide regulation, federal regulatory agencies have generally sought to ensure that the ninetieth or ninety-fifth percentile intakes fall below the UL (or its approximate equivalent measure of risk). If this goal is achieved, the fraction of the population remaining above the UL is likely to experience intakes only slightly greater than the UL and is likely to be at little or no risk.
For risk management decisions, it is useful to evaluate the public health significance of the risk, and information contained in the risk characterization is critical for that purpose.
Thus, the significance of the risk to a population consuming a nutrient in excess of the UL is determined by the following:
-
the fraction of the population consistently consuming the nutrient at intake levels in excess of the UL,
-
the seriousness of the adverse effects associated with the nutrient,
-
the extent to which the effect is reversible when intakes are reduced to levels less than the UL, and
-
the fraction of the population with consistent intakes above the NOAEL or even the LOAEL.
Thus, the significance of the risk of excessive nutrient intake cannot be judged only by reference to Figure 3-4, but requires careful consideration of all of the above factors. Information on these factors is contained in this report’s sections describing the bases for each of the ULs.
REFERENCES
Dourson ML, Stara JF. 1983. Regulatory history and experimental support of uncertainty (safety) factors. Regul Toxicol Pharmacol 3:224–238.
FAO/WHO (Food and Agriculture Organization of the United Nations/World Health Organization). 1982. Evaluation of Certain Food Additives and Contaminants. Twenty-sixth report of the Joint FAO/WHO Expert Committee on Food Additives. WHO Technical Report Series No. 683. Geneva: WHO.
FAO/WHO. 1995. The Application of Risk Analysis to Food Standard Issues. Recommendations to the Codex Alimentarius Commission (ALINORM 95/9, Appendix 5). Geneva: WHO.
Health Canada. 1993. Health Risk Determination—The Challenge of Health Protection. Ottawa: Health Canada, Health Protection Branch.
Hill AB. 1971. Principles of Medical Statistics, 9th ed. New York: Oxford University Press.
Klaassen CD, Amdur MO, Doull J. 1986. Casarett and Doull’s Toxicology: The Basic Science of Poisons, 3rd ed. New York: Macmillan.
Mertz W, Abernathy CO, Olin SS. 1994. Risk Assessment of Essential Elements. Washington, DC: ILSI Press.
NRC (National Research Council). 1983. Risk Assessment in the Federal Government: Managing the Process. Washington, DC: National Academy Press.
NRC. 1994. Science and Judgment in Risk Assessment. Washington, DC: National Academy Press.
OTA (Office of Technology Assessment). 1993. Researching Health Risks. Washington, DC: Office of Technology Assessment.
WHO (World Health Organization). 1987. Principles for the Safety Assessment of Food Additives and Contaminants in Food. Environmental Health Criteria 70. Geneva: WHO.
WHO. 1996. Trace Elements in Human Nutrition and Health. Geneva: WHO.
Zielhuis RL, van der Kreek FW. 1979. The use of a safety factor in setting health-based permissible levels for occupational exposure. Int Arch Occup Environ Health 42:191–201.


