
2
Lessons Learned from Previous Programs
NOAA will not be the first agency or group to generate climate-quality data, and NOAA can learn many lessons from previous efforts. This chapter reviews variables that have been observed over long periods of time and have evolved in their use by the wider science community to become de facto Climate Data Records (CDRs). The intention of this review is to gather lessons learned from these past experiences and to give guidance for future activities in creating CDRs. This list of variables is illustrative and not comprehensive. Each brief summary contains a list of findings for that variable. After the presentation of these examples, the chapter concludes with lessons culled from the individual examples. The emphasis in these examples is on satellite data analyses and their antecedent measurements as they apply to long-term climate problems.
ATMOSPHERIC TEMPERATURE PROFILES
In 1969 Nimbus 3 carried the first of a new class of remote-sounding sensors, the Space Infra-Red Sounder (SIRS A), which demonstrated that satellite sensing can provide vertical temperature profiles extending from the stratosphere to the surface with global coverage and useful spatial resolution and accuracy. Shortly thereafter, simulation studies with General Circulation Models (GCMs) validated the “Charney conjecture” that given the continuous historical record of global atmospheric temperature profiles over a sufficiently long integration period, one should be able to infer, with the assistance of a GCM, the complete state of the atmosphere. National Environmental Satellite Data and Information Service (NESDIS) subsequently launched the first operational sounder system in 1972, the Vertical Temperature Profile Radiometer (VTPR), aboard the NOAA 2 satellite. In 1978 Television Ifrared Operational Satellite—Next generation (TIROS N) was launched with an improved 20-channel High Infrared Sounder (HIRS)
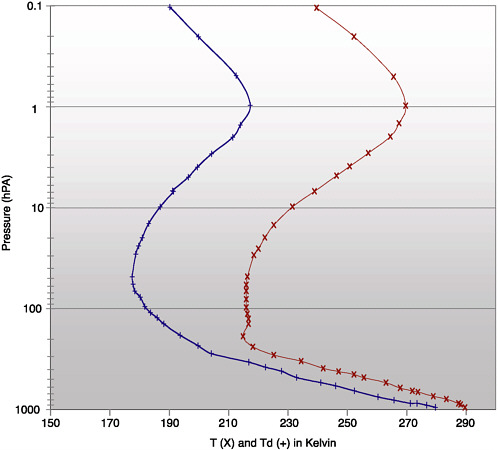
FIGURE 2-1 TOVS data from the NOAA 15 satellite using MSU and AMSU respectively for the European area.
accompanied by the Microwave Sounder Unit (MSU) and Stratospheric Sounder Unit (SSU) forming the TIROS Operation Vertical Sounder (TOVS) (Figure 2-1).
The NOAA polar-orbiting operational satellite series, starting with NOAA 9 and extending through NOAA 16, has carried essentially the same TOVS instrument package (an improved microwave sounder Advanced
Microwave Sounding Unit [AMSU] was added on NOAA 14 and subsequent satellites), providing a continuous record of global atmospheric temperature profiles for almost 25 years. These data have become indispensable inputs to operational forecast centers. In 2002 NASA launched Aqua carrying the Atmospheric Infrared Sounder (AIRS)/AMSU/Humidity Sounder for Brazil (HSB) sounder system with hyper IR spectral resolution as well as considerably higher spatial resolution. This represented the first significant sounder system upgrade to the TOVS system in 25 years, and the NPOESS Preparatory Project/National Polar-orbiting Operational Environmental Satellite System (NPP/NPOESS) system will carry advanced operational sounder systems through the year 2025.
To address problems related to understanding global climate NOAA and NASA initiated a Pathfinder program in the mid-1980s to carefully reprocess satellite products into climate data records extending over a common fixed period from April 1, 1987 to December 31, 1988. A TOVS science working group identified three conceptually distinct algorithms in 1991 for consideration, and NASA/NOAA supported TOVS Pathfinder climate data studies spanning the different algorithmic approaches for this suite of instruments.
The algorithm employed in the TOVS A dataset is a physically based algorithm using a GCM model analysis first guess. This dataset produces column radiances both clear and cloud contaminated, atmospheric temperature profiles, humidity profiles, sea and land surface air and ground temperatures, cloud cover, cloud heights, precipitation, surface emissivity, outgoing longwave radiation, and albedo and ozone profiles. These products have been subsetted into a variety of monthly, seasonal, and interannual means, variances, and climate anomalies. These geophysical parameters are mapped to a 1º × 1º latitude-longitude grid at three different temporal resolutions: daily, 5 day, and monthly, separately for the AM and PM satellites. The second algorithm employed in the TOVS B dataset is a statistical-physical approach using a neural-net-matching approach from a select set of 1800 radiosondes to obtain a first guess, then followed by a Bayesiasn statistical inversion. These datasets include 1º grids derived from Channel 2 of the MSUs for daily and monthly lower and upper tropospheric temperatures as well as lower stratospheric temperatures for the AM and PM satellites. The third dataset TOVS C1 includes 1º grids derived from Channel 2 of the MSUs for daily and monthly lower and upper tropospheric temperatures, as well as lower stratospheric temperatures for the AM and PM satellites. MSU Channel 2 (53.74 GHz) is sensitive to deep layer average tropospheric temperatures with a weighting function peaking near 500 hPa and is very slightly affected by variations in tropospheric humidity, but is
contaminated by precipitation-size ice in deep convective clouds and high elevation terrain. A TOVS C2 dataset for the 18-month period employed a second algorithm version for the Channel 2 MSU data. The Channel 2 MSU data were averaged along the scanline to produce a 2 × 2 degree gridded monthly dataset, except for one product that used adjacent field of views. The data were also screened for precipitation and high terrain.
Lessons Learned
-
Preparing long-term scientifically credible CDRs spanning two decades and longer requires frequent reprocessing to deal with unanticipated problems arising from a variety of factors that are often not revealed until several years of data are processed and analyzed.
-
An issue faced by all the TOVS Pathfinder teams was acquiring the long-term resources needed to keep a team of scientists, instrument engineers, and computer programmers together to make longer CDRs and to utilize evolving technology.
-
The TOVS Pathfinder project was conceived for a limited data period with relatively homogeneous instrument sensors and so did not address many of the problems faced in producing a climate dataset of more than two decades with instrument changes and long-term satellite stability.
-
Significant additional computing resources are needed to revise algorithms and to rerun processing systems to remove any spurious interannual drifts and jumps.
-
Calibrating and tuning even the same instruments for CDRs requires at least annual overlaps.
-
Introducing new instruments with increased spectral functionality, resolution, and coverage into the system raises the possibility of CDRs branching into multiple versions. New sounder instruments significantly increase the data volume, requiring greater computing and archiving resources.
-
Multiple algorithmic approaches with different science teams for the same data products should be supported in order to evaluate product accuracy as well as the strengths and weaknesses of varying algorithms.
-
Trends are difficult to evaluate owing to remaining calibration issues.
-
A collocated raob-radiance database should be maintained.
TROPOSPHERIC TEMPERATURES
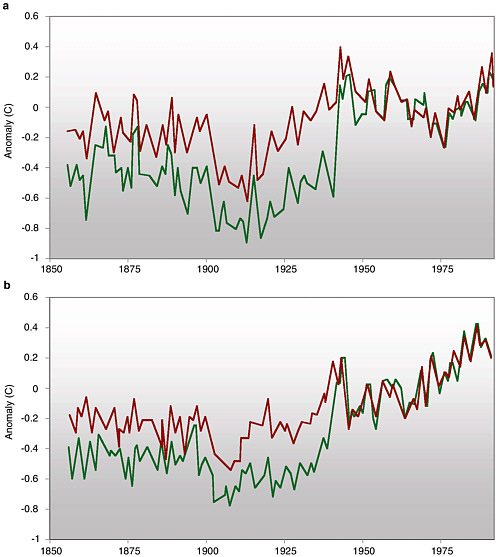
The possibility of inadvertent climate change prompted many analyses of historical weather data. Globally averaged surface temperature (combined
land surface air temperature and sea surface temperature), for instance, increased 0.4-0.8ºC since the late nineteenth century, with the most rapid warming (0.20 ± 0.06ºC decade-1) over the past 25 years (Figure 2-2). Upper air data, although available for only the last few decades, have also received increased scrutiny, including the radiances provided by the MSU instruments on NOAA polar-orbiting satellites since 1979. Global lower to middle tropospheric temperatures inferred from the MSU record exhibit considerably less warming than the surface record (Figure 2-2).
This situation, in which multiple trends with nonoverlapping error ranges for supposedly identical products were published in reputable journals, has resulted in considerable confusion to those not closely related to this area of research. This apparent discrepancy therefore motivated much recent research and debate (NRC, 2000d,e), and it is now clear that a number of factors likely contribute to the different trends. Among them are (1) the influence of real changes in the vertical structure of the atmosphere associated with both natural variability and human-induced climate change;

FIGURE 2-2 Annual mean anomalies of global average temperature (1979-2002) for the lower troposphere from satellites (T2) and for the surface. The MSU T2 products are University of Alabama Huntsville (UAH) 5.1 (Christy et al., 2003) and Remote Sensing System (RSS) (Mears et al., 2003). The surface temperature trend is +0.20 ± 0.06ºC decade−1. The linear trend through 2002 for the UAH (RSS) T2 product is 0.03 ± 0.09ºC decade−1 (0.11 ± 0.09ºC decade−1). The estimated 95 percent confidence intervals on the trends due strictly to measurement error are +/- 0.05ºC for UAH and +/- 0.02ºC for RSS.
(2) technical issues related to comparisons of global-mean temperature trends derived from different instrumental measurements with different physical, spatial, and temporal sampling characteristics; and (3) data uncertainties, as neither of these measurement systems was specifically designed for long-term climate monitoring (NRC, 1999b).
A chronic difficulty in creating a continuous, consistent climate record from satellite observations alone is that satellites and instruments have a finite lifetime of a few years and have to be replaced, and their orbits are not stable. Nine satellites, and the follow-on AMSU, compose the current operational record, and the methods of merging the data from these different satellites and channels are complex. Moreover, the satellite data record is continually evolving as newly discovered problems are accounted for and corrected.
NRC (2000d) provides a summary of the principal sources of uncertainty in trend estimates of MSU temperatures. They include systematic measurement errors, and, in particular, poorly understood problems with radiometer gain (the ratio of the perceived to the actual signal), which seriously impact the ability to intercalibrate the series of MSUs. During periods of overlap, which are sometimes far too short, temperatures measured by two different MSUs are compared, and offsets of 0.4ºC in magnitude are typical. Different adjustment methods to these offsets produce a spread in trends of about 0.1ºC decade-1. There is also uncertainty in determining each satellite’s bias relative to some reference value. Even in the absence of measurement errors, orbital decay (decrease in satellite altitude), orbital (diurnal) drift (change in the local time), and other effects have the potential to introduce spurious signals into the MSU temperature record. The effect of such uncertainties on trends is apparent in two independent MSU tropospheric temperature reconstructions (Figure 2-2), which differ by about 0.10ºC decade−1 over 1979-2002.
It is critically important to the climate community that assessments of the retrieval methodology and assumptions that are used to compute the MSU temperature record continue to be performed and documented. Additionally, different versions of the temperature time series need to be available in an easily accessible form.
Lessons Learned
-
The satellite data record is continually evolving as newly discovered problems are accounted for and adjusted, requiring reprocessing to attempt to create consistent and stable data records.
-
Systematic measurement errors are not constant in time—biases between instruments on different satellites change—and are thus difficult to remove, especially when overlap periods between satellites are short.
-
Adjustment methods different from these offsets can be rationalized, yet each method leads to different results/conclusions.
-
It is critically important that independent processing efforts of the radiance data have been performed. Through multiple independent efforts, important insights into the precision of the MSU temperature records are being obtained.
SATELLITE PRECIPITATION
Temperature and precipitation are the most fundamental elements in defining climate for a region, for the world, or for a specific time period. Temperature data are often more representative in time and space for a given observational network than precipitation data, and this has made it much more difficult to produce precipitation data representative of climate. The significant difficulty in measuring solid precipitation adds to the problem. However, long-term and broad-area averaging does allow for reasonable classification of climatic types and trends from gauge analyses for those areas with installed gauges.
Recent (over the last 10 years) development of satellite capabilities to retrieve data related to precipitation amounts over broad space and relatively long time periods have provided the opportunity to observe ungauged areas (especially key ocean areas for climate, such as the tropical western Pacific) and also provide global coverage (Figure 2-3). Understanding Earth’s global energy and water cycles and their variability and changes depends upon an accurate representation of precipitation and related latent heating profile.
The origin of satellite retrievals to estimate precipitation began in the late 1960s, and retrievals using visible, IR, microwave, and combination techniques have been developed with varying degrees of success. One important early algorithm that is still frequently applied uses the correlation between IR-based cloud-top temperature and precipitation for time and space scales of a day and 250 km or more. More recently (1987) Special Sensor Microwave/Imager (SSM/I) data permitted the estimation of precipitation using multiple microwave channels, providing a more accurate, but sparser global dataset. However, the microwave data are obtained from polar orbiters and thus have temporal sampling problems. Estimates from TOVS and Outgoing Long-wave Radiation (OLR) data provide estimates in snowy-surface regions, where both IR and microwave schemes fail.
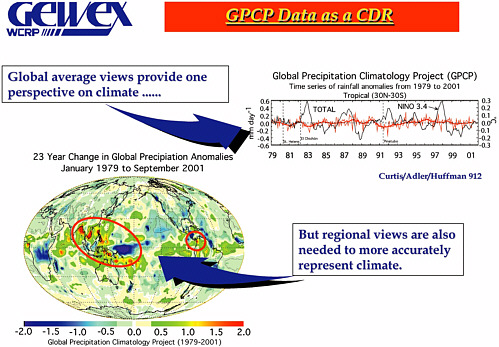
FIGURE 2-3 The Global Precipitation Climatology Project (GPCP) data highlight the importance of generating regional and globally averaged CDRs.
The other piece of the puzzle was the development of analyses to combine the various satellite estimates, and then merge in the rain gauge data into a homogeneous global dataset. This approach formed the basis for the international World Climate Research Programme (WCRP), the Global Energy and Water Cycle Experiment (GEWEX), Figure 2-3), and the Global Precipitation Climatology Project (GPCP) monthly 2.5 × 2.5º product. The GPCP has also encouraged other analysis procedures: 1 × 1º daily and pentad, and even working towards tri-hourly representations of precipitation. In each case spatial coverage requires the merging of multiple satellite datasets and uses in situ gauge data.
Most recently intercomparison and intercalibration with the Tropical Rainfall Measuring Mission (TRMM) satellite data has provided improve-
ments over the GPCP retrieval schemes, but these improvements have not yet been applied to harmonizing the various generations of satellite data over the 23-year record to provide the needed accuracy for water balance climate change trends.
Lessons Learned
-
Although the GPCP methodologies can be used to produce monthly 2.5 × 2.5º, daily 1 × 1º, and even tri-hourly 0.25 × 0.25º precipitation data, the random errors grow significantly larger as the scales become smaller.
-
Definitive characterization of bias error in regions lacking rain gauges, including oceanic and underdeveloped areas, is an unsolved problem and a matter of current research.
-
Random errors, and sometimes bias errors, are strongly dependent on the frequency of sampling by high-quality (e.g., microwave) sensors, particularly at fine scales.
-
Solid precipitation, high-latitude precipitation and precipitation over complex terrain remain extremely difficult to retrieve from satellite data. Gauge analyses face challenges in the same regions, when they are available at all, compounding the problem.
-
It is critical to have accurate in situ validation or reference data in a variety of climate regimes to facilitate the development and long-term quality assurance of reliable satellite-based precipitation estimates.
-
It is important to have as many accurate in situ observations as possible to provide the tie points that are critical to maximizing the accuracy of the final “best” combination products.
EARTH RADIATION BUDGET AND CLOUDS
Two closely related and overlapping sets of climate variables are required for characterizing clouds and quantifying Earth’s radiation budget. The radiation budget involves monitoring and understanding the fate of both solar radiation incident on the planet and terrestrial radiation emitted by it. Clouds play a major role in the radiation budget, contributing significantly both to the planetary albedo and to the greenhouse effect. In fact, uncertainties involving the role of clouds and cloud radiation feedbacks are centrally important to climate prediction on decade to century time scales. It has long been true that climate models differ by about a factor of three in their sensitivity to greenhouse gas concentrations, as measured by the “global warming” or equilibrium surface atmospheric temperature change
in response to doubling carbon dioxide. For these reasons CDRs concerned with clouds and Earth’s radiation budget are exceptionally important to climate research.
ERBE (Earth Radiation Budget Experiment) was an outstandingly successful program. It provided data on the spatial and temporal variability of quantities such as Earth’s albedo and emitted energy (Figure 2-4). It also documented the radiative effects of clouds and provided a definitive answer to a critical question: clouds both cool Earth by contributing to the planetary albedo and warm Earth by contributing to the greenhouse effect, but which effect dominates? ERBE proved quantitatively that the global-mean net radiative effect of Earth’s cloud cover is a significant cooling.
In the opinion of key participants an important factor in the success of ERBE was its small and dedicated science team. The foundation of that team was a group within NASA that claimed ownership of the project, augmented by some non-NASA scientists. Virtually all the team members were committed to the project and were focused on measuring two quantities,
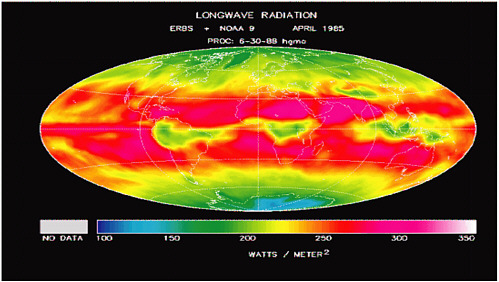
FIGURE 2-4 Outgoing longwave radiation from ERBE.
reflected shortwave and emitted longwave energy, with an accuracy that was unmatched at that time.
There was also a sustained effort undertaken by the science team to understand the behavior of the ERBE instrument. In ERBE, NASA supported the non-NASA science team members financially for up to 12 years; so long-term research was facilitated. ERBE also escaped the fate of having its research budget redirected to cover hardware cost overruns. NASA kept the ERBE science team budget separate from the hardware budget and protected it.
Two different but complementary approaches to observing clouds have been taken by the International Satellite Cloud Climatology Project (ISCCP) and by the Atmospheric Measurement Program (ARM). ISCCP is primarily a NASA-supported program, established in 1982, to collect and analyze satellite radiance measurements to infer the global distribution of clouds, their properties, and their diurnal, seasonal, and interannual variations. Data collection began in 1983 and continues to the present. The resulting datasets and analysis products have been used to improve understanding and modeling of the role of clouds in climate, with the primary focus being the effects of clouds on the radiation balance. ISCCP data are also used to support many other cloud-related studies, including several large projects aimed at an improved understanding of the hydrological cycle. ISCCP has devoted significant resources to data management. A Correlative Data Center coordinates the delivery of other satellite and conventional weather data. A Satellite Calibration Center normalizes the calibration of the geostationary satellites with respect to a polar orbiter satellite standard. All ISCCP data products are archived at an ISCCP Central Archive.
The ARM Program was begun in 1989 by the U.S. Department of Energy (DOE). ARM is part of DOE’s effort to resolve scientific uncertainties about global climate change with a specific goal to improve the performance of climate models used for climate research and prediction. The development of better parameterizations, derived from an observation-based improved understanding of the cloud radiation problem, is the focus of ARM. In pursuit of its goal ARM has established field research sites in several climatically significant locations. At these sites data on the effects and interactions of clouds and radiation have been obtained over extended periods of time from a wide variety of instruments. The most developed ARM site is the Southern Great Plains site, which straddles the Kansas-Oklahoma border. As in the case of ISCCP and ERBE the ARM data have been made widely available. Substantial resources have been devoted to data processing, analysis, quality control, and other necessary aspects of making large heterogeneous datasets useful to a broad range of scientists.
Lessons Learned
-
ERBE’s success is related to consistently sustained resources over a substantial period of time.
-
Participants outside the funding agency are extremely helpful.
-
Collaborative programs receptive to advice from all sources yield success.
-
A strong data management effort is important.
-
The science team can play a key role in directing the program.
-
Accurate calibration is essential.
VEGETATION DYNAMICS AND LAND COVER
NOAA currently produces an experimental product CDR termed “vegetation condition” from Polar Operational Environmental Satellite/ Advanced Very High Resolution Radiometer (POES-AVHRR) sensor data. This CDR contains two geophysical variables: the Normalized Difference Vegetation Index (NDVI) and the Drought Index. This product serves a host of useful purposes in various sectors of our economy and supports valuable science on monitoring vegetation state and activity.
Given that the AVHRR sensors were never meant for vegetation monitoring, the many uses of these sensors’ data in documenting the human impact on global vegetation is a tribute to the collective creative efforts of a large scientific community; it laid the foundation for continued study of vegetation from space with next-generation sensors, such as Earth Observation System/Moderate Resolution Imaging Spectroradiometer (EOS-MODIS), NPP, and NPOESS-VIIRS. The AVHRR data will remain the start and a first important segment of the data record for vegetation monitoring. At the present time this data record is unique and comprises a nearly 20-year global record at a spatial resolution of 8 km (Figure 2-5).
Lessons Learned
-
A clear outline of the various steps involved in the development of a CDR of vegetation activity is needed.
-
Algorithm developers and processing centers selected through peer review provide a mechanism to generate good products.
-
Research on unresolved problems should be targeted through announcements and committed funding with a view toward integrating such research into CDR production.
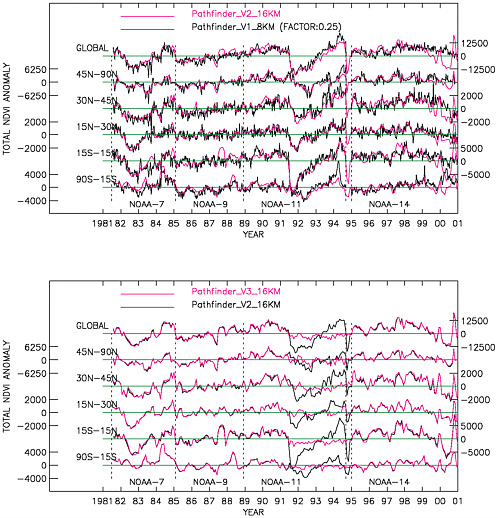
FIGURE 2-5 Vegetation index monthly anomaly time series for the period July 1981 to December 2000 for broad latitudinal bands and the globe (spatial resolution is 8 km2). The time series from the Pathfinder AVHRR Land is shown here as Version 1 (V1). The data from different AVHRR sensors on NOAA-series satellites are indicated. The original time series shows high frequency variations due to residual cloud cover. The impact of satellite drift is clearly noticeable, especially in the case of NOAA 11 and 14. Likewise, the impact of the Mt. Pinatubo eruption in June 1991 and El Chichon in March 1982 is also discernable. The break in data in late 1994 is filled in with data from NOAA 9. Successive corrections to the data by spatial and temporal compositing (V2) and through correlations with climate data (V3) alleviate some of these problems.
-
Archival of raw data at the highest possible resolution and accompanying detailed documentation of CDR algorithms are important for multiple reprocessing of data.
-
Uncertainty estimates for various steps in CDR production and at pixel levels are needed for overall uncertainty estimates.
-
Validation of algorithm physics and geophysical products through comparisons with in situ data must be performed.
-
Community acceptance of CDRs occurs by involving a broad segment of the scientific and applications communities.
NOAA SNOW MAP PRODUCT
The past three decades have seen the emergence of more accurate and complete information on the spatial extent and physical state of snow. This is leading to a better understanding of the variability of snow cover on annual to decadal scales, of cryosphere-climate interactions, and of the role snow may play in regional and global climate change. Snow data for these investigations come from a variety of satellite and in situ sources, including visible and microwave satellite products and point and snow course ground observations. Ultimately a blended snow product will best map the distribution, depth, and water equivalent, taking advantage of the strengths of each of the three sources of information.
Throughout the satellite era the premier dataset used to study snow extent on regional to hemispheric scales has long been the weekly visible wavelength satellite maps of Northern Hemisphere snow cover produced by NOAA (Figure 2-6). These maps constitute the longest satellite-derived environmental dataset available (Figure 2-7). This snow product is also unusual among satellite climate data records, as it involves a considerable ongoing manual effort to produce, and since its inception, has been produced in an operational mode for weather forecasting purposes.
The NOAA weekly snow map series began in late 1966. Since then, trained meteorologists have created maps in an operational weekly, and since 1999, daily mode. Mappers primarily relied on visual analyses of polar-orbiting satellite imagery to identify the location of snow cover across Northern Hemisphere lands. Secondary data sources included Geostationary Operational Environmental Satellites (GOES), Geostationary Meteorological Satellites (GMS), and Meteosat imagery. Map quality is predicated on the availability of clear sky visible imagery and the meteorologist’s experience. In June 1999, production of the weekly maps ceased, and were replaced with a daily Interactive Multisensor Snowmap (IMS) product. IMS maps
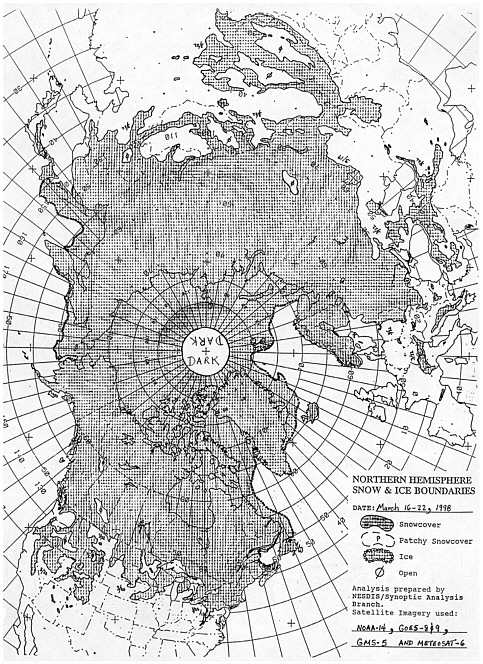
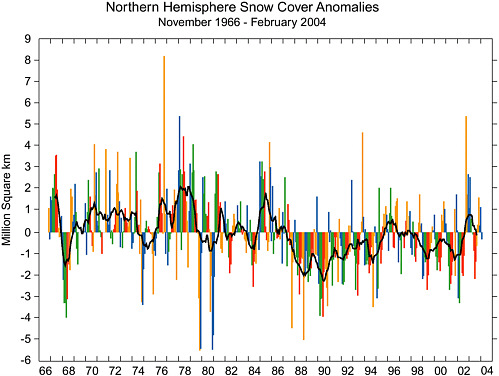
FIGURE 2-7 Anomalies of monthly snow cover extent over Northern Hemisphere lands (including Greenland) between November 1966 and February 2004. Also shown are 12-month running anomalies of hemispheric snow extent, plotted on the seventh month of a given interval. Anomalies are calculated from NOAA snow maps. Monthly anomalies are color coded by season: fall: orange; winter: blue; spring: green; summer: red.
still rely primarily on manual analyses of visible imagery, and are digitized to a 1024 × 1024 hemispheric grid, much finer than the 128 × 128 grid used previously.
An advisory board of climatologists from government, academic, and private sectors has yet to be appointed by NOAA to cooperate with the operational sector producing the maps. Despite this there have been some
beneficial ad hoc efforts that, for instance, fostered cooperation between the forecasting and climate communities during the transition from the weekly to daily product.
Lessons Learned
-
Gratitude is owed to early satellite scientists for developing the weekly snow map product, to NOAA meteorologists for maintaining product production since then, and to NOAA for supporting the two-year overlap of the former NOAA weekly and new daily IMS products.
-
Relying on the meteorology community as the primary driving force and production source of a climate data record has led to problems with data quality and continuity. The absence of sufficient metadata has led to delays in recognizing and correcting inconsistencies. Confidence limits and error margins have yet to be ascribed to the maps for any period of their existence.
SEA SURFACE TEMPERATURE
As one of the mostly widely observed oceanographic parameters, sea surface temperature (SST) had its humble beginnings as measurements of the temperature of a bucket of seawater sampled from a sailing vessel with mercury-in-glass. Over time, canvas buckets replaced the wooden buckets. This switch was reflected in the time series of SSTs, which shows a drop in temperature between the late 1890s and 1940 (Figure 2-8). Studies by the Hadley Centre in England revealed that this negative bias in the bucket SST measurements was caused by cooling characteristics of the canvas buckets that were different from the wooden buckets, which insulated the surface sample much better than the canvas buckets.
The transition from sailing ships to powered vessels saw an increase in ship speed that made it impractical to collect bucket samples, and it was decided instead to use the seawater collected to cool the engines. This had two important consequences; first, the intake of this cooling water was significantly below the sea surface being between 3 and 5 m deep, and second, the engine room where the temperature of this cooling water temperature was read was a very warm location on the ship. A consequence of this latter effect was a sharp increase in the SST measured with this method. This can be seen in the large jump in SSTs in Figure 2-8 after 1940, which covers the period of this change from bucket samples to ship cooling water temperatures called “ship injection” SSTs.
Ship SSTs remained the primary source of SST measurements until the early 1970s. At that time a number of infrared sensors, which measure skin temperatures rather than bulk temperatures, were operating on NOAA weather satellites. The first operational SST product from a satellite was based on measurements by the Scanning Radiometer (SR)—a cross track instrument with an 8 km resolution in a single 11 µm thermal infrared channel. Radiances of the SR were evaluated against ship SSTs to derive a linear transformation algorithm to compute SST from the satellite data.
This was followed by the AVHRR, which became a standard of SST measurement from satellites. Most of these SST applications required in situ SST measurements originally from ships but later from drifting and moored buoys emphasizing the need for both satellite and in situ measurements. Recently the availability of passive microwave sensors, which measure temperature in approximately the top centimeter of the ocean, for the computation of SST has demonstrated a clear capability to sense SST through clouds and atmospheric water vapour. Since temperature measurements differ based on the recording instrument, new algorithms are being developed to blend thermal infrared and passive microwave satellite measurements of SST and relate them to in situ SST measurements.
Lessons Learned
-
Sea surface temperature measurements have evolved dramatically in the past 200 years. It is possible to extend the time series back in time by taking into account the observational methods of the past and correcting the data for these methods.
-
Satellite SST is fundamentally different from in situ SST, and this difference has largely been ignored in the computation of routine SST products during the past two decades.
-
New methods are being developed to mix thermal infrared and passive microwave satellite measurements of SST and to relate them to in situ measurements of SST.
-
The definition of an SST product as a CDR is based on community use and application.
-
New SST products will be defined and calculated in the near future and many of these may find wider acceptance as CDRs. This process depends on the people generating the products and quantifying the biases and errors, and their ability to communicate the value of their product and the interest of the user community.
OCEAN COLOR
In many respects ocean color is the marine analog to vegetation dynamics and land cover, and it is motivated by similar concerns. Marine phytoplankton accounts for approximately half of the global annual primary production, and thus plays a significant role in the global carbon cycle. There are many reasons to expect that climate change could affect phytoplankton productivity: through changes in ocean circulation, temperature, atmospheric deposition of iron-rich dust, and surface irradiance, to name a few. Because of their fast turnover rates, phytoplankton have the potential to affect carbon uptake and release much faster than terrestrial vegetation. Thus, it is as important to monitor phytoplankton as it is to monitor vegetation dynamics on land.
Satellite measurements of phytoplankton biomass are based on the effect that phytoplankton pigments have on the color of the water. The most widely used product derived from ocean color measurements is chlorophyll concentration (mg m−3), a measure of phytoplankton biomass. Ocean color remote sensing has been a successful area of technological development since the Coastal Zone Color Scanner (CZCS), a proof-of-concept sensor launched in 1978 onboard Nimbus 7. The CZCS operated for eight years but had a limited duty cycle (operating only 10 percent of the time), thus its coverage was spotty. Its calibration was suspected of drifting during the mission, but there were no means to calibrate the sensor in orbit. It is therefore not possible to determine trends from the eight-year CZCS record. There was a gap of 10 years before the next ocean color sensor, the Ocean Color and Temperature Sensor (OCTS), launched onboard the Japanese Advanced Earth Observing Satellite (ADEOS) satellite. The U.S. launched the Sea-viewing Wide Field-of-View Sensor (SeaWiFS) on the Orbview 2 satellite in August 1997.
SeaWiFS has collected ocean color data since September 1997, and continues to produce global products that are the best examples of climate-quality ocean color data currently in existence. MODIS, onboard Terra and Aqua, also provides ocean color data products. Both MODIS and SeaWiFS require a regular program of vicarious calibration whereby atmospherically corrected satellite radiances are compared with in situ water-leaving radiances. Adjustments are then made to the satellite top-of-atmosphere radiance calibrations to force agreement. SeaWiFS has remained remarkably stable, requiring only one postlaunch adjustment, whereas the MODIS on Terra has experienced a number of abrupt (and in some cases unexplained) changes in its radiometric calibration.
Algorithms for atmospheric correction and for deriving such water properties as chlorophyll concentration have evolved significantly since the CZCS era. Each ocean color mission now uses a different algorithm for chlorophyll, and in fact, MODIS has produced three products that are called “chlorophyll.” Figure 2-9 illustrates differences among the chlorophyll products produced by the various algorithms.
In 1997 NASA initiated the Satellite Intercomparison and Merger for Biological and Interdisciplinary Ocean Science (SIMBIOS) program to address the problem of merging ocean color data into a seamless time series. This project supported an extensive validation effort (primarily in situ measurements made throughout the world’s oceans). There were also investiga-
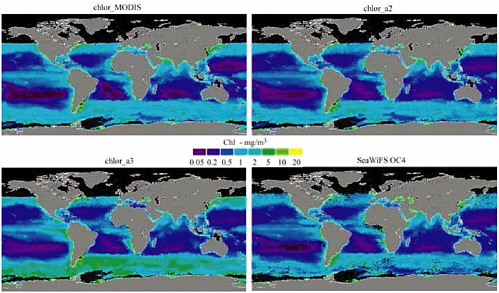
FIGURE 2-9 Comparison of MODIS and SeaWiFS chlorophyll products for December 2000. Images depict the monthly average chlorophyll concentration based on four different algorithms; chlor_MODIS, chlor_a2, and chlor_a3 are MODIS algorithms. The chlor_a2 algorithm is designed to be similar to the SeaWiFS OC4 algorithm. Chlorophyll concentration (mg m−3) is a measure of phytoplankton biomass produced by ocean color sensors.
tors supported to define strategies for merging data from difference sensors. The SIMBIOS project represents a model for generating one class of FCDRs and an associated family of derived TCDRs.
Ocean color FCDRs are the calibrated radiances derived by ocean color sensors together with the supporting in situ data used to calibrate the radiances. The Marine Optical Buoy (MOBY) located off Lanai, Hawaii, is currently used by several ocean color missions (U.S., Europe, and Japan) for vicarious calibration.
Lessons Learned
-
Algorithms will change over time but will always rely on carefully calibrated, top-of-atmosphere radiances. It is most important to assure that the top-of-atmosphere radiances are well calibrated, geolocated, and preserved for future generations.
-
Ocean color radiance data will require an ongoing program of vicarious calibration whereby radiances are compared with in situ measurements.
-
It is better to produce a modest number of ocean color variables (e.g., chlorophyll, colored dissolved organic material, suspended sediment) that enjoy wide acceptance than to create a large number of variables that have no community support.
-
Input from the science community regarding data quality and ways to improve the quality can be received at yearly workshops. Special workshops can be held to select consensus algorithms for producing the CDRs.
SEA ICE
Sea ice time series derived from multichannel passive microwave data are among the most consistent and longest continuous satellite-derived geophysical records, extending almost three decades. Data from passive microwave radiometers have been available since December 1972 with the launch of the Nimbus 5 Electrically Scanning Microwave Radiometer (ESMR). In 1978 the Scanning Multichannel Microwave Radiometer (SMMR) operated onboard Nimbus 7 and provided data until 1987, followed by the successive Defense Meteorological Satellite Program Special Sensor Microwave/ Imager (DMSP SSM/I) sensors. The Advanced Microwave Scanning Radiometer (AMSR) will continue this relatively long history of polar remote sensing. The greater spatial resolution, additional spectral channels, and enhanced system performance of AMSR will further contribute to polar studies through the generation of improved and additional polar ocean products.
Among the many sea ice variables derived from satellite passive microwave imagery, ice extent (the area within the ice-ocean margin) is the one parameter whose variability and trends are most firmly established (Figure 2-10). Two of the most widely used passive microwave sea ice
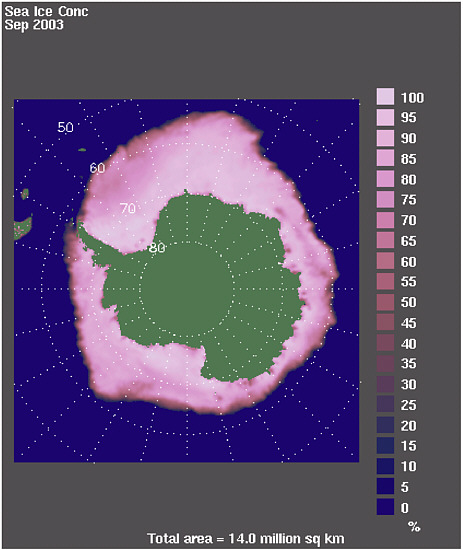
FIGURE 2-10 Mean September 2003 sea ice concentration in the Southern Ocean around Antarctica, based on satellite passive microwave data. SOURCE: Courtesy Ken Knowles, University of Colorado.
algorithms are the NASA Team (NT) and the Bootstrap (BS) algorithms. An enhancement of the NT sea ice algorithm, called NT2, was recently developed and helps overcome the problem of low ice concentration biases associated with surface snow effects that are particularly apparent in the Southern Ocean.
All the sea ice algorithms however suffer when melt ponds form on the sea ice, as the flooded floes appear as open water to the passive microwave instrument. Thus, false underestimation of ice concentration can be expected during summer melt, although in terms of albedo and heat fluxes, the passive microwave estimate may be more meaningful. In addition, special “weather” filters and land and ocean boundary filters are typically applied to the passive microwave data to avoid false ice as a result of weather and the spill over effects of the land in coastal regions of a geographic mask.
Analysis based on SMMR data found a slight negative trend in Arctic sea ice extent from 1978 to 1987 (2.4 percent per decade). Data from the subsequent SSM/I has provided the basis to follow up the SMMR trends and has revealed a greater reduction in Arctic sea ice area and extent during the SSM/I period: decreases from 1987 to 1994 were ~4 percent per decade compared with ~2.5 percent per decade from 1978 to 1987. Large interannual variability, coupled with the brevity of the individual SMMR and SSM/I records, compelled researchers to produce longer time series for more robust trend estimation.
The merging of SMMR and SSM/I data involves satellite intercomparison and radiometric adjustments based on the six-week overlap period in 1987 when both sensors operated. Two independent analyses of merged SMMR– SSM/I data established the trend in arctic ice area and extent (1978-1995) to be about −3.0 × 10⁵ km2 per decade, corresponding to ~3 percent per decade. The consensus is that the annual sea ice extent in the Northern Hemisphere has shown a steady decline of ~3 percent per decade from the late 1970s to the late 1990s. Overall, the Southern Hemisphere shows a slightly positive trend of 0.17 percent per decade (1978-2000), although the trend is insignificant. Because the overlap period between the various sensors (e.g., SMMR, SSM/I) is at times only one month, the error due to changes in sensor characteristics, calibration, and thresholds for the 15 percent ice edge may be significant.
Lessons Learned
-
The algorithms developed for SMMR at NASA Goddard Space Flight Center and SMMR products were only transferred to the National Snow and
-
Ice Data Center more than halfway through the Nimbus 7 mission, limiting their climate value.
-
Early planning for the transition to sea ice products from SMMR to SSM/I is crucial for satellite intercomparisons and for creating more reliable records.
-
SMMR ice extent and concentration products and SMMR-SSM/I gridded brightness temperatures were designated as Polar Pathfinders. This funding was crucial to the development, release, and distribution of a time series of sea ice data.
-
The Polar Distributed Active Archive Center (DAAC) User Working Group (PODAG) provided valuable oversight and guidance to the NSIDC in the planning and implementation of sea ice products from its inception in 1991 to the present with 20 meetings held to date.
-
There are several standard algorithms for deriving sea ice concentration, and no single algorithm is “best” for all user communities.
SUMMARY OF LESSONS LEARNED
The preceding examples were examined to identify redundancies and develop a set of lessons learned that represent the combined wisdom gained in all of these earlier projects. In summary, the committee finds 12 attributes that contributed to the success of these examples:
-
CDRs must be accepted by the community. This is the most fundamental characteristic of a CDR. This acceptance is evaluated after a period of community use to correct unforeseen problems, identify new applications, and apply algorithm improvements.
-
Long-term funding for CDR production is required. This is a need common to all CDR activities, and it is clear that without stable funding it is impossible for a CDR to be created or sustained long enough to be of value. Historically this funding has come from a variety of sources; but insofar as federal agencies are concerned, NASA and NOAA have funded these types of data analyses.
-
Science advisory review provides critical oversight. Without science input it is difficult to create or identify a CDR and to maintain its production and utilization.
-
User workshops allow broad community input. One method for generating user input is by initiating workshops.
-
Long-term trends are often unreliable because of input changes, calibration errors, algorithm evolution, and instrument changes. Again,
-
science guidance is needed to assess errors in long-term time series and correct or compensate for physical changes in long time series.
-
CDR stewardship is needed throughout the entire process. A critical requirement is that the science overview and involvement is end-to-end and that oversight will be needed continuously for the duration of the period to ensure that the CDR is generated and maintained.
-
Reprocessing and reanalysis is an ongoing activity. The development of a CDR is often an evolutionary process and repeated reprocessing of the entire input dataset is often necessary. The CDR algorithm will change over time as measurement hardware and software and understanding of the measurement process evolve.
-
Raw data must be archived. The reprocessing requirement for satellite data means that the raw satellite data must be archived for future reprocessing.
-
Multiple, independent processing can provide important insights into the CDR. Multiple efforts provide information on the precision of a CDR, and biases based on one processing method may not be obvious without comparison with other independent methods.
-
Data management and oversight are critical components of a successful program. CDR datasets should be managed in a way that allows easy, meaningful access by users of varying technical sophistication. Web access could include browse images, read software, subsetting tools, and online plotting
-
Validation and overlap of successive satellite missions is critical for developing consistent CDRs over time. Satellite measurements are by their very nature “remote” and thus in situ observations are needed to validate remotely sensed data and monitor sensor degradation, while overlap is needed to reduce satellite biases
-
Orbital and instrument decay need correction for consistent long-term CDRs. Another source of change that requires in situ validation measurements is caused by orbital and instrument degradation decay. This can change the atmospheric path length for each instrument, alter the Sun-Earth sampling geometry, or introduce aliasing of the diurnal cycle.


