
6
Current Costs, Funding, and Organizational Structures
The previous chapter describes the primary activities of poison control centers in the United States as well as the staffing, financial, and operational characteristics of these centers. The purpose of this chapter is to examine the costs and organizational structures of these centers in an effort to identify those characteristics that contribute to efficient operation and service delivery.
An earlier study of these factors was conducted in 1997 by Zuvekas et al. in response to a set of recommendations from the Poison Control Center Advisory Work Group (1996). The study’s purpose was to identify approaches to more efficient service delivery. The methods included six in-depth case studies examining the time and costs associated with poison control center activities and a written survey mailed to all 75 centers that posed a series of general questions regarding size, location, activities, and organizational affiliations. The results showed that the majority of staff time and expense, regardless of center size or penetrance, was associated with providing telephone advice to the public and health care professionals. Their analysis of costs is discussed later in this chapter (see potential economies of scale).
The major recommendations were based on the use of communication technology to link the centers, thereby more effectively distributing the calls across them and allowing for consolidation. It was estimated that 50 centers might be a target number based on the reasoning that some small centers might be easily combined; technology would allow more efficient communication; and funding by the states might be more easily
stabilized. No data were presented to directly support the recommendation for 50 poison prevention and control centers. Furthermore, no recommendations were presented regarding specific internal organizational structures, modes of operation, or the need to develop service quality measures. Finally, it was outside the scope of the study to compare the cost of poison control center service delivery with other delivery mechanisms such as emergency departments.
The data and analysis presented in this chapter are an effort to further explore and clarify these issues. The first section of this chapter focuses on a review of the economic evaluations of services delivered by poison control centers and the direct and indirect cost savings gained by using them. The second section describes the staffing and operational characteristics of centers, evaluates their economies of scale, and compares their organizational characteristics that exhibit contrasting values on size and efficiency.
In conducting these analyses, we used a variety of data sources, including the Toxic Exposure Surveillance System (TESS); nonaudited, self-reported survey data provided by the American Association of Poison Control Centers (AAPCC); statistical analysis of secondary data to explain variation in efficiency of poison control centers; and an analysis of qualitative interview data obtained from a sample of 10 poison control centers. These centers were a stratified, nonprobability sample based on cost per human exposure call handled in 2001, population served, and penetrance.
COST-EFFECTIVENESS AND COST-BENEFIT ANALYSES
While poison control centers perform a number of activities (see Chapter 5), as Phillips and colleagues state: “The primary benefit of poison control centers is that they provide advice that allows poisonings to be appropriately handled at home or triaged to a health care facility, thereby avoiding unnecessary visits to health care facilities or inappropriate and potentially harmful home treatments.” They also serve as a free resource for those without primary care or with limited access to primary care. In 2002, Watson et al. (2003), using TESS data, found that public calls to a poison control center were managed in a non-health-care facility—usually in the patient’s home (74 percent); were treated in a health care facility (23 percent); and were referred to a health care facility but the patient did not go (2 percent). Indeed, it is the benefits of this triage role, as well as better health outcomes from the center’s interfacing with emergency departments, that are the focus of the peer-reviewed literature on economic costs.
A number of published studies provide cost-effectiveness and cost-
benefit analyses of various aspects of the poison control center system and some take account of the potential morbidity and mortality benefits.1 In many of these, the lack of necessary or appropriate data presents a challenge. Nonetheless, taken as a whole, this literature makes a convincing case that, at least in terms of treatment management guidance for the public, poison control centers save the health care system economic resources and save members of the public time, lost wages, and anxiety. Indeed, the literature supports the proposition that for every dollar spent on treatment management activities, multiple dollars are saved by the health care system as a whole. These studies do not examine the cost-effectiveness among poison control centers, but rather compare the centers with other health care providers such as emergency departments.
The focus of the published literature on the economics of poison control centers also accords with the fact that treatment management guidance is the dominant activity of centers in terms of expenditures, representing on average some 70 percent of those expenditures (Zuvekas et al., 1997). Still, insofar as the peer-reviewed literature on economic costs has examined only their role in treatment management guidance responding to direct calls from the public, conclusions about the cost-effectiveness of other center activities are not available, including providing consultation for patients in intensive care units.
One instructive study of the cost-effectiveness of poison control centers is King and Palmisano (1991). Louisiana discontinued its center during the late 1980s; King and colleagues analyzed a natural experiment based on the resultant experiences. The researchers compared various outcomes during the discontinuance of the center to the period just before the discontinuance, as well as to the outcomes in neighboring Alabama during the period of Louisiana’s discontinued service (a period during which the poison control center service in Alabama remained). During the discontinuance, it was estimated that self-referrals to the emergency department increased by a factor of more than fourfold and the number of home management cases declined to less than half. Before the closure of the Louisiana poison control center, the triage patterns in Alabama and Louisiana were nearly identical. During the closure, the rates of poison-
ing self-referrals to the emergency department in Alabama did not increase.
The projected incremental costs to Louisiana during the discontinuance of excess health care facilities visits were estimated at $1.4 million. This can be compared with the $400,000 in savings to the state from closing its center. In short, had the state spent the $400,000 to keep its poison control center open, it would have saved the system $1.4 million, for a net savings of $1 million. Phrased differently, this implies a savings to the health care system of more than $3 for every dollar invested in the center. This is an underestimate of the benefits of the poison control center insofar as it does not take into account a reduction in mortality and morbidity, or in anxiety and time to the public.
Phillips et al. (1998) used the results of another “natural experiment” to examine cost savings of poison control centers. Between 1993 and 1994, a single county in California lost funding for its center. Public callers to the center received a recorded announcement advising them to dial 911 for poisoning exposures and information. If they called 911, they were patched into a neighboring poison control center to which they had prior direct access. An analysis was done of individuals who called the center during this interruption of service compared with a matched set who called subsequently after service was resumed. The outcomes during the period of blockage were substantially different than during the control period, even though the disruption did not involve lack of access to the center, but only patching into one through 911. Fourteen percent of callers with restricted access were treated in an inappropriate location (e.g., treated by an emergency department when they might have been managed at home), compared with 2 percent who had direct access to a poison control center. In a further analysis of the costs associated with the same blocked-caller episode, it was found that restricting access resulted in an additional $10.98 per case in net societal costs (all costs and benefits, including patient time and transportation and marginal costs for resources used as a result of the block) and an additional $33.14 per case in health care purchaser costs (Olson et al., 1999).
Harrison et al. (1996), in one of the most thorough of the existing analyses, adopted a decision theoretic analysis to evaluate treatment management guidance for the public. In addition to secondary data on costs such as emergency department visits, ambulances, and other factors, Harrison and colleagues used data assembled from an expert panel of toxicologists to estimate probabilities of morbidity outcomes, mortality outcomes, and adverse treatment impacts of cases coming into an emergency department. Thus the researchers were able to consider not only differences in direct costs to the health care system, but also differences in morbidity and mortality due to the provision of poison control center
services. They did this in the context of four typical poison exposures (e.g., acute cough or cold preparation overdose in children younger than 13 years of age).
For cough or cold preparation overdose, they concluded that when calls go through a poison control center first, the costs per case average $414 (in 1995 dollars), with a probability of .004 of morbidity and .000006 of mortality. In contrast, without a poison control center, the costs per case are $664, with a probability of .01 of morbidity and .00002 of mortality. The authors concluded that for cold preparation overdoses, and under the assumptions of their model, poison control centers lead to lower costs to the health care system and better outcomes in terms of morbidity and mortality. The cost savings result both from the centers triaging visits to the emergency departments and from the cost savings associated with better health outcomes for those cases going to the emergency departments that have already gone through the centers. These cost savings amount to an average of $250 per case ($664 minus $414). This compares with a cost per call to the poison control center in the $25-to-$30 range (Zuvekas et al., 1997).
Applying the same methodology to acetaminophen overdoses, the cost savings are $343 per case. For antidepressant overdoses, the cost savings are estimated to be $347 per case. For a standard cleaning substance exposure in children, the cost savings are estimated to be an average of $297 per case. In each of these cases as well, each dollar of poison control center expenditure on treatment management guidance results in a cost savings to the health care system of $10 or more. This is a lower bound estimate insofar as it does not take into account the benefits of poison control centers in terms of time and anxiety to the public, nor to their substantial positive impact on morbidity and mortality outcomes.
Miller and Lestina (1997) provided an analysis of cost savings from poison control centers that has been widely cited in legislation, congressional testimony, and many popular venues. It concluded that for every dollar invested in poison control centers, there are savings of about $6.50 to the health care system as a whole. While this magnitude of cost savings is not wildly different from other convincing analyses, there are significant limitations to the Miller and Lestina analysis.
Miller and Lestina estimated that the total societal costs of poisonings would be reduced from $3,315 million if there were no poison control centers to $2,905 million if the whole population of the country had access to a center, a savings of $310 million. They compared this with the cost of centers, which they indicated to be between $60 and $80 million. These data form the basis of their conclusion that there is a 6.5-to-1 cost savings for each dollar invested in poison control centers.
The $390 million in savings, an amount greater than Miller and
Lestina’s total estimate of net savings, comes from increased costs of hospitalization. One assumption that leads to these savings is problematic. This assumption concerns individuals who, had there been a poison control center, would have been treated at home but, absent a center, go to the emergency department. It is assumed that these individuals will have the same probability of hospitalization and the same hospitalization costs as experienced by the whole population of individuals who are hospitalized for poisoning. If this assumption is not valid, the resulting analysis will overestimate the savings attributable to poison control centers.
On the other hand, there are some cost-saving features of poison control center systems not taken into account by Miller and Lestina. For example, Miller and Lestina used total center costs (e.g., including education), not costs associated with telephone-based case management. Also, better health outcomes for cases that did need to go to the emergency department (e.g., Harrison et al., 1996) were not taken into account. Thus, while the widely quoted figure from Miller and Lestina (1997) of a 6.5-to-1 cost savings for investments in poison control centers is not outside the bounds found in other studies, their methodology makes their particular conclusion problematic.
All of the above analyses focus on tangible cost savings associated with poison control centers. In such analyses, intangible psychological benefits to the public of such centers are not considered. Yet parents and caregivers often experience lowered levels of anxiety if they are able to call the centers and be reassured, when warranted, that a trip an emergency department is not necessary, and they are subsequently advised about how to treat the situation at home. There is also the comfort of knowing that this service exists even if one does not use it. These intangible benefits are hard to quantify.
One study that considers these psychological benefits is Phillips et al. (1997). The researchers asked individuals who had called a poison control center and members of the public what they would be willing to pay to have a center to which they could have access. A wide range of methodological concerns can be raised about hypothetical answers to willingness to pay that are given by members of the public without the benefit of deep reflection and thoughtful calculation of intangible and tangible benefits; nonetheless, the results are informative. For those who had called a poison control center, the average willingness to pay to have a center was $6 to $7 per month, or $72 to $84 per year; for members of the public, the results were an average of $2.55 per month, or about $30 per year. The willingness to pay these figures can be compared with the actual cost per person in service area of a treatment management guidance function, which Zuvekas et al. (1997) estimated to range from 22 to 58 cents per year. Thus, Phillips and colleagues (1997) found a difference of at least 50
to 1 between the lower estimate of willingness to pay and the upper estimate of cost incurred. Again, this provides additional evidence of the benefits of poison control centers compared with their cost.
CURRENT COSTS, ORGANIZATION, AND STAFFING
While the previous review of the existing literature suggests cost savings resulting from the activities of poison control centers, the samples on which many of these studies are based are limited and may not represent the population of centers as a whole. Furthermore, this literature does not attempt to account for potential variation in operating efficiency of centers or explain the sources of that variability. Below we analyze available data from AAPCC to address these issues. Because these data were collected for other purposes and are largely self-reported by the individual poison control centers, they are not ideally suited to such an analysis. However, given the paucity of research in the area of center operations and financial performance, even these limited data can provide valuable additional information and help inform recommendations relating to their size, structure, and consolidation. Results of these analyses may also highlight potentially important organizational or policy issues that require further investigation with better data and more rigorous research methods.
Preliminary Characterization
This section provides a description of the population of poison control centers in terms of their staffing, population served, revenue sources, and other operating characteristics. In 2001 (American Association of Poison Control Centers, 2002b) there were 65 poison control centers, located in 42 states plus the District of Columbia. The number of centers located in each state ranged from zero (Alaska, Idaho, Montana, Nevada, Rhode Island, South Dakota, and Vermont) to six (Texas).2 Regional distribution of poison control centers in the United States is depicted in Figure 6-1. The majority of centers are located in the South, while the remainder are distributed roughly evenly among the Northeast, Midwest, and West. Most poison control centers were certified by the AAPCC (N = 51; 78 percent). Descriptive data from the AAPCC survey administered to the poison control centers in 2001 shows the following characteristics (see Table 6-1 for the mean, range, and standard deviation of each characteristic3).
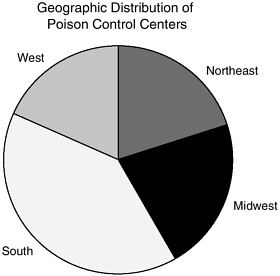
FIGURE 6-1 Geographic distribution of poison control centers.
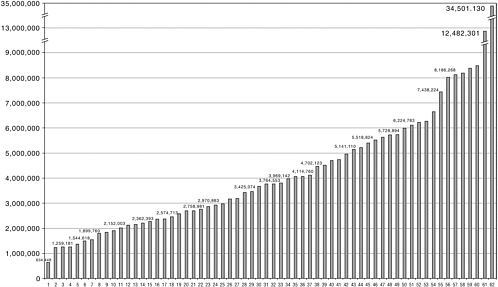
Population Served and Call Volume
Figure 6-2 shows the distribution of population size served across all poison control centers. As can be seen from the figure, the size ranges from 634,000 to nearly 35 million. Because the largest poison control center is California’s, which operates as a four-region poison control system, average population size served by centers may be highly skewed; therefore, the median population served of 3.8 million is probably a better indicator of the average for all poison control centers. Centers handle three types of calls: human exposure, information, and animal exposure. Total call volume for human exposure and information calls combined averaged 55,687 per center in 2001, although there was great variability from center to center (range 4,716 to 300,321).
Staffing
The majority of poison control centers (92 percent) had 24-hour staffing by specialists in poison information (SPIs). Compared with SPIs and certified specialists in poison information (CSPIs), poison information providers (PIPs) made up a small proportion of the center staff (8 percent on average, range 0 to 67 percent). PIPs tend to have different backgrounds and have less training than SPIs or CSPIs. They are typically drawn from
TABLE 6-1 General Characteristics of Poison Control Centers
|
|
N |
Median |
Mean |
Standard Deviation |
Minimum |
Maximum |
|
Population Served |
62 |
3,765,293 |
4,593,562 |
4,492,049 |
634,448 |
34,501,130 |
|
Calls: |
||||||
|
Human poison exposure calls |
62 |
31,514 |
37,155 |
31,125 |
3,150 |
230,438 |
|
Information calls |
62 |
11,928 |
16,569 |
13,066 |
1,491 |
62,003 |
|
Animal poison exposure calls |
62 |
1,043 |
1,850 |
2,380 |
0 |
12,118 |
|
Nonexposure calls |
62 |
89 |
117.7 |
97.23 |
0 |
450.0 |
|
All calls |
62 |
47,272 |
55,687 |
41,767 |
4,716 |
300,321 |
|
Human exposure calls: % total calls |
62 |
68.5% |
66% |
11.2% |
37.7% |
88.% |
|
Penetrance: |
||||||
|
Human exposure calls per 1,000 population |
62 |
8.291 |
8.611 |
2.502 |
4.946 |
16.79 |
|
Staffing: |
||||||
|
Managing director full-time equivalents (FTEs) |
61 |
1.00 |
0.971 |
0.455 |
0 |
3.500 |
|
FTEs of medical director funded |
62 |
.50 |
0.667 |
0.498 |
0 |
3.150 |
|
FTEs of medical director |
62 |
.60 |
0.751 |
0.559 |
0.0125 |
3.500 |
|
FTEs: Administrative staff |
62 |
2.00 |
2.100 |
1.976 |
0 |
10.73 |
|
Health educator FTEs |
62 |
1.00 |
1.151 |
1.048 |
0 |
7.500 |
|
Total PIP and CSPI/ SPI FTEs |
62 |
9.85 |
10.94 |
7.511 |
0 |
55.90 |
|
Total PIP FTEs |
62 |
0 |
1.060 |
2.366 |
0 |
14.50 |
|
Total CSPI plus SPI FTEs |
62 |
9.30 |
9.877 |
5.915 |
0 |
41.40 |
|
FTEs: SPI plus CSPI : % total FTE |
61 |
100.0% |
91.8% |
15.5% |
33.3% |
100.0% |
|
Expenses: |
||||||
|
Total expenses |
61 |
1.2E6 |
1.38E6 |
968,595 |
116,579 |
6.89E6 |
|
Personnel expenses |
61 |
1.0E6 |
1.1E6 |
775,509 |
101,579 |
5.7E6 |
|
All nonpersonnel expenses |
61 |
181,071 |
276.431 |
254,894 |
15,000 |
1.05E6 |
|
Expenses per 1,000 population |
61 |
303.2 |
336.8 |
131.9 |
82.76 |
723.8 |
|
|
N |
Median |
Mean |
Standard Deviation |
Minimum |
Maximum |
|
Expenses per human exposure calla |
61 |
37.18 |
39.98 |
13.54 |
13.72 |
76.78 |
|
Expenses per call (all) |
61 |
24.83 |
26.31 |
8.509 |
9.222 |
54.00 |
|
Personnel expenses per 1,000 population |
61 |
257.1 |
272.8 |
112.7 |
70.60 |
605.0 |
|
Personnel expenses per human exposure call |
61 |
30.81 |
32.15 |
11.08 |
11.71 |
65.29 |
|
Personnel expenses all calls |
61 |
20.82 |
21.23 |
7.124 |
7.868 |
42.09 |
|
Nonpersonnel expenses per 1,000 population |
61 |
55.82 |
63.99 |
39.64 |
3.303 |
183.7 |
|
Nonpersonnel expenses per human exposure call |
61 |
7.11 |
7.834 |
5.076 |
0.661 |
23.20 |
|
Nonpersonnel expenses all calls |
61 |
4.52 |
5.083 |
3.256 |
0.454 |
15.83 |
|
Total revenue |
61 |
1.2E6 |
1.4E6 |
1.02E6 |
116,579 |
7.07E6 |
|
aIncludes industry calls which represent less than 1 percent. SOURCE: American Association of Poison Control Centers, 2001 Survey (2002a). |
||||||
non-health-services backgrounds and, like SPIs, they are not certified in poison information. One poison control center (North Dakota) had neither SPIs nor PIPs, although they did field 4,641 calls from a population of 634,448.
The median number of health educator full-time equivalents (FTEs) was 1 (mean 1.1, range 0 to 7.5); 4 centers (6 percent) had no health educators; and 17 (29 percent) had more than one health educator FTE. There was usually a managing director (average FTE 0.97, median 1.0, range 0 to 2) and a medical director (average funded medical director FTE 0.67, median 0.5, range 0 to 3.1). In nine poison control centers (14 percent), the managing director was also the medical director. Two poison control centers had no managing director and four had no medical director. While most (77 percent) poison control centers had one or more administrative staff FTEs (mean 2.1, range 0 to 10.7), seven centers (11 percent) had none. The median number of FTEs for administrative staff was two.
Funding and Expenses
Reported revenues received ranged from a low of $116,000 to a high of $7.07 million4 (median $1.27 million, mean $1.40 million). As Table 6-2 (http://www.aapcc/org/surveyresults2001.htm) indicates, the funding of poison control centers is fragmented. Across the states there are more than 30 separate funding sources. Approximately 6 percent of total poison control center funding comes from federal and state Medicaid programs; 3 percent from federal block grants; and 8 percent from other federal programs, for a total of 17 percent from federally associated programs. Approximately 44 percent of total funding comes from states, with many different approaches to state funding, ranging from line-item appropriation to state-funded universities to telephone surcharges. Hospitals represent 15 percent of total funding (either as host institutions or network members). Another 3 percent of funding comes from a wide range of donations and grant sources and 20 percent from myriad other sources, some of which are itemized in Table 6-2.
This fragmented pattern of funding is evident within as well as among states. The mean number of funders per center is 5.5 (mean 5.5, SD 2.7, range 2–12). In most cases, the three top funding sources provided the bulk of the funding (proportion derived from the top three funders ranged from 57 to 100 percent, with a mean of 91 percent).
Because of the lack of regular funding sources, poison control centers report that significant time is spent raising revenues and that there has been substantial instability in funding. As financial pressures on state governments and health systems have risen, the willingness of traditional funders to continue to provide revenues has diminished, leaving many centers facing great uncertainty, budget pressures, and cutbacks.
For example, in the past year, two centers have been forced to close due to changing priorities and budget cuts. Furthermore, at least one center lost its institutional funding and spent several months convincing the state to provide the needed support; during this time center staff were operating under extreme uncertainty and much program planning was suspended.
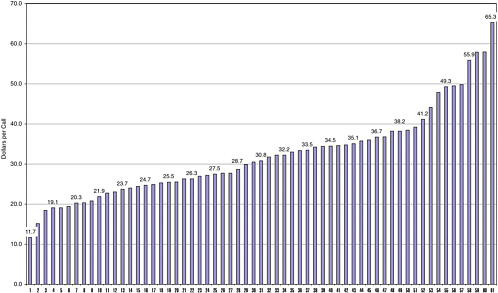
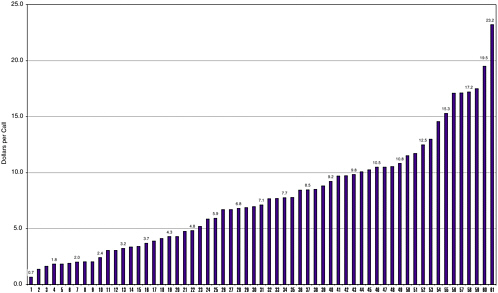
Total expenses for personnel plus telecommunications and equipment costs averaged $1.38 million (range $117,000 to $6.89 million in 2001 dollars). In terms of personnel costs, expenses ran about $40 per human exposure call (range 13 to 77); this was equivalent to 33 cents per capita (range 8.2 to 72 cents). Figures 6-3 and 6-4 display the distributions of personnel and nonpersonnel costs per human exposure call across all
TABLE 6-2 FY2001 U.S. Poison Control Center Funding, All Centers Providing Data (N = 64)a
|
Funding Source |
Amount ($) |
Percentage of Total |
Number of Centers with Funding Source |
|
Federal (excluding Medicaid and Block grants) |
|
||
|
HRSA stabilization grant |
6,679,259 |
6.39% |
52 |
|
HRSA incentive grant |
567,875 |
0.54% |
11 |
|
Other |
1,049,619 |
1.00% |
6 |
|
Total Federal |
8,296,753 |
7.94% |
69 |
|
Medicaid |
|||
|
Federal |
3,593,737 |
3.44% |
5 |
|
State |
2,456,235 |
2.35% |
7 |
|
Unknown |
311,529 |
0.30% |
1 |
|
Total Medicaid |
6,361,501 |
6.09% |
13 |
|
Block grants: |
|||
|
Maternal Child Health |
3,157,555 |
3.02% |
6 |
|
Preventive Health |
80,000 |
0.08% |
1 |
|
Other |
270,000 |
0.26% |
2 |
|
Total block grants |
3,507,555 |
3.36% |
9 |
|
State: |
|||
|
Line item appropriation |
19,385,768 |
18.54% |
27 |
|
Through state-funded university: |
|||
|
Direct line item appropriation from state |
8,084,711 |
7.73% |
7 |
|
University designated funds |
5,529,715 |
5.29% |
17 |
|
Total through state-funded university |
13,614,426 |
13.02% |
24 |
|
Telephone surcharge |
9,018,608 |
8.63% |
8 |
|
911 fees |
50,000 |
0.05% |
1 |
|
License fees |
0 |
0.00% |
0 |
|
Other |
4,444,372 |
4.25% |
19 |
|
Total state |
46,513,174 |
44.49% |
79 |
|
City |
665,352 |
0.64% |
5 |
|
County |
896,301 |
0.86% |
13 |
|
Hospital (other than host): |
|||
|
Member hospital network |
5,162,071 |
4.94% |
12 |
|
Donations/fees from area hospitals |
350,737 |
0.34% |
8 |
|
Total hospital (other than host) |
5,512,808 |
5.27% |
20 |
|
Host institution: |
|||
|
Host hospital |
10,841,344 |
10.37% |
38 |
|
Other host institution |
378,696 |
0.36% |
3 |
|
Total host institution |
11,220,040 |
10.73% |
42 |
|
Donations/grants: |
|||
|
Children’s Miracle Network |
225,528 |
0.22% |
5 |
|
Community service organizations |
70,225 |
0.07% |
4 |
|
Corporations |
486,064 |
0.46% |
13 |
|
Events |
23,815 |
0.02% |
1 |
|
Funding Source |
Amount ($) |
Percentage of Total |
Number of Centers with Funding Source |
|
Foundations |
1,459,935 |
1.40% |
17 |
|
Individuals |
418,995 |
0.40% |
19 |
|
United Way/Federated campaigns |
869,139 |
0.83% |
10 |
|
Total donations/grants |
3,553,701 |
3.40% |
69 |
|
Health insurers/HMOs (excluding HMO hospitals) |
24,400 |
0.02% |
3 |
|
Otherbusiness sourcesb |
2,169,625 |
2.08% |
20 |
|
Other |
2,491,469 |
2.38% |
14 |
|
Total direct funding |
91,212,677 |
87.25% |
64 |
|
Estimated additional in-kind and subsidized supportc |
13,327,026 |
12.75% |
51 |
|
Total funding |
104,539,703 |
100.00% |
64 |
|
aOne noncertified center serving a population of 1,224,398 submitted a survey with incomplete funding information. bE.g., portion of industry contract funding used to provide general poison control services in the center’s region. cEstimated as 15 percent of total identified expenses. |
|||
centers. Note that the figures suggest a relatively smooth distribution on both measures of expenses, and that it is therefore unlikely that a few “outlying” centers are disproportionately influencing the averages on these measures. Taken as a whole, AAPCC data indicate that poison control centers display wide variability in virtually all aspects of staffing, operations, and costs. The population of centers can therefore best be characterized as highly heterogeneous, with few common structural or operational characteristics to form the basis for characterizing a “typical” center.
Chapters 2 and 5 discussed the core functions of poison control centers. Table 6-2 provides a rough estimate of the national costs of supporting the core activities, approximately $100 million per year. This figure is slightly less than the sum of reported expenditures in Table 6-2, with the reduction providing some consideration of the cost of noncore activities (e.g., public education; education of health care professionals not working toward a career in medical or clinical toxicology). Conversely, if an average total cost of approximately $40 per human exposure call is used (this amount represents poison control center expenses divided by the number of human exposure calls) and this amount is multiplied by the call vol-
ume reported in the 2002 data (approximately 2.4 million calls) a figure with an order of magnitude of approximately $100 million per year is obtained.
Potential Economies of Scale Through Consolidation or Networking
An important issue in the economics of poison control centers is whether there are economies of scale in the cost of operating the centers as a function of the number of individuals in the centers’ catchment area. As mentioned earlier, the population served by a poison control center ranged from 634,000 to 35 million in 2001. Are centers serving larger populations able to provide the same service at reduced costs per call or per person in the population? If so, that would be one argument for consolidating centers into fewer and larger centers.
In an unpublished study, Zuvekas et al. (1997) conducted a detailed examination of the activities of six poison control centers and allocated all activity costs among eight functions: treatment management guidance, public prevention and promotion, professional education, protocol assessment and poison surveillance and data collection, interaction with local and regional public health and safety officials, and research. They found that the costs of treatment management guidance ranged from $21 (in 1995 dollars) to $43 per human exposure call, with four of the six centers in the $21-to-$27 range. They also found that the lowest estimated cost per person in service area ($.22/year, in 1995 dollars) and the lowest cost per human exposure call ($21.14) occur in the largest poison control centers (with a service area population of 8 million) studied, whereas the highest of these pair of costs ($.58 and $43.18, respectively) occurs in the smallest center (with a service area population of 1.3 million). Additionally, the second smallest poison control center studied, with a service area population of 2.8 million, had costs slightly higher than most of the larger centers. It is important to note that these analyses also do not consider other benefits and tradeoffs associated with increased or reduced costs. For example, while high-cost centers serving relatively small populations may appear inefficient from a purely financial standpoint, they may be offsetting benefits from those increased costs, including more diverse services offered or more innovation in the delivery of services (e.g., use of promotoras, or community health workers, in predominantly Hispanic regions).
Even considering these caveats, the data are not definitive. The costs per call and per person served do not appear in this very limited sample to increase once a center is above 2 million served. Additionally, there are no measures available about quality of service. It may be that a center that happens to be small compared with other centers hires more senior and more professionally capable staff. The result could be higher costs per call
served, but also better outcomes in terms of triage or interfacing with emergency departments. There is no evidence in the literature about the cost-effectiveness of more experienced (and more expensive) or better trained (and more expensive) staff, nor are data available on whether the poison control centers with higher costs per call experience higher costs because of these considerations.
To address this issue further, we used 2001 survey data on poison control center operations (American Association of Poison Control Centers, 2002a), described elsewhere in this chapter, to examine economies of scale. If economies of scale were present, one would expect to observe a decline in expenses per call as the population served increases, followed by a plateauing of expenses per call at some breakpoint in the population served distribution. The data are not well suited for fine-grained analysis of economies of scale, but insofar as reported data on costs can be used to construct costs per human exposure call, and insofar as no differences in terms of quality of service provided by the centers are assumed, they can be informative. Based on Figure 6-5, only a very weak relationship is found between size of population served and costs per call handled, albeit this relationship is in the expected direction. Furthermore, population served explains only about 10 percent of the variation in cost per call, suggesting that cost savings may be gained through changes other than consolidation. Moreover, even if there are economies of scale in handling calls from the public, this is only one of the core functions of a poison control center, and the question of the optimal size of a center must consider these other functions as well.
Explanatory Models of Poison Control Center Costs
In an attempt to explain the wide variation in costs incurred by poison control centers, expenses per human exposure call (a call fielded about a person who may or may not have been poisoned) were modeled as a function of a limited set of explanatory variables available from the AAPCC annual survey. In general terms, these explanatory variables captured centers’ regional location, source of funding, size of catchment area, and staffing characteristics. The primary benefit of this analysis was to allow us to capture the independent effects of these explanatory variables, holding constant the effects of the other variables in the model. Results were obtained through a set of regression models run for the 58 to 59 centers with complete data on the predictors in the models: population served, educator FTEs per PIP/SPI/CSPI FTEs, percentage of SPI/CSPI FTEs that were certified (CSPI), having 24-hour coverage, percentage of revenue from Health Resources and Services Administration stabilization grants, percentage of revenue from host hospital, percentage of revenues
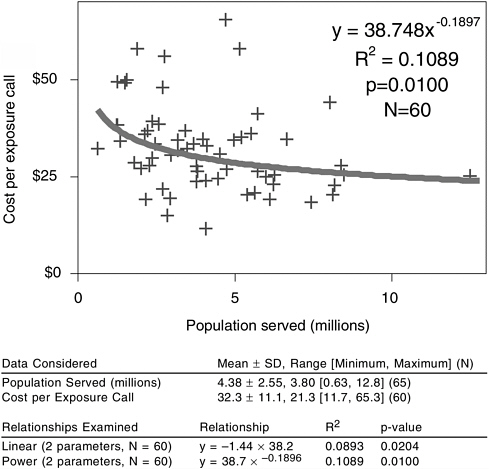
FIGURE 6-5 Cost per human exposure call versus population served.
NOTE: Regression line shows least-squared fit of log(cost per call) to log(population served).
from area hospitals (other than the host hospital), location in the Northeast region of the United States, and location in the Southern region of the United States.
Three models were run, predicting Total Expenses per Human Exposure Call, Personnel Expenses per Human Exposure Call, and Nonpersonnel Expenses per Human Exposure Call.
Total expenses per human exposure call was negatively associated with a larger population served. Factors positively associated with this dependent variable were location in the Northeast region, 24-hour coverage by SPIs, and more health educator FTEs.
Results for personnel expenses per human exposure call were virtually identical to the results for total expenses per human exposure call. This dependent variable was negatively associated with a larger population served and positively associated with location in the Northeast region, 24-hour coverage by SPIs, and more health educator FTEs. This pattern of results suggests that total expenses are driven largely by factors related to personnel costs. This finding is further supported by the fact that the model for nonpersonnel cost per human exposure call was not significant overall and none of the predictors reached significance at the p<.05 level. This suggests that compared with personnel expenses, expenses related to nonpersonnel items (e.g., telecommunications) play a relatively minor role in total center cost differentials.
Nonpersonnel expenses per human exposure call, including telecommunications, increased with subsidization and area hospital funding, but decreased with host hospital funding. Nonpersonnel expenses were positively associated with 24-hour SPI coverage, and two were negatively associated with greater percentage of human exposures calls.
The most important predictor of expenses per call was 24-hour coverage, which accounted for a $19 difference in cost per call. Whereas the vast majority of poison control centers have such 24-hour coverage as a requirement of accreditation by AAPCC, these results further reinforce the importance of personnel costs and staffing patterns as key determinants of center costs and efficiency. Of nearly equal importance in the model was center location in the Northeast region of the county. Relative to centers located in the West and Midwest, these poison control centers incurred $11 to $13 more per call, even holding constant other variables such as population served and funding source. Again, these differences are likely to reflect higher wage rates in this part of the country, a factor that drives up the cost of providing services. Finally, it should be noted that these models account for at best 42 to 45 percent of the total variation in cost per call. This means that a substantial portion of cost differentials across centers is not accounted for by variables in the models and that other unmeasured factors may be contributing to such differentials.
Qualitative Analysis of Organizational Characteristics
Sample Selection
The analysis of the 2001 AAPCC survey data shows significant variability among poison control centers on a number of dimensions, including total costs, personnel costs, and nonpersonnel costs per (1) population served, (2) total calls, and (3) human exposure calls. The regression models described earlier were limited insofar as they contained only variables
available from the AAPCC survey and on average explained less than half of the variance in expenses per human exposure call. Notably absent from the set of explanatory variables were organizational characteristics of the poison control centers that might account for differences in costs as well as other outcomes of interest, such as staff turnover and retention or service increases and declines.
To describe and compare the organizational characteristics of poison control centers in depth, a stratified nonprobability sample of 10 centers was selected for further qualitative study based on semistructured interviews with key informants at each site. The two principal strata of selection were based on cost per human exposure call handled in 2001 and total population served combined with total human exposure calls per population per 1,000 (penetrance).
The first stratum was defined by being the highest or lowest quartile for at least one of three defined categories of expense per exposure call: total, personnel, or nonpersonnel expense. Six of the 10 centers were in the highest quartile by at least one of these measures. Four were in the lowest quartile. The second stratum was defined by population and penetrance. Centers based on high or low quartile were also selected here, but these could have been discordant. Five centers were in the highest quartile of population served and three were in the lowest, while four were in the highest quartile of penetrance and four were in the lowest. All 10 were in an extreme quartile for at least one of the two. Five were discordant, either highest-lowest or lowest-highest. Either the managing director or the medical director of each center participated in a one-hour interview. The questions are included in Appendix 6-A.
The distribution of the operating characteristics among the centers included in the interview sample is provided in Table 6-3.
TABLE 6-3 Distribution of Operating Characteristics Sample for Qualitative Study
|
Poison Control Center |
Total Cost |
Personnel Cost |
Population |
Penetrance |
|
A |
|
Low |
High |
High |
|
B |
High |
|
High |
Low |
|
C |
High |
|
High |
Low |
|
D |
|
High |
High |
Low |
|
E |
|
|
High |
|
|
F |
Low |
|
Low |
High |
|
G |
High |
High |
Low |
High |
|
H |
|
High |
Low |
|
|
I |
Low |
Low |
|
Low |
|
J |
Low |
Low |
|
High |
Findings
Tables 6-4 and 6-5 present an overview of the differences between the lower (high-cost) and higher (low-cost) efficiency centers and between centers serving large and small populations. The following sections provide a brief narrative description of survey response in each area of inquiry.
TABLE 6-4 Differences Between Low-Efficiency and High-Efficiency Centers
|
Survey Variables |
High Efficiency |
Low Efficiency |
|
Affiliation |
Most are private not-for-profit |
Most are public not-for-profit |
|
Staffing |
Slightly lower staff turnover rate Less likely to mention low pay as a contributor to staff turnover More staff hours spent weekly on all poison control center activities; more staff hours spent on poison prevention |
Slightly higher staff turnover rate More likely to mention low pay as a contributor to staff turnover Fewer staff hours spent weekly on all poison control center activities; fewer staff hours spent on poison prevention other than direct client response |
|
Services and activities |
||
|
• Current practices |
More full-time equivalents (FTEs) devoted to education and outreach |
Fewer FTEs devoted to education and outreach |
|
• Areas of growth |
No differences |
No differences |
|
• Areas of decline |
Industry contracts, general call volume, resident training |
Professional education, fellowship training, general call volume |
|
Interorganizational relationships |
More likely to have partnership or joint venture arrangement with another organization Less shared staff and shared information technology (IT) Lower proportion of calls referred to outside providers |
Less likely to have partnership or joint venture arrangement with another organization More shared staff and shared IT Higher proportion of calls referred to outside providers |
|
Survey Variables |
High Efficiency |
Low Efficiency |
|
Quality improvement and assurance |
No differences |
No differences |
|
Research and training |
No differences |
No differences |
|
Future organizational challenges |
More likely to have a strategic plan specific to poison control center Less likely to cite problems related to complex reporting and accountability Less likely to cite balancing core poison control functions with other activities such as research and bioterrorism response and preparedness |
Less likely to have a strategic plan specific to poison control center More likely to cite problems related to complex reporting and accountability More likely to cite balancing core poison control functions with other activities such as research and bioterrorism response and preparedness |
TABLE 6-5 Differences Between Centers Serving Large and Small Populations
|
Survey Variables |
Large Population |
Small Population |
|
Affiliation |
No differences |
No differences |
|
Staffing |
More likely to use paid consultants other than medical director Less likely to cite low pay as reason for turnover Employ more full-time equivalents (FTEs) More hours spent on all poison control center activities and nonclient response activity |
Less likely to use paid consultants other than medical director More likely to cite low pay as reason for turnover Employ fewer FTEs Fewer hours spent on all poison control center activities and nonclient response activity |
|
Services and activities |
||
|
• Current practices |
More extensive involvement in professional education, public education, and outreach |
Less extensive involvement in professional education, public education, and outreach |
|
Survey Variables |
Large Population |
Small Population |
|
• Areas of growth |
Professional education, public education, and outreach |
|
|
• Areas of decline |
Services eliminated because of inadequate funding or high costs and declines in exposure calls and overall call volume |
Services eliminated because of inadequate funding or high costs; public and professional education most likely to be reduced |
|
Interorganizational relationships |
More likely to partner or joint venture with other organizations |
Less likely to partner or joint venture with other organizations |
|
Quality improvement and assurance |
No differences |
No differences |
|
Research and training |
More likely to have fellowship funding |
Less likely to have fellowship funding |
|
Future organizational challenges |
More likely to have a formal strategic plan Staff recruitment and retention somewhat less likely to be an issue |
Less likely to have a formal strategic plan Staff recruitment and retention a significant issue |
General Eight of the ten centers surveyed were established during the 1950s. The governance of most of the centers falls under the board of the organization with which they are affiliated. One center is governed by the city department of health, and the one independent center has its own board of trustees. Four centers either have or are considering forming an advisory board.
The organizational structure of most of the centers surveyed is relatively flat, with a managing director and medical director comprising the senior staff, with poison information personnel and educators reporting directly to them. Two centers have additional midlevel personnel, such as associate directors or education or administrative coordinators.
Most centers have undertaken fairly significant organizational change in the past 10 years. In some cases, these changes were precipitated by a consolidation of service areas (usually because one or more other centers had closed). In other cases, the changes were in response to a fiscal crisis, the resolution of which led to new funding and organizational arrange-
ments. At least one center indicated making staffing changes in order to seek AAPCC certification. Many of the centers also underwent functional changes (e.g., adding “extended services” such as bilingual services, additional education and outreach, research, other hotlines, and bioterrorism/public health emergency response services).
Three centers serve smaller populations (i.e., below the mean population served by all poison control centers), while the remaining seven serve larger populations (above the mean). Not surprisingly, “low-population” centers tend to employ a smaller number of staff than “high-population” centers (FTEs of 10 to 14.5 versus FTEs of 14 to 29). Those centers that have midlevel personnel, such as associate directors or education or administrative coordinators, are centers that serve larger populations.
Five centers have lower costs per human exposure call (i.e., below the mean cost for all poison control centers), while the remaining five have higher costs (above the mean). All of the lower-cost centers serve larger populations; none of the centers surveyed serving smaller populations fall in the lower-cost category. Centers with higher costs employ similar numbers of FTEs as those with lower costs. FTEs at lower-cost centers range from 14 to 26, while the number at higher-cost centers ranges from about 10 to 29.
Affiliation The 10 centers surveyed are evenly divided between private not-for-profits (5) and public not-for-profits (5). Eight centers identify themselves as “owned” by a hospital, university, or similar entity; for one, ownership status is unclear, and for another ownership is wholly independent. Three identify themselves as part of a university, five as part of a hospital, one as part of a hospital association, and one as independent. In all cases but the independent center, respondents indicated that major management decisions need to be approved by the larger entity of which they are a part. In some cases, even more minor decisions (such as the allocation of all expenditures) require such approval. Some funding agencies also exercised decision approval over various aspects of their expenditures (e.g., use of grant funds).
Most hospital-based centers report and are accountable to a high-level vice president or the president/chief executive officer, and this is also true of university-based centers (e.g., reporting to a dean). Again, some centers have accountability relationships to outside entities, usually governmental agencies such as the state department of health.
There are few differences in nonprofit status, reporting, and accountability among centers serving larger and smaller populations or among those classified as high and low cost. The one notable exception is that four of five higher-cost centers described themselves as public not-for-
profits, while four of five lower-cost centers described themselves as private not-for-profits.
Staffing Most centers indicate using at least some volunteers for activities such as education and outreach or mailings. Others count unpaid medical toxicologist backup and students on clinical rotations as volunteers. All centers use consultants as backup medical toxicologists and other medical experts, and these are often not paid. At three centers, the medical director is a contracted, paid consultant. Other consultants include an education coordinator, a “financial person,” a computer maintenance/repair service, and a language line used for translation of calls from non-English speakers.
The overall number of FTEs employed at each of the 10 centers ranges from approximately 10 to 29, and estimates of average annual turnover range from “very low” to 20 percent; the higher turnover is concentrated among SPIs. Reasons for turnover include new hires not successfully making it through orientation, personnel moving, and staff getting better job offers elsewhere. SPI pay is seen as noncompetitive with most other pharmacist and nursing jobs, despite the fact that 24/7 coverage and heavy job responsibilities are seen as more taxing.
The total number of estimated weekly hours that center personnel spend on all poison control center activities ranges from a low of 370 to a high of 1,095. Estimated hours that center personnel spend on poison prevention and control activities other than direct client response range from 60 to 500.
High- and low-population centers do not seem to differ in use of volunteers and they seem no more (or less) likely to use consultant arrangements for their medical directors. However, centers serving high-population areas are more likely to use other types of paid consultants. Estimates of average annual staff turnover also do not differ between centers serving large populations versus centers serving smaller populations. Centers serving smaller populations are somewhat more likely to mention low pay as contributing to turnover rates.
Centers serving smaller populations estimate lower numbers of hours spent weekly on all poison control center activities (370 to 490 versus 670 to 1,095 hours), as well as lower numbers of weekly hours spent on poison prevention and control activities other than direct client response (60 to 120 versus 100 to 500 hours). This is not surprising in view of the lower number of overall FTEs they employ.
An examination of high- and low-cost centers shows no difference in use of volunteers and no difference in the use of consultant arrangements for their medical directors. However, lower-cost centers are somewhat
more likely to use other types of paid consultants. Furthermore, average annual staff turnover does not differ greatly between higher- and lower-cost centers, although estimates of turnover were perhaps slightly lower among lower-cost centers. Lower-cost centers, however, are much less likely to mention low pay as contributing to turnover rates.
With one exception, higher-cost centers estimate fewer hours spent weekly on all poison control center activities (370 to 690 versus 670 to 1,000 hours). The exception is one higher-cost center reporting 1,095 total hours weekly. Higher-cost centers also tend to spend fewer weekly hours on poison prevention and control activities other than direct client response (60 to 195 versus 70 to 500 hours). These results are perhaps surprising given that the two types of centers do not differ greatly on total number of FTEs employed.
Services and Activities
Besides handling exposure and nonexposure calls, all 10 centers conduct some professional education and/or residency training and some public education and outreach. Most sites also conduct research. Other activities include writing grants, writing guidelines, providing bilingual services, collecting data, and carrying out industry contract services.
The centers’ primary target population is the public. Some sites cover their entire state, while others cover a regional area. All 10 centers in the survey sample handle calls from health care professionals and health service organizations. One site also offers bilingual services and covers all Spanish speakers in two states. The number of FTEs estimated for this activity range from 6 to 21. In centers serving smaller populations, the range is 5.5 to 10.75 versus 6 to 21 FTEs for centers serving larger populations. No differences were found between high- and low-cost centers.
Professional education and residency training is targeted both at medical toxicology residents and fellows as well as residents and students in pediatrics, emergency medicine, and pharmacy. The centers vary in the number and intensity of these educational activities, with some hosting a number of toxicology fellows, for example, while others provide shorter-term training (i.e., rotations) for students and residents from four or five different departments. Nearly all centers also provide education for practicing professionals, through grand rounds and lectures at area (or their own) hospitals and other health care institutions, as well as special conferences and seminars. Again, the number and intensity of such activities varies. Center directors have a difficult time estimating the FTEs devoted to such training, which is often conducted by the medical director (and other medical personnel, if the center has any). Estimates range from 0.25 to 4 FTEs, for professional education and resident/stu-
dent training combined. Low-population centers averaged 0.5 FTEs while high-population centers ranged from 0.67 to 4 FTEs. Low-cost centers employed 1or 2 FTEs for professional education; high-cost centers ranged from 0.5 to 4 FTEs for this activity.
Public education and outreach activities include public workshops, promotional activities conducted in partnership with local organizations (such as health fairs), bilingual training for volunteer peer educators (promotoras), newsletters, and prevention education at schools, adult education programs, and Supplemental Women, Infants, and Children program sites. The number of FTEs estimated for these types of activities varies greatly, from 0.75 to nearly 5. Centers serving smaller populations employ from 0.5 to 1 FTE in education and outreach, while centers serving larger populations range from 1 to nearly 5. Centers with lower costs employ from 1.25 to nearly 5 FTEs in education and outreach, while the estimates for centers with higher costs range from 0.5 to 2.
Nine of the 10 sites surveyed conduct research, very broadly defined. For some this involves case reports and series of literature reviews and includes research conducted by onsite fellows. One center mentioned internal research for the purposes of quality assurance, while two others mentioned joint research conducted with other centers. Again, directors find it difficult to estimate FTEs for research because the research effort tends to be split among numerous staff, many of whom devote only a small amount of their time to this activity. Estimates range from 0.1 to 6 FTEs. With one exception, research FTEs are no more limited at centers serving smaller populations than they are in centers serving larger populations. Low-population center research FTEs range from minimal to 1.75; for high-population centers this ranges from 0.1 to 1.25 (with one outlier site having 6 research FTEs, predominantly fellows). Research FTEs at lower-cost centers appear similar to higher-cost centers. Lower-cost center research FTEs range from 0.1 to 1.25; for higher-cost centers, this ranges from a low of 0.1 FTE to 1.75 FTEs (again with one outlier site having 6 research FTEs, predominantly fellows).
Finally, the centers report other activities, including data collection (two), writing guidelines (one), grant writing (one), and industry service contracts (two). The level of effort for these other activities ranges from 0.2 to 1 FTE. Centers serving smaller populations seem no less likely to engage in other activities than centers serving larger populations, with one low-population center engaging in more additional activities than any other center surveyed. No differences were found between higher-and lower-cost centers in the interview sample.
Respondents mentioned six main areas of growth in services and six main areas of decline. Growth areas described include the following:
-
Six centers indicated they have experienced the most growth in the area of public education and outreach, with some mentioning an increase in grant funding as the reason.
-
Three centers indicated growth in professional education.
-
Three mentioned increases in call volume.
-
Two described an increase in administrative burden as a result of Health Insurance Portability and Accountability Act (HIPAA) requirements and funding issues (e.g., grant writing and administration).
-
One center mentioned research.
-
One center mentioned bilingual services.
Centers experienced similar areas of growth in services regardless of whether they serve larger or smaller populations, but to differing degrees. More centers serving larger populations reported growth in professional education (three centers), and growth in public education and outreach (five centers). Only one center serving a smaller population reported growth in either of these areas of service (education and outreach). Two high-population and one low-population center reported increased call volume. One of each kind of center described an increase in administrative burden. One center serving smaller populations mentioned research and another mentioned bilingual services as top growth areas.
Both higher- and lower-cost centers experienced growth in public education and outreach (three centers of each type), professional or resident education (two higher-cost centers, one lower-cost center), and call volume (two lower-cost centers, one higher-cost center). One of each kind of center also described an increase in administrative burden. One higher-cost center mentioned research and another mentioned bilingual services as top growth areas.
Areas of decline described include the following:
-
Four centers reported professional education as the activity area in which they have experienced the most decline, with one center indicating that the problem was not demand, but rather the center’s decreasing ability to meet the demand.
-
Three centers reported decreasing call volume in general.
-
Two centers reported a decrease in human exposure calls as a percentage of all calls.
-
Two centers reported a decrease in drug information calls (in both cases because this service had been discontinued).
-
Three centers said the number of industry or other contracts for special services has decreased.
-
One center reported a decline in the amount of marketing the center has been doing due to a lack of funding.
Centers serving smaller populations reported declines in service all related to the inability to fund activities—either a direct loss of funding (e.g., loss of grant) or discontinuation of services due to unacceptably high costs (e.g., decision to discontinue accepting drug information calls). Two of these centers also reduced education activities, in one case an unfilled fellowship position and in another a decrease in professional education. Centers serving larger populations, while also experiencing declines due to funding issues, also reported declines in service due to other factors—two of these centers reported declines in exposure calls as a percentage of all calls, while three others reported declines in overall call volume. Also mentioned were decreases in industry contracts, professional or resident training, and other types of calls (animal exposures, drug decoding, pesticide calls). One center turned down requests for various services due to lack of staff.
Declines in service are somewhat different between higher- and lower-cost centers. Three higher-cost centers experienced declines in professional education or fellowship training, while one lower-cost center suffered a decrease in resident training. Two lower-cost centers indicated declines in industry or other contracts. Both types of centers, however, mentioned declines in call volumes, with one higher-cost and two lower-cost centers reporting declines in general call volume, and one of each type of center reporting decreases in exposure calls as a percentage of all calls, drug information calls, and other types of calls (e.g., animal exposures). The decreases in information and other calls are largely a function of the centers’ termination of these services.
Interorganizational Relationships
Five respondents indicated that their centers have joined some type of coalition or collaboration with other centers in the past 4 years. These formal arrangements include state poison center networks and regional consortia. Four respondents mentioned informal collaborative arrangements—such as data sharing or call coverage—that their centers have with another center or centers. Six centers have entered into partnership or joint venture arrangements with other organizations. These vary, and include partnerships to provide education and outreach services, multicenter research projects, and joint programs with other hospital or university departments. None of the centers indicated that they have been involved in a merger. (However, at least three of the centers mention in other parts of the survey that they have expanded their service areas in the past 10 years because other centers have closed.)
Of the five centers joining some sort of coalition or other formal collaboration with other centers in the past 4 years, four were centers serving
larger populations. Of the four centers mentioning informal collaborative arrangements, two were centers serving larger and two smaller populations. Only one center serving a smaller population has entered into a partnership or other joint venture arrangement with another organization, compared with five of the large-population centers. Two higher-cost centers have entered into a partnership or other joint venture arrangement with another organization compared with four of the lower-cost centers.
Most centers provide services to other providers, the majority of which are related to professional education. A few centers provide data collection services for other providers. One regional center provides bilingual services to the rest of its state and to another state. Both large- and small-population centers are equally likely to provide services to other providers. Centers serving smaller populations have more shared staff and shared databases than centers serving larger populations. Both higher- and lower-cost centers are equally likely to provide services to other providers. Centers with higher costs have more shared staff and shared information technology (including databases) than centers with low costs, but neither type of center reported extensive sharing of administrative support or other services.
Few centers share administrative support services, information technology, or staffing with another center or organization; one center shares these with another service of the hospital in which it was based, while another two share education personnel with other hospitals. One center shares its bilingual staff, as described above. Two centers share information technology, some staff, and call volume with other poison control centers in their state. Two other centers share only databases for joint research projects, and three others mention providing occasional coverage for another center or handing off patients to a nearby center.
Referrals in and out of the centers vary considerably. While one center indicated it receives “minimal” referrals from other providers, another said 58 percent of its clients are so referred. Most centers indicate a percentage closer to 15 to 20 percent. Similarly, most centers refer about 15 to 20 percent of their clients to outside providers, usually hospitals, for evaluation, treatment, and monitoring; this percentage ranges from 7.5 percent to 30 to 40 percent. There seems to be no clear difference in the estimated number of referrals between types of centers in either referrals to the poison control center or referrals from the center to other providers. Centers serving smaller populations tend to fall at the higher end of the distribution in terms of referrals out to other health care providers, but there are some centers serving larger populations with similar figures. However, centers with lower costs tend to have a somewhat lower percentage
of referrals to other health care providers (7.5 percent to 19 percent of calls, versus 11 percent to 35 percent of calls for higher-cost centers).
Quality Improvement and Assurance
All programs surveyed use some kind of written procedures for handling telephone calls. These procedures are of two types. Most of the centers have written policies or administrative procedures for handling calls that address topics such as how to answer the phone, what information to collect from callers, and other general triage guidelines. Most of the centers also have guidelines addressing evaluation and treatment of specific exposures. One center has a library of about 200 management guidelines on hand, not only for its own use, but to fax to treatment facilities.
All but one center practice case management as defined in the survey. This includes conducting a comprehensive assessment of clients’ needs at intake, making referrals for services, following up on referrals to make sure that clients received services, and contacting clients periodically to check on their progress. Most centers indicate that they do this kind of case management at minimum for anyone they refer to a hospital for treatment; however, some also follow up with less serious exposures.
All centers have a formal written quality assurance plan, with two indicating they are in the process of revision. Quality assurance activities focus on two areas, customer service and appropriateness of treatment. Many centers assess this through review of telephone calls, either recordings or transcripts. Some do this for a random selection of all calls, while a few also target specific categories of calls for review (e.g., those clients referred to hospitals, deaths). Some centers also have daily or twice-daily reviews of currently active cases. In most instances, these reviews are done by senior personnel, and in particular the medical director; however, a few centers also involve other staff in quality reviews, including specialists in poison information, as a part of their ongoing training. Two centers have mission and vision statements related to quality improvement.
Finally, staff in all centers undergo at least in-house, in-service training related to their jobs, with some centers conducting such training on an ongoing basis. In terms of more formal training, 25 to 100 percent of centers’ staffs have participated in formal continuing education or inservice training during the past year.
There are no discernable differences between high- and low-population areas and higher- and lower-cost centers regarding quality assurance activities.
Research and Training
FTEs devoted to research vary from zero to six, with higher numbers devoted to research at sites that have fellowship programs. FTEs devoted to staff training are difficult for respondents to estimate, given that none of the centers have dedicated personnel for this task. Instead, responsibility for training tends to be shared among senior staff and, sometimes, more experienced SPIs. Estimates range from 0.1 to 1 FTE. The estimated length of SPI training varies from 8 weeks to 12 months, with the most common length of approximately 3 months. Respondents note that it can take from 6 months to 2 years for new hires to come fully up to speed.
Few of the sites have funding for poison control center research, and those that do have grant funding. Not surprisingly, research funding is generally considered insufficient. Similarly, there is little dedicated funding for training, except for some fellowships (and these funds do not necessarily come through the center). A few centers have limited travel funds or small grant funds for training, but none consider them sufficient.
Staff-training FTEs also appear to be roughly equal, again with those centers having fellowship programs reporting additional FTEs. Almost none of the sites have funding for poison control center research or staff training, so this does not vary by type of center. The exception is three centers serving high populations that have fellowship funding; two of these centers are higher cost and one is lower cost. Neither research nor staff training funding was considered sufficient by any of the centers.
Future Organizational Challenges
General Three centers have a formal written strategic plan and one is in the process of developing such a plan. Four centers are included under the strategic plan of the organization (usually a hospital) of which they are a part. Two of these either also have their own plan, or are included under the plan of the state poison control network. Two centers do not have a strategic plan of their own, but have written objectives or a mission and vision statement specific to the center.
The most often mentioned organizational challenge the poison control centers face is staff recruitment and retention, particularly for SPIs. Respondents complain of difficulty in finding qualified staff to hire, not only because of competition from better paying jobs, but also because of problems finding people with the right mix of skills.
Some respondents also describe organizational challenges arising from the complex, multidisciplinary nature and structure of some of these centers. For example, a center may be part of a hospital affiliated with a university whose staff and fellows have appointments in a number of
different departments and schools, and whose funding comes from multiple sources (e.g., the hospital, the university, the state department of health, and grants). In circumstances such as these, it can be difficult for the center to function as an autonomous, “cohesive” organizational entity. One respondent noted that the result can be delays in addressing important issues.
Related to this, some respondents point to the difficult balance between “core” functions (e.g., answering calls) and other activities that are important, but perhaps not considered central to the poison control center mission (e.g., research). In most cases, these are viewed as tasks that centers are well placed and well suited to do, such as bioterrorism and emergency preparedness. Some respondents express the opinion that poison control centers have been overlooked and should be more involved in these “noncore” issues. However, they also recognize the difficulties of coordinating multiple missions, given the realities of multiple, separate funding streams and already fragmented organizational structures.
Several respondents note problems related to HIPAA and the difficulty convincing provider organizations that they can share routine patient-level follow-up data with the center. This has hampered toxicosurveillance efforts and research efforts.
Finally, one respondent notes the language and cultural barriers that need to be addressed as the number of linguistic minorities in the United States continues to grow. These groups’ utilization of poison control center services is low; yet, they are at perhaps a higher risk than the English-speaking population. This is because of the younger average age of some of these populations and the fact that they may have difficulty reading packaging in English.
Larger versus smaller populations More centers serving larger populations have a formal written strategic plan, are in the process of developing one, or have written objectives or a mission and vision statement specific to the center (five centers). Only one center serving a smaller population indicated having a formal strategic plan specific to its center. Two of each type of center are included under the strategic plan of the larger organization of which they are a part.
Staff recruitment and retention is a pressing organizational challenge for many centers serving larger populations, but it is a challenge for all centers serving smaller populations. Interestingly, low-population centers are as likely as high-population centers to describe organizational challenges arising from the complex, multidisciplinary nature and structure of their organizations. They are also as likely to report difficulties in balancing “core” poison control functions and other functions, such as research and bioterrorism response and preparedness. Overall, the chal-
lenges poison control centers face seem to be similar, no matter the size of the population they serve.
Lower- versus higher-cost centers More lower-cost centers have a formal written strategic plan, are in the process of developing one, or have written objectives or a mission and vision statement specific to their center (five centers). Only one high-cost center indicated having a formal strategic plan specific to its center. Three high-cost centers are included under the strategic plan of the larger organization of which they are a part, as is one lower-cost center.
Staff recruitment and retention is a pressing organizational challenge for most centers, and this does not differ by type of center. Higher-cost centers are much more likely than lower-cost centers to describe organizational challenges arising from the complex, multidisciplinary nature and structure of their organizations. They are also more likely to experience difficulties in balancing “core” poison control functions and other functions, such as research and bioterrorism response and preparedness.
SUMMARY
Many of the studies on examining the costs and effectiveness of poison control centers lack the necessary or appropriate data needed to reach strong conclusions, particularly regarding effectiveness. Nonetheless, taken as a whole, this literature makes a convincing case that, at least in terms of treatment management guidance for the public, poison control centers save the health care system economic resources and save members of the public time, lost wages, and anxiety. These studies, however, do not examine the cost-effectiveness among poison control centers, but rather compare them with other health care providers such as emergency departments.
There is wide variation among poison control centers on a number of operational characteristics, including total costs, personnel costs, and nonpersonnel costs per (1) population served, (2) total calls, and (3) human exposure calls. There is little conclusive evidence that economies of scale operate with respect to size of population served and poison control center costs, particularly for centers serving populations of 2 million or more. Costs are best predicted by variables related to staffing patterns and wage rates rather than hardware expenses or funding source.
Regarding staff time, higher-cost centers estimate fewer hours spent weekly on all poison control center activities, whether direct client response or not. However, the two types of centers do not differ greatly on total number of FTEs employed. Centers with higher costs have more shared staff and shared information technology (including databases)
than centers with low costs, but neither type of center engages in extensive sharing of administrative support or other services. Centers serving smaller populations employ, on average, fewer professional education and public health education FTEs. They also have more shared staff and shared databases than centers serving larger populations.
In the area of quality assurance and planning, there was little variation in quality assurance activities among centers, with virtually all engaging in them. The staff of all centers undergo at least in-house, in-service training related to their job. Only two centers (both high cost) have no strategic plan; the eight others either have their own formal written strategic plan or objectives, or are included under the strategic plan of the organization of which they are a part.
Regarding affiliation and interorganizational relationships, four out of five higher-cost centers described themselves as public not-for-profits, while four out of five lower-cost centers are private not-for-profits. Centers serving larger populations and lower-cost centers described themselves as more likely to have joined a coalition, other formal collaboration, partnership, or other joint venture.
Centers serving smaller populations all experienced declines in service related to the inability to fund activities. Declines in service are somewhat different between higher- and lower-cost centers. Three higher-cost centers reported declines in professional education or fellowship training, while one lower-cost center experienced a decrease in resident training. Both types of centers, however, mentioned declines in call volumes.
The most often-mentioned organizational challenge the poison control centers face is staff recruitment and retention, particularly for SPIs. Lower-cost centers, all of which serve larger populations, are much less likely to mention low pay as contributing to turnover rates. Higher-cost centers are much more likely than lower-cost centers to describe organizational challenges arising from the complex reporting and conflicting accountabilities of their organizations. Higher-cost centers are more likely to experience difficulties in balancing “core” poison control functions and other functions, such as research and bioterrorism response and preparedness.
Appendix 6-A
Poison Control and Prevention Organizational Interview Questions
GENERAL
In what year was your Center established?
Please describe the current organizational structure of your poison control center, including: size, functional divisions/units, administrative support. Do have an organizational chart that you would be willing to send us?
Describe the governance of your center. Does it have a formally designated board (is it a separate 501(c)(3)? A steering committee? Who sits on the board and how is board composition/membership determined?
Describe how your center has changed organizationally over the past 10 years and what has precipitated those changes.
How has your center changed functionally (e.g., services provided) over the past 10 years and what has precipitated those changes?
STAFFING
Did your poison control center receive support services from volunteers during the most recent complete fiscal year?
Describe the extent of turnover in center staff over the past 5 years. What categories of personnel are most likely to experience turnover and why?
How many consultants or independent contractors, either part-time or full-time, are used to provide poison control and prevention services at your center?
During a typical week, what is the total number of hours that your staff, including consultants, independent contractors, and administrative staff, work at all activities for your poison control center?
What is the total number of hours per week spent by these staff members conducting services other than direct client response, but relating to poison control and prevention? These services may include, for example, outreach activities, community collaboratives, or prevention workshops.
INTERORGANIZATIONAL RELATIONS
In the last 4 years has your center done any of the following: Joined a coalition or association with other centers? Formed a partnership or en-
tered into a joint venture with other groups or organizations? Merged with another poison control center or organization?
What types of services does your poison control center provide to other provider organizations: data analysis, education, consulting, client referrals, other?
Does your poison control center share any services with another poison control center or organization: administrative support services (clerical), information technology, staffing, other?
In the most recent complete fiscal year, about what percentage of your poison control center’s clients were referred by other provider organizations or individual providers?
Of your poison control center’s clients, what percentage are referred to outside providers for additional treatment or services? What are the major services/treatments for which your clients are referred?
SERVICES AND ACTIVITIES
What specific services does your center provide and to what markets or groups (e.g., handling exposure calls, handling nonexposure calls, research, education, professional training, residency training, contract data collection, outreach activities, or prevention workshops)?
How many staff FTEs (or staff hours per week) were assigned to each of these activities/services during the most recent fiscal year?
Which of the activities/services you listed have experienced the most growth in the past 3 years (top 2)?
Which of the activities you listed have experienced the most declines in the past 3 years (top 2)?
AFFILIATION
Is your poison control center private for-profit, private not-for-profit, or public not-for-profit?
Is your poison control center part of a larger organization (through ownership or affiliation)?
Which of the following describe the organization or type of facility that your poison control center is part of? Is it a hospital, an emergency department, a unit of county government, a network or consortium of providers, center, or some other kind of organization?
Does the organization that your poison control center is part of have to approve major management decisions such as those involving programs, services, staffing, or finances?
Describe the reporting/accountability relationship between your center and the entity with which your center is affiliated.
Of all the hours worked by all of your poison control center’s employees each week (including consultants and independent contractors), what percent of total staff hours are typically devoted to nontreatment activities such as administrative work, supervision, hiring or program development, or clerical and support services, such as accounting, billing, and other record-keeping activities?
QUALITY IMPROVEMENT AND ASSURANCE
Does your poison control center use standard, written procedures that indicate steps to follow in dealing with clients—these may be termed “practice guidelines,” “protocols,” or “critical pathways”?
Does your poison control center use case management?
Case management can consist of several different activities. Considering current poison control center clients who receive case management, for about what percent does the case manager:
b1. … conduct a comprehensive assessment of clients’ needs at intake?
b2. … make referrals for clients to receive various services?
b3. … follow up referrals to make sure clients receive services?
b4. … contact clients periodically to check on their progress?
Does your poison control center have a formal written quality assurance plan?
During the most recent fiscal year, what percent of your center’s staff underwent in-service training or took continuing education related to their jobs in the center?
RESEARCH AND TRAINING
How many staff FTEs are assigned to research activities that focus on (a) poison control center service delivery or (2) the use poison control center data (e.g., poison control center case data or comparisons of treatments conducted through the poison control center)?
How many staff FTEs are assigned to staff training (SPI and PIP) and how long does it take to complete the training? How many staff FTEs are assigned to medical toxicology fellowship training?
Is there funding specifically for poison control center research and is it sufficient? Is there funding specifically for staff training and toxicology fellowship training and is it sufficient?
FUTURE
Does your poison control center have a formal written strategic plan, or is the center a part of a larger unit/organization with such a strategic plan?
Other than sustainable funding, what are the most pressing organizational challenges faced by your center currently? What are those challenges likely to be in the future?


