
7
Data and Surveillance
THE NEED FOR DATA AND SURVEILLANCE SYSTEMS
This chapter examines the available data and assessment methodology as it relates to poison control and prevention. We discuss the need for data and surveillance systems, describe the currently available systems, and outline an approach for evaluating the data and surveillance systems.
Information on the epidemiology, treatment, and outcomes of poisonings can help inform regulatory decisions and compliance, public policy initiatives, and the development and assessment of clinical management guidelines. Data from various sources are used by federal, state, and local health agencies and others for surveillance of poisonings and their sequelae. Surveillance generally consists of the systematic and ongoing collection, analysis, and interpretation of health data for use to prevent and control disease (Thacker and Berkelman, 1988). A systematic assessment approach has been proposed by the Centers for Disease Control and Prevention (CDC) (2001a). The approach to evaluating data systems performance recommended by the CDC Guidelines Working Group consists of an assessment of usefulness and a description of system attributes (German, 2001). The attributes are simplicity, flexibility, data quality, acceptability, positive predictive value, representativeness, timeliness, and stability.
Although surveillance systems were originally developed to control communicable diseases, they now play a role in addressing other important problems, including chronic diseases and environmental issues. In
TABLE 7-1 Roles for Data and Surveillance as Applied to Poison Prevention and Control
|
Role |
Uses |
Example |
|
Outbreak/cluster identification |
Public health agencies can assess, then respond with investigation |
Arsenic poisoning in Maine |
|
Implementing and evaluating prevention and control measures |
Examining temporal association of changes in exposures in relation to programs |
Poison Prevention Packaging Act implementation and assessment |
|
Planning and managing resources |
Providing adequate levels of poison prevention service |
Tracking volume of contacts by time and day |
|
Epidemiology, including identification of trends |
Determining prevalence and detecting increases in types of poisonings |
Annual reports of the AAPCC (TESS) |
|
Identification of emerging problems |
Multiple, including environmental and occupational |
Pesticide-related illness and injury |
|
Research |
Assessment of hazard to focus primary and secondary prevention |
Acetaminophen overdose for Nonprescription Drug Advisory Board (September 2002) |
public health, surveillance data can be useful for multiple purposes: (1) identifying and investigating outbreaks or clusters of diseases; (2) implementing and evaluating prevention and control measures; (3) planning and managing resources and establishing priorities; (4) identifying trends in occurrences of interest; and (5) identifying emerging problems or new populations at risk of disease (adapted from Calvert et al., 2001). Each of these types of needs is briefly described in Table 7-1 with examples relevant to poisoning prevention.
CURRENTLY AVAILABLE SYSTEMS
The following section describes the characteristics and the strengths and weaknesses of current data systems, beginning with the Toxic Exposure Surveillance System (TESS) and other poison-specific data sources, and followed by data sources derived from health records and health care datasets, other exposure-related data sources, and survey data sources. Table 7-2 provides a tabular description of these datasets. This review focuses on existing data resources, including national surveys, that have been designed at least in part for epidemiological tracking purposes or
TABLE 7-2 Surveillance Data Sources Relevant to Poisoning and Overdose in the United States
TABLE 7-2A Poison Control-Specific Data Sources
|
Data Source |
Basis of Data Collected |
Data Strengths |
Data Limitations |
|
American Association of Poison Control Centers Toxic Exposure Surveillance System (TESS) |
Cases reported to the poison control centers by public and by health care providers; systematically collected and categorically defined variables. |
Wide range of exposures and case severity; standardized format for data collection; immediate case detection and follow-up possible at local and national levels; access open to public directly. |
Variable geographic coverage nationally; variable penetration within established centers; likely reporting biases in types of exposures and case severity; access to data for independent analysis costly. |
|
Individual poison control center case detection |
Source of case data supplied to TESS, but can also include supplemental information. |
Can be prioritized for local or regional surveillance questions; supplemental data collection can address targeted management strategies; structured case follow-up studies possible. |
Case numbers may be small with limited power; local factors may introduce case reporting biases; resources may be too limited to carry out surveillance activities. |
TABLE 7-2B Data Sources Derived from Health Records or Health Care Datasets
|
Data Source |
Basis of Data Collected |
Data Strengths |
Data Limitations |
|
National Vital Statistics System (National Center for Health Statistics [NCHS]) |
National data derived from death certificates providing principal and contributing causes of death. |
Comprehensive national collection of fatalities; no cost access to data; submission and review of data requests are required. |
Broad categorization of cause by ICD codes; selection biases may impact which specific causes are attributed. |
|
Medical examiner case series |
Cases referred to medical examiners at the county level; data often include toxicological testing. |
Medical examiners series comprise a subset of deaths with greater detail and possible anatomic/ toxicologic confirmation. Research access variable. |
Variable referral patterns and use of toxicological testing; relatively small subset biased to prehospital deaths. |
|
Hospital discharge data at the state level |
Data capturing all hospital discharges within a state. |
Comprehensive data where collected; hospital admission less likely to be “discretionary.” |
Not all states collect and make available; limitations of ICD coding magnified by variable E-code assignment. |
|
Hospital-based emergency department (ED) data at the state level (or participating region) |
Data capturing all emergency department-treated cases within a state (or region). |
Comprehensive data, where collected; excludes other sites of urgent care. |
A minority of states have such data systems; same ICD coding issues as above. |
|
National Hospital Discharge Survey (NCHS) |
Data on hospital discharges from a national sample of hospitals. Selected representative hospitals are chosen and sampling weights assigned. |
Allows national incidence estimates by extrapolation; multiyear pooling and time trend analyses possible; dataset access at no cost. |
Sample may not generate reliable estimates for uncommon events. As above, ICD coding may not allow detailed analysis at desired level of exposure. |
|
Data Source |
Basis of Data Collected |
Data Strengths |
Data Limitations |
|
National Hospital Ambulatory Medical Care Survey (NHAMC) |
Sampling data derived from hospital EDs and associated clinics. Selected, stratified facilities; 4-week sampling period each year. |
Similar data strengths to the National Hospital Discharge Survey. Valuable source for health care cost data. Survey numbers balanced between ED and clinics. |
Similar data limitations to National Hospital Discharge Data. Also has non-ICD global diagnosis codes (e.g., “poisoning” that may capture additional cases). |
|
National Ambulatory Medical Care Survey (NAMCS) |
Sampling data derived from outpatient practice care settings. Selected outpatient clinics in selected states. Sampling of cases over 1 week; physicians comprise the sampling unit (approximate n = 2,400). |
Similar data strengths to the National Hospital Discharge Survey and NHAMC. |
Similar coding limitations to NAMCS; sampling is more limited, with fewer observations than the NHAMC. |
|
Healthcare Cost and Utilization Program National Inpatient Sample |
Survey managed by the Agency for Healthcare Research and Quality. Stratified sample of hospitals that varies year by year. |
Similar data strengths to the National Hospital Discharge Survey. Health care cost focus. |
Dataset can be queried but not downloaded for free; ICD and sample limitations apply; not all states participate; sample size varies. |
TABLE 7-2C Other Exposure-Related Data Sources
|
Data Source |
Basis of Data Collected |
Data Strengths |
Data Limitations |
|
National Electronic Injury Surveillance System (NEISS) All Injury Program |
Survey sample of EDs for nonfatal external injuries and poisoning managed by Consumer Product Safety Commission working with the Centers for Disease Control and Prevention (CDC). |
Sampling design allows national incidence estimates (state-level estimates are not generated); independent coding system focusing on injury provides rich information source. |
Coding may not allow direct comparison to ICD-9 data. Adverse drug effects excluded. Sampled sites are limited in number (n = 64); an additional sample (n = 36) collects more limited NEISS data. |
|
Drug Abuse Warning Network (Substance Abuse and Mental Health Services Administration [SAMHSA]) |
Data extraction for cases of medication toxicity (not limited to drugs of abuse) treated in urban hospital EDs. |
Widely used surveillance source for drug overdose, especially for street drugs. |
Urban settings only in selected EDs. Does not include non-medication-related toxic syndromes. |
|
MedWatch (Food and Drug Administration) |
Consumer or health care provider-initiated reports of adverse drug effects. Pharmaceutical companies are required to report all new or unexpected adverse events. |
Identifies postmarketing effects with mechanism for timely analysis of emerging problems if reported. |
Relies on health care provider initiation of report; obscure or chronic associations less likely to be identified. Dataset can be queried, but not downloaded. |
|
Hazardous Substances Events Surveillance System (Agency for Toxic Substances and Disease Registry) |
State-based surveillance system for hazardous substance release events with a public health impact. |
Uses reporting from a variety of field sources at the state level. Focuses on exposures to the public. |
Only a limited number of states participate; mainly useful for inhalation exposures. |
|
Census of Fatal Occupational Injuries (Bureau of Labor Statistics) |
Multisource census cross-referencing vital statistics, insurance reporting, and inspection data. |
Unique multisource integrated surveillance scheme. |
Focused on source of injury; toxic exposures comprise a small subset of the data. |
TABLE 7-2D Survey Data Sources
|
Data Source |
Basis of Data Collected |
Data Strengths |
Data Limitations |
|
National Health Interview Survey |
National annual health survey. Items on self-reported conditions include poisoning and drug overdose. |
National yearly stratified sample; allows national prevalence estimates; trends over time captured; free downloading of data. |
Cause-specific data for subsets of poisoning limited; local-level data cannot be derived; fatalities not captured. |
|
National Health and Nutrition Examination Survey |
Periodic (not annual) health survey, including physical examination and biologic testing. |
Biological sampling has been a major source of data on lead; expanded analysis for other xenobiotics being developed. |
Stratified sampling of home health-based surveys; not relevant for acute poisoning injury surveillance. |
|
Behavioral Risk Factor Surveillance System (CDC) |
Annual survey focusing on risk factors, with optional added state-level modules. |
Widely used for national estimates of behavior-related risk. Relevant to drugs of abuse. |
Has been only minimally exploited to assess issues related to poisoning injury beyond drugs of abuse. |
|
National Household Survey on Drug Abuse (SAMHSA) |
National survey with extensive batteries related to substances with abuse potential. |
Detailed data with national estimates for the prevalence of use and abuse of selected substances; includes data on overdose events. |
Excludes persons under 12 years of age; does not collect data relevant to poisoning from causes other than substances of abuse potential. |
|
Selected websites: Toxic Exposure Surveillance System (TESS): http://www.aapcc.org/poison1.htm National Vital Statistics System: http://www.cdc.gov/nchs/nvss.htm National Hospital Discharge Survey (NCHS): http://www.cdc.gov/nchs/about/major/hdasd/nhdsdes.htm National Hospital Ambulatory Medical Care Survey (NHAMCS): http://www.cdc.gov/nchs/about/major/ahcd/nhamcsds.htm National Ambulatory Medical Care Survey (NAMCS): http://www.cdc.gov/nchs/about/major/ahcd/namcsdes.htm Healthcare Cost and Utilization Project (AHRQ): http://www.ahcpr.gov/data/hcup/hcup-pkt.htm |
|||
|
National Electronic Injury Surveillance System (NEISS): http://www.cpsc.gov/cpscpub/pubs/3002.html Drug Abuse Warning Network (DAWN): http://dawninfo.samhsa.gov/about/howdawn.asp MedWatch (FDA): http://www.fda.gov/medwatch/what.htm Hazardous Substances Emergency Events Surveillance (HSEES) of the Agency for Toxic Substances and Disease Registry (ATSDR): http://www.atsdr.cdc.gov/HS/HSEES/ Census of Fatal Occupational Injuries (Bureau of Labor Statistics): http://www.bls.gov/iif/oshcfoi1.htm National Health Interview Survey (NHIS): http://www.cdc.gov/nchs/about/major/nhis/hisdesc.htm National Health and Nutrition Examination Survey (NHANES): http://www.cdc.gov/nchs/about/major/nhanes/history.htm http://www.cdc.gov/nchs/nhanes.htm Behavioral Risk Factor Surveillance System (CDC): http://www.cdc.gov/brfss/about.htm National Household Survey on Drug Abuse (SAMHSA): http://www.samhsa.gov/oas/nhsda/methods.cfm |
can be readily exploited for such purposes. It should be acknowledged, however, that electronic medical records systems and automated pharmacy systems not specifically addressed in this chapter also might be used to identify poisoning and drug overdose events, an approach that has been applied to adverse drug events, particularly those occurring during hospitalization (Bates et al., 2003; Honigman et al., 2001; Thurman, 2003). Although these systems may hold promise for future approaches that might augment existing surveillance resources, a review of them—which would require analysis of potential limitations related to sensitivity and specificity, data access and coding, the scope of such systems, and data requirements as they pertain to surveillance for poisonings as opposed to therapeutic misadventure—is beyond the scope of this chapter.
Data Sources Specific to Poison Control
Toxic Exposure Surveillance System
General features When the Surgeon General created the National Clearinghouse for Poison Control Centers (NCHPCC) in 1957, the mandate included coordination of a data collection system, or the flow of information from the poison control centers to NCHPCC. In the absence of funding or regulatory power, NCHPCC hand tabulated the voluntary reports with an annual report and provided product ingredient and treatment summaries on a 5" by 8"card file to the centers, with a lag time of 18 to 24 months. About 150,000 case reports of exposures were reported annually by 150 to 400 centers using another set of cards (3" by 5") with an attached lightweight carbon copy to be retained by the reporting center. Regionalization of poison control center services in the 1970s brought a need for a more detailed, higher-quality data collection system.
In 1983, the American Association of Poison Control Centers (AAPCC) assumed responsibility for the data collection system. It developed a minimum set of data elements and made complete reporting a condition of certification as a regional poison control center. The first annual report from this system included 250,000 exposures and was published in 1984 (Veltri and Litovitz, 1984).
AAPCC has subsequently published exposure data in the American Journal of Emergency Medicine in a standardized (evolving) form each year. With data on approximately 2.4 million exposures from 64 poison control centers in the 2002 report, TESS has accumulated 33.8 million cases (Watson et al., 2003). Although most poison control center exposure calls, by their very nature, are not supplemented by direct review of medical records or specific, direct confirmatory toxicological testing, they include systematically gathered data delineating clinical effects, case severity, and
estimates of exposure levels relevant to dose response. Figure 7-1 shows the variability and repeatability of exposure calls for the past 3 years. TESS data have been used to perform the following functions:
-
Identify exposure hazards
-
Focus prevention efforts
-
Conduct clinical research
-
Direct training programs
-
Prompt and support regulatory actions (reformulations, repackaging, recalls, and bans) (Litovitz, 1998)
Specific uses of TESS in product safety assessment have included:
-
Postmarketing surveillance of newly marketed drugs
-
Routine reviewing to prevent poisoning and limit morbidity and mortality
-
Comparing brands with product categories
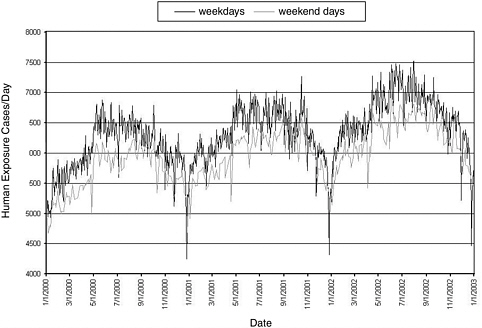
FIGURE 7-1 Frequency of human exposures reported to U.S. poison control centers.
SOURCE: Watson et al. (2003).
-
Demonstrating product safety to regulatory agencies or consumer groups or fulfilling regulatory requirements
-
Limiting animal testing (Litovitz, 1998)
A major benefit in the change from the 3" by 8.5" case report form (CRF) to the current TESS CRF was greater detail in reporting. The extensive coding that evolved over the 19 years of use enables efficient and powerful analyses. No patient identifiers are provided to TESS, thus assuring patient confidentiality. Among the recent changes to the TESS program are:
-
In addition to the encoded fields submitted to TESS, poison control centers must also document each case through a narrative medical record. Guidelines for the narrative portion of the medical record are developed by each poison control center.
-
As of January 1, 2002, all centers were required to submit reports of information (nonexposure) calls to TESS (most centers were already submitting them). Historically, information calls (calls not involving an exposure) did not “count” toward the poison control center’s rate of contacts per population base served (sometimes referred to as “penetrance”) and were not reported by all centers to AAPCC. A concordance observed between information calls and seizures of the same prescription drug (diversion) in the Cincinnati region (Krummen et al., 1999) suggested the use of information calls in detecting and monitoring drug abuse. This observation plus the prospect that information calls might provide an early signal for bioterrorism or other evolving public health events serve as arguments in favor of reporting information as well as exposure calls. Figure 7-2 summarizes data on the frequency of information calls reported to AAPCC from January 2000 through January 2003.
-
By September 30, 2002, all centers were required to submit data to TESS automatically every few minutes (Auto-Upload). This real-time data collection is intended to enhance the value of TESS data for chemical/ bioterrorism detection and for prompt identification of emerging drug and product hazards. The potential value of the real-time reporting is described in the toxicosurveillance discussion that follows.
Most fatality narratives collected in TESS are indirect (poison control center receives data from other health care professionals rather than from direct patient care) and lack external validation. The fatality narratives are used by some pharmaceutical companies to meet regulatory reporting requirements. Because many serious cases involving prescription medications reported in TESS are also reported in MedWatch and other systems, care must be taken to avoid duplication when utilizing multiple datasets.
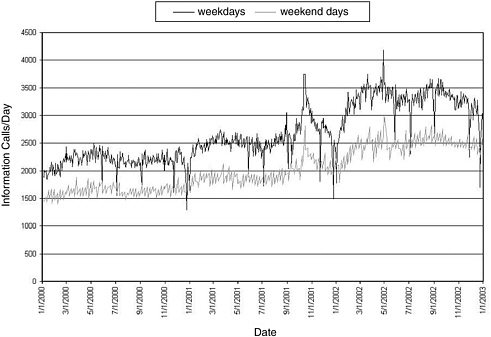
FIGURE 7-2 Frequency of information calls to U.S. poison control centers.
SOURCE: Watson et al. (2003).
The AAPCC “clinical guidelines group” and some AAPCC member centers use the narratives for research purposes. Older abstracts are being added to the fatality database. The AAPCC states that it is planning to support a “text mining system” that could enhance the analysis of clinical effects and therapies embedded in these narrative reports.
Table 7-3 lists the four commercial firms that provide the data capture and data submission software for TESS. Data from 62 of 63 participating centers are submitted to TESS in a prescribed format and are rapidly available for analyses.
Among the essential features of a high-quality data system are definitions of the data elements, setting of standards, and monitoring and reporting of data quality. The 128-page TESS instruction manual (American Association of Poison Control Centers, 2001) contains details of these definitions and standards. The following excerpt is the beginning of the Quality Assurance section in the TESS manual (p. 8):
Maximum acceptable error rates have been set by the AAPCC Board of Directors for most TESS fields (See QF report, Appendix 2). For each of these fields the maximum acceptable rates of invalid, missing and un-
TABLE 7-3 Commercial Providers of Data Capture and Data Submission Software (listed in order of frequency of use by poison control centers)
|
Toxicall® Computer Automation Systems, Inc., 6718 South Richfield Street, Aurora, CO 80016 |
|
DotLab® 1122 East Quincy Avenue, Fresno, CA 93720 |
|
PathTech Software Solutions, Inc. 6601 Southpoint Drive North, Suite 200, Jacksonville, FL 32216 |
|
CasePro St. Anthony Main, 219 Southeast Main Street, Suite 306, Minneapolis, MN 55414 |
known data have been specified. Each participating center receives a quality report at least annually, with a summary quality factor. High error rates lead to a reduction in a center’s quality factor. Submission of data containing <75 percent product specific data likewise leads to a reduction of this factor. High quality factors are obtained by meticulous history-taking and coding and by editing and recoding rejected cases.
Such attention to data quality and routine monitoring contribute substantially to the quality of the TESS data. The training and commitment of the specialists in poisoning information and poison information providers who manage the calls and enter the data represent a major strength of TESS.
Each product reported in TESS is linked to a product-specific code contained in the Poisindex® system (Thomson MICROMEDEX, Greenwood Village, Colorado). Poisindex maintains (and updates) the product codes and provides them at no cost to the poison control centers and AAPCC. In practice, it appears that all U.S. poison control centers subscribe to Poisindex, but generic codes are available, so that theoretically the centers are not required to subscribe to Poisindex to submit data to TESS.
Toxicosurveillance Toxicosurveillance involves the identification of sentinel events that may represent emergency nonexposures such as intentional bioterrorist events or other toxin or chemical exposures. The Auto-Upload feature described earlier allows each poison control center to
provide case data to TESS every 4 to 10 minutes. To assist in improving public health surveillance, CDC’s National Center for Environmental Public Health, the Agency for Toxic Substances and Disease Registry (ATSDR), and AAPCC are working to utilize this new feature to convert TESS into a real-time public health surveillance system. This conversion has the potential to generate more immediate and appropriate responses to public health threats that may be related to toxins or chemicals in the environment. On a pilot basis at present, these federal agencies are using TESS for continuous national toxicosurveillance of poison control center data to detect new hazards. Figure 7-3 shows an example, using cases of calls about contaminated water, of how center data may be analyzed and displayed to detect exposure excesses (Watson et al., 2003). It illustrates the detection prospects for the real-time data system even without the application of signal detection algorithms.
In addition to the national toxicosurveillance effort performed in conjunction with AAPCC, some poison control centers participate in local syndromic surveillance and report notifiable conditions affecting multiple individuals to local and/or state health officials. For example, the Minnesota Poison Control System, in cooperation with the Minnesota Department of Health, provides active surveillance to detect infectious
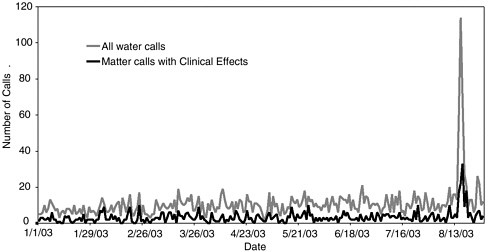
FIGURE 7-3 TESS—water and contaminated water—total and cases with any clinical effects.
SOURCE: American Association of Poison Control Centers TESS program and participating poison control centers.
disease outbreaks and chemical events (http://www.mnpoison.org/index.asp?pageID=194). Poison control centers can conduct active and passive toxicosurveillance and identify sentinel events. To be effective, center staff must be knowledgeable about biological and chemical agents, participate in standardized staff education programs, and utilize protocols, as appropriate. Funk et al. (2003) have described some approaches to using TESS data in the detection of chemical terrorism events. Information calls, for example, may provide a sensitive early indicator and exposure calls reporting symptoms may provide more specific indicators of a bioterrorist event. Some combined analyses of exposure and information calls will probably be developed for each toxicosurveillance application.
Surveillance at the Individual Poison Control Center Level
Beyond AAPCC’s national system, TESS data collected at the level of individual poison control centers have independent relevance for surveillance. Based on analysis of published studies originating from poison control centers, the surveillance uses of local or regional center data generally fall into one of three categories:
-
Review of the data collected through routine case consultations to the poison control centers. These data include part or all of the structured variables comprising the TESS database, but may also include additional information solicited from the case contact during initial and follow-up calls (i.e., data that are unique to the regional poison control center).
-
Review of the same retrospectively identified data, supplemented with additional clinical information usually garnered through medical record review or, in certain cases, through special toxicological testing facilitated by the poison control centers as part of a study. It should be noted that TESS uses a similar approach at the national level in its supplemental surveillance summaries for fatal poisoning cases.
-
Use of poison control center reporting for initial, specific case detection, with a structured approach to obtain further data (often prospectively), either from the exposed person or from health care providers.
Activities falling into the first category of poison control center surveillance are documented by a number of publications focusing on specific exposures or poisoning syndromes. Some of the exposures have had particular regional prominence, consistent with a focus of surveillance specific to a single center or cluster of centers. Examples include:
-
Illness among tobacco harvesters related to transdermal nicotine absorption (McKnight et al., 1994);
-
Envenomations (Brubacher et al., 1996);
-
Food-related toxins, geographically concentrated (Barton et al., 1995; Pond et al., 1986); and
-
Impact of a local natural disaster on poison control center operations (Nathan et al., 1992).
Although such case series and surveillance studies have been predominantly descriptive in nature and are based on local or regional data, they can focus on topics of general applicability, such as occupational illness or geriatric health (Blanc and Olson, 1986; Kroner et al., 1993). In addition to a regional perspective, this category of surveillance has the advantages of being relatively low cost (the internal data are freely available to the poison control centers) and supportive of collaboration with local and state public health authorities. A major drawback to this data source is the possibility of small sample size, case selection biases (often magnified by local factors), and the limitations of passively collected data. These limitations can be overcome, in part, through multicenter collaborations (McIntrie et al., 1984; Seifert et al., 2003; Spiller and Krenzelok, 1997).
Poison control center surveillance activity in the second category (supplementation of core TESS-formatted data with additional clinical case records or targeted toxicological data) is most frequently available through peer-reviewed publication of case reports or small case series of poisonings. Because the TESS-formatted dataset may not be as complete as that of a full medical record, such case reports and series typically reflect the poison control center consultation supplemented with additional information extracted from inpatient or outpatient charts. Often, these reports represent collaborations between center staff and health care providers outside the center. They can be valuable insofar as they serve to document and disseminate information on novel exposures or unusual manifestations of established toxins. Examples of such surveillance have included emerging issues such as gamma-hydroxybutyrate abuse (Dyer et al., 2001), metabolites in herbal toxicity (Anderson et al., 1996), and metabolic complications of acetaminophen (Roth et al., 1999).
In addition to case reports and series, this category of surveillance has also included the tracking and evaluation of clinical management interventions, such as a study of the predictors of use of head CT scanning in overdosed patients and its impact on management (Patel et al., 2002). This type of surveillance activity can also have elements of a noncontrolled clinical trial, such as a center-based report on clinical outcomes following introduction of a protocol for nebulized bicarbonate to treat chlorine inhalation cases (Bosse, 1994). The value of these surveillance activities includes the detection and dissemination of data on emerging hazards in a
fairly rapid time frame; the tendency to strengthen collaboration between center-based personnel and community-based providers (through coauthored reports); and the initial evaluation of novel approaches to clinical management. Limitations include the potential reporting biases inherent in case reports, the observational noncontrolled nature of the clinical management studies (often invoking historical controls for comparison), and the likely chilling effect that the Health Insurance Portability and Accountability Act (HIPAA) restrictions will have on merging poison control center data with supplemental information derived from medical records.
The third category of poison control center-based surveillance, using case reporting as a starting point for subject recruitment for additional direct data collection or follow-up, is less common. This approach frequently collects survey data beyond the TESS format. Examples include center-based studies of occupational poisoning (Blanc et al., 1989, 1990), inhalation injuries (Blanc et al., 1991, 1993a), ocular exposure outcomes (Saunders et al., 1996), herbal supplement effects (Palmer et al., 2003), and outcomes of snake envenomation (Spiller and Bosse, 2003). This type of surveillance has the advantage of prospective detailed data collection targeted to a specific set of study questions and therefore has some aspects of an active rather than a passive surveillance approach. Limitations include the need for substantial supplemental personnel effort with associated costs, often requiring supplemental funding through extramurally funded research support. Because many poison control centers do not have a research-oriented infrastructure, this category of surveillance is typically beyond their capabilities.
Data Sources Derived from Health Records and Health Care Datasets
As shown in Table 7-2, a number of different datasets with vital statistics or health care information derived from medical records can be used for poisoning and drug overdose surveillance purposes.
National Vital Statistics System
National mortality data have provided a particular focus for surveillance analyses relevant to poisoning and drug overdose (Chyka and Somes, 2001; Cobb and Etzel, 1991; Fingerhut and Cox, 1998; Hoppe-Roberts et al., 2000; Klein-Schwartz and Smith, 1997; Shepherd and Klein-Schwartz, 1998). One major source for such data is the National Vital Statistics System of CDC’s National Center for Health Statistics (NCHS). These data are derived from death certificates and include listed primary and contributing causes of death designated by ICD-9 codes (including
relevant external cause of injury codes) through 1998 and ICD-10 codes thereafter. A number of peer-reviewed scientific publications have analyzed national mortality data from a poisoning surveillance perspective.
The advantages of this system are that it is national, comprehensive, and accessible (free online from 1981 onward, although requests for data analysis may need to be submitted in advance; nominal charges for earlier data tapes). In comparison with TESS surveillance:
-
Death certificate-derived data capture far greater numbers of fatal poisonings and drug overdoses, in part because prehospital fatal poisoning events are unlikely to lead to poison control center consultations (Hoppe-Roberts et al., 2000).
-
Mortality related to drug abuse is also underreported through TESS relative to death certificate-based data.
-
Causal attribution among medical examiners has variable precision depending on practices in toxicological assaying, thus limiting the value of vital statistics mortality data.
-
Identification of toxins for targeted surveillance purposes may be limited because the cause of death is available only by ICD-9- (or ICD-10-) defined categories (e.g., determining the species of mushroom or venomous snake involved; differentiation between methyl bromide and phosphine in fatal fumigant injuries; identifying hypochlorite bleach-acid mixing misadventures).
-
Product identification beyond general classes, even through supplemental E-code inferences, is usually not possible using death certificate data.
-
Correct attribution of intention using death certificate data is also fraught with difficulty.
Medical Examiner Case Series
Death certificate data can also be analyzed for poisoning surveillance at the local and state levels (Blanc et al., 1993c, 1995; Cone et al., 2003; Davidson et al., 2003; Landen et al., 2003; Linakis and Frederick, 1993; Soslow and Wolf, 1992). At these levels it may also be possible in some areas to exploit medical examiner-reviewed cases for surveillance purposes. Medical examiners’ series are likely to be enriched for cases confirmed by toxicological testing. Narrative case files can provide a rich source of detailed information that is not available through death certificate data. Even summary data in annual medical examiners’ reports are likely to provide a rich source for surveillance purposes. Many poisoning fatalities are not captured by medical examiner datasets, however, with a likely bias of underreporting for deaths that occur in an in-hospital setting
(Landen et al., 2003; Linakis and Frederick, 1993; Soslow and Wolf, 1992). Thus medical examiner data are not entirely captured in death certificates, while death certificate data include a far greater number of cases than those in medical examiner series.
Hospital Discharge Data Systems
Hospital discharge data systems (HDDS) at the local, regional, or state level represent a major source of health care data that potentially can be used for poisoning and drug overdose surveillance purposes (Agran et al., 2003; Hoyt et al., 1999; King, 1991; Smith et al., 1985, 1991; Sumner and Langley, 2000). The assignment of ICD-9 codes (routine and E-codes) draws on the direct medical evaluation documented in the hospital record. Hospital admission for poisoning or drug overdose can be presumed to be reasonably complete because a patient with a life-threatening poisoning or drug overdose is likely to be admitted to a hospital and included in this dataset regardless of health insurance status. Another strength of HDDS data is that, like death certificate vital statistics, the data are comprehensive for the states in which they are collected. Nonetheless, HDDS is not national and universal. As of 1998, 42 states collected such data. However, the consistency of E-coding was more variable, with only 36 states collecting some ICD-9 E-code data as part of their HDDS; less than half the states mandated such coding (American Public Health Association, 1998). To the extent that poisoning is a comorbid condition displaced within a longer list of diagnoses, it may not be captured in summary data. Iatrogenic causes of medication toxicity may be preferentially down-graded or obscured in such records.
The HDDS data exclude cases treated in an emergency department and discharged. Hospital-based emergency department data systems (HEDDS) exist, but they are limited. As of 1998, only 12 states had these systems in place. However, additional states reported plans to add similar systems. Once again, E-coding in these systems is variable. The data collection systems do not include freestanding urgent care centers or other outpatient treatment centers. As of 1998, only four states had a non-emergency department, statewide outpatient data system. The extent to which HDDS and HEDDS data are publicly available with minimal or nominal charge and the lag time between data collection and public data access vary by state. The potential limitations of ICD-9 nosology apply to HDDS and HEDDS data and are likely to be magnified by E-code deficiencies. Both the HDDS and HEDDS datasets are comparable to vital statistics death certificate data in that they are meant to capture all of the eligible events within the geographic areas they cover.
Sample-Based Health Care Data
Some datasets provide health care data derived from sampling methods. These datasets are not universal; rather, they are based on selected numbers of events. Depending on the sampling approach used, total prevalence or incidence estimates can be generated.
NCHS oversees three national sampling surveys of health care utilization that contain data relevant to poisoning injuries. These are:
-
National Hospital Discharge Survey (a national sample of hospital data);
-
National Hospital Ambulatory Medical Care Survey (a national sample of hospital-based emergency departments and ambulatory care centers); and
-
National Ambulatory Medical Care Survey (a national sample of outpatient visits).
In addition to NCHS’s National Hospital Discharge Survey, the Agency for Healthcare Research and Quality (AHRQ) oversees its own hospitalization survey, the Health Care Cost and Utilization Program National Inpatient Sample. Because these are all designed as representative, weighted samples, each survey can yield national estimates of health care utilization. The datasets include ICD-9 condition codes and are available electronically for downloading free of charge (free query of the dataset without downloading in the case of AHRQ). Because these survey data are collected annually with consistent sampling methods, they allow data merging across years as well as surveillance tracking of trends over time. Several of these datasets are particularly relevant to developing estimates of direct health care cost. Despite their potential as a rich surveillance data source, relatively few peer-reviewed research publications have exploited these surveys for poisoning and drug overdose surveillance purposes (Klein-Schwartz and Smith, 1997; McCaig and Burt, 1999; Powell and Tanz, 2002; Rodriguez and Sattin, 1987).
The datasets face the same ICD-9 coding limitations discussed in relation to death certificate national vital statistics data. Moreover, because they are based on samples, uncommon events may be undetected or have few sampled observations with a wide margin of statistical error. Combining survey years can sometimes, but not always, address this shortcoming. Because of the sampling design, estimates for discrete geographic areas (e.g., at the state level) usually cannot be generated from these surveys.
Other Exposure-Related Data Sources
The previously described datasets capture poisoning injury as a small proportion of their overall surveys. In addition to these resources, there is an ongoing survey of health care utilization specific to injury, the National Electronic Injury Surveillance System (NEISS). This system was initiated by the Consumer Product Safety Commission (CPSC) to capture consumer product-related injuries (including poisonings). NEISS relies on data collected from a stratified national probability sample of 100 hospital emergency departments, with datasets available for electronic query at no cost dating from 1991.
In 2000, the NEISS program was expanded (in collaboration with CDC’s National Center for Injury Prevention) to include nonfatal injuries from all external causes (Centers for Disease Control and Prevention, 2001a, 2003). This expanded All Injury Program (NEISS-AIP) is based on data from 66 of the 100 NEISS hospitals. As with the parent survey, NEISS-AIP also yields nationally extrapolated incidence data. Although NEISS-AIP captures a wider range of cases than the parent survey, it excludes cases of adverse effects from therapeutic drugs or medical care. Thus it would not include data on safety packaging for pharmaceuticals, for example, even though CPSC has jurisdiction in this area. Although the collection system does not exclude fatal injuries, these cases are excluded from directly available summary data and most published analyses of NEISS.
NEISS has been used to a limited extent for surveillance purposes specific to poisoning injuries (Henneberger et al., 2002; Woolf and Shaw, 1998). Because NEISS is injury focused, it has employed its own non-ICD-driven coding scheme, with more targeted and detailed information on cause and intentionality than can be derived from the other datasets described previously. Although such detail may be useful, it can also be a limitation because it complicates direct comparison with data derived from these other datasets. Multiyear data are available for NEISS; NEISS-AIP is relatively new.
Several databases derived from focused data collection activities are also relevant to specific aspects of poisoning injury surveillance. The Drug Abuse Warning Network (DAWN) is a surveillance program overseen by the Substance Abuse and Mental Health Services Administration (SAMHSA). DAWN has two components. Reporting through one DAWN system draws on emergency department chart extraction from a national sample of hospitals with oversampling in selected metropolitan areas (U.S. Department of Health and Human Services, 2003). Case eligibility is not limited to drugs of abuse; it also includes cases treated for adverse effects attributed to prescription and over-the-counter medications. None-
theless, its primary surveillance use has been applied to issues of illicit drug effects. Sampling is meant to capture any medical complication related to acute or chronic abuse (e.g., infection) and not simply direct drug toxicity consistent with poisoning ICD classifications. Children under age 6 are excluded. This DAWN program can provide national estimates.
The second DAWN program consists of collection of information based on medical examiners’ or coroners’ case data from 128 jurisdictions in 42 metropolitan areas (U.S. Department of Health and Human Services, 2002). Case eligibility is limited to illicit drugs or drugs used for nonmedicinal purposes (although this can include suicide as such a purpose) as a principal or a contributing cause of death. This DAWN system does not include a national probability sample and thus cannot yield national estimates. The metropolitan base may be a source of other biases (e.g., cases of amphetamine overdose treated in nonurban settings would not be captured by this surveillance system).
MedWatch, a program maintained by the Food and Drug Administration (FDA), is another example of a specialized surveillance activity that can be highly relevant to a subset of poisoning injuries (Chyka, 2000). Through MedWatch, the FDA monitors medical products, including prescription and over-the-counter drugs, biologics, medical and radiation-emitting devices, special nutritional products (e.g., medical foods, dietary supplements, infant formulas), and medication errors. Reporting to MedWatch’s Adverse Events Reporting System is mandatory for manufacturers and voluntary for health care providers and the public. Reports can be submitted via mail, telephone, fax, or the Internet. These reports are then available to staff in the appropriate FDA center for evaluation. MedWatch focuses on unexpected and serious adverse events (i.e., death, life threatening, requiring or prolonging hospitalization, resulting in disability, congenital anomaly, or requiring therapeutic intervention). It is particularly valuable for new drugs because adverse event information for these agents is limited to the patients exposed during clinical trials. The FDA uses this information for signal (hypothesis) generation, subject to mechanisms to verify potential exposure-disease associations. MedWatch is likely to underrepresent delayed adverse effects. Health care provider reporting may be influenced by concerns over liability related to adverse events. Illicit drug use and nondietary substances are not well represented in MedWatch. MedWatch has been relatively underexploited as a surveillance tool in published research reports (Bennett et al., 1998; Chyka, 2000).
MEDMARX is a voluntary, Internet-accessible, anonymous medication error-reporting program that allows a selected number of subscribing facilities to access and share information. The United States Pharmacopoeia (USP) operates MEDMARX, which contains more than
580,000 released records (United States Pharmacopoeia, 2002). This program’s relevance to poisoning and drug overdose surveillance systems is limited given that it is a voluntary, subscription-based method for reporting (no public access for analysis), weighted heavily to therapeutic misadventures.
The Hazardous Substances Emergency Events Surveillance system is a state-based program managed by the Agency for Toxic Substances and Disease Registry. As of 2002, the ATSDR compiled data detailing hazardous substance emergencies derived from 15 states. Although the primary unit of analysis in this system is the release event, details on the number of persons affected and associated health care utilization are obtained. The data in this system are most relevant to airborne releases, particularly of irritant gases (Berkowitz et al., 2003; Horton et al., 2002; Orr et al., 2001; Weisskopf et al., 2003).
A specialized surveillance dataset of potential interest is the Census of Fatal Occupational Injuries, maintained by the federal Bureau of Labor Statistics (BLS) (Valent et al., 2002). The goal of this system is to capture all occupationally related fatalities in the United States, including cases resulting from toxic exposures. This dataset is notable in that it includes data from all 50 states and attempts to integrate and cross-check data from multiple sources, including death certificate data, workers’ compensation insurance claims, Occupational Safety and Health Administration (OSHA) fatality reports, and media reports. BLS also oversees two national surveys for nonfatal occupational injuries; one survey is based on a sample of workers’ compensation claims and the other on OSHA-mandated injury forms. Neither system is effective in detecting toxin-related events; thus, each is marginal in relation to poisoning surveillance generally.
Survey Data Relevant to Poisoning and Drug Overdose Surveillance
In addition to data derived from poisoning and drug exposure sources and from general vital statistics and medical encounters, national survey data are also relevant to poisoning surveillance. Of these, the most comprehensive is the annual National Health Interview Survey (NHIS). This survey, based on an extensive national stratified random sample, generates data on poisoning through a series of injury-related items asked of all survey recipients. Beginning in 2000, coverage was expanded to better capture poisoning events. Items address the general nature of the exposure as well as some details of circumstances involved, including whether a poison control center was contacted. Only limited analyses of poisoning data derived from NHIS have been published by independent investigators (Fleming et al., 2003; Polivka et al., 2002).
The National Health and Nutrition Examination Survey (NHANES) is a periodic, but not an annual, national survey that includes a direct physical examination and biological testing, in addition to interviewing. Although not relevant to acute poisoning, this survey has provided pivotal data for national lead exposure paint prevalence and time trends. More recently, NHANES biological sampling data have been used to assess exposure to a variety of xenobiotic chemicals.
CDC also oversees several other surveys that may have tangential relevance. The Behavior Risk Factor Surveillance System provides a platform for added modules of survey items that can be used by the states. In 1992, some states employed a module asking whether respondents have the telephone number for the poison control center in their area and whether they keep syrup of ipecac in their home. Two Injury Control and Risk Surveys (ICARIS) have been carried out: ICARIS I was conducted in 1994 and ICARIS II in 2003. The ICARIS II survey included a single poisoning-related preventive care survey item ascertaining whether a child’s treating physician had provided the family with poison control center contact information. The Youth Behavior Risk Factor Surveillance System survey has ascertained drug abuse, but has not elicited general information on poisoning.
Outside of NCHS and other CDC branches, the public interview survey most relevant to poisoning and drug overdose is SAMHSA’s annual National Household Survey on Drug Abuse. In addition to illicit drugs, this survey addresses a variety of prescription and nonprescription medications with abuse potential, but does not collect data on poisoning or adverse drug effects generally (Kozel, 1990; Rouse, 1996). The survey is not limited to adults, but does exclude persons under 12 years of age.
COMPARISONS AMONG SURVEILLANCE SYSTEMS
There is no published systematic review of surveillance data sources for poisoning and drug overdose in the United States, although one relevant abstract was recently presented on this topic (Gotsch and Thomas, 2002).
A number of pairwise cross-comparisons have been made, particularly in relation to standard poison control center case detection through TESS. The most frequent comparison has been between poisoning deaths detected through vital records or medical examiner surveillance and deaths recorded through TESS-derived data (Blanc et al., 1995; Hoppe-Roberts et al., 2000; Linakis and Frederick, 1993; Soslow and Wolf, 1992). These analyses have consistently observed that TESS surveillance detects only a fraction of the fatal cases—approximately 1 of 20. Although the fatal cases reported in TESS have been reviewed by the medical director
of the reporting poison control center, inadequate data are provided to demonstrate cause and effect. This is because the case information is secondary from hospital or other sources and the center rarely has access to complete case data. TESS data are therefore most useful as a signal along with other data sources, but cannot be utilized for policy making. This problem is exacerbated under HIPAA regulations, which decrease information flow to the poison control center once the patient has been admitted to a health care facility. In addition, the characteristics of the fatal cases differ proportionally for variables such as intent, type of poisoning, and demographics. Although one source of underreporting by TESS is attributable to out-of-hospital deaths, there is also substantial underreporting for fatal hospitalized cases. Despite the smaller numbers, there are also fatal cases detected through TESS surveillance that are not detected by death records. Comparison between death certificate data and medical examiner data has shown that these sources do not wholly overlap (Landen et al., 2003; Linakis and Frederick, 1993; Soslow and Wolf, 1992). A single study of fatal cases in the MedWatch system also found poor overlap with death certificate data (Chyka, 2000).
Direct review of hospital charts has demonstrated that only about 20 to 30 percent of poisoning cases managed in the emergency department are reported to poison control centers (Blanc et al., 1993b; Harchelroad et al., 1990; Hoyt et al., 1999). Successful case detection of medically treated cases by the DAWN system appears to be in a similar range (Roberts, 1996). In contrast with these patterns, surveillance based on the National Health Interview Survey yielded lower population estimates for poisoning incidence than those derived from TESS data (Polivka et al., 2002). This analysis was limited to pediatric cases ages 5 and younger.
Linkages among the various datasets are limited. The United States does not have a universal identification number that is used in medical records and surveys allowing for interlinking of disparate datasets. Although such linkages are desirable, no such identification system is likely to be developed and applied in the foreseeable future.
The available data suggest that no single surveillance source can provide a universal data source from which to draw a complete picture of all aspects of poisoning and drug overdose morbidity and mortality. The strengths and limitations of each source should be taken into account in interpreting surveillance data.


