
3
Magnitude of the Problem
The purpose of this chapter is to provide an overview of the occurrence of poisonings in the United States and to describe the distribution of poisoning reports in terms of a variety of demographic characteristics such as age, gender, and race. To provide such an overview, the chapter will also present a working definition of poisoning and drug overdose, highlighting the epidemiological implications of inclusion and exclusion of various categories of events from this classification. Even if definitions vary (as will be discussed in the following section), poisoning is an important problem of national scope. As noted in Chapter 1, more than 2 million people contact poison control centers annually for advice on poisoning exposures (Watson et al., 2003). In addition, poisoning is a leading cause of injury-related morbidity and mortality in the United States. The total health care costs associated with poisoning (see Chapter 6) are also substantial.
Temporal trends may affect the societal impact of poisoning and drug overdose in a variety of ways, given that the U.S. population is growing larger, older, and more ethnically diverse. Changing ethnic distributions, marked by an increasing proportion of Hispanics and Asian Americans, and an increasing proportion of the elderly population (http://www.census.gov) are important considerations for the future of poison prevention and control, particularly in light of research indicating that these groups have been relatively underserved by the existing poison control system (Kelly et al., 1997, 2003). Providing effective access to care for ethnically diverse groups will require overcoming both cultural and lan-
guage barriers. In addition, culturally related health practices—including patterns of self-treatment with potentially hazardous herbals or other complementary (alternative) medications—may be directly relevant to poisoning prevention and treatment.
For all these reasons, accurate data are key to delineating the magnitude of the poisoning problem, yet there is no single source of incidence data that fully illuminates this picture. Figure 3-1 provides a schematic representation of the universe of poisoning and drug overdose and the relationships among mortality, poisoning resulting in hospitalization (that may or not result in death), and cases that come to the attention of poison control centers, emergency departments, and private physicians (that may or may not lead to hospitalizations). This diagram illustrates that within the universe of poisonings, there is likely to be varying overlap between poisonings captured in different service delivery and data surveillance systems (see Chapter 7). It is largely for this reason that no single data system captures the totality of these data. Thus, the following sections will describe data on poisoning and drug overdose incidence derived from key primary sources. Furthermore, we will attempt to integrate the estimates they yield to provide an overall picture of the magnitude of the problem.
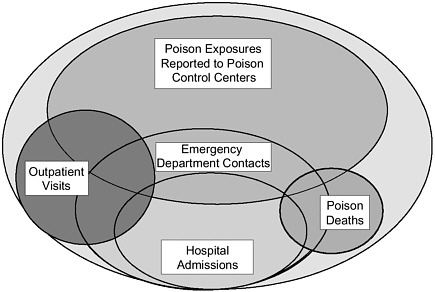
FIGURE 3-1 Poison exposures in the United States.
NOTE: Not drawn to scale.
Defining Poisoning
A fundamental challenge in estimating the magnitude of poisoning and drug overdose is delineating the types of conditions that should be included under this rubric. It is important to acknowledge that there is no standard definition of poisoning that is universally accepted and applied in clinical practice, in data collection, and in public health policy setting. Even within data collection systems, different definitions of eligibility for the purposes of case reporting may apply in various surveillance schemes (see Chapter 7).
In clinical terms, human poisoning subsumes any toxin-related injury. Such injury can be systemic or organ specific (e.g., neurological injury or hepatotoxicity). As important, the source of the toxin can be a synthetic chemical or a naturally occurring plant, animal, or mineral substance. Thus poisoning can include the toxic effects of a classic toxin (e.g., cyanide), an overdose of a prescription medication (e.g., an antidepressant), or an overdose of an over-the-counter preparation (e.g., headache tablets) or a complementary treatment (such as an herbal medicine or dietary supplement).
Although defining the foregoing events as poisoning is fairly straightforward, other classes of exposure may fall in or out of different classification schemes. “Envenomation” from a rattlesnake or a black widow spider clearly falls within the clinical context of poisoning and, therefore, is covered in depth in standard toxicological texts (Goldfrank et al., 2002; Olson et al., 2003). Envenomation may also overlap in some categorizations, however, with insect stings or “bites” that might not be considered toxic, but may be complicated by allergic responses, including fatal anaphylaxis.
A parallel set of issues is associated with medication responses that may not be dose related, but instead are idiosyncratic, with or without an allergic component. Clinical definitions of poisoning generally take into account unusual toxic responses that may involve susceptible subpopulations (e.g., toxic responses related to alternative metabolic pathways clinically relevant in only a subset of the population). Although this may overlap with the mechanisms of other types of poisoning, many definitional schemes separately tally or exclude altogether illnesses defined as adverse therapeutic events, such as drug toxicity that results from multi-drug interactions, increased susceptibility or true allergic sensitivity, or dosing error, all of which can be classified as “adverse drug effects.”
The toxic effects of ethanol present a specific set of definitional challenges. Acute ethanol toxicity in the context of frank overdose (e.g., rapid ingestion of a large amount of alcohol in a naïve drinker) can be lethal.
Ethanol withdrawal is also associated with severe morbidity and mortality (see Osborn, 2004). Nonetheless, the frequency of acute and chronic ethanol intoxication and the myriad complications that may result from or be associated with ethanol ingestion complicate the use and interpretation of the designation “ethanol poisoning” as it may pertain to the overall incidence of poisoning and drug overdose.
Illness from naturally occurring toxins derived from microorganisms can also lead to definitional confusion. Seafood-related toxins whose ultimate source was from microorganisms, such as those causing paralytic shellfish poisoning, are typically categorized as poisons. In contrast, bacterially derived toxins may or may not be categorized in this manner. In practice, the diagnosis and management of botulism, tetanus, and, more recently, anthrax, has been considered to be a form of “poisoning” relevant to the discipline of clinical toxicology, although these illnesses are not included in most epidemiological definitions of poisoning.
Lay definitions of poisoning are also relevant because they can drive health-care-seeking behavior and self-reporting of conditions, both of which can impact incidence estimates. Lay terms such as “food poisoning” (which could reflect an infectious gastroenteritis or a toxin-related condition), “poison oak” (a form of allergic contact dermatitis), and even “sun poisoning” (which could refer to sunburn or heat stroke) do not conform to biomedical concepts of poisoning, but may still be unavoidably captured in some incidence estimates.
Factors of intent, that is, whether an exposure occurred with the purpose of causing a toxic response, do not define poisoning per se, but these factors may impact how such events are reported. Defining adverse events associated with drugs of abuse is a particularly salient issue in this regard. For example, some events may or may not be categorized as a poisoning or drug overdose by health care providers, depending on whether the presenting medical complaint is viewed as an intended end-point effect.
Toxin exposure without an attributable and defined or discrete clinical effect presents yet another source of heterogeneous definitions. The absence of a documented clinical effect may reflect the true absence of a substantive exposure (e.g., a person seeking health care because of a potential for exposure to a toxin or because of exposure to a substance perceived to be dangerous by the lay public that has little or no actual toxicity); a subtle effect that may not be manifest by acute symptoms but may have serious long-term potential effects (e.g., a body burden of lead elevated above the population norm); or circumstances that do not allow determination of a causal relationship (e.g., postmortem carbon monoxide determination in a burn victim with both fire and smoke exposure). Although the standard definition of clinical poisoning does not include exposure without disease, the importance of these scenarios in terms of
primary, secondary, or tertiary prevention (see Chapter 8) is clearly relevant to the overall magnitude of the poisoning problem.
Definitions Used in This Report
The following analyses attempt to be consistent in the coding that has been used to categorize the poisoning estimates derived and to highlight areas in which there are substantive differences in coding or case definition that might be likely to affect the estimates provided. Further methodological details and a discussion of the coding of poisoning and drug overdoses are also provided in Appendix 3-A. All ICD-9 (International Classification of Diseases—9th edition) defined morbidity estimates have used a definition of poisoning and drug overdose that includes envenomations of all kinds (including insect stings). All ICD-9 estimates exclude the specific category of “ethanol toxicity,” but include other alcohol types, such as methanol.
In contrast, the ICD-10 mortality analysis includes ethanol deaths, but breaks out this subtotal in key tabular presentations. Another key difference is that the ICD-10-based mortality analysis excludes envenomation-caused mortality of all types (snakebite mortality is rare in the United States; bee sting anaphylaxis is also excluded). This analysis also yields one other specific estimate of fire and smoke deaths in which carbon monoxide toxicity was listed as a contributing cause. Both the ICD-9 and ICD-10 derived estimates excluded therapeutic misadventure and adverse drug reactions.
There is no defined grouping of ICD codes that establishes a single category subsuming all poisoning events. In theory, the multiple coding options allow choice in defining poisoning based on the specific codes selected. In practice, the level of resolution provided by certain codes may not allow for discrimination within certain subcategories of toxins.
A limited number of analyses also allow for the side-by-side examination of two coding schemes, one based on the ICD-9 system and the other based on a narrative descriptor of the patient’s chief complaint related to the event in question. For consistency, these analyses relied on the ICD-9 codes for case definition and neither included nor excluded cases based solely on these supplemental narratives. They are presented, however, in part to demonstrate how definitions and terminology may cloud interpretation of “poisoning” incidence. Detailed study of the patterns of overlap between the narrative “chief complaint” for patient visit and its categorization as coded by an ICD-9 code was beyond the scope of this analysis. Follow-up study of the sensitivity and specificity of the “chief complaint” nosology may be relevant to a larger review of potential approaches that might be used by the National Center for Health Statistics (NCHS) in
revised survey methods to estimate poisoning and drug overdose incidence.
EPIDEMIOLOGY OF POISONING
Estimating the incidence of poisoning is a complex and difficult exercise. First, in order to gain a general understanding of the magnitude of the poisoning problem, the Committee commissioned a paper on the epidemiology of poisoning. Cisternas (2003) provides annual estimates of poisoning incidence through an analysis of data from multiple sources available for public use through NCHS. These data were used to generate annual estimates of overall incidence as well as annual incidence stratified by age, gender, race, and geographic region. In addition, level of medical care received and outcome status (where available) were used as an indirect severity measure. Second, summary data for total incidence from two additional data sources were also included to supplement a final tabulation of morbidity and mortality. These supplemental summary totals were derived from the American Association of Poison Control Centers’ (AAPCC’s) annual Toxic Exposure Surveillance System (TESS) data report and the Centers for Disease Control and Prevention (CDC)-Consumer Product Safety Commission (CPSC) National Electronic Injury Surveillance System (NEISS). Finally, in order to characterize poisoning and drug overdose deaths, a separate analysis of U.S. mortality data was carried out by Lois Fingerhut of CDC’s NCHS (Personal communication, L. Fingerhut, December 2003). These data were analyzed by demographic and geographic strata, as well as type and intent of poisoning.
Data Sources
Four core data sources were used in the first part of the analysis. Wherever possible, multiple years of data were combined in order to increase the stability of the estimates (see Table 3-1 for a summary of the number of poison observations extracted from each data source). Appendix 3-A contains a detailed description of each of these four data sources. The sources are:
-
National Health Interview Survey (NHIS): This annual population-based survey collects health status and demographic information from a sample of households and their family members selected from and meant to estimate for the entire civilian, noninstitutionalized U.S. population (approximately 275 million persons over the period analyzed).
-
National Ambulatory Medical Care Survey (NAMCS): NAMCS is a
TABLE 3-1 Public Use Data Sources Analyzed for Morbidity Analyses
|
Data Source |
Years Used |
Number of Poisonings |
|
National Health Interview Survey |
2000–2001 |
269 |
|
National Ambulatory Medical Care Survey |
1997–2001 |
188 |
|
National Hospital Ambulatory Medical Care Survey Outpatient File |
1997–2001 |
315 |
|
National Hospital Ambulatory Medical Care Survey Emergency Department File |
1997–2001 |
1,810 |
|
National Hospital Discharge Survey |
1997–2001 |
11,533 |
|
SOURCE: Cisternas (2003) analysis carried out for this Committee. These data form the basis of Tables 3-2 through 3-9 and Table 3-11. |
||
-
national probability sample survey of patient visits made in the United States to the offices of nonfederally employed physicians classified by the American Medical Association and the American Osteopathic Association as working in settings that are “office-based patient care.”
-
National Hospital Ambulatory Medical Care Survey (NHAMCS): NHAMCS is the hospital ambulatory complement to NAMCS; it is a national sample of ambulatory visits to hospital outpatient centers and emergency departments (EDs). The outpatient center and emergency department records are disseminated in separate files, as the survey questions differ for these two sites of care.
-
National Hospital Discharge Survey (NHDS): NHDS covers discharges from a sample of short-stay hospital visits that are noninstitutional and are not federal. In order to be included in the survey, hospitals must have six or more beds staffed for patient use.
Summary data were used from two data sources in which data were not available for reanalysis (direct analysis of raw data beyond published summaries). They include:
-
National Electronic Injury Surveillance System—All Injury Program (NEISS-AIP): CPSC operates a surveillance system known as the National Electronic Injury Surveillance System. In 2000, CPSC expanded the system to collect data on all injuries, not just product-related incidents. NEISS-AIP data are gathered from a sample of 100 hospital emergency departments.
-
Toxic Exposure Surveillance System: AAPCC compiles TESS data on poison exposure phone calls received at U.S. poison control centers. Summary data reports are provided free of charge through the AAPCC website
-
and published annually (Litovitz et al., 2002). Additional details of this system and its data access are discussed in Chapter 7.
An analysis of mortality data was carried out using the following source:
-
Mortality Vital Statistics: Electronic mortality vital statistics data are derived from a national file of death certificate-derived data maintained by NCHS. This data file is designed to capture all deaths on a yearly basis. The deaths analyzed were from the single year 2001. This is the “universe” of observations, not a selected sample from which estimates of true incidence are derived. The denominator population (unlike the four surveys described earlier) is the entire U.S. population (not limited to the noninstitutionalized).
Multiple other data sources are potentially relevant to the incidence of poisoning and drug overdose, particularly to certain subsets of events, beyond the seven sources included in this analysis (see Chapter 7). Because these sources do not include a range of events comparable to the sources used (e.g., the Food and Drug Administration’s MedWatch program captures voluntary reports of medication-related adverse events, while the Drug Abuse Warning Network (DAWN) system is designed to best capture events associated with medications of abuse potential and illicit drugs), these are not part of this analysis. Nonetheless, they are clearly relevant to more targeted epidemiological questions that could not be addressed here.
It is important to note that none of the sample-based sources of data on poisoning and drug overdose has sufficient observations to provide adequate estimates by specific causes. Thus these data sources do not, in themselves, form a basis for evaluating responses for highly targeted intervention strategies such as the reduction of antidepressant medications for overdose incidence or the prevention of spider envenomation.
Data Coding
A general discussion of the definition of poisoning-related coding issues is presented in Appendix 3-A. Specific to this analysis, all data sources used in the primary analysis of morbidity contained E-codes and ICD-9-CM diagnosis code fields. The definition of poisoning for the analysis includes ICD-9-CM diagnostic and external cause of injury (“E”) codes: 960.0–964.5, 964.9–979.0, 980.1–989.9, E850.0–E858.9, E860.1–E869.9, E950.0–E952.9, E961.0–E962.9, and E980.0–E982.9. The diagnostic or E-codes for ethanol intoxication, ethanolism, or its sequelae were excluded,
as were adverse drug reactions or related diagnoses and diagnoses related to bacterial food poisoning.
NAMCS and NHAMCS files also included up to three “reason for visit” fields based on the patient’s chief complaint. Any relating to poisoning (5900.2—Unintentional poisoning: Ingestion, inhalation, or exposure to potentially poisonous products, 5820.1—Overdose, intentional, and 5910.0—Adverse effect of drug abuse) were examined, but were only included if confirmed by a consistent concomitant ICD-9-CM diagnosis or E-codes as listed previously.
The two datasets from which summary data only are reported use their own poisoning codes that are not based on the ICD scheme. Thus the data presented rely on these systems’ inclusion and inclusion criteria whose potential selection effects are discussed briefly below as well as in Chapter 7 in relation to surveillance.
Poisoning mortality for 2001 was defined by ICD-10 using the codes for underlying cause of death. The codes included X40–X49, X60–X69, X85–X90, Y10–Y19, and Y35.2. In addition, ICD-10 codes for deaths due to mental and behavioral disorders attributed to psychoactive substance use, F10–F16 and F18–F19, are also included because these can be driven by poisoning mortality according to current coding procedures. “T” series codes were not relevant to this analysis because they should be superceded by “X,” “Y,” or “F” series codes for the underlying cause of death in fatal poisoning. No deaths occurred in 2001 that were coded as U01.6 or U01.7, terrorism-related poisoning designations.
Findings
National Health Interview Survey
A total of 269 injury episode observations were identified by ICD-9-CM and E-codes from 2000–2001 NHIS injury/episode files. Table 3-2 includes estimates of annual poisoning episodes overall and stratified by various demographic characteristics and whether direct treatment was given. Based on sampling weights, which allow mathematical calculation of the population frequency based on the observations (see Appendix 3-A for details), the number of annual poisoning episodes (as contrasted with exposures) in the United States is estimated to be 1,575,000 for the 275.25 million persons in the noninstitutionalized population, yielding a poisoning-related episode rate of 570 per 100,000 per year.
Females were more likely to be poisoned than males (690 versus 450 per 100,000, respectively), and were more likely to have direct contact with a health provider for their episode than males (530 versus 420 per 100,000, respectively). Children (under 18 years of age) were more likely
TABLE 3-2 Annual Number and Rates of Poisoning Episodes by Respondent Self-Report from National Health Interview Survey (NHIS), 2000–2001
|
|
Sample Number |
Number of Poisoning Episodes (thousands) |
Total Population (millions) |
Episodesa per 100,000 Persons per Annum |
|
All episodes reported |
269 |
1,575 |
275.25 |
570 |
|
Gender |
||||
|
Male |
107 |
601 |
134.26 |
450 |
|
Female |
162 |
974 |
140.99 |
690 |
|
Age |
||||
|
Under 18 |
86 |
528 |
72.49 |
730 |
|
18–64 |
153 |
847 |
169.98 |
500 |
|
65 and over |
30 |
200 |
32.78 |
610 |
|
Race |
||||
|
White |
220 |
1,355 |
216.99 |
620 |
|
Black |
24 |
95b |
33.61 |
280b |
|
Other |
25 |
124b |
24.64 |
500b |
|
Region |
||||
|
Northeast |
37 |
226 |
52.66 |
430 |
|
Midwest |
71 |
441 |
66.50 |
660 |
|
South |
94 |
584 |
98.08 |
600 |
|
West |
67 |
324 |
58.01 |
560 |
|
Treated by direct clinician contactc |
204 |
1,171 |
275.25 |
430 |
|
Gender |
||||
|
Male |
77 |
428 |
134.26 |
320 |
|
Female |
127 |
743 |
140.99 |
530 |
|
Age |
||||
|
Under 18 |
49 |
272 |
72.49 |
380 |
|
18–64 |
133 |
746 |
169.98 |
440 |
|
65 and over |
22 |
153 |
32.78 |
470 |
|
Race |
||||
|
White |
165 |
996 |
216.99 |
460 |
|
Black |
21 |
81b |
33.61 |
240b |
|
Other |
18 |
94b |
24.64 |
380b |
|
Region |
||||
|
Northeast |
30 |
184 |
52.66 |
350 |
|
Midwest |
54 |
340 |
66.50 |
510 |
|
South |
74 |
429 |
98.08 |
440 |
|
West |
46 |
218 |
58.01 |
380 |
|
Treated by phone only |
59 |
375 |
275.25 |
140 |
|
Gender |
||||
|
Male |
29 |
169 |
134.26 |
130 |
|
Female |
30 |
206 |
140.99 |
150 |
|
Age |
||||
|
Under 18 |
36 |
250 |
72.49 |
340 |
|
18 and over |
23 |
125 |
202.76 |
60 |
|
aThe term “episode” is used to refer to an event reported by the interviewee. bEstimate has low statistical reliability (relative standard error >30 percent or sample N <30). cRespondent indicated that poisoned individual received ambulatory or inpatient care. NOTE: NHIS is an annual population-based survey of approximately 101,000 individuals ascertaining poisoning via respondent self-report. SOURCE: Cisternas (2003). |
||||
to be poisoned than either working age adults or those 65 years of age and over, but were less likely to receive direct treatment. Whites were more likely to report a poisoning episode than all others. Differences in episode numbers and rates by race, however, should be viewed cautiously because the nonwhite estimates exhibit low statistical reliability due to small sample sizes. For this reason the data as shown are collapsed to show rates for whites, blacks, and all others (combining multiple other groups). Respondents from the Northeast were the least likely to report poisoning episodes (430 per 100,000), while those from the Midwest were the most likely (660 per 100,000). The most common ICD-9 codes included in the poisoning subset were “toxic effect of other substances (venom; bites of venomous snakes, lizards, and spiders; tick paralysis)” (989.5), “accidental poisoning from poisonous foodstuffs and plants” (E865.9), and “toxic effect of noxious substances eaten as food (unspecified)” (988.9).
As shown in Table 3-2, important differences emerge when the data are analyzed separately based on whether a direct medical contact took place, as opposed to telephone consultation only. Among those with direct medical contact, the general patterns of race and regional differences remain. The age distribution changes dramatically. The higher overall incidence rate for persons under 18 years of age is explained by cases treated by telephone call only; the rate in this age category is actually lower among clinician-treated cases. This group has a nearly equal gender mix, indicating that the gender gap in total cases estimated by the NHIS is explained by medically treated episodes of poisoning. Although estimation by narrower age strata (e.g., children 6 years of age and under) might further highlight these trends, this was beyond the scope of the analysis presented here.
All but 6 of the 269 episodes in the NHIS 2000–2001 poisoning subset had answers provided to questions about poisoning treatments (Table 3-3). About one-quarter were treated only by telephone calls to a doctor’s office and/or a poison control center, but had no ambulatory or inpatient visits reported (16 percent reported a telephone call to a poison control center, regardless of whether a subsequent ambulatory or inpatient visit was made; data not shown in table). Approximately three-quarters of respondents had one or more visits to a doctor’s office, clinic, or hospital outpatient or emergency department. The number reporting a visit to the hospital was quite small and not statistically reliable.
The NHIS-based estimates of the proportion of cases that received medical care and the overlap among the various levels of medical management for these poisoning episodes provide a benchmark for utilization estimates from other data sources that were also examined. For example, based on the NHIS, at least 568,000 annual visits at outpatient non-ED sites (as might be reflected in the NAMCS outpatient and NHAMCS sur-
TABLE 3-3 Treatments Mentioned for Annual Poisoning Self-Report Episodes, National Health Interview Survey (NHIS), 2000–2001
|
|
Sample Number |
Number of Episodes per Annum (thousands) |
Percentage of Total |
|
Total |
263a |
1,546 |
100 |
|
Phone call only (doctor’s office or poison control center) |
59 |
375 |
24 |
|
Ambulatory or inpatient visit |
204 |
1,171 |
76 |
|
Visit to doctor’s office/clinic/outpatient department |
97 |
568 |
37 |
|
Visit to doctor’s office/clinic/outpatient department without hospitalization or emergency department treatment |
90 |
521 |
34 |
|
Visit to doctor’s office |
70 |
419 |
27 |
|
Visit to clinic/outpatient department |
28 |
154b |
10 |
|
Visit to emergency department |
107 |
611 |
40 |
|
Visit to emergency department without hospitalization |
97 |
558 |
36 |
|
Visit to hospital |
17 |
92b |
6 |
|
aSix respondents refused to answer this question. bEstimate has low statistical reliability (relative standard error >30 percent or sample N <30). NOTE: NHIS is an annual population-based survey covering approximately 101,000 individuals that ascertains poisoning based on respondent self-report. Thus the level of care reported (doctor’s office visit, emergency department visit, or hospitalization) is defined by interview report, not by medical record extraction. SOURCE: Cisternas (2003). |
|||
veys if their estimates were combined) and another 611,000 annual emergency department visits (as might be found in the NHAMCS emergency department visit file) should be expected. Of interest, the NHIS survey data indicate that there was relatively little overlap between the ED and non-ED doctor and clinic/outpatient categories. As would be anticipated, the majority of episodes in which the survey respondent reported that inpatient treatment (hospital admission) had occurred also indicated either that an emergency department or doctor/outpatient visit had occurred for that episode. Thus, as a crude approximation of prevalence of poisoning associated with ambulatory visits, the NHIS data suggest that the visit estimates from NAMCS and both NHAMCS files can be added together presuming little overlap (multiple counting of the same event). It can further be extrapolated that these visits represent about three-quarters
of all poisoning episodes, based on the 24 percent of estimated NHIS episodes that were treated solely by a telephone call.
National Ambulatory Medical Care Survey
A subset of 188 records (out of a total of 120,464), including an ICD-9-CM diagnosis or E-code for poisoning, was extracted from the National Ambulatory Care Medical Survey 1997–2001 data files, resulting in an annual estimate of approximately 1,582,000 visits (Table 3-4). This represents approximately 0.2 percent of all doctor’s office visits annually estimated through this survey. This estimate is nearly four times higher than what might be expected given the estimates from the NHIS (as shown in Table 3-3). Patterns of rates among the various demographic groups demonstrated similarities and differences compared with the NHIS data. Male and female patients in NAMCS had similar rates of poisoning-related visits, as opposed to the lower rates for males in the NHIS.
Rates for the various ethnic groups are presented in Table 3-4, but are too sparse in the nonwhite categories to be estimated with precision. In addition, 18 percent of the patient visits were associated with unknown race/ethnicity. Visit rates were highest in the Midwest and West and were lowest in the South. Although the Midwest was also highest in the NHIS (see Table 3-2), the other regions appear to differ in their rank order based on the NAMCS data.
Two-thirds of these visits were associated with an ICD-9 external cause of injury E-code of poisoning; a slightly smaller proportion (56 percent) was associated with an ICD-9 diagnosis code of poisoning (multiple codes possible for the same event). The most common ICD-9 codes were “toxic effects of other substances (venom; bites of venomous snakes, lizards, and spiders; tick paralysis)” (989.5), followed by “accidental poisoning by unspecified substance” (E866.8) and “accidental poisoning by unspecified drug” (E858.9). Observations are too sparse to generate reliable incidence estimates by category of specific ICD-9 code.
The NAMCS survey is one in which “patient reason for visit” data could be present, coded (not by the ICD-9 scheme) from an open-ended “chief complaint” or main symptom from the patient’s perspective. Despite this option, in practice concomitant “patient reason” poisoning codes were relatively infrequent. It should also be noted again that cases were not selected for inclusion or exclusion in the principal analysis based on patient reason codes (see Methods in Appendix 3-A). Had this been a basis for inclusion (e.g., not confirmed by a concomitant ICD-9 diagnosis or E-code for poisoning), only 12 observations would have been added, an increase of 6 percent (total estimate of 1,689,000 visits, rather than 1,575,000). The relative rank of “patient reason for visit” responses will be
TABLE 3-4 Annual Number and Rates of Poisoning Doctor Visits as Confirmed by ICD-9-CM Codes, National Ambulatory Medical Care Survey (NAMCS), 1997–2001
|
|
Sample Number |
Number of Poisoning-Related Visits (thousands) |
|
Total Population (millions)a |
Visits per 100,000 Persons per Annum |
|
Total |
188 |
1,582 |
|
271.56 |
580 |
|
Gender |
|||||
|
Male |
88 |
771 |
|
132.52 |
580 |
|
Female |
100 |
811 |
|
139.05 |
580 |
|
Age |
|||||
|
Under 18 |
28 |
301 |
|
72.02 |
420 |
|
18–64 |
123 |
1,001 |
|
167.09 |
600 |
|
65 and over |
37 |
281 |
|
32.45 |
870 |
|
Race |
|||||
|
White |
164 |
1,385 |
|
215.97 |
640 |
|
Black |
17 |
151b |
|
33.11 |
460 |
|
Other |
7 |
46b |
|
21.91 |
210 |
|
Region |
|||||
|
Northeast |
29 |
267 |
|
52.44 |
510 |
|
Midwest |
46 |
461b |
|
66.46 |
690 |
|
South |
66 |
478 |
|
96.68 |
490 |
|
West |
47 |
376 |
|
55.99 |
670 |
|
Reason/symptoms included poisoning (percentage) |
15 |
160 |
(10) |
271.56 |
60 |
|
Poison E-code included (percentage) |
131 |
1,055 |
(67) |
271.56 |
390 |
|
Poison diagnosis code included (percentage) |
89 |
885 |
(56) |
271.56 |
330 |
|
aEstimated from NHIS 1997–2001 person files. bEstimate has low statistical reliability (relative standard error >30 percent or sample N <30). NOTE: NAMCS is an annual survey of approximately 1,200 office-based physicians who record visits over a 2-week period. SOURCE: Cisternas (2003). |
|||||
presented in a later section, pooled with comparable data from the other outpatient surveys using the same supplementary coding scheme.
Survey questions concerning follow-up planned for patient visits were included in the 1999–2001 NAMCS questionnaires. Reports on more than half the poisoning visits indicated that a follow-up visit was planned. In 2001, a question was added to NAMCS concerning whether the visit was an initial or follow-up visit for the problem in question. Although the
sample size for 2001 (a total of 32 cases) is too small to make population-based estimates, the 2001 data indicate that at least half may have occurred as a follow-up visit. These data suggest that true incidence estimates for new events should discount visits by about 50 percent. Only 2 of the 106 cases (1.9 percent) for the 1999–2000 period indicated that the patient would be admitted to the hospital.
National Hospital Ambulatory Medical Care Survey
Outpatient subset The National Hospital Ambulatory Care Survey 1997–2001 outpatient files (non-ED visits) included 315 observations with a poisoning ICD-9-CM diagnosis or E-code of poisoning, representing an annual estimate of 163,000 or 0.2 percent of all outpatient visits (Table 3-5). This estimate is in line with that expected based on the NHIS data previously presented.
As was the case with the NAMCS data, poisoning-related visit rates for males and females were virtually identical (820 versus 810 per 100,000, respectively). Unlike NAMCS, however, the visit rates for blacks were higher than for whites (110 versus 60 per 100,000, respectively). This could be consistent with a pattern of ambulatory care in which minority populations may be more likely to be served by hospital-based outpatient clinics than private physicians’ offices. Distribution by region also differs between the outpatient NHAMCS file and both the NAMCS and NHIS files, with the visits from the outpatient file having the highest rates in the Northeast.
As was the case with NAMCS, NHAMCS data are too sparse to estimate annual visits associated with specific ICD-9 classifications. The most common ICD-9 code was “toxic effects of other substances (venom; bites of venomous snakes, lizards, and spiders; tick paralysis)” (989.5), followed by “accidental poisoning by unspecified drug” (E858.9) and “accidental poisoning by lead and its compounds and fumes” (E866.0).
Similar to the NAMCS, only a small proportion of visits had “patient reason” for visit information associated with poisoning and no case was included based on this information alone, absent a consistent ICD-9 code. Including these in the incidence estimates, even if not associated with a concomitant ICD-9 code, would have added only 24 observations to the analysis, resulting in an increase of 6 percent (yielding an estimate of 172,000 visits rather than 163,000). Rank order of “patient visit reason” will be presented in a later section.
The majority of respondents to the 2001 episode of care question (parallel to the NAMCS item, as discussed previously) indicated that this was an initial visit, while only an estimated 14 percent of the visits in that year were categorized as a follow-up visit. By extrapolation, this would sug-
TABLE 3-5 Annual Number and Rates of Poisoning Outpatient/Clinic Visits Confirmed by ICD-9-CM Codes, National Hospital Ambulatory Medical Care Survey (NHAMCS) Outpatient File, 1997–2001
|
|
Sample Number |
Number of Poisoning Visits (thousands) |
|
Total Population (millions)a |
Visits per 100,000 Persons per Annum |
|
Total |
315 |
163 |
|
271.56 |
60 |
|
Gender |
|||||
|
Male |
152 |
81 |
|
132.52 |
60 |
|
Female |
163 |
82 |
|
139.05 |
60 |
|
Age |
|||||
|
Under 18 |
93 |
43 |
|
72.02 |
60 |
|
18–64 |
190 |
98 |
|
167.09 |
60 |
|
65 and over |
32 |
22 |
|
32.45 |
70 |
|
Race |
|||||
|
White |
237 |
123 |
|
215.97 |
60 |
|
Black |
66 |
36 |
|
33.11 |
110 |
|
Other |
12 |
4b |
|
21.91 |
20b |
|
Region |
|||||
|
Northeast |
77 |
40 |
|
52.44 |
80 |
|
Midwest |
68 |
44 |
|
66.46 |
70 |
|
South |
100 |
49 |
|
96.68 |
50 |
|
West |
70 |
30 |
|
55.99 |
50 |
|
Reason/symptoms included poisoning (percentage) |
37 |
16 |
(10) |
271.56 |
10 |
|
Poison E-code included (percentage) |
204 |
95 |
(59) |
271.56 |
40 |
|
Poison diagnosis code included (percentage) |
174 |
106 |
(65) |
271.56 |
40 |
|
aEstimated from NHIS 1997–2001 person files. bEstimate has low statistical reliability (relative standard error >30 percent or sample N <30). NOTE: NHAMCS is an annual survey of hospitals with outpatient and emergency departments that record visits over a 4-week period. SOURCE: Cisternas (2003). |
|||||
gest a lower discounting rate to convert these poisoning visits into incident episodes compared with NAMCS, where follow-up visits formed a larger proportion of the sample. The disposition data for the 1999–2001 period indicated that an estimated 15 percent of visits in that period had a follow-up visit planned, and 25 of the 197 visits in the sample (population estimate 9,300 out of 150,000 or 6 percent) for that period were to be admitted to a hospital.
Emergency department subset A total of 1,810 records with a poisoning ICD-9-CM diagnosis or E-code of poisoning were extracted from the 1997–2001 NHAMCS emergency department data subset, yielding an estimate of 1,428,000 visits (Table 3-6). This represents 1.5 percent of all
TABLE 3-6 Annual Number and Rates of Emergency Department Visits as Confirmed by ICD-9-CM Codes, National Hospital Ambulatory Medical Care Survey (NHAMCS) Emergency Department File, 1997–2001
|
|
Sample Number |
Number of Visits (thousands) |
|
Total Population (millions)a |
Poisoning-Related Visits per 100,000 Persons |
|
Total |
1,810 |
1,428 |
|
271.56 |
530 |
|
Gender |
|||||
|
Male |
853 |
665 |
|
132.52 |
500 |
|
Female |
957 |
763 |
|
139.05 |
550 |
|
Age |
|||||
|
Under 18 |
432 |
352 |
|
72.02 |
490 |
|
18–64 |
1,240 |
975 |
|
167.09 |
580 |
|
65 and over |
138 |
100 |
|
32.45 |
310 |
|
Race |
|||||
|
White |
1,383 |
1,121 |
|
215.97 |
520 |
|
Black |
378 |
274 |
|
33.11 |
830 |
|
Other |
49 |
33 |
|
21.91 |
150 |
|
Region |
|||||
|
Northeast |
485 |
286 |
|
52.44 |
540 |
|
Midwest |
368 |
321 |
|
66.46 |
480 |
|
South |
564 |
510 |
|
96.68 |
530 |
|
West |
393 |
311 |
|
55.99 |
560 |
|
Discharge status (percentage of total) |
|
||||
|
Referred to another physician or clinic |
722 |
557 |
(39) |
271.56 |
200 |
|
Admitted to hospital |
355 |
256 |
(18) |
271.56 |
90 |
|
Transferred to other facility |
156 |
115 |
(8) |
271.56 |
40 |
|
Reason/symptoms included poisoning |
730 |
570 |
(40) |
271.56 |
210 |
|
Poison E-code included (percentage of total) |
1,410 |
1,089 |
(76) |
271.56 |
400 |
|
Poison diagnosis code included |
1,223 |
1,009 |
(71) |
271.56 |
370 |
|
aEstimated from NHIS 1997–2001 person files. SOURCE: Cisternas (2003). |
|||||
emergency department visits estimated for the noninstitutionalized population for that period. This estimate was twice as high as would be expected from the NHIS-derived estimate presented earlier.
Unlike NAMCS and the NHAMCS outpatient file, females (550 per 100,000) had a slightly higher rate of visits than males (520 per 100,000), although this difference was far narrower than in the NHIS estimates. The age distribution differed from the NHIS, NAMCS, and NHAMCS outpatient subset, with those 65 years of age and over having the lowest rate of all three age groups. Once again, examination of narrower age strata, especially for those younger than 18 years of age, was beyond the scope of this analysis. As was the case with the outpatient NHAMCS file, the visit rate for whites (520 per 100,000) is lower than that for blacks (830 per 100,000). Rates of poisoning-related visits ranged from a low of 480 per 100,000 persons in the Midwest to a high of 560 per 100,000 persons in the West, a regional pattern that, once again, varied in comparison to each of the other datasets. Of these emergency department visits, 18 percent resulted in a subsequent admission to a hospital, and an additional 8 percent were transferred to another facility, while 39 percent were referred to another physician or clinic.
In 2001, questions were added to the survey concerning whether the patient was seen in the emergency department in the past 72 hours and whether the visit was initial or follow-up. Of those with nonmissing data, 97 percent had not been seen in the emergency department in the past 72 hours, and 95 percent were an initial visit (data not shown in Table 3-6).
The most common ICD-9 codes were “toxic effects of other substances (venom; bites of venomous snakes, lizards, and spiders; tick paralysis)” (989.5), “poisoning by unspecified drug or medicinal substance” (977.9), and “suicide and self-inflicted poisoning by tranquilizers” (E950.3). A much higher percentage of emergency department poisoning visits were associated with a reason or symptom of poisoning (40 percent) than from either the NAMCS or NHAMCS outpatient files. Nonetheless, as was the case with NAMCS and the outpatient NHAMCS file, the increase in observations and estimated visits that would be obtained by adding in records with a patient reason or symptom of poisoning that lacked a concomitant ICD-9 code remains negligible: an additional 6 percent to the estimate (1,514,000 as opposed to 1,428,000 cases).
The percentage of total emergency department visits estimated to be associated with poisoning in this analysis is slightly higher here than one published by McCaig in 1996 using 1993–1996 NHAMCS emergency department files (1.1 percent of all visits in that study compared with 1.5 percent here) (McCaig and Burt, 1999). This difference is likely due to differences in the definition of poisoning used in the earlier study, which was limited to visits with a poisoning-related E-code rather than utilizing
ICD-9 disease codes as well. Based only on E-codes, the 1997–2001 data yield a similar proportional estimate to that of McCaig and Burt (1999).
Pooling of NAMCS and NHAMCS Data
When observations from the NAMCS and NHAMCS surveys are pooled, a picture of poisonings treated in the outpatient setting as a whole can be obtained, including emergency departments (Table 3-7). Based on ICD-9 E-codes, poisoning by venomous animals or plants is the primary cause of one-fifth of all 3.1 million outpatient visits, followed by accidental poisoning by unspecified substances (13 percent) and other drugs (10 percent). The fourth leading cause of poisoning is self-inflicted (9 percent), followed by unintentional versus purposely inflicted, and not determined (5 percent). These five primary ICD-9 E-code classified causes subsumed 58 percent of all poisoning visits.
The top primary diagnosis by ICD-9-CM coding was primary effects of other substances (nonmedicinal), which accounted for nearly one-fifth of all primary diagnoses associated with outpatient visits. Poisoning by other and unspecified drugs was a distant second at 6 percent. The third, fourth, and fifth top primary ICD-9-CM codes were adverse effects not elsewhere classified (5 percent); poisoning by analgesics, antipyretics, and antirheumatics (which would include opiates) (4 percent); and poisoning by psychotropic agents (which would include amphetamines and hallucinogens) (3 percent), respectively.
Overall, the limited specific toxin-related information that emerges from these ICD-9-coded data is notable, based on either external cause of injury (“E”) or general diagnostic codes. For example, identifiable categories of drugs of abuse appear to be minimal, but may be subsumed in nonspecified categories. This may reflect the limitations of this coding schema and its application in practice, as well as the need for targeted surveillance or supplemental sampling to generate reliable toxin-specific poisoning incidence estimates.
Examination of the primary “patient reason” for visit can provide an understanding of how poisoned individuals describe these episodes in their own terms. Sixteen percent describe their main reason for visit as an insect bite, while 10 percent indicate their primary reason as unintentional poisoning. The third primary reason/symptom was skin rash (7 percent), followed by intentional overdose (5 percent) and adverse effect of drug abuse (4 percent). These five reasons accounted for 43 percent of the cases estimated by the pooled sample, taking into account sampling weights. This analysis is limited to primary reason code; additional patient visit reasons could be listed but were not analyzed here. It is also important to note again that for none of these surveys was a primary
TABLE 3-7 Annual Number and Rates of Ambulatory Poisoning Visits Confirmed by ICD-9 Codes, National Ambulatory Medical Care Survey (NAMCS) and National Hospital Ambulatory Medical Care Survey (NHAMCS) Outpatient and ED Files, 1997–2001
patient reason present in a majority of the poisoning sample, that is, in each case where an unrelated ICD-9 code was also present.
National Hospital Discharge Survey
A total of 11,533 records with an ICD-9-CM diagnosis or E-code of poisoning was extracted from NHDS 1997–2001 files, representing an estimated total of 291,000 annual hospitalizations, or 0.8 percent of all estimated discharges (Table 3-8). Poisoning-related hospitalizations were more likely for females than males (120 per 100,000 compared with 90 per 100,000). Rates of hospitalization increased with age.
Because 25 percent of all discharges were associated with “unknown” race/ethnicity, even though the available data for patient race imply that whites are less likely to be hospitalized for poisoning than blacks, this observation must be viewed with caution. Hospitalization visit rates did not demonstrate substantive variation by region. Discharge status information was available for most of the visits, indicating that the majority of poisoning cases are discharged home. An estimated 9 and 6 percent of hospital visits were discharged to other short- and long-term care facilities, respectively. Because the short-term care facilities included in the discharge status variable could include some (but not all) health care facilities not actually incorporated into the NHDS sampling frame (long-term care facilities as a category are excluded), 9 percent is too high an estimate of multiple hospitalizations per episode to be used as a discounting rate to convert these poisoning hospitalizations into episodes.
A source of admission variable was added to NHDS in 2001. Examination of all hospitalizations by the source of admission (Table 3-9) indicates that 65 percent of all cases (186,000 visits) were admitted from an emergency department, followed by 11 percent (31,000) from physician referral and 2 percent (5,000) from another hospital. Because 19 percent of all hospitalizations in the file were missing the source of admission information, the emergency department, physician, and hospital transfer sources of admission may actually be higher. Thus a figure of 3 percent for hospital transfers is used for later incidence estimates, which would represent the difference between episodes and true incidence. This presumes, however, that readmission of an individual for the same poisoning episode is extremely infrequent.
Two-thirds of the poisoning inpatient visits had a poisoning ICD-9 code as the principal diagnosis on the discharge abstract, with the remainder as a secondary listing (e.g., a primary diagnosis of aspiration pneumonia in a concomitant drug overdose). The six most common ICD-9-CM codes listed were “suicide and self-inflicted poisoning by tranquilizers” (E950.3), “poisoning by benzodiazepine-based tranquilizers” (969.4), “poi-
TABLE 3-8 Annual Number and Rates of Hospitalizations Defined by ICD-9-CM Codes, National Hospital Discharge Survey (NHDS), 1997–2001
|
|
Sample Number |
Number of Poisoning Hospitalizations (thousands) |
|
Total Population (millions)a |
Hospitalizations per 100,000 Persons per Annum |
|
Total |
11,533 |
291 |
|
271.56 |
110 |
|
Gender |
|||||
|
Male |
4,896 |
124 |
|
132.52 |
90 |
|
Female |
6,637 |
167 |
|
139.05 |
120 |
|
Age |
|||||
|
Under 18 |
2,020 |
43 |
|
72.02 |
60 |
|
18–64 |
8,048 |
199 |
|
167.09 |
120 |
|
65 and over |
1,465 |
49 |
|
32.45 |
150 |
|
Race |
|||||
|
White |
6,344 |
184 |
|
215.97 |
90 |
|
Black |
1,678 |
35 |
|
33.11 |
110 |
|
Other |
593 |
11 |
|
21.91 |
50 |
|
Unknown |
2,918 |
61 |
|
|
|
|
Region |
|||||
|
Northeast |
2,411 |
57 |
|
52.44 |
110 |
|
Midwest |
3,655 |
72 |
|
66.46 |
110 |
|
South |
3,883 |
105 |
|
96.68 |
110 |
|
West |
1,584 |
57 |
|
55.99 |
100 |
|
Discharge status (percentage of total) |
|
||||
|
Routine/ discharged home |
7,750 |
200 |
(69) |
271.56 |
7.4 |
|
Left against medical advice |
387 |
11 |
(4) |
271.56 |
0.4 |
|
Discharged/ transferred to short-term facility |
793 |
27 |
(9) |
271.56 |
1.0 |
|
Discharged/ transferred to long-term care institution |
545 |
17 |
(6) |
271.56 |
0.6 |
|
Alive, disposition not stated |
1,702 |
28 |
(10) |
271.56 |
1.0 |
|
Dead |
138 |
3.8 |
(1) |
271.56 |
0.1 |
|
Not stated or not reported |
218 |
3.7 |
(1) |
271.56 |
0.1 |
|
aEstimated from NHIS 1997–2001 person files. NOTE: NHDS is an annual survey of a sample of short-stay hospitals that provide data for a sample of their discharge records. SOURCE: Cisternas (2003). |
|||||
TABLE 3-9 Source of Admission for Poisoning-Related Hospitalizations, National Hospital Discharge Survey (NHDS), 2001
|
|
Sample Number |
Number of Visits (thousands) |
Percentage of Total |
|
Total |
2,469 |
286 |
|
|
Source of admission |
|||
|
Physician referral |
165 |
31 |
11 |
|
Clinical referral |
9 |
2a |
1 |
|
Health maintenance organization referral |
4 |
1a |
0 |
|
Transfer from a hospital |
49 |
5a |
2 |
|
Transfer from skilled nursing facility |
3 |
0a |
0 |
|
Transfer from other health facility |
28 |
2a |
1 |
|
Emergency department |
1,438 |
186 |
65 |
|
Court/law enforcement |
10 |
2a |
1 |
|
Other |
15 |
3a |
1 |
|
Not available |
748 |
53 |
19 |
|
aEstimate has low statistical reliability (sample N < 60). NOTE: The NHDS is an annual survey of a sample of short-stay hospitals that provide data for a sample of their discharge records. SOURCE: Cisternas (2003). |
|||
soning by antidepressants” (969.0), “suicide and self-inflicted poisoning by tranquilizers” (E950.0), “poisoning by aromatic analgesics not elsewhere classified” (965.4), and “suicide and self-inflicted poisoning by other specified drugs” (E950.4). Nonetheless, these six specific codes only represented 38 percent of all poisoning ICD-9-CM codes listed.
National Electronic Injury Surveillance System—All Injury Program
NEISS-AIP provides a summary estimate of 742,606 poisoning episodes presenting at emergency departments in 2002. However, this figure excludes poisoning from insect stings or other venomous animal bites. Such exposures are incorporated in a category entitled “other bite/sting nonfatal injuries,” which includes all bites and stings from all insects and animals excluding dogs, estimated at 910,481. Although it is not possible to estimate with precision the percentage of that category that should be included under the poisonous exposure rubric, for the purposes of this estimate this subset has been conservatively discounted to 80 percent, presuming that one out of five would be considered a sting or envenomation (consistent with the proportion of such cases estimated elsewhere) and then added back to the subtotal that had excluded bites and stings. Of the NEISS-AIP 742,606 poisoning episodes, 172,931 (23 percent) resulted
in hospitalization; for bites and stings, a far smaller proportion was hospitalized (1.4 percent).
Toxic Exposure Surveillance System
The 2001 TESS annual report included analysis of data from poison control centers in 48 states and the District of Columbia. Less than 2 percent of the 2,267,979 human exposures reported were caused by food poisoning; the remaining appear to be within the definition of poisoning used for the public data sources, although some primary ethanol-related events are also likely to be included. TESS follow-up on patients with more severe exposures indicates that of the 2.3 million human exposures reported to poison control centers in 2001, 1,736,010 (77 percent) were managed onsite in a non-health care facility,1 while 498,524 (22 percent) received care from a health care provider. Of those who received care from a health provider, 272,286 (12 percent of all episodes) were treated in an outpatient setting and then released (including hospital-based and freestanding outpatient service settings), and 147,891 (7 percent of all episodes) required subsequent hospitalizations.
Analysis of follow-up call TESS data indicates that 1,074 exposures resulted in known fatalities. Because follow-up calls are routinely carried out only in more severe cases, there is likely some underreporting, even within the population referred for consultation. Repeat entry of the same case into the dataset through referral to more than one poison control center is possible, but is likely to be negligible. There is probably also a small amount of duplication of records for a single poisoning episode due to calls to a single center by both the patient and a health care provider without subsequent linking to a single event. Nonetheless, TESS summary figures were not discounted to generate an incidence frequency lower than the episode totals.
Vital Statistics Mortality Data
An unpublished analysis of 2001 death certificate data prepared by NCHS (Personal communication, L. Fingerhut, 2003) provides an estimate of 24,173 poisoning-related fatalities per annum. As noted earlier, the definition and classification of poisoning based on ICD-10 (introduced for mortality data in 1999) differs from the ICD-9 used for morbidity in the other estimates. Critically, this means that information is available on
manner or intent of the poisoning, but not on the specific substance or agent. In addition, deaths for which the underlying cause was a mental or behavioral disorder due to psychoactive drug use are included (Table 3-10).
Based on this coding, poisoning deaths were classified as unintentional (63 percent), suicides (23 percent), and undetermined intent (13 percent), with the remainder as homicides or legal interventions. External cause codes for poisoning also describe the type of substance involved (e.g., drugs, alcohol, other solids and liquids, or gases and vapors). For example, of the external cause poisoning deaths that were classified as unintentional or of undetermined intent, 93 and 95 percent, respectively, were drug related; of the suicides, 69 percent were drug related and 28 percent were due to exposure to gases and vapors.
Approximately three-quarters (77 percent) of all deaths involving poisoning or toxic effects had at least one mention of drugs, medicaments, or biological substances (Table 3-10). The type of drug mentioned as contributing to the death varied with intent of the death. For example, narcotics and psychodysleptics were mentioned in 50 percent of the unintentional and 64 percent of the undetermined intent deaths involving poisonings and toxic effects. Narcotics and psychodysleptics accounted for only 20 percent of suicides involving poisoning and toxic effects. Cocaine was more commonly listed than other narcotic drugs. In contrast, antiepileptic, sedative-hypnotic, and anti-parkinsonism drugs and antidepressants were more likely to be associated with suicides than with unintentional or undetermined intent deaths.
TABLE 3-10 Poisoning and Drug Overdose Mortality, 2001
|
|
Category of Substance Involved |
||
|
Underlying Cause of Death by Intent |
Drug |
Other |
All Medicament |
|
Unintentional |
13,024 |
1,054 |
14,078 |
|
Suicide |
3,559 |
1,632 |
5,191 |
|
Homicide |
42 |
22 |
64 |
|
Undetermined intent |
2,769 |
140 |
2,909 |
|
Drug-related mental or behavioral disorder |
1,931 |
NA |
1,931 |
|
Subtotal |
21,325 |
2,848 |
24,173 |
|
Alcohol-related behavioral disorder |
NA |
6,627 |
6,627 |
|
Total |
21,235 |
9,475 |
30,800a |
|
aExcludes fire and smoke deaths with carbon monoxide poisoning listed as a contributing cause. SOURCE: Fingerhut (2003). |
|||
Nearly 30 percent of deaths involving poisoning or toxic effects had at least one mention of the toxic effects of substances that were chiefly nonmedicinal. The toxic effects of alcohol and of carbon monoxide were more likely to be listed on death certificates than other toxic, nonmedicinal substances. About one-fourth of suicides involving poisoning and toxic effects had mention of carbon monoxide poisoning, and 9 percent of unintentional deaths involving poisoning and toxic effects included mention of alcohol.
Poisoning death rates increased with age from less than 1 per 100,000 for persons under 15 years of age to 19/100,000 at 35 to 44 years of age, and then declined again with age (Figure 3-2). For persons 15 to 19 and 20 to 24 years of age, death rates for males were about three times the rates for females; for those age 25 and older, the ratio was closer to 2:1 (data not shown).
The age-adjusted death rate for poisoning was 8.5/100,000, with rates ranging from a low of 1.8 for the Asian and Pacific Islander population to 9.8/100,000 for blacks. For each racial and ethnic group and both sexes, age-specific rates were higher for persons ages 35 to 44 and 45 to 54 than for those younger or older, with the highest rate for black males ages 45 to 54 (Figure 3-3).
Poisoning death rates are highest in the Mountain states (with New Mexico’s rate being the highest [16.4/100,000] in the United States) and lowest in the West North Central states (particularly North Dakota, South Dakota, Iowa, and Minnesota) and Pacific states (dominated by the low rate in California, 4.1/100,000). In each geographic division except for New England, the highest death rates were associated with unintentional poisoning, followed by poisoning by suicide. In New England, rates for poisoning of undetermined intent were higher than other poisoning death rates (Figure 3-4). The East North Central states had relatively high rates associated with psychoactive drug use mortality.
SYNTHESIS
By combining the estimates of poisoning from the various data sources described, it is possible to develop a more complete estimate of poisoning incidence than can be obtained from any single source. It is interesting to note that while the distribution of estimated poisonings varies across regions for several of the data sources, these differences are blunted when all sources are combined. A comparison of annual episode estimates from the various data sources by level of care is presented in Table 3-11.
Both the NHIS and TESS provide estimates of poisoning events in which no direct (face-to-face) clinical evaluation or treatment occurred.
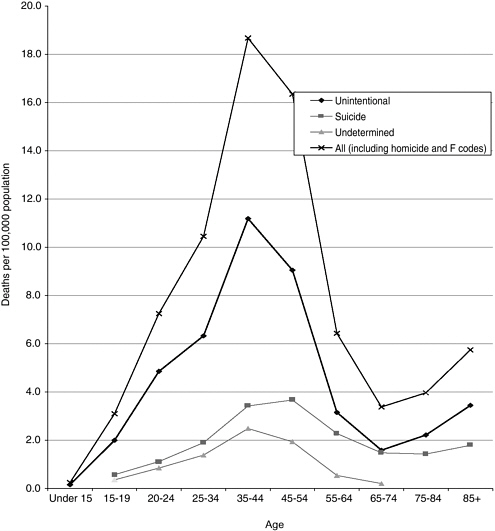
FIGURE 3-2 Death rates due to poisoning by intent and age, 2001.
SOURCE: Fingerhut (2003).
TESS data, by definition, only include poisoning cases for which a call was made to a poison control center. Although a few geographic areas are wholly excluded from TESS, the TESS experience of 1.7 million cases annually managed by telephone consultation alone (no subsequent clinical care) outstrips the NHIS estimate of less than 400,000 such events, even though the NHIS estimate also includes survey respondents who contacted a physician’s office by telephone, but did not call a poison control center.
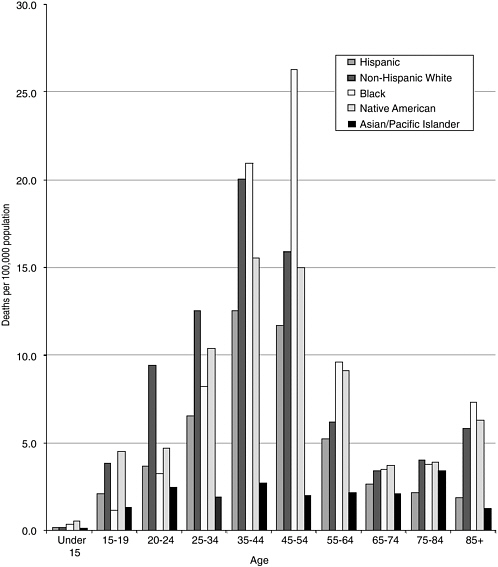
FIGURE 3-3 Poisoning death rates, 2001 (rates based on external cause codes as F codes).
SOURCE: Fingerhut (2003).
The NHIS also appears to underestimate the total incidence of poisonings that are directly treated by health care providers. The NHIS-derived estimate of approximately 1.2 million differs substantially from the upper-end estimate of 2.3 million cases annually based on combined data from NAMCS/NHAMCS. The ratio of the NHIS to TESS “telephone
contact only” cases is 0.21; the ratio of the NHIS to NAMCS/NHAMCS health care provider-treated cases is 0.51.
A number of factors may drive underestimates from the NHIS that could differentially impact telephone consultation as compared with directly treated cases. Of interest are visits in which a patient’s primary “reason for visit” formed the sole basis for defining a poisoning event (data not shown in Table 3-11). This might be comparable to a question-
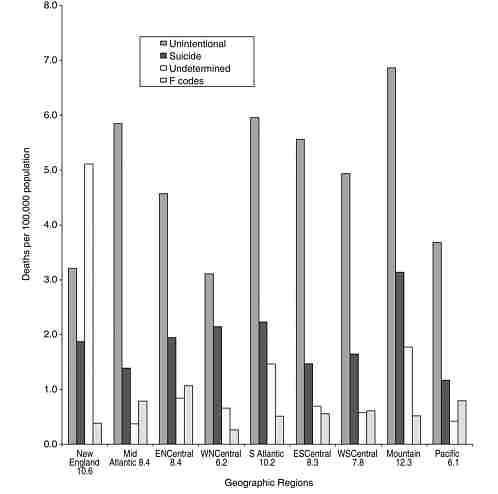
FIGURE 3-4 Poisoning death rates by geographic division, United States, 2001. (Undetermined includes the 64 deaths classified as homicides.)
SOURCE: Fingerhut (2003).
TABLE 3-11 Estimates of Annual Poisoning Episodes by Level of Care from All Sources
|
Level of Care |
Data Source |
Annual Incidence |
|
Total episodes |
NHIS |
1,575,062 |
|
TESSa |
2,267,979 |
|
|
Telephone contact only |
NHIS |
374,794 |
|
TESSa |
1,736,010 |
|
|
Total treated by direct health care provider contact |
NHIS |
1,170,970 |
|
TESSa |
498,524 |
|
|
NAMCS/NHAMCS |
2,287,771b |
|
|
NEISS-AIPc |
924,702 |
|
|
Seen at doctor’s office/clinic or outpatient facility without subsequent emergency department contact |
NHIS |
520,782 |
|
NAMCS/NHAMCS |
922,877b |
|
|
Seen in emergency department without subsequent hospitalization |
NHIS |
557,914 |
|
NHAMCS |
1,112,320b |
|
|
NEISS-AIPc |
749,245 |
|
|
TESSa |
244,513 |
|
|
Hospitalized |
NHIS |
92,274d |
|
NHAMCS |
265,714 |
|
|
NHDS |
282,012b |
|
|
TESSa |
147,891 |
|
|
NEISS-AIPc |
175,457 |
|
|
Died |
NHDS |
3,770 |
|
TESSa |
1,074 |
|
|
NCHS |
24,173e |
|
|
aToxic Exposure Surveillance System: 2 percent of TESS exposures are associated with food poisoning. TESS hospitalizations include psychiatric admissions. bVisit estimate discounted to account for possible multiple visits per episode, as follows: NAMCS—50 percent, NHAMCS outpatient—14 percent, NHAMCS ED—5 percent, NHDS—3 percent. cNational Electronic Injury Surveillance System—All Injury Program. This source does not include envenomation in its poisoning category; 20 percent of “other bite/sting” episodes are therefore included in this table. dEstimate has low statistical reliability (relative standard error > 30 percent or sample N < 30). eExcludes 6,627 cases coded with alcohol-related behavioral disorder as the underlying cause of death. SOURCE: Cisternas (2003). |
||
naire assessment of poisoning by subject self-report. This definition would reduce the NAMCS/NHAMCS estimated incidence to 746,000 rather than 2.3 million ambulatory visits for poisoning annually and may explain, in part, the lower rate of poisoning by self-report generated by the NHIS. To the extent that the public may have a different definition of poisoning than clinicians, respondents might differentially report such events when queried in standard items used in the current NHIS. It would not explain, however, the NHIS underreporting relative to TESS data, which could be attributable to other factors such as the NHIS respondents who may not mention attempted suicide or drugs of abuse misadventures when answering an injury/poisoning screener question (i.e., due to perceived stigma or even fear of legal exposure). Recall effects, in which events leading to medical care may be more likely to be reported relative to an event leading to a telephone call to a poison control center, may also result in varying proportional underestimation.
There is an even wider gap between the TESS experience of nearly 500,000 poisoning cases per annum that are treated by providers and the NAMCS/NHAMCS estimate of approximately 2.3 million episodes (ratio = 0.22 based on the data in Table 3-11). This ratio, however, is well within the range of that observed in selected studies that have attempted to determine the proportion of ED cases of poisoning or drug overdose that are reported to poison control centers (see Chapter 7). Nonetheless, summing the number of visits from NAMCS and NHAMCS could potentially overestimate the incidence of treated poisoning due to having more than one visit per episode within a source. For example, some ED-treated cases are referred to outpatient follow-up. To the extent that these were not coded as “follow-up,” but rather as new visits, non-ED incidence may have been overestimated. If the 39 percent ED-referral rate resulted in 10 percent follow-up recorded as a new outpatient visit, the 922,877 outpatient estimate should be discounted to 700,413, and the total combined ED/outpatient incidence to 2,605,307. There is also the risk of overestimation of episodes due to individuals being seen at more than one of the ambulatory settings; however, the NAMCS, NHAMCS, and NHIS suggest that this is not widespread. Based on the disposition and episode of care information available from the most recent years of NAMCS and NHAMCS, discounting the number of visits by 50, 14, and 3 percent for NAMCS, NHAMCS outpatient, and NHAMCS emergency department subsets, respectively, provides a reasonable estimate of poisoning episodes treated in ambulatory settings. The incidence figures presented in Table 3-11 take into account these discounted rates.
If the TESS “telephone consultation only” figure and the NAMCS/ NHAMCS health care provider-treated estimates are combined, an alternative total annual U.S. poisoning estimate of approximately 4 million
cases is obtained. This estimate of annual incidence of poisoning is nearly twice as high as that estimated by the NHIS data and more than 60 percent higher than that based on TESS data alone.
Patients who receive inpatient care for poisoning are almost always admitted to a hospital through the emergency department, physician/ clinic referral, or via transfer from another institution. Thus, NHDS data should not add to the overall estimate of poisoning episodes. This source yields an estimate of 282,012 annual episodes, which is consistent with the discharge status of hospital admission for 265,714 visits provided by the disposition information from the NHAMCS outpatient data and emergency department files combined, and with the assumption already discussed. This estimate excludes any contribution to the hospitalization total from NAMCS, for which hospitalization was noted for two sample observations only (1.9 percent, unweighted). Even if an additional 30,000 hospitalizations were added from this source, the combined NAMCS/ NHAMCS estimate would remain similar (and would be even closer) to the NHDS figure.
Estimates of fatal poisonings range from 1,074 for TESS data to 24,173 for the NCHS analysis of death certificate data for 2001 (climbing to 30,800 when alcohol behavioral disorder coded deaths are included). Death certificate data are generally considered the most reliable source for such data as they also include out-of-hospital deaths (see Chapter 7 for a detailed discussion of the strengths and limitations of death certificate data). It is noteworthy that only one in four in-hospital deaths (based on NHDS) appear to be reported through TESS, compared with a 1:5 ratio of TESS to NAMCS/NHAMCS for poisoning cases receiving direct health care. This suggests that case severity alone does not drive poison control center case consultation as reflected in TESS reporting (also discussed in Chapter 7).
It is important to acknowledge that varying approaches to case definition and coding inclusion may impact the estimates cited above. For example, the inclusion of envenomations of various kinds may have led to inflated survey-based estimates, particularly for nonhospitalized poisoning events. The category of bites/sting is also included in TESS estimates, accounting for 85,713 cases (3.8 percent of the total) in that system in 2001. TESS totals also include adverse drug reactions (35,634; 1.6 percent) and “food poisoning” (41,319; 1.8 percent), categories that were excluded from the other analyses. The inclusion of 6,627 alcohol behavioral abuse coded deaths in the NCHS analysis should also be viewed in the context of TESS reporting, which in the same year reported only 15 ethanol deaths, only 5 of which were not combined with another co-ingestion.
It is also important to acknowledge that these estimates are based on selected major national surveys and databases. We did not attempt to derive estimates from a wider range of possible surveillance data sources,
an undertaking that would have been beyond the scope of this chapter. Another potential limitation of this analysis is that it does not include incidence data that might be inferred from events coded solely as abnormal laboratory findings but not coded as overt illness. To a limited extent, such events could be estimated from some databases, for example, an event coded as an elevated medication level, but not coded on the basis of a concomitant symptom complex leading to a diagnosis of drug overdose. Although such events are generally not considered poisonings per se, tracking such data can be useful from a public health perspective. See Chapter 7 for a detailed description of multiple surveillance resources relevant to various types of poisoning and drug overdose events.
In summary, these analyses suggest that a conservative estimate of the annual incidence of poisoning episodes in the United States is 4 million cases per annum. One in four cases do not appear to lead to any direct ambulatory or inpatient treatments. Approximately 300,000 cases may be hospitalized, 7.5 percent of all events and approximately 13 percent of all those seen by a health care provider at any site. An estimate of fatal poisonings is at least 24,000, which represents 0.8 percent of all poisoning incidents; including ethanol-coded deaths increases this proportion to approximately 1 percent.
These estimates also suggest that the United States has a longer way to go in reaching its 2010 objectives than had been originally anticipated. Our estimate of 8.5 fatal poisonings per 100,000 population is far above the national 2010 objective of 1.5, and even higher than the 1997 estimate of 6.8 used as a baseline. This discrepancy may reflect differences in definitions used. Furthermore, our estimate of nonfatal poisonings associated with emergency department visits (identified through NHAMCS) of 530 per 100,000 population in 2001 is nearly twice the national 2010 objective of 292 per 100,000, and again even higher than the 1997 baseline estimate of 349 nonfatal poisonings per 100,000.
Appendix 3-A
Additional Detail on Survey Sources and Frequency Estimations
NATIONAL HEALTH INTERVIEW SURVEY
This survey has several core data files that include questions asked in every year. For this study, the core files of interest are the person file, which contains demographic information for every individual included in the survey, and the injury/poisoning file, which includes information on injury and poisoning episodes that can be merged back to the person-level information. The injury/poisoning episode section of the questionnaire asks one family member to respond on behalf of the family.
The wording of the question has changed since this section was first administered in 1997. The wording of the screener question was identical in 2000 and 2001 and asked whether anyone in the family was injured or poisoned seriously enough to get medical treatment or advice in the previous 3 months. Weighted estimates must be multiplied by four to obtain annual figures. In addition, specific questions about how the poisoning occurred and the type of poisoning episode (i.e., ICD-9-CM E-codes and diagnosis codes) were only ascertained and coded starting in 2000. For this reason, we only use the NHIS for poisoning data from 2000–2001.
The key NHIS questionnaire items used for this analysis queried survey participants regarding any injury or poisoning to themselves or a household family member over the previous 3 months (specifically “injured or poisoned seriously enough that [you/they] got medical advice or treatment?”). A follow-up item ascertained the nature of the treatment with the following close-ended, mutually exclusive selections: (1) did not receive medical treatment or advice; (2) phone call to doctor or health care professional; (3) phone call to poison control center; (4) visit to doctor’s office; (5) visit to clinic or outpatient department; (6) visit to emergency department; (7) visit to hospital (stayed at least one night); (8) refused; and (9) don’t know. In the NHIS, the kind of injury or poisoning was coded by ICD-9 diagnosis and external cause (E) codes.
The strength of this source as it pertains to understanding the epidemiology of poisoning is that it is population based. In addition, the NHIS can be used to create the denominator population for a consistent application to the other data sources analyzed here. Other than TESS, it is the only source for an estimate of poisoning events for which direct medical care was not received (telephone consultation only). Its main weakness is that it is respondent based (i.e., poisoning episodes are not confirmed by
medical records) and thus subject to recall and nonresponse biases. In addition, poisoning events are relatively uncommon in the dataset; because only 2 years of data are used, some of the estimates are not as robust as desired.
NATIONAL AMBULATORY MEDICAL CARE SURVEY
This source is a national probability sample survey of visits made in the United States to the offices of nonfederally employed physicians classified as working in settings that are “office-based care.” Visits to private, non-hospital-based clinics and health maintenance organizations are included, but those that occur in federally operated clinics are not. Visits from sampled physicians are sampled systematically for abstraction to a form subsequently completed by the physician or the physician’s staff. Sample data are weighted to produce annual national estimates for the noninstitutionalized, civilian population. Data include only actual visits for patient care; telephone calls or visits to pay bills are excluded.
NAMCS includes three groups of data items that can be used to ascertain office-based visits to physicians for poisoning. The first is the “reason for visit” variables, which are up to three of the patient’s complains, symptoms, or reasons for visit in the patient’s own words, listed in order from most to least important. These verbatim responses are then coded later by NCHS staff using a coding scheme that differs from the ICD-9. The second group of items consists of up to three causes of injury, poisoning, or adverse event that resulted in the visit; these are subsequently provided ICD-9 E-codes by NCHS staff. The third group consists of up to three diagnoses, representing the physician’s best judgment at the time, and they are coded to ICD-9-CM codes by NCHS staff. In 2001, a question was added concerning whether this was the first or subsequent visit for a particular problem.
A strength of this system as it pertains to poisoning epidemiology is that it is based on medical records. In addition, the “reason for visit” code provides an additional source of case capture beyond ICD-9-CM coding. Because it is not linked to emergency department or hospital care, it is likely that case selection effects (e.g., a poisoning or toxic exposure event not perceived by the patient as threatening enough to bypass a physician’s office and go directly to an emergency department) are prominent in the mix of poisonings captured by this survey, which may present a limitation. NAMCS has not been featured in previously published estimates of poisoning incidence.
NATIONAL HOSPITAL AMBULATORY MEDICAL CARE SURVEY
This is the hospital ambulatory care complement to NAMCS. Both the outpatient and emergency files contain the “reason-for-visit,” ICD-9 E-code, and ICD-9-CM diagnosis fields contained in the NAMCS data. Thus, NHAMCS has all of the strengths of NAMCS, but captures visits in the hospital outpatient and emergency department settings. Because of the disposition information contained in the dataset, it is also possible to estimate hospital admissions preceded by emergency department care, which can be presumed to be a major route of poisoning admissions to the hospital. The NHAMCS outpatient (non-ED) component may be particularly relevant to low-income or elderly patients who may be more likely to receive care in hospital-based clinics rather than in private practice settings. It is possible to combine these three sources to obtain estimates for all ambulatory visits made in the United States (outpatient NAMCS, outpatient clinic NHAMCS, and emergency department visits from NHAMCS), another strength of these surveys.
NATIONAL HOSPITAL DISCHARGE SURVEY
This source covers discharges from a sample of short-stay hospital visits that are noninstitutional and nonfederal. Up to seven ICD-9 diagnosis codes (including ICD-9 CM and E-codes) can be provided. Because this system includes disposition, it provides an independent source for estimating poisoning-related fatalities for patients who died in a hospital. Because the system incorporated source of admission in 2001, it also provides an estimate of hospital-to-hospital transfers of poisoning cases, a factor that must be taken into account as a “discounting” measure in incidence estimates to prevent double counting of cases. The potential for underutilization of E-codes and for the impact of ranking of poisoning in a severely ill patient with multiple-organ failure (where the underlying poisoning event may be obscured if it falls down the rank order list of diagnostic codes included) may lead to underestimation in this system.
METHODOLOGY
Coding Poisoning and Drug Overdose
The dominant coding scheme used is the International Classification of Diseases (World Health Organization, 1992–1994). Although it is now in its 10th revision (ICD-10), in the United States this latest revision is currently applied only to mortality data. The ninth revision is generally applied to other morbidity and survey data (World Health Organization,
1989). Certain datasets are not coded by either ICD-9 or ICD-10 criteria, such as the TESS poison control center data system (see Chapter 7). Within the ICD coding scheme, provision has been made to differentiate among different types of poisoning and drug overdose events and among different categories of intent. There is no defined grouping of ICD codes that establishes a single category subsuming all poisoning events.
Some of the problems described may be magnified in the ICD-10, in which injury coding (including for poisoning) has changed substantially. Specifically, in ICD-10 it may not be possible for “intent” codes to separate out ethanol-related toxicity from toxic syndromes caused by alcohol substitutes such as methanol. Added instructions for coding deaths further impact definitions by requiring the principal cause of death to be categorized as due to a selected group of mental and behavioral disorders if such a disorder appears among contributing causes in a poisoning death. Thus an acute acetaminophen fatality in a chronic ethanol abuser (if this was listed as a contributing cause) would be coded in ICD-10 as a primary alcohol-related death (World Health Organization, 1992–1994). CDC recently added a series of special “U” codes (allowed for in the ICD-10 scheme) to capture terrorism-related fatalities. Some of these new codes also could be relevant to poisoning, such as U01.7 for terrorism involving chemical weapons (http://www.cdc.gov/nchs).
Data Management
As a precursor to pooling data for multiple years for each source, the proportion of poisoning observations for each year was examined to ensure that poisoning estimates were relatively stable during the period. Each source was analyzed separately, but demographic variable recoding was done on each to create consistent categorical variables for gender, age, race, and region. Estimates associated with relative standard errors (ratio of the standard error to its estimate) >.3 or based on a small sample size were retained, but are noted. Sampling weights included in the data files were rescaled to an annual timeframe and used to create population estimates. SUDAAN, the standard computerized statistical package that calculates estimated rates taking into account the sampling weights built into the design of each survey, was used whenever possible to adjust for the multistage sampling design of the surveys.


