
2
Six Reasons to Pay Attention to the Patent System
INTRODUCTION
For more than half a century the United States has led the world in the development of new technologies and creation of new products. Our international competitive advantage rests in part on the encouragement given to scientific and technological progress by public and private institutions. An open entrepreneurial economy, fueled by effective capital markets and vigorous competition, helps translate these advances into industrial innovation.
This capacity did not appear to be so robust or enduring in the 1970s, when productivity growth rates fell sharply, nor in the 1980s, when Japanese competition fostered the notion that U.S. manufacturing industries were on the decline. But by the mid-1990s the U.S. economy was again exhibiting high productivity growth. A variety of econometric and sectoral studies attributed this robust performance to high rates of innovation, especially in information technologies—semiconductors, computer software, and telecommunications—and their application across the growing service sector of the economy as well as in manufacturing (NRC, 1999a,b; Jorgenson and Stiroh, 2002). In spite of the economic slowdown and the stock market slump in 2001, productivity growth has continued at a rate higher than at any time since 1973. Even through economic cycles, innovation is alive and well in the American economy.
Granting and protecting intellectual property rights are together one of the oldest direct government interventions in the economy and the only policy instrument expressly ordained by the U.S. Constitution to promote innovation. Patents on novel, useful, non-obvious inventions and copyrights on works of literature, art, and other expression are granted on the assumption that although firms and
individuals have many incentives to invent and create, some innovations are less likely to be forthcoming in the absence of a grant of exclusive rights providing an opportunity to recoup initial investments while excluding imitators. As a quid pro quo for a period of exclusivity, patents, in addition, are assumed to promote innovation by disclosing know-how that might otherwise remain secret.1
REASONS THE PATENT SYSTEM MERITS ATTENTION
High levels of innovation in the United States would seem to be evidence that the intellectual property system is working well and does not require fundamental changes. But there are at least six reasons why intellectual property policy has drawn the National Academies’ attention and deserves continued scrutiny.
-
The patent system, like other important innovation policy tools, merits periodic examination to help ensure the vitality of the national innovation system.
-
Significant changes in the patent system during the 1980s and 1990s, generally in the direction of extending and strengthening patenting, should be evaluated.
-
The use of the patent system for inventions related to research tools and discoveries has prompted a debate about whether such patents provide incentives to innovate or may in some circumstances impede research progress.
-
Patents are being more actively acquired and vigorously enforced.
-
The roles and benefits of patents vary greatly from one technology or industry to another, but there has been very little systematic investigation of the differences.
-
In the meantime the financial and opportunity costs of acquiring, defending, and challenging patents are increasing.
Preserve America’s Capacity to Innovate
The American economy’s innovation capacity, although resilient, is not foreordained. To sustain it, all of the chief public policy instruments affecting its vitality deserve periodic examination by analysts as well as stakeholders.
In 1999 the National Academies’ Board on Science, Technology, and Economic Policy completed an in-depth study of 11 U.S. manufacturing and service industries to determine whether the impression of stronger competitive performance in the 1990s compared to the 1980s was accurate, and if so, what were its sources. The board concluded that the general picture had improved, thanks to a variety of factors, including private sector strategies—firm repositioning, product specialization, consolidation, internationalization of operations, manufacturing process improvements, and cost reduction—driven by vigorous foreign and domestic competition. In addition, the U.S. government followed a supportive mix of macroeconomic and microeconomic policies—deficit reduction, conservative monetary policy, scaling back of economic regulation of transportation, finance, and communications, trade liberalization, relatively permissive antitrust enforcement, and at least until the 1990s, continued support of research across a broad range of scientific and engineering fields. The board observed that none of these favorable conditions was permanent and in some areas—the slowing production of domestic science and engineering talent and the real decline in public support of research in most of the physical science and engineering fields for nearly a decade—the trends were troubling (NRC, 2001).
In one area of public policy—intellectual property rights—the board concluded that evidence of its contribution to the industrial resurgence was lacking. This was not because intellectual property policy was static; on the contrary, it was of one of the most dynamic areas of microeconomic policy in the 1980s and 1990s. Rather, the uncertainty was attributable to the fact that the economic effects of intellectual property policy developments received little study.
This report addresses only the patent system because it affects innovation in more economic sectors than any other form of intellectual property protection and because copyright policy, at least in the context of digital media, has been the subject of recent National Academies study (NRC, 2000). By contrast, the National Academies have not examined the patent system broadly since 1936, and until the Federal Trade Commission issued a report of the inquiry that was conducted in parallel with our investigation it had been more than a decade since the last government review of patent policy.
Since the Patent Act of 1952, the last comprehensive restatement of patent law, three government-appointed panels have deliberated and made legislative and administrative recommendations. The most recent, the Advisory Commission on Patent Law Reform, was appointed by Commerce Secretary Robert Mosbacher in the first Bush administration and reported to his successor, Barbara Franklin, in 1992. Earlier panels were the presidentially appointed Commission on the Patent System, reporting to President Lyndon Johnson in 1966, and the patent policy subcommittee of the Advisory Committee on Industrial Innovation, a multi-agency policy review at the end of the Carter administration. Each of these committees was composed almost entirely of senior managers of Fortune 100 companies, in-house patent counsels of such firms, and members of law firms
with large corporate clients. They included no economists or other social scientists, legal scholars, active scientists or engineers, independent inventors, investors in technology-based firms, or people with recent experience in the judicial branch of government.
Despite its utilitarian economic rationale and bearing on the progress of science and technology, patent policy has never been an integral element of either economic or science and technology policy making. Much attention has been focused on other countries’ conformity with contemporary U.S. standards of intellectual property protection as an aspect of trade policy, on the allocation of intellectual property rights to the results of publicly funded research as an aspect of research and development (R&D) policy, and on the exercise of intellectual property rights as an aspect of antitrust enforcement. Patent policy per se, nevertheless, has not been on the agendas of the Council of Economic Advisers, National Economic Council, or commerce and science committees and subcommittees of Congress. Rather, it has been the preserve of practitioners, corporate stakeholders, the U.S. Patent and Trademark Office (USPTO), Senate and House Judiciary Committees, and the federal appellate courts.
As the introduction to the collected papers commissioned for this project suggests (Cohen and Merrill, 2003), there has been a blossoming of empirical research on and theoretical analysis of the functioning of the patent system during the past 15 years. Although this literature falls far short of providing a definitive answer to the general question, “Are patents doing their job in the information economy?” it is beginning to describe the role patents play in important industrial sectors and to assess the effects of policy changes implemented during this period.
In short, a study drawing upon a wider range of expertise and experience is timely. Domestically, the fact that the innovation system of which intellectual property policies are a part is working well by historical and international comparative standards suggests that the patent system is not broken. But there may be instances in which the use of patents is not working as well to promote innovation as we might hope and well-thought-out changes could improve the system’s functioning. Moreover, what the United States does with respect to intellectual property policy influences what other countries do, both through negotiation and by example.
Substantial Changes in Patent Policy
The patent policy landscape has changed significantly in the last 20 years, and the consequences have not been examined systematically.
At the end of the 1970s the patent system was widely perceived to be weak and ineffective, unable to keep up with fast-moving technological changes, under attack by antitrust authorities, and of only limited value to patent holders. Patenting by U.S. inventors residing in the United States was constant or declining through the 1970s (Jaffe, 2000). Beginning in 1980 a series of legislative actions,
judicial decisions, executive branch initiatives, and international agreements largely spearheaded by the United States2 ostensibly strengthened the rights of intellectual property owners and extended intellectual property rights (IPRs) into new areas of technology.3 This policy thrust at the national level has extended to other forms of intellectual property protection. For example, the Digital Millennium Copyright Act (DMCA) of 1998 strengthened the protection of material in digital form, while the Sonny Bono Copyright Extension Act of 1998 lengthened copyright terms from 50 years to 75 years beyond the lifetime of the creator. The 1996 Economic Espionage Act subjected some trade secret misappropriation to federal criminal penalties, whereas previously it had been a matter of state civil law. And the Trademark Dilution Act of 1995 extended the rights of mark holders beyond the avoidance of consumer confusion. Most important from our perspective, many of the IP policy changes involved the patent system. These changes can be classified as steps to (1) extend patenting to new subject matter; (2) strengthen the position of patent holders vis-à-vis infringers; (3) encourage new classes of patentees; (4) extend the duration of some patents; and (5) relax antitrust limitations on the use of patents.
New Technologies
-
In Diamond v. Chakrabarty (1980)4 the Supreme Court confirmed the eligibility for patenting of organisms with artificially engineered genetic characteristics. Thereafter the USPTO granted innumerable biological material as well as biotechnology final product patents.
-
The Supreme Court in a 1981 decision, Diamond v. Diehr,5 upheld the patentability of inventions incorporating a computer software program as an adjunct to a physical process, ushering in an era in which software is commonly protected under both copyright and patent law.
-
The Court of Appeals for the Federal Circuit (“Federal Circuit”) in a 1998 case, State Street Bank & Trust Co. v. Signature Financial Group,6 upheld the
|
2 |
An exception is the sui generis protection of databases adopted by the European Union in 1996. So far, Congress has not adopted the European system (http://www.arl.org/info/frn/copy/iff1.html). |
|
3 |
From a legal perspective it may be more accurate to characterize the court decisions addressing the patentability of genetically modified organisms, software, and business methods as confirming the patentability of all technologies rather than as extensions of patenting. The latter term reflects common understanding, however. |
|
4 |
Diamond v. Chakrabarty, 447 U.S. 303, 100 S. Ct. 2204, 65 L. Ed. 3d 144, available at 1980 U.S. LEXIS 112, 206 U.S.P.Q. (BNA) 193 (1980). Although now taken for granted, the case was decided on a 5-4 vote. |
|
5 |
Diamond v. Diehr, 450 U.S. 175, 101 S. Ct. 1048, 67 L. Ed. 2d 155, available at 1981 U.S. LEXIS 73, 209 U.S.P.Q. (BNA) 1 (1981). |
|
6 |
State St. Bank & Trust Co. v. Signature Fin. Group, 149 F.3d 1368, available at 1998 U.S. App. LEXIS 16869, 47 U.S.P.Q.2d (BNA) 1596 (Fed. Cir. 1998). |
-
patentability of methods of doing business as well as that of software, so long as in either case the invention is expressed as a method that accomplishes useful, concrete, tangible results.
Strengthening Patent Holders Vis-à-Vis Alleged Infringers
-
In 1982 Congress established the Federal Circuit to handle, among other matters, patent litigation appeals from the federal district courts and appeals from decisions of the Board of Patent Appeals and Interferences (BPAI), the administrative law body of the USPTO. As a result, the wide variation in circuit appeals courts’ treatment of patent infringement cases was sharply curtailed, generally to the benefit of patent holders. The success rate of plaintiffs (that is, findings that a patent was valid and infringed) in appeals increased significantly as a result of court reform.7
-
In the same period, plaintiffs’ damage recoveries in a handful of highly visible patent suits had a significant demonstration effect. For example, in its suit against Kodak for infringement of instant camera patents, Polaroid was awarded nearly $900 million and Kodak was ordered to cease production.
-
The 1988 Process Patent Amendments Act8 enabled U.S. process patent holders to block the import of foreign products produced by methods infringing their patents as well as to hold domestic sellers or users of a product made by a patented process liable for infringement.
-
As part of the Uruguay Round trade negotiations under the General Agreement on Tariffs and Trade (GATT), the Trade-Related Aspects of Intellectual Property Rights (TRIPS) Agreement was concluded in 1994. It requires World Trade Organization (WTO) members to protect most commercially important technologies and limits their ability to compel the licensing of patents. In addition to multilateral negotiations, the United States pursued strong IPR protection in a series of bilateral and regional venues in the 1980s and 1990s and continues to do so.
-
Until very recently it was widely believed that purely research uses of patent inventions were shielded from infringement liability by an experimental use exception first articulated in 19th century case law. But in Madey v. Duke University,9 a suit brought against the university by a former professor and laboratory director, the Federal Circuit dispelled that notion by holding that there is
-
no protection for research conducted as part of the university’s normal “business” of investigation and education, regardless of its commercial or noncommercial character.
New Patent Holders
-
The Bayh-Dole Patent and Trademark Amendments Act of 198010 made it the general rule that universities, other nonprofit institutions, and small businesses could acquire exclusive rights to inventions developed with federal support. Partly as a result, patenting by universities soared although their share of the total remains very small. Gradually, this policy was extended to all federal contractors and research grantees with narrow exceptions. The Stevenson-Wydler Act of the same year gave federal research agencies and their investigators additional encouragement to patent and license the results of in-house research.
Extended Patent Terms11
-
The 1984 Drug Price Competition and Patent Restoration (Hatch-Waxman) Act,12 while exempting from infringement regulatory testing of generic pharmaceuticals, allowed patent term extensions on new drugs of up to five years if the drug’s approval is subject to regulatory delay.
Relaxed Antitrust Limitations on the Use of Patents
-
From the 1980s onward there was a marked evolution in the attitude of the Justice Department’s Antitrust Division and the Federal Trade Commission toward business conduct involving patents, resulting in a much more nuanced and pro-patent position (FTC, 2003). In 1981 the division’s deputy assistant attorney general abandoned a list of nine licensing practices that the department a decade earlier had characterized as automatically illegal.
-
The 1988 Justice Department Antitrust Enforcement Guidelines for International Operations outlined the consumer benefits from intellectual property licensing and adopted a rule-of-reason approach to such issues.
-
In 1995 the Justice Department and the Federal Trade Commission jointly issued Antitrust Guidelines for the Licensing of Intellectual Property, reiterating the 1988 principles and declaring that “the Agencies do not presume that intellectual property creates market power in the antitrust context” and intellectual property licensing is “generally procompetitive.”
Some of the reasons for this unidirectional “ratcheting up” of patent rights are apparent—a general belief in the efficacy of the intellectual property system and a reluctance to disrupt reasonable investment-backed expectations once created by law or regulation. Strictly speaking, whether the changes contributed to a “strengthening” of patent rights is debatable. Some argue that a lowering of the threshold conditions of patenting, especially the standards of utility and non-obviousness, has led to the issuance of large numbers of “weak” patents unlikely to stand up in litigation. Others have defined “strength” as a function of the breadth of individual claims in issued patents (as well as the range of patentable subject matter, the duration of patents, and the likelihood that granted claims will be enforced in court against infringement or invalidity challenges) and point out that recent decisions of the Federal Circuit have forced applicants and examiners to narrow and possibly proliferate patent claims (Gallini, 2001). What is not debatable is the marked turnaround in public policy that has led to the apt characterization of the last 20 years as a “pro-patent era” (Cohen, 2002).
The effects of some of these actions were only beginning to play out when the Mosbacher Commission reported 10 years ago, and other significant changes lay ahead. The patent system is always evolving, and the effects of these changes take a considerable period of time to be felt. In the meantime it is important to ask several questions: What, so far as we can tell, have been the costs and benefits of the actions taken in the last several years and the consequences intended or not? What should be the direction of patent policy in the next decade and beyond? Should we continue to extend patenting and patent rights or modify that course?
Expanded Patenting of Research Tools and Discoveries
There is disagreement whether patents on discoveries and tools of research, an expanded domain of patenting,13provide needed incentives to innovate or, because of difficulties and costs entailed in accessing the subjects of these patents, may impede the progress of scientific investigation.
Advances in most technologies are cumulative, that is, they build upon one another. As a result, how exclusive rights to a pioneering invention affect follow-on innovation has always been an issue for theorists and occasionally historians
and policy makers (Merges and Nelson, 1990; Scotchmer, 1991). This influence is a function of both the scope of patent claims allowed and the behavior of patent owners. For a few notable commercial product inventions—Edison’s incandescent lamp14 and the Wright brothers’ airplane stabilization and steering system15—broad pioneering patents were exercised in a manner that at least temporarily deterred competitors from making further improvements. The patent holders either aggressively enforced their rights or refused to enter into licensing agreements. Radio illustrates the possibility that when separate patent holders with broad enabling patents (in this case, Marconi Company, De Forest, and De Forest’s main licensee, AT&T) cannot agree on licensing terms, technological progress may be impeded for a time. Eventually, in all of these cases the obstacles were overcome by industry consolidation or government intervention in or near wartime to compel licensing or patent pooling (Merges and Nelson, 1990; Merges, 1994).
The issue has recently reemerged in a new context—not whether failure to license or cross-license product patents is impeding further innovation but whether patents on some research tools and foundational discoveries have the potential to stymie further scientific research well upstream of commercial products (Nelson, 2003). The concern involves a rapidly expanded domain of patenting—inventions that are useful solely or primarily for further research. Previously, in most cases these techniques and discoveries became part of the public domain of scientific knowledge available without restriction for use by all investigators, especially where they were the products of publicly funded research at institutions of higher education. Open academic science thrived not on the basis of altruism but because the rewards for successful work are reputational and the benefits that go with prestige. That they are now being patented may be as much a function of changes in the innovation system as of the utilization of patents in new fields of technology.
Underlying the concern is the presumption that the payoffs not only of the most fundamental scientific research but also of research directed at solving practical problems are frequently serendipitous, and the chances of progress are greatest not only when scientists are free to attack what they see as the most challenging scientific problems in the ways they think most promising but also when competing approaches are in fact pursued (Bush, 1945). A closely associated belief is that scientific progress requires that research results be open for all to use, attempt to replicate, and evaluate (Merton, 1973).
Three different problematic circumstances have been hypothesized:
-
Access to patented foundational discoveries is denied, foreclosing research avenues to other investigators (Merges and Nelson, 1990).
-
Access to patented discoveries or research tools is possible but on terms that make their use too costly, at least for nonprofit research performers.
-
Pursuit of research is effectively blocked because of the practical difficulty of acquiring rights to use all of the needed patented elements of research held by diverse parties (Heller and Eisenberg, 1998).
The concern has focused primarily on the field of biotechnology, where there has been an increase in patents on a variety of inputs into the process of discovering a drug or other medical therapy or method of diagnosing disease as well as the tools of plant modification—genes and genetic sequences, drug targets and pathways, antibodies, and so forth. There is no ostensible reason why concern about the impact of patents on science will be confined to biomedical research, but it is easy to understand why the foreclosing or restricting of opportunities to develop better medical therapies and diagnostics is alarming to some. Moreover, with respect to biotechnology, where many of the patents are on naturally occurring substances, albeit ones that are isolated and purified, there may be fewer opportunities to avoid patent infringement by “inventing around” existing claims than there are in other fields.
This set of concerns is by no means universal, and not all members of this committee share it. Historically, the existence of blocking patents is exceptional, and although breakdowns in negotiations occur, rights over essential inputs to innovation are routinely transferred and cross-licensed in industries, such as semiconductors and communications, where there are numerous patents associated with a product and multiple claimants (Levin, 1982; Hall and Ziedonis, 2001; Cohen et al., 2000). The Moving Picture Experts Group (MPEG) Consortium is a recent case in point.16 In Japan, where across the manufacturing sector there are many more patents per product than in the United States, licensing and cross-licensing are commonplace (Cohen et al., 2002). This is likely to be the case with most research tool patents, which are of little or no value unless the tools are used widely.
Nor can it be assumed that patents on genes, genetic sequences, proteins, and other natural substances effectively preclude circumvention. Generally speaking, diseases result from a variety of mechanisms rather than a single mechanism and can be treated using different pathways. Competing patented pharmaceutical inventions—for example, Viagra and Levitra, Previcid and Nexium—can have similar biological effects. Thus, at least in some cases, the established method of circumventing a monopoly patent position applies in biomedicine and in agricultural biotechnology as it does in other fields. The incentive to make the effort depends on the market prospects.
Finally, it is argued that if many “upstream” innovations have become sufficiently valuable to patent, their development in some cases may depend upon the patent system’s incentives. Although it is likely that most research tools are created simply to facilitate a research objective or to overcome obstacles, it may be that some valuable tools would not be invented without the incentive of exclusivity.
Even if there were problems of impediments to research, there would not be agreement on its sources or remedies. Some observers believe that some research tool patents have crossed over into traditionally unpatentable subject matter—scientific facts or principles or natural phenomena with negligible human intervention. Others believe the issue is one of unreasonably low standards of utility or non-obviousness, or excessive patent scope that allowed claims on some research tool patents covering more than the described invention and its application. Still others are of the view that the problem would not exist or would be manageable if noncommercial research activities were shielded from patent infringement liability. Nonetheless, it is the conflicting factual claims that merit first attention, and we address them in the next chapter.
Surge in Patent-Related Activity
Patents are being more frequently acquired and vigorously asserted and enforced. The surge in patent-related activity is indicative that firms in a variety of businesses as well as universities and public entities attach greater importance to patents and are willing to incur higher costs to acquire, exercise, and defend them.
The number of U.S. patents issued to both U.S. and foreign entities nearly tripled from 66,290 in 1980 to 184,172 in 2001.17 If patenting by U.S. entities is calibrated by domestic population growth or R&D spending, the increase is less but still significant, especially in the 1990s (see Figures 2-1 and 2-2). Patents per million dollars of R&D rose about 47 percent from 1985 to 1997, increasing from 0.18 patents per million dollars to 0.34 patents per million dollars. An exception is pharmaceuticals whose R&D investment growth has exceeded its patenting rate.
Economists who have studied the phenomenon are not in complete agreement about the causes of the patenting surge, but most give a good deal of credit to the policy changes in the 1980s and 1990s, especially the creation of the Federal Circuit and the resulting higher rates at which patent validity and patent holders prevailed in litigation (Kortum and Lerner, 1998; Hall and Ziedonis, 2001). In addition, the increasing competitiveness of national and global markets has no
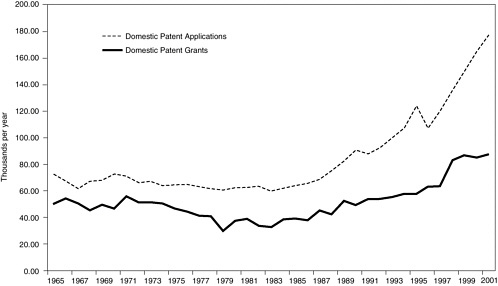
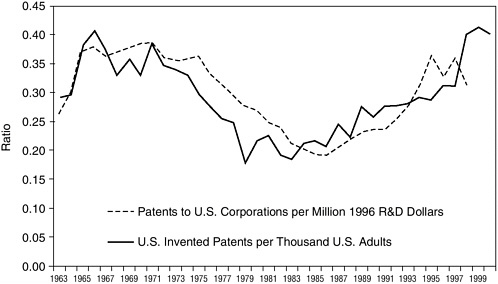
FIGURE 2-2 Patent and corporate R&D and population ratios. SOURCE: Jaffe (2000), USPTO, NSF Science Resources Statistics, U.S. Census.
doubt encouraged firms to exploit new ways of protecting market positions, especially since economic regulation, trade barriers, and artificial monopolies have been reduced. A case in point is the telecommunications industry (Bekkers et al., 2002).
The growth is not distributed evenly across technology areas or industries, however. The number of patents per R&D dollar, used by many as a measure of the “patent propensity” of firms, increased by about 50 percent for U.S. corporations during the 1985-1998 period. But Hicks and colleagues’ findings (2001), although not spanning precisely the same period, suggest that information technology (IT) may account for much of this increase. IT patents per R&D dollar increased from an average of 0.28 patents per million dollars to 0.48 patents per million dollars between the periods 1989-1992 and 1993-1996.18 In contrast, in health, chemical and polymer, and all other technologies, the patent propensity over the same period changed, respectively, from 0.23 to 0.24, 0.38 to 0.38 (no change), and 0.37 to 0.35 (a decline). If patents are classified by industry rather than technology, the IT sector also accounts for most of the growth in patenting (Hall, 2003a). This is reflected in any recent list of companies receiving the most U.S. patents. In 2002, eight of the top ten companies receiving U.S. patents were predominantly in IT; five of those were Japanese-headquartered.
TABLE 2-1 Higher Propensity to Keep Patents Valid
|
Patent Renewal Rates (%) |
FY1997 |
FY1998 |
FY1999 |
FY2000 |
FY2001 |
FY2002 |
|
First stage (end of 3rd yr) |
80.3 |
81.8 |
83.1 |
84.3 |
84.5 |
85.1 |
|
Second stage (end of 7th yr) |
55.8 |
56.6 |
57.9 |
59.4 |
59.9 |
59.5 |
|
Third stage (end of 11th yr) |
35.4 |
36.1 |
37.7 |
38.8 |
39.1 |
38.4 |
|
SOURCE: USPTO, FY 2000 and FY 2002 USPTO annual reports. |
||||||
On the other hand, all types of firms, not just existing players in the patenting arena, contributed to the increase in patenting. In fact, the share of patents going to small firms and the share going to firms with few previous patents have both increased in recent years (Jaffe, 2000). Likewise, the share of patents issued to universities and government laboratories increased in the 1980s and 1990s. University patents per dollar of research spending more than tripled from 1980 to 1997; the patent propensity of federal laboratories was on a similar course until 1993, when R&D spending in areas other than health started to decline.
Since the 1980s patent holders have been required to pay maintenance fees at the end of the third year, seventh year, and eleventh year to continue to be able to enforce their patents. A large majority of patents are renewed at the first stage, but nearly one-half are allowed to expire at the second stage, and up to two-thirds lapse at the end of the third stage. Nevertheless, the proportion of patents that are renewed has been increasing at all stages in recent years (see Table 2-1).
Unfortunately, there are no aggregate data on patent-related licensing transactions although a few firms have reported rapid growth in licensing revenue, depending on business cycle conditions. IBM’s licensing revenue peaked at more than $1.6 billion in 2000 (Berman, 2002). Lucent Technologies’ patent portfolio yielded $500 million in 2000.19 Texas Instruments has pursued a litigation-based strategy. Patented technology is increasingly perceived as having more strategic importance than previously as reflected in the creation of intellectual property practices by nearly all large consulting firms, the emergence of specialized firms that analyze clients’ patent holdings and counsel them on using patent portfolios to obtain licensing revenue, the advent of venture-backed firms that purchase unexploited patents and assert them, the use of patent information to pinpoint strategic trends and stock investment opportunities, and the appearance of business management commentary on the importance of a firm’s identifying lucrative licensing prospects among its latent patents (Rivette and Kline, 2000). This is, of course, consistent with the frequent observation that many forms of intangible assets—workforce caliber, R&D, brands, and distinctive competences as well as
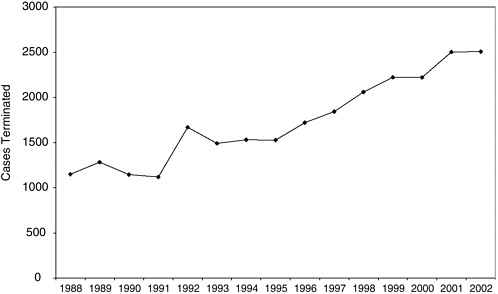
FIGURE 2-3 Federal district court patent lawsuits terminated by fiscal year. SOURCE: Federal Judicial Center Research Division, Integrated Data Base.
NOTE: “Terminated” includes judgments, dismissals, settlements, transfers, and remands.
intellectual property—have increased in value relative to plant and equipment assets.
Another area of rapid growth in patent activity is litigation and legal representation, the latter in all formal processes involving patents (i.e., patent prosecutions, licensing, and litigation). The number of patent lawsuits settled in or disposed by federal district courts doubled between 1988 and 2001, from 1,200 to nearly 2,400 (see Figure 2-3).20
The number of practitioners specializing in intellectual property law and affiliating with the American Bar Association (ABA) Intellectual Property Section increased 39 percent between 1996 and 2002 while the ABA membership overall grew 6 percent over the same period (see Figure 2-4).
Many companies rely less on patents than on other means such as marketing, lead time, production and distribution efficiencies, secrecy, and complementary services to achieve market advantages. That is particularly true from the perspective of R&D managers, who, with the notable exceptions of those in pharmaceuticals, chemicals, and medical equipment, have in a series of surveys ranked patents fairly low as a means of protecting inventions and exploiting inventions
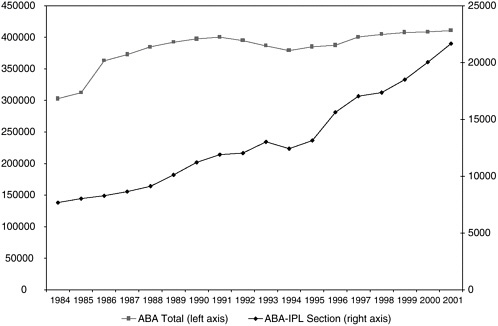
FIGURE 2-4 American Bar Association membership: Intellectual Property Law Section and total. SOURCE: American Bar Association.
(Scherer et al., 1959; Taylor and Silbertson, 1973; Mansfield, 1986; Levin et al., 1987; and Cohen et al., 2000). But among R&D executives of large firms there has been a modest increase in the importance attached to patents between the so-called Yale survey conducted in 1983 by Levin and colleagues and the 1994 Carnegie-Mellon survey (CMS) conducted by Cohen and colleagues. For the protection of product innovation, patents were ranked first or second in 7 of the 33 industries in the Yale survey and in 12 industries in the CMS survey (Cohen, 2000).
This is consistent with other indirect evidence that patents have come to occupy a more central role in corporate decision making. Allison and Lemley (2002) compared a random sample of 1,000 patents issued between 1996 and 1998 with a similar random sample issued 20 years earlier (1976-1978) to determine how the patent system changed over time. Two dramatic changes emerged from the data. First, obtaining a patent has become a more complex process, involving more claims, citing more prior art, taking longer, and involving more refilings. Second, patents today are much more heterogeneous than their counterparts two decades ago. Allison and Lemley suspect that changes in technology and prior art search methods (for example, automated searches of scientific and technical literature) account in part for the changes, but the increased salience of
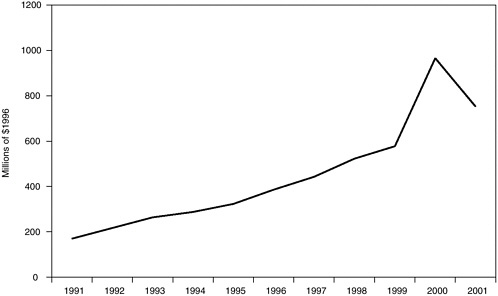
FIGURE 2-5 Adjusted gross licensing income of U.S. research universities. SOURCE: AUTM (2003).
patents to U.S. business may offer a broader explanation of the findings. An increase in the perceived importance of patents has led patentees to invest more in the process of application and examination—asserting more claims, citing more prior art, more frequently amending and refiling applications, tolerating the longer time the examination takes, and even seeking to have their issued patents re-examined when previously unknown prior art comes to light,21 presumably in order to enhance the eventual patent’s value in licensing and litigation.
Perhaps the clearest instance in which the increase in patent-related activity is associated with perceptions of the increasing value of patents is in higher education. Beginning in 1991, university licensing revenue, chiefly from patents, increased nearly three times, from $200 million to $550 million in less than a decade (see Figure 2-5).
Closer examination reveals that a large majority of this revenue derives from a relatively few biomedical inventions and flows to a handful of institutions whose receipts significantly outpace the expenses of patenting, technology transfer, and litigation. The top 10 university patent holders accounted for 66 percent of licensing revenue in 2000 (AUTM, 2003). Nevertheless, the uncertain odds of pay-off have not deterred research institutions from investing heavily in such
|
21 |
See Appendix A, A Patent Primer. |
operations. In 1980, 24 universities reported having technology transfer offices. By 2000 nearly all research institutions had them.
Varied Roles and Uncertain Benefits of Patents
The benefits of more patents in encouraging research and development and simulating innovation appear to be highly variable across technologies and industries and, conceivably, over time; but the industry-specific and comparative research is inadequate to determine the extent of the benefits and the circumstances in which they apply. In many cases patenting activity has departed from its traditional role and has become strategic. Some firms are building large patent portfolios to gain access to others’ technologies and reduce their vulnerability to infringement litigation. This may not be a new phenomenon, but the number of players and the number of patents needed to pursue a defensive strategy have almost certainly increased
The traditional rationale for patent protection is to increase the incentive to invent by conferring the right to exclude others from making, using, or selling the invention in exchange for foregoing secrecy by publishing the invention, making the information available for others to build upon. It is often assumed that in a highly competitive environment firms will not invest as substantially in the development of new products and processes without the ability to protect their advances from imitation. But there are theoretical reasons to question how substantial the incentive of patenting is and how broadly the incentive operates across industries. The cost of disclosing the details of one’s innovation to competitors through patent publication may be greater than the gain from patenting (Horstmann et al., 1985).22 The competitive position of rival firms patenting in the same technological domain may be even more enhanced by extensive patenting (Gallini, 2002). And, as we have described, where innovation is cumulative, it matters how and to whom intellectual property rights are first allocated. Subsequent inventors and their incentives and disincentives for research and innovation are affected by the willingness of early patent holders to license each other in instances where inventing around the patents would be difficult. Thus, where innovators are followers, increasing patent strength could increase or it could reduce their incentives to innovate (Merges and Nelson, 1990; Scotchmer, 1991, 1996; Green and Scotchmer, 1995; O’Donoghue et al., 1998; and Gallini, 1992).
In the only empirical study to date attempting to determine a causal link between patenting and R&D, Arora and colleagues (2002) attempt to estimate the additional payoff attributable to patenting an invention relative to the payoff of
|
22 |
The cost of disclosure, like the benefits of patenting, probably varies among technologies. Notwithstanding enablement and written description requirements (see Appendix A), some argue that software innovators’ disclosures mean little without a requirement to reveal source code in a patent application. |
not patenting it and to link that difference to R&D investment in a number of manufacturing industries. Although as with all models the authors use simplifying assumptions that may be questioned, they nonetheless take into account that the appropriability incentive of patenting and R&D decisions are both driven by many of the same factors. The model also considers the role of patents in promoting R&D spillovers, the R&D efficiency gain from the information disclosed in patents, and that if one firm benefits from stronger patents in its line of business so in all likelihood will its competitors. They find that patents have the greatest positive effect on R&D spending in pharmaceuticals, biotechnology, medical instruments, and computers. In semiconductors and communications equipment the incentive effect is much lower, although still positive and not negligible. Although representing an important advance on previous research, the study is not a comprehensive analysis of the social welfare effects of patents. For example, it does not consider the positive or negative impact of patent use on industry entry, which could have an important bearing on innovation. Finally, although the analysis is sensitive to the possible substitution of other appropriability mechanisms (such as secrecy or lead-time advantages) for patents at the margin, it cannot project the possible impact on innovation of eliminating patents altogether.
In the nonmanufacturing part of the economy, it is less clear that patents induce additional investment, for example, in software advances and business method improvements. Possibly as a result, in part, of trade secrecy and copyright protection, invention flourished in both fields well before the advent of patent protection, and open source software development continues under a different incentive system (von Hippel, 2001). Bessen and Maskin (2000) argue that the advent of software patents ushered in a period of stagnant, if not declining, research and development, but they produce no evidence of a direct link between the two phenomena. The fact is that the role and impact of patents in the service industries and service functions of the manufacturing economy have not been studied systematically.
The quid pro quo for giving the patent holder the right to exclude others is to compel disclosure of the invention in terms that enable others to replicate, modify, and circumvent it. Conceivably, the surge in patenting over the past 20 years has resulted in the publication of a great deal of technology that otherwise might have remained secret, and its disclosure might have enhanced the productivity and efficiency of the research and development process. Cohen and colleagues (2002) cast some doubt on this hypothesis, reporting that U.S. corporate R&D managers, relative to their Japanese counterparts, consider patents a much less important source of intelligence on the R&D activities of their rivals than other sources of information, such as publication or technical meetings. The U.S. survey findings are similar to the results of the European Community Innovation Surveys in which firms rank customers, exhibits, conferences, journals, suppliers, competitors, and nonprofit institutions ahead of patent disclosures as technical information sources (Arundel et al., 2002). On the other hand, Cohen and colleagues acknowledge the
possibility that in industries such as pharmaceuticals and biotechnology firms allow or encourage their R&D personnel to publish or present results to scientific meetings once patents have been applied for. In those cases the patent system plays a positive indirect role in information diffusion.
The “pro-patent” era is unquestionably associated with a rapid growth in the markets for new knowledge. On the basis of secondary data, Arora and colleagues (2001) roughly estimate that the value of technology licensing in the United States increased from $24 billion in 1990 to $44 billion in 1995 in constant dollars, and the number of deals increased from more than 200 to well over 2,100. Anand and Khanna (2000) support the hypothesis of a direct relationship by showing that licensing is more frequent in industries where patents are also prevalent. On the other hand, data distinguishing licenses of patents from other licenses are not available; the latter might have increased more rapidly.
Patenting can be an important strategic tool for firms without being either a significant direct stimulus to R&D or a source of technical information on the direction of R&D or other activities of competitors. This appears to be the case in semiconductors and other complex product technologies where it is common for there to be hundreds of patentable elements in one product, with the consequence that no one firm is likely to hold all the rights necessary for a product’s commercialization (Cohen et al., 2000; Hall and Ziedonis, 2001). Here mutual dependence on competitors’ technologies or mutual vulnerability to other firms’ assertions of their patents encourages patenting primarily for the purposes of trading rights, usually by means of cross-licensing arrangements, and avoiding litigation. It is common that in such cross-licensing arrangements one firm pays a royalty to the other firm as a “balancing payment,” recognizing the disproportionate strength or impact of the recipient firm relative to the other cross-licensing firm. Nevertheless, the avoidance of litigation is important, since litigation can be especially damaging in an industry where a new product can provoke multiple infringement suits and the capital investment required to produce it is very large.
The pattern of patenting and licensing in semiconductors could represent an active, efficient market in leading-edge technologies or a cost saving relative to litigation. In either case the costs of strategic patenting are not trivial and may redirect resources away from productive research or raise costs to consumers. Moreover, the practice may encourage patent portfolio races among firms trying to gain a negotiating advantage vis-à-vis each other. Participants in the committee’s public meetings described this pattern as prevalent in both semiconductors and software, with potential to spread to other sectors on the heels of business method patents. The patent system may also affect the formation of new firms and the innovation associated with entry. Here, too, both theoretical considerations and the extremely limited empirical evidence point in different directions, even in the same industrial context. In semiconductors, for example, the need to have substantial patent assets to trade in order to participate in the pervasive cross-licensing of portfolios probably acts as a barrier to new entrants, although the enormous
capital required to establish semiconductor manufacturing capacity is an even more substantial barrier. Yet, in a study commissioned for this project, Ziedonis (2003) suggests that patent protection has been critical to the rapid growth in the number of semiconductor design (“fabless”) firms that do no manufacturing. It seems likely that patents have become a more important basis for raising venture capital for biomedical research applications, especially those arising from university activity (Henderson et al., 1999).
Increasing Costs
The direct costs of the patent system are significant, increasing, and in some cases may adversely affect innovation.
The direct costs associated with the acquisition, exercise, and defense of patents are examined further in Chapter 3. Here we simply enumerate some of them to support our proposition that the patent system’s evolution merits close attention. First, from the point of view of the inventor or firm applying for a patent, it is estimated that the average corporate U.S. patent prosecution now costs the applicant $10,000-$30,000 in fees. Legal counsel represents the vast majority of that amount, as fees paid to the USPTO are low and have been fairly stable since 1990. The costs at least to large entities of most elements of U.S. patent prosecution have been increasing at an annual rate of 10-17 percent, according to a survey of corporate and private practitioners conducted biannually by the American Intellectual Property Law Association (AIPLA). These figures should be interpreted cautiously, as they represent only two sets of observations over a few years and derive from a nonrandom survey of attorneys.
Corporate managers and attorneys agree that the costs of conflicts over patents have also increased rapidly. The median cost to each party of proceeding through a patent infringement suit to a verdict at trial is at least $500,000 where the stakes are relatively modest. Where more than $25 million is at risk in a patent suit, the median litigation cost is $4 million for each party, according to the AIPLA survey results. Moreover, litigation occupies significant time and attention of business managers and technical personnel, not merely in-house and external counsel, in deciding corporate strategy, participating in depositions, and testifying in court. This process is particularly burdensome for small firms and start-ups with fewer managerial personnel and less access to capital finance (Lerner, 1995). Thus, the direct and opportunity costs of litigation may affect the rate of innovation in ways that are hard to measure or even detect.
A neglected and largely undocumented cost of the patent system is associated with working out licensing arrangements or negotiating royalties or simply fending off threats of infringement. This was highlighted in the Hall and Ziedonis interviews of semiconductor company executives as a significant cost of the current patent-intensive cross-licensing system in that industry despite its relative effectiveness in avoiding the far higher costs of litigation (Hall and Ziedonis, 2001).


