
7
High-Tech Support Systems for Spatial Thinking
7.1 INTRODUCTION
Spatial thinking underpins problem solving in everyday life, the workplace, and science. While much spatial thinking occurs unaided, there are numerous support systems for spatial thinking. In everyday life, for example, we can use MapQuest to find routes for driving; in the workplace, architects use CAD systems for designing structures; and in science, statisticians use the visualization powers of Data Explorer to understand complex relationships among variables.
Support systems range from low to high tech in character. Although we appreciate the value and indispensability of low-tech support systems for spatial thinking, we also recognize the significance of a rapidly developing suite of powerful high-tech tools for supporting spatial thinking. Given the links among changing twenty-first century workforce demands, the burgeoning IT industry, and the increasing use of IT in schools, the committee was charged to examine the incorporation of GIS as a support system for spatial thinking across the K–12 curriculum.
With respect to GIS, the committee was asked to examine two questions:
-
How might current versions of GIS be incorporated into existing standards-based instruction in all knowledge domains across the school curriculum?
-
How can cognitive developmental and educational theory be used to develop new versions of GIS that are age appropriate in their design and to implement new GIS curricula that are age appropriate in their scope and sequence?
The committee answers these questions in Chapters 8 and 9 by using the frameworks laid out in Chapter 6 for assessing support systems in the K–12 educational context: (1) the three requirements of a support system for spatial thinking; (2) the 10 criteria for the design of a support system for spatial thinking; and (3) the five components for the implementation of a support system for spatial thinking.
This chapter, however, sets GIS into the context of a range of systems for supporting spatial thinking. The chapter is divided into three sections: Section 7.2 sets GIS in the context of a suite of
|
BOX 7.1 Geospatial Data Systems GIS and remote-sensing analysis systems (e.g., ArcView, MapInfo, Idrisi, Erdas, Imagine) provide advanced data management and analysis capabilities along with the means to generate maps, graphs, surfaces, and tables. They support a wide variety of spatial data types, have elaborate tools for geo-registering and integrating data, and typically provide high-quality cartographic tools. Their major drawbacks are poor support for the vertical dimension, poor support for the time dimension, complexity of the application program interfaces (APIs), and limited support for spatializing nonspatial information. Geoscience analytical systems (e.g., Surpac, Vulcan, Micromine, Fractal Technologies), which are commonly used to manage geological exploration and mining activities, provide support for spatial thinking. Some of these products represent data in three dimensions, as opposed to two. Some of them explicitly model the change in a region through time (e.g., due to erosion, mining activities, etc.). Typically, these systems have strong analysis and geostatistical capabilities, but they are more limited cartographically than GIS. Computer-assisted design systems (e.g., AutoCAD, MicroStation), which have an engineering and architectural heritage, provide strong graphics capabilities. They offer good support for vector-based data, complete support for the third dimension, and a high level of interoperation (data exchange) between systems. They offer no support for raster data or for geographic projections. They have limited spatial analysis and statistical capabilities. Mathematical and Statistical Analysis Systems Mathematical and statistical analysis systems (e.g., Mathematica, Maple) were developed to provide integrated environments for the analysis and transformation of scientific data. Consequently, they offer a strong selection of mathematical and statistical tools. Recently, they have been augmented with graphing tools that allow for the spatialization and visualization of data. Typically, they are limited in their ability to handle explicitly geographic data and to support high-quality cartographic output. |
high-tech tools for supporting spatial thinking. The committee identifies the types of tools, their functions, and their strengths and weaknesses as supports for spatial thinking and shows how these systems are converging toward common goals, driven primarily by user expectations. Section 7.3 provides an introduction to the nature and functions of GIS. Section 7.4 assesses the current status of GIS, especially with respect to K–12 education.
7.2 HIGH-TECH SYSTEMS FOR SUPPORTING SPATIAL THINKING
A number of software tools have been developed to represent and manipulate objects in geographical space or in some other information space via spatialization. In the geospatial context, there are eight sets of tools: GIS and remote-sensing analysis systems; geoscience analytical systems; CAD systems; mathematical and statistical analysis systems; production graphics environments; animation environments; information visualization systems; and concept mapping tools (see Appendix E for web addresses that provide details of these tools). (There are also high-tech systems for spatial thinking in fields as diverse as protein analysis, medical imaging, and mapping star systems.) Each one of the eight high-tech tools offers different capabilities. For example, GIS and related satellite-based systems, such as GPS, have revolutionized geospatial data collection, analysis, and display.
Box 7.1 provides a description and assessment of these high-tech tools, which are divided into
|
Graphics Generators Production graphics environments (e.g., Photoshop, Freehand) offer the most comprehensive set of tools to make attractive graphics, but are limited to two dimensions. More important, their content is not directly addressable (i.e., the image produced does not consist of individual features that can be selected and manipulated at will). Animation environments (e.g., Director, Flash) are becoming popular as a means to bring interactive, animated graphics into a web environment (usually via the web plug-in). Analytically, they are limited and they are time-consuming to use. Nonetheless, they can produce effective, specialized teaching and learning aids that deal directly with time, thus allowing descriptions of processes to be animated, and they allow unimportant interface details to be hidden from the end user. Examples of Flash applications for K–12 education are available on the web from http://www.geovista.psu.edu/grants/MapStatsKids/pubs.html. Visual Exploration Systems Information visualization systems (e.g., Data Explorer [DX], Advanced Visualization System [AVS]) can sustain the greatest variety of data types. They provide support for the third dimension and often for time as well. They permit a high degree of flexibility in the way that data are displayed. However, they offer limited analysis capability. In information visualization systems, spatial variables have no special status and no predefined assignment because any data value can be assigned to any visual variable. Thus, whereas in a GIS only data that are specifically spatial can be used as the location of an object, information visualization systems enable users to assign any data to be represented by, say, location or height. Concept mapping tools (e.g., TouchGraph, ThemeRiver) spatialize data that are not inherently spatial, relying typically on an algorithm to order the position and displacements between components of the display (Figures 2.4 and 2.5). Like information visualization methods, concept graphing tools are usually geared toward visual exploration rather than analysis. They do not address any of the explicitly geographical aspects of spatial information. |
four groups. Table 7.1 compares these eight high-tech tools in relation to their ability to spatialize, visualize, and perform functions (see Chapter 6.7).
Currently, none of the high-tech tools listed in Box 7.1 and Table 7.1 meet all of the necessary requirements to support spatial thinking. Instead, each system meets some of the requirements. For example, information visualization systems offer great flexibility in the way data are displayed, but provide limited analytical capability. Concept graphing tools support the spatialization and visual exploration of data, but do not reference objects in geographic space. Although animation environments deal well with time, they are cartographically and analytically weak. GIS support a wide variety of data types, integrate and geo-register data, provide high-quality cartographic output, and support spatial analysis. However, they offer poor support for time, the vertical dimension, and multimedia. At best, GIS provide limited support for spatializing nonspatial data. However, when set in the context of alternative hi-tech systems, GIS fares as well as, if not better than, other high-tech systems (see Table 7.1) as a tool for the support of spatial thinking.
All of the high-tech systems in Table 7.1 are becoming more powerful by (1) adding analytical capabilities; (2) providing flexible and visually appealing graphic and cartographic presentations; (3) supporting multimedia and multiformat data; (4) supporting tools such as APIs that can generate specialized but easy-to-use applications; (5) providing easier-to-use functionality, supported by context-sensitive help and software wizards; and (6) offering better integration with other information system products via emerging middleware standards, possibly leading to the embedding of
TABLE 7.1 Comparison of the Current Capabilities of High-Tech Systems That Can Support Spatial Thinking
|
|
Geospatial Data Systems |
||
|
GIS and remote-sensing analysis systems |
Geoscience analytical systems |
Computer-assisted design systems |
|
|
Spatialization |
|||
|
Projection and registration in geographic space |
√ |
√ |
O |
|
Integrates heterogeneous data by registering or transforming them to a common spatial position and projection |
√ |
√ |
√ |
|
Allows spatialization of nonspatial data |
O |
O |
X |
|
Visualization |
|||
|
Provides tools for high cartographic quality production |
√ |
O |
O |
|
Supports explicit modeling of time, animation |
X |
O |
X |
|
Support for full multimedia (e.g., sound, video) |
X |
X |
X |
|
Performing Functions |
|||
|
Supports transformations |
O |
O |
O |
|
Supports operations |
√ |
√ |
X |
|
Supports spatial analysis |
√ |
√ |
X |
|
KEY: √ yes, in most cases; O yes, for some systems or to some extent; X no, in most cases. |
|||
explicitly geographic data handling and processing capacities in many of the systems. Although software vendors seem to have no coordinated plan, systems are converging toward common goals because of the needs of business, industry, and government. Users want flexible systems to handle data sets that come from multiple sources, at different scales, and with different accuracies.
As these systems become functionally more powerful and converge toward common goals, their capabilities will offer greater support for spatial thinking. Because of the diverse forms spatial thinking can take and the diverse contexts in which spatial thinking can occur, it is unlikely that a single system will be able to accommodate spatial thinking in all of its forms and contexts.
Even though spatial thinking may be too complex, challenging, and powerful for a single system to offer universal support, most current GIS software systems provide more support for spatial thinking than K–12 students will probably ever need. Indeed, estimates suggest that the range of functions available in GIS products is so extensive that even most professional GIS users access only 10 percent of their software’s functionality (Tomlinson, 2003).
7.3 THE NATURE AND FUNCTIONS OF GIS
In the 1970s and 1980s, GIS were viewed as computer-based toolboxes—as mapping tools (Burrough, 1986), spatial databases (Arnoff, 1989), decision support tools (Carter, 1989; Cowen, 1988), or spatial analytical tools (Parker, 1988). However, rapid developments of GIS technology have rendered the traditional, instrumental definitions of GIS inadequate to capture the essence of the technology and its social implications. GIS technology is becoming increasingly part of our daily lives (e.g., providing navigation aids for driving, walking, or public transport; generating location-specific delivery services such as local weather, traffic conditions, cultural events) (Cowen,
|
Mathematical and Statistical Analysis Systems |
Graphics Generators |
Visual Exploration Systems |
||
|
Mathematical and statistical analysis systems |
Production graphics environments |
Animation environments |
Information visualization systems |
Concept mapping tools |
|
O |
X |
X |
O |
X |
|
√ |
√ |
√ |
√ |
X |
|
X |
X |
X |
√ |
√ |
|
X |
√ |
O |
√ |
O |
|
X |
X |
√ |
O |
O |
|
X |
X |
√ |
O |
X |
|
X |
X |
X |
O |
X |
|
X |
X |
X |
X |
X |
|
√ |
X |
X |
O |
X |
1994), thus suggesting that GIS should be seen as media or a medium for the communication of geographic information in digital form (Sui and Goodchild, 2001). While GIS is a practical tool, GIScience, (Appendix F), addresses some fundamental questions about the relationships among data, space, and the digital world.
Whether viewed as a tool or as media, GIS can be defined as integrated software systems for the handling of geospatial information: for its acquisition, editing, storage, transformation, analysis, visualization, and indeed, virtually any task that one might want to perform with this particular information type (Figure 7.1). In the case of GIS, the information is georeferenced to locations on Earth’s curved surface. As such, GIS stand in much the same relationship to geographic information as spreadsheet packages do to tabular information, word processors to text, or statistical packages to statistical data. All of these systems rely on a basic economy of scale: once the foundation has been established for storing a particular data type, it is possible to add a vast array of functions and to serve a similarly vast array of applications with a single software package. The potential of GIS for geographic data storage, analysis, and display is described in introductory texts (Burrough and MacDonnell, 1998; Clarke, 2002, Heywood et al., 2002; Longley et al., 2001), and in more comprehensive surveys of the field (Bossler, 2001; DeMers, 2000; Longley et al., 1999).
The geospatial data that are the focus of GIS can be defined as information about places on, just above, or just below Earth’s surface. Geographic data link three elements: place, time, and attributes. For example, consider the statement that the temperature at noon on August 22, 2003, at latitude 44 degrees 58 minutes north, longitude 93 degrees 15 minutes west, was 30°C. The statement ties place and time to the attribute of atmospheric temperature. Geospatial data are acquired from a wide range of sources, including data obtained from fieldwork, maps, images of Earth obtained from satellites, and videofilm of Earth taken from low-flying aircraft.
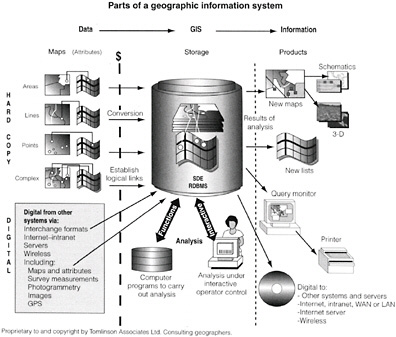
FIGURE 7.1 Components of a GIS. The diagram shows that a GIS stores geospatial data in a GIS storage database where analytical functions are controlled interactively by an operator to generate the needed information. SOURCE: Tomlinson, 2003, p. 3. Reprinted with permission from Dr. Roger Tomlinson.
The range of possible generalizations and structures for storing geospatial data is large, and this powerful flexibility is one explanation for the complexity of GIS and, therefore, the difficulties many people experience in learning how to use these systems. The methods used to structure data are called data models. A data model is a set of constructs for describing and representing selected aspects of the real world in a computer. Data models are vitally important in a GIS because they control the way data are stored and have an impact on the type of analytical operations that can be performed (Burrough and Frank, 1996; Molenaar, 1998; Rigaux et al., 2002; Shekar and Chawla, 2003; Worboys, 1995; Zeiler, 1999).
For two-dimensional geographic data, the most common data models used in a GIS are the raster data model and the vector data model. Figure 7.2 shows an example of raster data displayed in a GIS, and Figure 7.3 shows an example of vector data displayed in a GIS.
Raster models capture geographic variation on the basis of a grid of values assigned to equal-sized rectangular cells, just as a digital camera captures an image. Relative location is defined in terms of the order of the cells, and the grid is positioned with respect to Earth’s surface by assigning coordinates to its corners. Raster models are useful as a backdrop display because they can communicate a lot of information rapidly. They are also widely used for analytical operations such as disease dispersion modeling, surface water flow analysis, and store location modeling.
Vector data represent phenomena as discrete points, lines, and areas and capture location by assigning coordinates to these individual geometric objects. For example, a road might be represented as a sequence of points forming a line in a vector database, whereas in a raster database, the road would be a string of connected cells. Vector models have been widely implemented in GIS
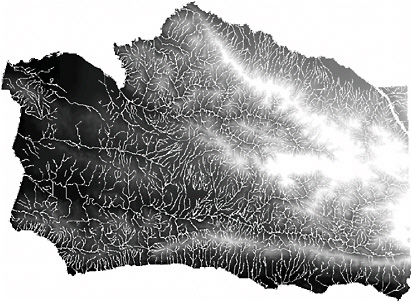
FIGURE 7.2 A raster-based map of Santa Barbara County. Relief ranges from black (low) to white (high), and streams are recorded as a raster of cells in which each cell is associated with one gray level.
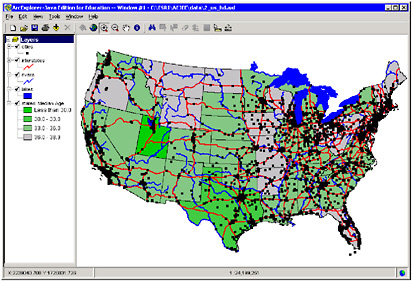
FIGURE 7.3 Map of the United States recorded on a vector GIS of polygons, lines, and points. It was created using ArcExplorer Java Edition for Education. It depicts lakes (in blue), states (in shades of green to gray showing median age), lines (rivers in blue and interstate highways in red), and points (cities are black squares).
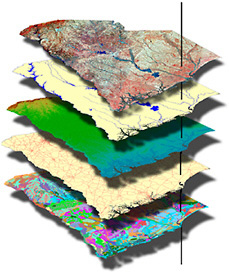
FIGURE 7.4 A geographic information system. A GIS consists of a number of geographic data layers that are linked to one another in a common geographic coordinate system (such as latitude and longitude). In this example, the various thematic layers consist of remotely sensed data (from Landsat Thematic Mapper), the hydrologic network, digital elevation, road network, and watershed boundaries. SOURCE: NRC, 2002b, p. 14.
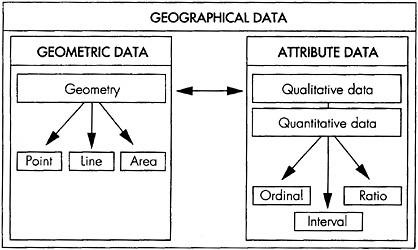
FIGURE 7.5 Geographical data can be divided into geometric data and attribute data. Attribute data can in turn be subdivided into qualitative data and quantitative data. SOURCE: Bernhardsen, 1999, p. 40. From Geographic Information Systems: An Introduction; Copyright 1999 T. Bernhardsen. This material is used by permission of John Wiley & Sons, Inc.
because of their storage efficiency, the quality of their cartographic output, and the availability of functional tools for operations such as overlay, analysis, and modeling.
A GIS stores geographic data as a collection of thematic layers (e.g., overlays of a map showing, for example, human population distribution, hydrology, transportation, soils, geology, land cover) that are linked to a common georeferencing system (Figure 7.4). Each thematic layer
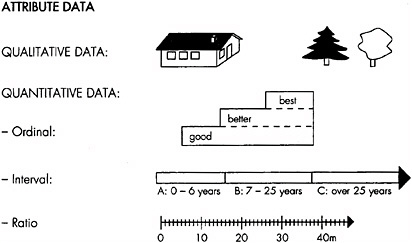
FIGURE 7.6 Attribute data consist of qualitative or quantitative data. Qualitative data specify the type of object, whereas quantitative data can be categorized into ordinal, interval, and ratio data. SOURCE: Berhardsen, 1999, p. 40. From Geographic Information Systems: An Introduction; Copyright 1999 T. Bernhardsen. This material is used by permission of John Wiley & Sons, Inc.
has two information components: one is the location of a place in geometrical terms and the other is a description of the attributes of that place (Figures 7.5 and 7.6). Currently, paper maps and other hard-copy records supply much of the input data for these layers. For use in a GIS, hard-copy records must be digitized. Increasingly, more and more geographic data originate in digital form.
Storing data in multiple thematic layers is a simple but powerful concept that has proven valuable for solving problems. The power of a GIS is that it enables us to ask questions of a database, perform spatial operations on databases, and generate graphic output that would be laborious or impossible to do manually. A GIS can answer five generic questions (Rhind, 1992):
|
Question: |
Type of Task |
|
|
1. |
What is at …? |
Inventory |
|
2. |
Where is …? |
Monitoring |
|
3. |
What has changed since …? |
Inventory and monitoring |
|
4. |
What spatial pattern exists …? |
Spatial analysis |
|
5. |
What if …? |
Modeling |
The first three questions are simple queries. Question 1 seeks to find out what exists at a particular location. Question 2 is the converse of Question 1 and asks where certain conditions are satisfied (e.g., the presence or absence of some phenomenon at particular locations). Question 3 seeks to find differences between the results to Questions 1 and 2 at two moments in time. Questions 4 and 5 are analytical. In asking Question 4, we may wish to know the spatial pattern of deaths due to cancer among residents around a nuclear power station and, if there are anomalies to the pattern, where the anomalies occur. Question 5 seeks to determine what happens, for example, if we build a model of cancer deaths in relation to distance from the power station and test the model’s predictions against patterns of deaths at other power stations.
As a software system for data analysis and automated cartography, GIS is used in a vast range of applications, covering virtually any industry or agency concerned with the surface of Earth and with the human activities and physical processes that occur on or near Earth’s surface. These include scientific research in the physical and social sciences and in the humanities; management of land and natural resources; modeling of environmental and ecological processes; routing and scheduling of vehicles; and management of urban, utility, and transportation assets. The introductory textbooks cited earlier provide abundant examples of GIS applications, and there are specialized books on the role of GIS in most major application areas.
7.4 THE CURRENT STATUS OF GIS
Currently, GIS is the accumulative result of continual additions and occasional restructurings, over a 30-year period, to a complex architecture. It is expert driven and, therefore, oriented to the needs of professional practitioners (Foresman, 1998). Designed for solving practical problems, GIS is used primarily by high-tech practitioners in industry, business, government, and research. For these practitioners, GIS provides an excellent vehicle for integrating and analyzing large amounts of geographic data rapidly, accurately, and reliably. It also provides a basis for decision support systems to facilitate management and planning decisions in both the public and the private sectors. A GIS supports decision-making by providing ways to examine and choose among alternative solutions to problems.
GIS was not designed with either children or learning in mind. Since it was introduced to schools in the 1980s, there has been very little adaptation of GIS for K–12 education. Moreover, the rate of adoption of GIS by schools has lagged far behind the rates for business and government. By 2003, GIS was used in only 1 percent of American high schools (Kerski, 2003, p. 128). This minimal level of adoption may be attributed in part to the name GIS. Because geography is such a small component of the K–12 curriculum, GIS may be marginalized. To be sure, the low level of
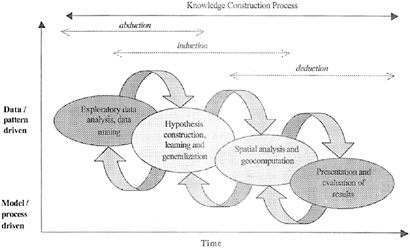
FIGURE 7.7 Phases in the scientific method. SOURCE: Gahegan et al., 2001, p. 2. First published in Cartography and Geographic Information Science 28(1):29–44. Reprinted by permission from the American Congress on Surveying and Mapping.
adoption can also be attributed to a number of structural limitations—access to hardware and software, intimidating software, insufficient time to learn how to use the software, and levels of technology training for teachers.
GIS has the capability to create an environment in which students learn science by doing (NRC, 1999). It can, therefore, extend the ability of students to do scientific inquiry as envisaged by the Curriculum and Evaluation Standards for School Mathematics (National Council of Teachers of Mathematics, 1989), National Science Education Standards (NRC, 1996), and Geography for Life: The National Geography Standards 1994 (Geography Education Standards Project, 1994). These standards emphasize approaching scientific tasks using the scientific method (Figure 7.7).
GIS can expand the data available for student use, the scope and sophistication of their analyses, and the range of graphic representations, allowing students to uncover and understand real-world patterns and processes. To what extent can the potential of GIS be realized?


