
2
Committee Procedures and Characteristics of Studies Reviewed
As explained in Chapter 1, our charge as committee members was to evaluate the quality of the evaluations of the 13 National Science Foundation-(NSF-) supported and 6 commercially generated mathematics curriculum materials.
We were not charged with and therefore did not:
-
Evaluate the curriculum materials directly
-
Rate or rank specific curricular programs
We recognize that both tasks could interest a broad constituency, but we believed that the field would profit from a careful, thorough review and summary of previous evaluations and research studies in relation to how previous work might inform and strengthen future efforts. We were aware that the mathematics education field lacks a clear consensus on what constitutes an effective curriculum and how to measure it to provide adequate, valid, and timely information to decision making bodies. It is appropriate to have a range of curricula from which to choose that represent a variety of preferences and values; when this is the case, decision making on curricular materials inevitably combines values and evidence-based reasoning. We did not intend to recommend the elimination of values in curricular decision making, but instead wished to contribute to efforts to increase the quality of evidence provided to the process.
Some readers may be disappointed by our not offering a “stamp of
approval” on specific curricula or providing a report card, as others have done for state standards or tests (U.S. Department of Education, 1999; Achieve Inc., 2002). This decision was deliberate. As a committee of the National Research Council of The National Academies, our primary contribution was to clarify the phrases scientifically valid evaluation study and scientifically established as effective in the context of K-12 mathematics curricula. Such an analysis can elucidate the current knowledge of how these curricula were evaluated and help decision makers avoid judgment errors that are likely when the completeness or scientific rigor of evaluations of such materials is misunderstood.
Recognizing the complexity of judging curricular effectiveness, this report is designed to assist future evaluators and policy makers in designing and conducting evaluations that provide accurate, comprehensive, and valid advice to decision makers and practitioners on the efficacy of curriculum materials. Our primary goal was to advise our audiences on what could be learned from these initial efforts and how lessons learned, strategic decisions, adaptations in method, errors and weaknesses, and tentative patterns of results could further future evaluation efforts and decision making on curricular policy.
CURRICULA UNDER REVIEW
The following 13 mathematics curricula programs1 (The K-12 Mathematics Curriculum Center, 2002) were supported by the NSF, and the evaluations of these materials were reviewed by our committee:
Elementary School:
-
Everyday Mathematics (EM), Grades K-6 (SRA/McGraw-Hill)
-
Investigations in Number, Data and Space, Grades K-6 (Scott Foresman)
-
Math Trailblazers, Grades K-6 (Kendall/Hunt Publishing Company) Middle School:
-
Connected Mathematics Project (CMP), Grades 6-8 (Prentice Hall)
-
Mathematics in Context (MiC), Grades 5-8 (Holt, Rinehart and Winston)
-
MathScape: Seeing and Thinking Mathematically, Grades 6-8 (Glencoe/McGraw-Hill)
-
MathThematics (STEM), Grades 6-8 (McDougal Littell)
-
Middle School Mathematics Through Applications Project (MMAP) Pathways to Algebra and Geometry, Grades 6-8 (currently unpublished)
High School:
-
Contemporary Mathematics in Context (Core-Plus), Grades 9-12 (Glencoe/McGraw-Hill)
-
Interactive Mathematics Program (IMP), Grades 9-12 (Key Curriculum Press)
-
MATH Connections: A Secondary Mathematics Core Curriculum, Grades 9-12 (IT’S ABOUT TIME, Inc.)
-
Mathematics: Modeling Our World (MMOW/ARISE), Grades 9-12 (W.H. Freeman and Company)
-
Systemic Initiative for Montana Mathematics and Science (SIMMS) Integrated Mathematics, Grades 9-12 (Kendall/Hunt Publishing Company)
Given our expanded charge, we also included a few of the commercially published, non–NSF-funded curricula. We planned to select the curricula by market share; however, such data are highly proprietary and contested. An additional complicating factor was that most reports of market share are identified by publisher name rather than a particular product line. Publishers produce numerous overlapping and sometimes competing mathematics curriculum products, especially given recent acquisitions and mergers. Thus determining market share by program was problematic.
We located two sources of market share data independent of the publishers (Education Market Research, 2001; Weiss et al., 2001). In addition, we received testimonial data from other suppliers of widely used curricular materials in mathematics, including Key Curriculum Press, Saxon Publishers,2 and Texas Instruments. Among the six curricula, we sought representation from each of the four major textbook publishers:
-
McGraw-Hill (including Direct Instruction, Frank Schaffler Publishing, Macmillan, Glencoe, SRA/Open Court, Everyday Mathematics, and the Wright Group)
-
Reed Elsevier (including Harcourt, LexisNexis, Reinhard and Winston, Rigby, Steck-Vaughn, Reading Recovery, Heinemann, and Riverdeep)
-
Vivendi (including Houghton Mifflin, McDougal Littell, Riverside Assessments, Sunburst Technology, and Great Source)3
-
Pearson (including Addison Wesley Longman, Scott Foresman, Silver Burdett Ginn, Simon and Schuster, Globe Fearon, Modern Curriculum Press, Celebration Press, Dale Seymour Publications, Prentice Hall School, Waterford Early Reading, Waterford Early Math and Science, Sing, Spell, Read and Write)
We selected two publishers per grade band level (elementary, middle, and high school). Because our independent sources only identified publishers with the largest market share and not specific mathematics curriculum materials, we asked the publishers to select their curricula with the highest market share. The publishers then submitted the curricular materials and accompanying evaluation studies that they had conducted or were aware of for our review.
We analyzed evaluations of the following six commercially generated programs:
Elementary School:
-
Math K-5, 2002 (Addison Wesley/Scott Foresman)
-
Harcourt Math K-6 (Harcourt Brace)
Middle School:
-
Applications and Connections, Grades 6-8, 2001 (Glencoe/McGraw-Hill)
-
An Incremental Development, Sixth Grade, Eighth Grade (2nd edition) and An Incremental Development, Seventh Grade, Algebra 1/2 and Algebra (3rd edition) (Saxon)
High School:
-
Larson Series, Grades 9-12, 2002 (Houghton-Mifflin/McDougal Littell)
-
University of Chicago School Mathematics Project Integrated Mathematics, Grades 9-12, 2002 (Prentice Hall)
Prentice Hall4 was an exception and could not choose its curricular materials because we specifically asked for the secondary materials of the University of Chicago School Mathematics Project (UCSMP) to be part of our review. UCSMP was selected because its history and profile represented a “hybrid” between the two categories (NSF-supported and commercially generated curricular programs), and all of its development and research support for the first edition was provided by foundations.5 We chose UCSMP because, similar to the NSF curricula, its philosophy and program theory are aligned with the National Council of Teachers of Mathematics (NCTM) Standards (NCTM, 1989), although it preceded the NSF-supported curricula in its development period (Thompson et al., 2003). It also differs from the high school NSF-supported materials in that it preserves the traditional course sequence of algebra, geometry, algebra and trigonometry, and advanced mathematics, including newer topics such as statistics and discrete mathematics, whereas the other NSF-supported materials integrate across mathematical subfields at each grade level. UCSMP’s development was situated at a university, unlike any other commercially generated curricula. As a result, many published studies and doctoral dissertations were conducted on it.
DATA GATHERING
Information on evaluation studies of the 19 mathematics curricula projects was gathered in several ways. First, we found contacts for all
curricula under review and requested copies of curricular materials and evaluation studies. We received the requested curriculum materials from all publishers except Harcourt Brace. Seventeen of the 19 curricula submitted public evaluation materials to our committee (except Math K-5, 2002 [Addison Wesley/Scott Foresman] and Harcourt Math K-6 [Harcourt Brace]). We requested that principal investigators from the NSF-supported mathematics curriculum projects send reports they had submitted to the NSF, as well as their own evaluation studies of their materials or others of which they were aware. We also gathered evaluation studies from all four mathematics NSF Implementation Centers (http://www.ehr.nsf.gov/esie/resources/impsites.asp). We then checked citations and bibliography entries from these studies for possible additional evaluations and acquired copies of new studies. Finally, we conducted library and web searches, and emailed several mathematics and mathematics education listservs requesting evaluation studies. We then obtained copies of pertinent studies. A total of 698 evaluation studies were found or submitted for consideration.
We held two evidence-gathering workshops in 2002. The two workshop panels addressed the following questions:
How would you define or evaluate effectiveness of a K-5, 6-8, or 9-12 NSF-supported or commercially generated mathematics curriculum?
What evidence would be needed? Be specific in terms of (1) primary and secondary variables, (2) methods of examining or measuring those variables, (3) research designs, and (4) other relationships under investigation.
The first workshop consisted of panels addressing specific topics:
-
Evaluation and cross-disciplinary frameworks on curriculum implementation in complex settings;
-
Developer, researcher, and evaluator perspectives of curriculum effectiveness;
-
The role of content analysis and research on learning in evaluating curricula effectiveness;
-
Consideration of professional development needs in curricular implementation; and
-
Curriculum decision making and evaluation in school settings.
The second workshop on commercially generated materials asked the same general questions, with two additional requests for comments:
-
How do you evaluate materials in relation to the quality and effectiveness of the materials themselves, including content analysis, theories of
-
learning, and teaching? Discuss the role of authors and developers in the process of evaluation.
-
How does your company consider the issues of implementation in relation to effectiveness, such as professional development, high-stakes tests, standards, technology, equity, and the adoption of materials and marketing issues?
Much of the debate around curriculum quality in the mathematics and mathematics education community resulted in part because content analysis is an ill-defined concept; therefore, we solicited statements on this topic. Sixteen prominent mathematicians and mathematics educators from a variety of perspectives on content analysis were identified. We sent a written request and received statements from eight: Richard Askey, University of Wisconsin, Madison; Eric Gutstein, University of Illinois, Chicago; Roger Howe, Yale University; William McCallum, University of Arizona; R. James Milgram, Stanford University; Luis Ortiz-Franco, Chapman University; Deborah Schifter, Education Development Center; and Hung Hsi Wu, University of California, Berkeley. We asked for their advice on content analysis by addressing the following questions:
-
What should be included in a content analysis?
-
How would you judge the quality of a content analysis?
-
What is the definition of content analysis?
-
Does your response represent the intended and enacted curriculum?
-
What references are available in the field on this topic?
THE STUDY MATRIX
We included evaluation studies that focused on one or more of the 13 NSF-supported or 6 commercially generated mathematics curricula, and whose authorship and affiliation were identified. Evaluation studies also had to fall into one of the following categories: (1) Comparative Analysis, (2) Case Study, (3) Content Analysis, (4) Synthesis Study, (5) Background Information, Historical Documentation, or Report to the NSF; and (6) Informative Study (Chapters 4 through 6 provide category descriptions.) We did not wish to limit its initial review to published studies because the topic is relatively current and some papers may not yet have been published. Dissertations would have been excluded if only published studies had been chosen, and we believed these studies could contain useful information. Finally, we sought studies from the following classifications pertaining to curriculum implementation:
-
Studies with specific student outcomes
-
Content analysis studies
-
Studies of classroom implementation and school environment
-
Studies of teacher knowledge, teacher characteristics, and professional development
We decided to add to these classifications as we identified additional relevant categories. None were found. The decision tree (Figure 2-1) illustrates the process for categorizing the evaluation studies.
We considered all 698 studies that were found or submitted. If the study met the criteria listed, it was added to the bibliography for review. If it did not meet these criteria, it was placed on a list along with the documented reasons for exclusion. A study whose inclusion was difficult to determine was submitted for committee review. The bibliography of studies that are included in our analysis appears in Appendix B. The 417 studies that met the inclusion criteria for categories 1 through 6 were entered into our database for review.
STUDY CHARACTERISTICS
Table 2-1 shows the distribution of studies by methodology and identifies them as NSF-supported, commercially generated, or UCSMP.
We identified studies that fit the categories of content analysis (n=36), comparative analysis (n=95), case studies (n=45), and synthesis (n=16) as particularly salient. These 192 studies formed the core of the review because they provided direct information pertinent to reviewing the evaluation on materials’ effectiveness. Therefore, a large percentage of studies initially considered did not meet the criteria and were excluded from further review. The categories of background information, historical documentation, reports to the NSF, or informative studies were eliminated from further review, though they remain a valuable source of information about program theory and decision making that affected evaluation study designs.
The number of studies in the commercial category was far smaller than the number of studies on the NSF-supported materials or UCSMP.6 Two factors seem to account for this disparity. First, many NSF- or foundation-supported curricula were required to provide evaluations. The NSF also funded some of these curriculum projects to conduct further evaluation studies. Second, the NSF and UCSMP materials were written primarily by
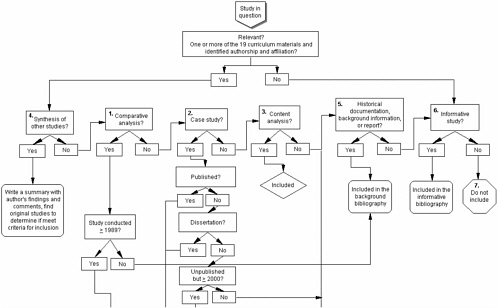
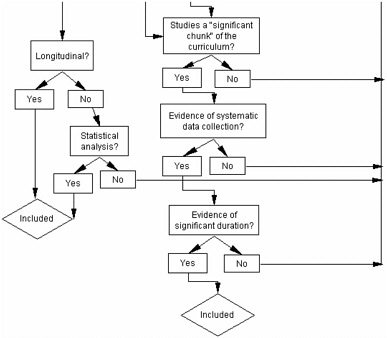
TABLE 2-1 Distribution of Types of Studies
|
Type of Study |
Number of Studies |
Percentage of Total |
|
1. Comparative analysis |
95 |
13.6 |
|
NSF-supported curricula |
66 |
69.5 |
|
Commercially generated curricula |
16 |
16.8 |
|
UCSMP |
11 |
11.6 |
|
Not counted in above |
2 |
2.1 |
|
2. Case |
45 |
6.4 |
|
NSF-supported curricula |
45 |
100.0 |
|
Commercially generated curricula |
0 |
0.0 |
|
UCSMP |
0 |
0.0 |
|
Not counted in above |
0 |
0.0 |
|
3. Content analysis |
36 |
5.2 |
|
NSF-supported curricula |
17 |
47.2 |
|
Commercially generated curricula |
1 |
2.8 |
|
UCSMP |
12 |
33.3 |
|
Not counted in above |
6 |
16.7 |
|
4. Synthesis |
16 |
2.3 |
|
NSF-supported curricula |
15 |
93.8 |
|
Commercially generated curricula |
0 |
0.0 |
|
UCSMP |
1 |
6.3 |
|
Not counted in above |
0 |
0.0 |
|
5. and 6. Background information and Informative studies |
225 |
32.2 |
|
7. Do not include |
281 |
40.3 |
|
TOTAL |
698 |
100.0 |
university faculty whose graduate students often conducted the studies as part of research toward their degrees. Finally, unlike the NSF-supported materials, commercial publishers often conducted market studies, which emphasize how potential purchasers will view the materials. Thus, many commercially generated studies were only marginally useful in evaluating curricular effectiveness.
The evaluation studies were distributed unevenly across the curricula (Table 2-2). Three of the five curricula with the most evaluation studies under review received additional NSF funding to conduct revisions.7 The elementary, Everyday Mathematics, and secondary components of the UCSMP materials followed.
A database was developed to summarize the studies. Each study was
TABLE 2-2 Distribution of Curricula by Study Type
|
|
Type of Study* |
Number of Appearances in Any Study |
||||
|
Curriculum Name |
1. |
2. |
3. |
4. |
5. and 6. |
|
|
NSF-supported curricula |
||||||
|
Elementary |
||||||
|
Everyday Mathematics |
17 |
9 |
7 |
2 |
16 |
51 |
|
Investigations in Number, Data and Space |
5 |
1 |
2 |
2 |
9 |
19 |
|
Math Trailblazers |
1 |
1 |
1 |
2 |
6 |
11 |
|
Middle school |
||||||
|
Connected Mathematics Project (CMP) |
10 |
18 |
8 |
2 |
42 |
80 |
|
Mathematics in Context (MiC) |
1 |
8 |
7 |
5 |
52 |
73 |
|
Math Thematics (STEM) |
2 |
6 |
4 |
2 |
13 |
27 |
|
MathScape |
0 |
2 |
1 |
1 |
5 |
9 |
|
Middle School |
||||||
|
Mathematics Through Applications Project (MMAP) |
0 |
0 |
0 |
1 |
7 |
8 |
|
High school |
||||||
|
Contemporary Mathematics in Context (Core-Plus) |
13 |
5 |
3 |
3 |
19 |
43 |
|
Interactive Mathematics Program (IMP) |
17 |
2 |
4 |
2 |
12 |
37 |
|
Systemic Initiative for Montana Mathematics and Science (SIMMS) |
5 |
1 |
2 |
2 |
10 |
20 |
|
Math Connections |
2 |
0 |
2 |
2 |
6 |
12 |
|
Mathematics: Modeling Our World (MMOW/ARISE) |
0 |
0 |
2 |
1 |
5 |
8 |
|
Commercially generated curricula |
||||||
|
Elementary |
||||||
|
Addison Wesley/Scott Foresman |
0 |
0 |
2 |
0 |
1 |
3 |
|
Harcourt Brace |
0 |
0 |
1 |
0 |
0 |
1 |
|
Middle school |
||||||
|
Saxon |
13 |
0 |
6 |
0 |
21 |
40 |
|
Glencoe/McGraw-Hill |
1 |
0 |
2 |
0 |
4 |
7 |
|
High school |
||||||
|
Prentice Hall/UCSMP |
13 |
0 |
14 |
3 |
46 |
76 |
|
Houghton-Mifflin/ McDougal Littell |
2 |
0 |
0 |
0 |
1 |
3 |
|
Number of evaluation studies |
95 |
45 |
36 |
16 |
225 |
417 |
|
Number of times each curriculum is in each type of study |
102 |
53 |
68 |
29 |
275 |
528 |
|
*Study types: (1.) Comparative Analysis, (2.) Case Study, (3.) Content Analysis, (4.) Synthesis, (5. and 6., respectively) Background Information and Informative Study. |
||||||
read and analyzed by two or more committee members, the Mathematical Sciences Education Board staff, or graduate students trained to search for and record the study characteristics listed in Box 2-1.
After initial review, we studied in depth the first four categories in Table 2-2 because these studies provided detailed evaluation data.
STUDY CHARACTERISTICS FOR CATEGORIES 1 THROUGH 4
Table 2-3 shows distribution of the published studies by type of study. Of the studies reviewed, only 22 percent were published in journals or books. Approximately 28 percent of comparative studies and 31 percent of case studies were unpublished doctoral dissertations. Although dissertations are unpublished, these studies have been vigorously screened and provided valuable insight into current evaluation data on the curricula under review.
TABLE 2-3 Distribution of Published Studies by Type of Study
|
Type of Study |
Number of Studies |
Published Study |
Unpublished Study |
Unpublished Thesis or Dissertation |
|
1. Comparative analysis |
95 |
15 |
53 |
27 |
|
NSF-supported curricula |
66 |
12 |
39 |
15 |
|
Commercially generated curricula |
16 |
0 |
7 |
9 |
|
UCSMP |
11 |
3 |
6 |
2 |
|
Not counted in above |
2 |
0 |
1 |
1 |
|
2. Case |
45 |
11 |
20 |
14 |
|
NSF-supported curricula |
45 |
11 |
20 |
14 |
|
Commercially generated curricula |
0 |
0 |
0 |
0 |
|
UCSMP |
0 |
0 |
0 |
0 |
|
Not counted in above |
0 |
0 |
0 |
0 |
|
3. Content analysis |
36 |
3 |
33 |
0 |
|
NSF-supported curricula |
17 |
3 |
14 |
0 |
|
Commercially generated curricula |
1 |
0 |
1 |
0 |
|
UCSMP |
12 |
0 |
12 |
0 |
|
Not counted in above |
6 |
0 |
6 |
0 |
|
4. Synthesis |
16 |
14 |
2 |
0 |
|
NSF-supported curricula |
15 |
13 |
2 |
0 |
|
Commercially generated curricula |
0 |
0 |
0 |
0 |
|
UCSMP |
1 |
1 |
0 |
0 |
|
Not counted in above |
0 |
0 |
0 |
0 |
|
TOTAL |
192 |
43 |
108 |
41 |
|
BOX 2-1 Author(s) Title and date of publication Sample program(s) of interest Comparison curriculum used program Design of experiment Author(s) background regarding study Version of material Published? Where? Unit of analysis Study of duration Research question Outcome measures: Student level Standardized tests Other measures (attitudes, absentee rates, or dropout rates) Outcome measures: Teacher level Content knowledge Attitude Student population: Sample and comparison Total number of students Gender Race/ethnicity Socioeconomic: Free or reduced lunch Other Teacher population: Sample and comparison Total number of teachers Hours of professional development received Use of supplemental materials Mathematics certified Average number of years of teaching experience School population: Sample and comparison Total number of schools Staff turnover rate School location (urban, suburban, rural) Enacted curriculum, measurement, and findings Author(s) findings/claims |
TABLE 2-4 Distribution of Author’s Background by Type of Study
|
|
Author’s Background Regarding Studies |
||||
|
Type of Study |
Number of Studies |
Internal |
External |
Graduate Student |
Unknown |
|
1. Comparative analysis |
95 |
35 |
27 |
29 |
4 |
|
NSF-supported curricula |
66 |
20 |
24 |
19 |
3 |
|
Commercially generated curricula |
16 |
9 |
1 |
6 |
0 |
|
UCSMP |
11 |
5 |
2 |
4 |
0 |
|
Not counted in above |
2 |
1 |
0 |
0 |
1 |
|
2. Case |
45 |
10 |
14 |
14 |
7 |
|
NSF-supported curricula |
45 |
10 |
14 |
14 |
7 |
|
Commercially generated curricula |
0 |
0 |
0 |
0 |
0 |
|
UCSMP |
0 |
0 |
0 |
0 |
0 |
|
Not counted in above |
0 |
0 |
0 |
0 |
0 |
|
3. Content analysis |
36 |
16 |
20 |
0 |
0 |
|
NSF-supported curricula |
17 |
6 |
11 |
0 |
0 |
|
Commercially generated curricula |
1 |
0 |
1 |
0 |
0 |
|
UCSMP |
12 |
10 |
2 |
0 |
0 |
|
Not counted in above |
6 |
0 |
6 |
0 |
0 |
|
4. Synthesis |
16 |
16 |
0 |
0 |
0 |
|
NSF-supported curricula |
15 |
15 |
0 |
0 |
0 |
|
Commercially generated curricula |
0 |
0 |
0 |
0 |
0 |
|
UCSMP |
1 |
1 |
0 |
0 |
0 |
|
Not counted in above |
0 |
0 |
0 |
0 |
0 |
|
TOTAL |
192 |
77 |
61 |
43 |
11 |
Table 2-4 shows the distribution of the author’s background by type of study. Across the four types of evaluation studies reviewed, 40 percent were done by authors internal to the curriculum project studied. If the study had more than one author, the authors were considered internal if one or more were related to the project (e.g., curriculum developer, curriculum project’s evaluator, and curriculum staff). Twenty-two percent of the studies were conducted by graduate students, who may be internal to the project because often they are the curriculum developer’s graduate students who perform the research studies. Because the relationship of the graduate student to the curriculum project is not always known, it can only be definitively stated that all authors were external to the project in 32 percent of the studies. The relationship of the author to the curriculum project is unknown in 6 percent of studies.
TABLE 2-5 Distribution of the Study Size by Type of Studies
|
|
|
Study Size (Students) |
|||
|
Type of Study |
Number of Studies |
0-299 |
300-999 |
>1,000 |
n/a |
|
1. Comparative analysis |
95 |
42 |
28 |
23 |
2 |
|
2. Case |
45 |
16 |
3 |
3 |
23 |
Table 2-5 shows the number of students sampled in each of the comparative and case studies (n=140). Studies with fewer than 300 students made up the largest percentage in both comparative and case studies: 44 and 36 percent, respectively. Only 19 percent of the 140 studies had a student sample greater than 1,000 students.
Table 2-6 shows the distribution of sample school locations by type of
TABLE 2-6 Distribution of Sample School Location by Type of Study
|
|
Percentage of Studies That Reported Location* |
|||||
|
Type of Study |
Number of Studies |
Percent of Studies to Report Data |
Urban |
Suburban |
Rural |
Only the State/Region |
|
1. Comparative analysis |
95 |
88 |
36 |
46 |
31 |
37 |
|
NSF-supported curricula |
66 |
89 |
29 |
38 |
24 |
35 |
|
Commercially generated curricula |
16 |
81 |
31 |
44 |
19 |
38 |
|
UCSMP |
11 |
91 |
40 |
60 |
40 |
20 |
|
Not counted in above |
2 |
100 |
100 |
50 |
50 |
0 |
|
2. Case |
45 |
71 |
27 |
55 |
30 |
30 |
|
NSF-supported curricula |
45 |
71 |
27 |
55 |
30 |
30 |
|
Commercially generated curricula |
0 |
0 |
0 |
0 |
0 |
0 |
|
UCSMP |
0 |
0 |
0 |
0 |
0 |
0 |
|
Not counted in above |
0 |
0 |
0 |
0 |
0 |
0 |
|
TOTAL |
140 |
84 |
33 |
49 |
31 |
35 |
|
*Many studies report more than one of the following three types of locations: urban, suburban, or rural. |
||||||
study. Approximately 88 percent of comparative studies and 71 percent of case studies reported data on school location (urban, suburban, rural, or state/region). Suburban students were the largest percentage in both study types. Rural students were the smallest sample in comparative studies, which implies less information is known about curricular effectiveness in these regions. Most studies did not break down the sample by each of the school location types; thus an exact percentage of school types could not be determined. The data that were reported showed wide variation in demographics, although compared with overall representation in the country, minority populations were undersampled (U.S. Department of Education, 2001).
Content analysis studies are not included in Tables 2-5 and 2-6 because they do not report data on students or sample school locations. Synthesis studies are also excluded because they are summaries of multiple studies and typically did not report data on types of schools or students or include data from only some of the studies considered.
Only 19 percent of comparative and case studies provided detailed information on teachers (e.g., certification, years of teaching, or measures of content knowledge) shown in Table 2-7. Generally, comparison groups were based on matching student and not teacher characteristics. Therefore,
TABLE 2-7 Distribution of Studies That Reported Teacher Data by Type of Study
|
|
Percent of Reporting Studies |
||
|
Type of Study |
Number of Studies |
Reported Number of Teachers |
Reported Teacher Experience* |
|
1. Comparative analysis |
95 |
52 |
14 |
|
NSF-supported curricula |
66 |
56 |
9 |
|
Commercially generated curricula |
16 |
31 |
19 |
|
UCSMP |
11 |
64 |
36 |
|
In 2 categories (not above) |
2 |
0 |
0 |
|
2. Case |
45 |
87 |
29 |
|
NSF-supported curricula |
45 |
87 |
29 |
|
Commercially generated curricula |
0 |
0 |
0 |
|
UCSMP |
0 |
0 |
0 |
|
In 2 categories (not above) |
0 |
0 |
0 |
|
TOTAL |
140 |
63 |
19 |
|
*If a study reported on teacher certification or number of years of teaching, it was counted as “Reported Teacher Experience.” |
|||
some bias may be present in the studies in terms of use of volunteer teachers. A substantial percentage of the studies included some measure of implementation by including teacher logs, classroom observations, interviews, and so forth. However, few included any type of measure of quality of instruction, although case studies were more likely to provide insight into these factors than were comparative studies.


