
1
The Nature of Racial and Ethnic Differences
Poor health comes eventually for most people in late life. But does it start earlier, last longer, and appear more common for some racial and ethnic groups than for others? If so, what are the causes of those differences and what can interventions do to affect them? This report examines these questions.
Racial and ethnic differences in late-life health may impose societal costs, and they rub against the American grain. They suggest possible inequity in life histories and opportunities, perhaps from exposure to unhealthy environments (e.g., Faber and Krieg, 2002), or in access to or the adequacy of medical care (Institute of Medicine, 2002).
Not all health differences necessarily involve inequity, however. Some may be due to life-styles freely chosen, especially in younger years, or to attitudes toward treatment. It is important therefore to understand the roots and mechanisms of health differences and to consider ways to reverse them, or at least to alleviate further damage, with the objective of providing all individuals the opportunity for the fullest possible exercise of their capacities in late life.
In 1994 the Committee on Population of the National Research Council held a workshop on health differences in late life. The papers from that workshop, published in 1997 in a volume entitled Racial and Ethnic Differences in the Health of Older Americans (National Research Council, 1997), summarized existing data on racial and ethnic differences in mortality, morbidity, disability, and dementia and discussed the role of such factors as
socioeconomic status, health behaviors, the social environment, the use of medical care, and genes.
Recognizing the need for continuing research, as well as the increasing diversity of the U.S. population, the National Institute on Aging (which sponsored the 1994 workshop) commissioned a new panel to update the work and develop research recommendations. The panel’s specific mandate was to:
-
organize a 2-day workshop with leading researchers from a variety of disciplines and professional orientations to answer questions about the nature and extent of racial and ethnic differences in health in old age, the social and biological mechanisms involved, what studies would advance understanding of differences, and what opportunities exist for research on special populations or research in special areas such as the biology and genetics of aging; and
-
provide a short report summarizing the main lessons learned and providing recommendations for further work.
The panel’s summary of research findings, disciplinary issues, and possibilities for future research is covered in this volume. The commissioned papers, which were presented at the panel’s workshop in Washington, DC in 2002, appear in a companion volume (National Research Council, 2004; see the table of contents in the Appendix).
In addressing its charge, the panel was forced to confront a large and burgeoning theoretical and empirical literature that involves researchers from virtually all the medical, social, and behavioral sciences. The panel’s initial intention was to produce a short report of the state of knowledge, but it rapidly became apparent that current research provides no simple answers. What is currently known about the origins of racial and ethnic differences in health points in many different directions. This fundamental finding spurred the panel to produce a more comprehensive and complex report than was originally requested, detailing what is currently known about apparent health differences and the role and operation of each of the major risk factors involved. This work was seen as an important prerequisite for identifying the kind of research that might advance this field.
This report and the companion volume of papers update work reported on in the papers from an earlier Committee on Population Workshop (National Research Council, 1997). Many of the issues discussed in this volume are similar to those raised in the earlier one, but seen through different lenses and with different emphases.
In this chapter we consider why we focus on racial and ethnic groups and what groups we distinguish. We then characterize the health differences in late life that have been reported among racial and ethnic groups.
These differences reveal a complicated picture that requires careful scrutiny. Chapters 2 through 11 explore the possible causes of health differences, including the social, environmental, psychological, and biological factors that may be at the root of racial and ethnic advantage or disadvantage in health. Chapter 12 asks whether and how action can deal with health differences and what the effects might be.
We refer throughout this report to differences rather than disparities, because the latter term has recently acquired a connotation of injustice, which is not always appropriate for the differences we consider, notably but not only when a minority population is actually in better health than the majority population. Although our focus is on late life, we offer some information on group differences more broadly, as context and in the absence of data on late life.
RACIAL AND ETHNIC GROUPS
Definitions
Race is a potent social reality and an important and enduring component of personal identity. In censuses and most surveys, a designation of race is selected by individual respondents from officially specified categories. This self-identification does not mean that race is without objective basis, since it is roughly consistent with ancestral origins. Yet because of the complications of migration histories and intermarriage, as well as the vagaries of self-identification and social categorization, racial classifications diverge from strict classification by descent.
Ethnicity is similar in concept to race. But while races have often been distinguished on the basis of physical characteristics, especially skin color, ethnic distinctions generally focus on such cultural characteristics as language, history, religion, and customs (Montague, 1942). However, physical and cultural characteristics are often conflated in the identification of racial and ethnic groups. What begins as an ethnic or cultural distinction often becomes racialized, and racial groups are often identified, in the public mind, with reference to customs and behavior. We generally refer here to racial and ethnic groups, without making any sharp distinction between these terms.
Five races are currently distinguished in official U.S. government statistics (Office of Management and Budget, 1997): white, black or African American, American Indian or Alaska Native, Asian, and Native Hawaiian or other Pacific Islander. An additional distinction is made between Hispanics or Latinos and all others, this being designated as an “ethnic” distinction that crosscuts the racial classification. The 2000 census followed this classification—but also allowed multiple choices—and individuals selected their
own identification as they had since the 1970 census. (Such self-identification has been used in censuses since 1970, though with different categories; before that, interviewers classified respondents.)
Self-identification sometimes gives people options, depending on the context. Racial and ethnic identities vary as a function of social and psychological factors that may alter their salience (Yancey et al., 1976). For instance, with the decline of stigma and greater emphasis on the rights of indigenous peoples, the number of people who say they are American Indians or Alaska Natives has increased over time far faster than would be possible from natural increase (Harris and Sim, 2002). A questionnaire provides sample categories that also can affect individuals’ choices. English was the largest ethnic group in the 1980 U.S. census, but the size of this group declined by 34 percent when it was not listed as an example in 1990 (Waters, 2000:1730).
As self-identification has become the norm, pressure has grown to allow multiple and interracial identification, which was done in the 2000 census. When asked to choose one race, more than 80 percent of multiracial individuals will do so (Sondik et al., 2000), but given the option of multiple identities, some people choose more than one, with more educated people being more likely to do so (Lieberson and Waters, 1993). Again, this depends on context. For instance, adolescents choose multiracial identities on surveys more often at school than at home (Harris and Sim, 2002). In the 2000 census, 2.4 percent of the population chose more than one race (U.S. Census Bureau, 2002b).
The categories used by the U.S. Office of Management and Budget (OMB) are a small part of the possible racial and ethnic distinctions that might be made among Americans. An encyclopedia of immigrant groups (Levinson and Ember, 1997) provides profiles of 161 groups, from Acadians to Zoroastrians, and this does not include native groups, such as the more than 550 American Indian tribal groups recognized by the Bureau of Indian Affairs. There are of course almost an infinite number of physical and cultural characteristics that could be used to define racial and ethnic groups, and the major groups are defined with reference to a very small subset of these.
In this report we generally follow the OMB classification, with minor modifications (at least partly to accommodate earlier data and studies). We treat Hispanics as a distinct group and all other groups referred to in this report explicitly exclude Hispanics. We do not distinguish Native Hawaiians and Pacific Islanders, treating them together with Asians when the data require this or leaving them out. We treat American Indians and Alaska Natives as a single group. We do not identify Alaska Natives separately since they account for only 0.03 percent of the combined group and are not distinguished (and are probably not represented) in any of the studies we
TABLE 1-1 Population Aged 65 and Older, 2000 and Projected 2050
|
|
Number (millions) |
Percent |
Annual Growth Rate (%) |
|||
|
Racial or Ethnic Group |
2000 |
2050 |
2000 |
2050 |
2000-2050 |
|
|
All groups |
34.84 |
82.00 |
100.0 |
100.0 |
1.71 |
|
|
White |
29.10 |
52.68 |
83.5 |
64.2 |
1.19 |
|
|
Black |
2.83 |
10.00 |
8.1 |
12.2 |
2.53 |
|
|
Hispanic |
1.94 |
13.42 |
5.6 |
16.4 |
3.87 |
|
|
Asian or Pacific Islander |
0.82 |
5.37 |
2.4 |
6.5 |
3.75 |
|
|
American Indian or Alaska Native |
0.15 |
0.53 |
0.4 |
0.6 |
2.50 |
|
|
SOURCE: Estimated from U.S. Census Bureau (2002a). |
||||||
covered. The five racial and ethnic groups we consider, therefore, are Hispanics, whites, blacks, Asians, and American Indians and Alaska Natives. Because of the paucity of data, we do not consider multiracial groups.
Table 1-1 shows the numbers of individuals aged 65 years or older in each of the major groups. In 2000, whites were 83.5 percent of this age group, a substantially larger proportion than their 71.4 percent in the general population. Part of the reason for the difference is the number of younger immigrants, mostly nonwhite, which reduces the proportion of whites at younger ages. The foreign-born population in the United States has become increasingly younger since the 1960s (He, 2002). Nevertheless, in the older population, the foreign born were a substantial, if not dominant, proportion in some groups in 2000. Fully 50 percent of Hispanics 65 years and older were foreign born, as well as 84 percent of Asians and Pacific Islanders (U.S. Census Bureau, 2001).
By 2050, whites are projected to be only 64.2 percent of those aged 65 and older. The Hispanic proportion will almost triple in this period, going from 5.6 to 16.4 percent, and Asians will increase almost as fast. Blacks and American Indians and Alaska Natives will show more moderate growth, but still faster growth than whites because of differential fertility in the past, delayed improvements in mortality, and population momentum (U.S. Census Bureau, 2002a). Whether these racial and ethnic distinctions will remain socially relevant cannot be predicted, but some of them have persisted for centuries. In any case, any differences in health in later life among these groups will become increasingly consequential.
Disparate Treatment
Historically, the recognition of new racial and ethnic groups in the U.S. population has often been marked by conflict, prejudice, and disparate
treatment, providing a special reason for concern about the health of racial and ethnic minorities.
An early and enduring racial and ethnic distinction developed between the native American Indian inhabitants of the continent and the European colonists. Although the natives divided themselves into numerous racial and ethnic or tribal groups, for many purposes the colonists and their governments used a dichotomous distinction between themselves and the natives—a lumping together of the American Indian and Alaska Native populations that is still used in government statistics.
The forcible importation into the American colonies of Africans as slaves gave rise to a third enduring racial or ethnic category. The definition of this category has varied over time (as it does in other countries, such as Brazil and South Africa). The United States held for several centuries to a rule of hypodescent, so that any African or African American ancestry defined a person as black. For three centuries, this limited their rights under law and in practice and marked them as members of a subordinate group (Massey and Denton, 1993).
Other waves of immigration have created and continue to create separately identified racial and ethnic groups in the United States. The large European immigrations of the late nineteenth and early twentieth centuries, first from Northern and then Southern and Eastern Europe, created major new groups. At the height of this immigration, European ethnic groups were often treated as distinct races in the census and other government statistics and heavily discriminated against. For instance, the Irish were racialized first by the British (Allen, 1994) and later also in American society (Ignatiev, 1995). Racial and ethnic distinctions among Americans of European origin are now generally muted, and individuals manifest considerable variation in how much they identify with their European ancestry. This muting of distinctions is also observed in other racial and ethnic groups, though black Americans have had much less latitude than other groups.
Hispanic and Asian immigration began early, some Hispanic settlement in fact predating the accession of particular territories to the United States. Immigration has greatly accelerated in recent decades, rising to levels that rival those of the earlier massive European immigrations. Somewhat in contrast to the practices of those earlier periods, society and government, including statistical agencies and researchers, have not distinguished among the many different national origins of the Hispanic and Asian populations, which has created a set of issues and dilemmas for research. As in other waves of immigration, many Hispanics and early Asian immigrants have at least initially borne the burden of low-wage work and social inferiority (though often earning more than in their countries of origin).
Immigrant groups have immediately become part of the system of
social stratification in U.S. society, generally starting at the bottom of the social ladder. Access to valued resources—jobs, income and wealth, education, power and prestige—generally comes over decades or generations. Ethnic stratification has often given rise to racist ideologies that ascribe inherent inferiority to particular groups (Van den Berghe, 1964).
How Group Membership May Affect Health
Belonging to a particular ethnic group can be linked to health in a variety of ways. Differences in genetic characteristics could produce differences in susceptibility to disease. Since racial and ethnic identity is a crucial part of personal identity, it may be associated with ways of behaving and reacting to the social environment that have implications for health. Since groups differ in their social standing—which tends to evolve over time—their access to health resources may vary. Since groups are not always treated similarly, some may experience more favorable environments for health than others. Arguably, some of these effects could be particularly notable among older people, whose racial and ethnic identification may be more deeply rooted and whose life experiences may reflect early, perhaps turbulent, history of race and ethnic relations. We consider all of these possible effects of racial and ethnic identity systematically in subsequent chapters.
Three complications in the way racial and ethnic groups are defined are important to note for their possible effects on health differences. First, selfidentification allows certain biases to enter group comparisons. For instance, consider the case of American Indians and Alaska Natives. As noted earlier, their numbers have increased rapidly, at least partly because some people are identifying with this group who had not previously done so (Sandefur et al., 2004). These individuals often do not live on designated federal reservations and have higher socioeconomic status than those who do. Though such changes in self-identification need not affect individual health, they still affect average group health, in this case reducing any health disadvantage of American Indians and Alaska Natives relative to other groups. Such selection effects are considered further below.
Second, for one important health outcome—mortality—self-identification is not the norm. Funeral home directors, sometimes with information from relatives, may make the determination of race and ethnicity of the deceased. The complication, from this and other possible sources of misclassification, amounts to published death rates that are too high for whites and blacks (by 1 percent and 5 percent respectively) and too low for American Indians (21 percent), Asian and Pacific Islanders (11 percent), and Hispanics (2 percent) (Rosenberg et al., 1999). A recent study of state hospital discharge data in California found that approximately 70 percent of hospitaliza-
tions of Indian Health Service (IHS) enrolled patients were incorrectly classified as non-American Indian (Korenbrot et al., 2003; see also Grossman, 2003).
A third complication involves the way the major groups are defined. Though they reflect major social distinctions, they may or may not reflect the distinctions that are most relevant in assessing health. It is difficult to tell a priori what racial and ethnic distinctions would be most productive for health research, and some possible distinctions may involve groups too small to be studied nationally. It is important to keep in mind, however, that each of these five major groups we consider is in fact an amalgam of many smaller groups that, in a previous era, might have been separately distinguished, and that may still consider themselves distinct.
Finally, note that the relationship between group membership and health is somewhat different with regard to American Indians and Alaska Natives because of the existence of the IHS. Tribes employ very explicit eligibility criteria to define membership, which are formally ratified by the Bureau of Indian Affairs, U.S. Department of the Interior. These criteria vary among tribes, as it is within their purview to define membership, ranging from different degrees of blood quantum to other, nonconsanguineal forms of descent reckoning. Tribal enrollment, in turn, determines eligibility for access to federally sponsored health care provided through the IHS. There is a strong, but not isomorphic, relationship between tribal enrollment and residence: most American Indians/Alaska Natives living on or near reservations are enrolled tribal members, but as much as 60 percent of the enrolled population lives off-reservation, in rural, suburban, and urban areas. Relatively few individuals who self-identify as American Indian and Alaska Native but are nonenrolled in tribal registers reside in reservations. Thus, in this subpopulation, the issue of identification is not simply a psychological phenomenon but one that has enormous implications for access to health care.
DIFFERENCES IN MORTALITY AND HEALTH IN LATE LIFE
The health differences in late life among the five major groups—Hispanics, whites, blacks, Asians, and American Indians and Alaska Natives—are complex but can be briefly summarized. Blacks generally have worse health than other groups. American Indians and Alaska Natives, especially those on reservations, are also less healthy than other groups except blacks. Whites are usually taken as the standard against which other groups are compared, but they are not necessarily in the best health. Hispanics appear to be healthier than whites on a number of measures, though not all. Asians are generally in better health than any other group (Hummer et al., 2004).
These generalizations are based on various indicators of health, espe-
cially mortality rates, self-rated overall health, the prevalence of major diseases, and measures of physical and cognitive functioning (Hummer et al., 2004; Manly and Mayeux, 2004). There are consistencies across indicators; however, health is multidimensional, and the pattern of racial and ethnic differences is not uniform.
Mortality
The black disadvantage in mortality is clear. As shown in Figures 1-1 and 1-2, the official death rates for black males and females are 30-50 percent higher than those of whites at ages 65-79. Official statistics have various limitations—underregistration of deaths, disparities in racial and ethnic identification between registered deaths and the base census population, and inaccurate age reporting. However, attempts to correct for such data limitations still leave a significant black-white gap (Hummer et al., 2004). Overall, life expectancy for blacks is nearly 7 years shorter than for whites (Rogers et al., 2000), given that mortality is also higher for blacks at younger ages: more than twice that of whites among infants and still twice that of whites at ages 20-24.
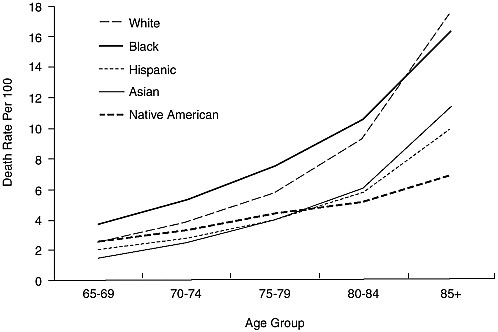
FIGURE 1-1 Death rates per 100,000 by race and ethnicity: Males 65 years and older, 1999.
SOURCE: Derived by Hummer et al. (2004) from Hoyert et al. (2001).
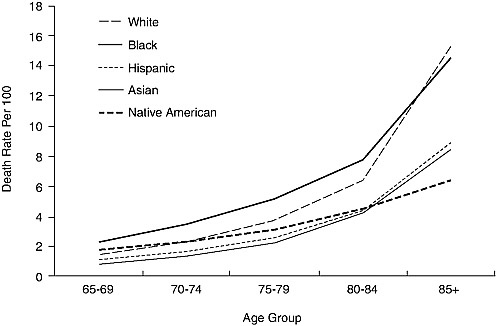
FIGURE 1-2 Death rates per 100,000 by race and ethnicity: Females 65 years and older, 1999.
SOURCE: Derived by Hummer et al. (2004) from Hoyert et al. (2001).
For other minorities, official statistics suggest that individuals 65 years and older have lower mortality rates than whites. In some cases, this minority advantage stands up under scrutiny; in others, it does not, or may still be questionable, as data limitations have been less studied among other minorities than among blacks.
Mortality rates for Hispanics appear to be biased downward, but corrected rates are still lower than those for whites. The Hispanic mortality advantage is not consistent over the life course. Hispanics have similar mortality levels to whites in infancy but 24 percent higher levels at 20-24, with this disadvantage decreasing and turning into an advantage in late adulthood (Hummer et al., 2004; Liao et al., 1998, Rogers et al., 2000). Among Hispanic subgroups, Puerto Ricans show this pattern most clearly, with a substantial mortality disadvantage relative to whites, greater than that for blacks, at ages 18-44 (whether or not socioeconomic factors are controlled), still some disadvantage at ages 45-64, and a small nonsignificant advantage at ages 65 and older (Rogers et al., 2000).
One factor to keep in mind, therefore, is the fact that comparisons at
older ages only involve those who survive to these ages; thus, if mortality is higher at younger ages for Hispanics, those who survive to older ages would be a select group in some sense (we discuss this argument, which could apply to all groups, in subsequent chapters). Another factor of note is the large proportion of foreign born among Hispanics (and island born among Puerto Ricans), a proportion that varies by age and reaches its peak around age 40.
As for Hispanics, the mortality rates for Asians are biased downward, but corrected rates are still better than those for whites. In contrast to Hispanics, the Asian mortality advantage appears consistently at all ages. Notably, the proportion foreign born is even higher, at all ages, among Asians than Hispanics.
For American Indians and Alaska Natives, the apparent overall advantage over whites in mortality in old age may be entirely illusory, since their rates are estimated to be 21 percent too low (Rosenberg et al., 1999), mainly because decedents are misclassified and are particularly unreliable at the oldest ages. Somewhat more reliable data come from the IHS (1999), which covers the 60 percent of American Indians and Alaska Natives living on federal reservations or in counties near them. These data show mortality levels for those 65 years and older that are 40 percent higher than those for whites. Survey data linked to subsequent mortality information, in contrast to official death rates, also suggest that American Indian and Alaska Native mortality levels are at least similar to those for whites. Notably, American Indian and Alaska Native mortality at younger ages is substantially higher than among whites: 60 percent higher among infants and almost twice as high for those 20-24 years old (Hummer et al., 2004).
At the oldest ages, for those 85 years and older, mortality rates appear to cross over in some cases, with black mortality falling below that of whites and American Indian and Alaska Native mortality falling below that of Hispanics and Asians and Pacific Islanders (see Figures 1-1 and 1-2). The black-white crossover appears in many data sets, though skepticism persists about data quality because of such problems as age misreporting. Recent evidence still suggests a crossover at ages 90-94 for males and 95 and older for females (Hill et al., 2000). However, the crossovers involving American Indians and Alaska Natives are suspect because of data problems. A crossover also appears, as noted above, for Hispanics relative to whites, but below age 65 and therefore not shown in Figures 1-1 and 1-2.
An important factor in any actual crossover is the possibility of selection: higher mortality earlier in life could leave fewer but more robust members in some racial and ethnic groups. This could, in fact, affect comparisons for older adults as a whole, since survival to age 65 is less common among blacks and American Indians and Alaska Natives.
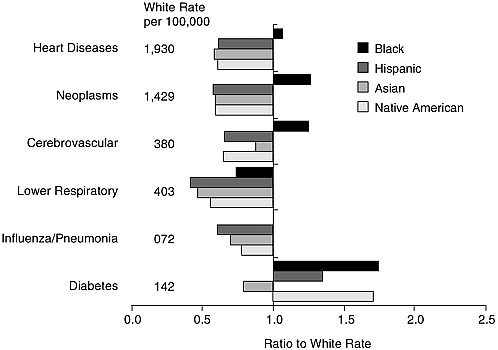
FIGURE 1-3 Death rates of racial and ethnic groups by underlying cause: Males 65 years and older, 1999.
SOURCE: Based on Anderson (2001).
Causes of Death
Figures 1-3 and 1-4 show six leading causes of death for males and females by racial and ethnic group. The rates and ratios shown are subject to the same qualifications as overall mortality rates, as well as not being age-standardized. Diseases of the heart and neoplasms are the leading underlying causes of death for every racial and ethnic group, between them accounting for over half of all deaths at age 65 and older. For other causes, rankings vary slightly by group (so that diabetes, the sixth cause shown, actually ranks lower for some groups than Alzheimer’s disease).
Older blacks have higher death rates than older whites from the two leading causes, heart diseases and neoplasms. For the third cause, cerebrovascular diseases, the death rates are sharply higher among men and somewhat marginally higher among women. Blacks do die less often from the fourth and fifth causes shown—lower respiratory infections and influenza and pneumonia. But older blacks are also more likely than whites to die from diabetes, nephritis, and septicemia (Hummer et al., 2004). Data on causes of death therefore generally substantiate higher mortality among older blacks than whites.
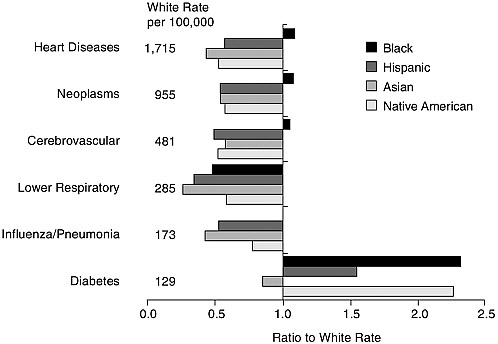
FIGURE 1-4 Death rates of racial and ethnic groups by underlying cause: Females 65 years and older, 1999.
SOURCE: Based on Anderson (2001).
In contrast to blacks, other minorities appear to be at lower risk than whites from any of the five leading causes. Only for the sixth leading cause—diabetes—do whites enjoy an advantage over Hispanics, American Indians, and Alaska Natives. Except for diabetes, the Hispanic advantage is quite general (Markides et al., 1997; Rosenwaike, 1987; Sorlie et al., 1993) and extends to the other major causes of death and even to a residual category after the ten leading causes are accounted for.
The American Indian and Alaska Native advantage appears almost as consistent (except for diabetes, as noted, and nephritis among women and accidents among men), but is not as large, and it rests on weaker data. American Indians and Alaska Natives on reservations, however, have higher cause-specific death rates than American Indians and Alaska Natives more generally, and they are also at a disadvantage relative to whites for influenza and pneumonia. The death rate on reservations at age 65 and older from influenza and pneumonia is two-and-a-half times that for American Indians and Alaska Natives generally and twice that for whites (Indian Health Service, 1999).
Lastly, Asians have lower cause-specific death rates than whites for all
the leading causes, including diabetes (Hummer et al., 2004; Williams, 2001b). However, this is not the case for Pacific Islanders specifically.
Among the leading causes not shown in the figures, there is one further interesting contrast: whites have a substantially higher death rate from Alzheimer’s disease than any other group. For older white women, for instance, the rate is 75 percent higher than the rate for blacks and more than double the rate for any other group (Hummer et al., 2004).
One way to summarize these contrasts, at least between whites and black, is to estimate how much each cause of death contributes to the racial and ethnic differences. We cannot look specifically at older people, but analysis has been done for all ages combined. Across all ages, deaths from hypertension contribute the most to black-white differences (15 percent), followed by HIV (11 percent), diabetes (8 percent), and homicide (8 percent) (Wong et al., 2002). At older ages, two of these causes—HIV and homicide—should be less significant, which may have some influence on the convergence of black and white mortality rates.
Health and Disability
In some respects, comparisons of health and disability across racial and ethnic groups are consistent with the mortality comparisons, but in others they are not. Surveys often ask people to rate their health as excellent, very good, good, fair, or poor, and these ratings generally correlate with subsequent mortality. Table 1-2 shows the percentages of people who report fair or poor health in pooled National Health Interview Surveys from 1989 to 1994 (Hummer et al., 2004). Though there is some variation at the oldest ages, self-rated health for blacks is generally the worst among all racial and ethnic groups (Hayward and Heron, 1999), and self-rated health for Asians is generally the best. Between these extremes, rankings are different from those for mortality. Whites have better self-rated health than Hispanics and much better self-rated health than American Indians and Alaska Natives.
Comparisons of groups in regard to activity limitations (Table 1-2) parallel those for self-rated health. The limitations indicator includes individuals who report being unable to perform their major activity, being limited in it, or being limited in other activities. The rankings by racial and ethnic groups on this indicator are essentially the same as for self-rated health, except that American Indians and Alaska Natives are worse than blacks for some age and gender categories.
In contrast to mortality rates, black and white morbidity indicators do not cross over at the oldest ages. Even at the oldest ages, blacks report more severe problems with disability and functioning than whites.
Health and disability comparisons could differ from mortality comparisons for substantive reasons, or the differences could be artifactual. The
TABLE 1-2 Self-Rated Health and Activity Limitations, Pooled 1989-1994 Data
|
|
Male |
Female |
||||
|
Racial or Ethnic Group |
65-74 |
75-84 |
85+ |
65-74 |
75-84 |
85+ |
|
Self-Rated Health: Percent Fair or Poor |
||||||
|
White |
24.5 |
30.8 |
32.0 |
23.0 |
29.1 |
34.0 |
|
Black |
41.3 |
47.3 |
51.4 |
41.0 |
45.8 |
46.2 |
|
Hispanic |
—a |
—a |
—a |
—a |
—a |
—a |
|
Mexican |
34.1 |
45.3 |
56.6 |
36.0 |
44.7 |
48.1 |
|
Other |
30.0 |
34.6 |
40.3 |
32.0 |
41.7 |
44.9 |
|
Asian or Pacific Islander |
18.2 |
17.4 |
—a |
20.9 |
35.0 |
—a |
|
American Indian and Alaska Native |
35.4 |
51.0 |
—a |
34.2 |
40.5 |
—a |
|
Percent with Activity Limitations |
||||||
|
White |
35.0 |
39.5 |
49.6 |
32.8 |
41.0 |
60.8 |
|
Black |
41.6 |
48.1 |
59.5 |
43.2 |
51.1 |
65.7 |
|
Hispanic |
—a |
—a |
—a |
—a |
—a |
—a |
|
Mexican |
39.3 |
38.4 |
70.8 |
39.9 |
41.4 |
57.2 |
|
Other |
36.3 |
35.2 |
51.6 |
34.3 |
47.3 |
68.6 |
|
Asian or Pacific Islander |
22.1 |
32.2 |
30.8 |
20.0 |
33.5 |
43.5 |
|
American Indian and Alaska Native |
44.6 |
36.4 |
—a |
42.9 |
66.5 |
63.2 |
|
aToo few cases. SOURCE: Hummer et al. (2004). |
||||||
data come from different sources, and for the oldest groups they are fairly scanty. Self-reported health and disability estimates come from survey data—rather than being based on registration and census data—which exclude the institutionalized population and may miss 2-5 percent of decedents (Hummer et al., 2004). Some research suggests that, for cultural reasons, Hispanic immigrants may be more likely than others to report ill health, and their reports may be less predictive of subsequent mortality (Finch et al., 2002).
Diseases and Conditions
Reports of specific diseases and health conditions are more difficult to compare systematically across all groups than general health and disability. Some comparisons can be made, though the picture gets increasingly clouded. The 1998 National Health Interview Survey compares three groups—whites, blacks, and Hispanics—on selected diseases and conditions (Pleis and Coles, 2002). Table 1-3 shows the percentage of people aged 65 years and older in each group who report ever having been diagnosed with each condition.
Older blacks report a diagnosis of hypertension much more often than whites. This is true for both sexes, though such diagnoses are reported more
TABLE 1-3 People 65 Years and Older with a Particular Disease or Condition
frequently by women than men. Blacks also report a previous stroke more often than whites, but black males are less likely than whites to report heart disease. This is somewhat inconsistent and it should be noted that these are self-reports, and anyone who died from these diseases (or from any other cause) is not in the comparison. Blacks report a previous diagnosis of any cancer much less often than whites, including reports of breast cancer among women. Blacks report substantially more frequent diagnoses of diabetes.
These comparisons are consistent with other data in which blacks do
not report any greater heart disease morbidity than whites (Crimmins et al., 2004; Hayward et al., 2000). In these data, blacks aged 50 and older report higher levels than whites of hypertension, diabetes, stroke, kidney disease, bladder problems, lung problems, asthma, back problems, foot and leg problems, and vision and hearing problems (Hayward et al., 2000). On the last problem, however, testing of adults, as well as reported diagnoses, suggest better hearing among blacks, particularly elderly black men, than whites (Desai et al., 2001; Henselman et al., 1995; Jerger et al., 1986; Pleis and Coles, 2002).
Among blacks, dementia and Alzheimer’s disease appear to be more prevalent than among whites (Manly and Mayeux, 2004), despite Alzheimer’s being more often listed as a cause of death for whites. Although precise comparisons of cognitive status are clearly difficult for populations with different educational backgrounds, blacks do appear more likely to suffer from vascular dementia than whites (Manly and Mayeux, 2004). In contrast, blacks report lower levels of depression than whites.
Hispanics report being diagnosed with diabetes much more often than whites, but much less often with circulatory diseases (with the exception of stroke among women) and any cancer, including breast cancer (see Table 1-3; Pleis and Coles, 2002). Some other data suggest more self-reports of respiratory problems, infections, pneumonia, influenza, and accidents (Markides and Black, 1996), though this is on the face of it inconsistent with fewer deaths from these causes among Hispanics. Levels of cognitive impairment and affective disorders for Hispanics appear to be higher than among whites, a comparison complicated by differences in socioeconomic status as well as language (Manly and Mayeux, 2004; Myers and Hwang, 2004).
There is a little more information about Mexicans in the United States than about other Hispanics. Mexicans’ life expectancies are similar to those for whites (Rogers et al., 1996; Sorlie et al., 1993); they have higher levels of disability than whites or other Hispanics (Hummer et al., 2004) and are sometimes reported to be less likely to suffer from major depression (Burnam et al., 1987).
Asians are not in the data for Table 1-3, but other data show they have lower prevalence than whites for heart disease, cancer, and cardiovascular disease (Kagawa-Singer et al., 1997; Whittemore, 1989; Ziegler et al., 1993), consistent with their lower mortality levels. The evidence on relative levels of depression for Asians is mixed: some studies show Asians’ reporting higher levels of depression than whites, while others find lower levels (Kuo, 1984; Myers and Hwang, 2004).
The Asian and Pacific Islander population is a composite of many groups that vary in health as well as many other life circumstances. Little is known about Asian subgroups, but research has shown Indians, Chinese,
Filipinos, and Japanese report similar or better health status than whites (Kuo and Porter, 1998), while Native Hawaiians and Samoans appear to have worse health (Hoyert and Kung, 1997). Older U.S. residents of Chinese, Filipino, Indian, Korean, and Vietnamese heritage have lower mortality than whites. Mortality rates among these groups do not follow socioeconomic rankings. For instance, Vietnamese, who have lower average incomes than Indians, have lower mortality than Indians in every age group of 65 years and older (Lauderdale and Kestenbaum, 2002).
Besides differences in broad disease categories, racial and ethnic differences exist in specific diseases. With cancer, for instance, the data show these differences (Burdette, 1998; Manton and Stallard, 1997):
-
more cases of melanoma among whites than other groups;
-
high rates of ovarian cancer among whites of European ancestry;
-
lower incidence of breast cancer among blacks and Hispanics than other groups;
-
twice as many cases of cervical cancer among blacks than among all other groups, though not among those aged 65 years and older, and higher incidence among Hispanics than non-Hispanics (Armstrong et al., 2002);
-
a high incidence of pancreatic cancer among blacks and those of Polynesian ancestry;
-
lower rates of cancers of the gallbladder and cystic ducts among blacks than other groups; and
-
a higher risk of multiple myeloma among blacks than whites.
Differences also exist within the major racial and ethnic groups. Among Asians, for instance, breast cancer incidence is twice as high among Japanese as among Vietnamese women; in contrast, cervical cancer incidence is seven times as high among Vietnamese as among Japanese women (Miller et al., 1996; Williams, 2001b).
Knowledge about all these differences is limited by numerous problems of measurement. For instance, the ethnicity of decedents may not be reliably determined, because it must be reported by someone else. For other health indicators, ethnic identification could be more accurate, though people may be inconsistent in reporting their own race or ethnic status, particularly when they are of mixed descent. Health status may also be reported inconsistently. For instance, disability is often defined relative to normal activities, which may vary from group to group. Groups accustomed to more physically challenging work may report greater disability than other groups. Reports of medical conditions may be affected by the amount of contact with providers of medical care. Racial and ethnic groups with more access to the medical system may report more health problems simply because of greater contact. And there are special problems in comparing
mental health across racial and ethnic groups. Finally, we have mainly compared disease prevalence across groups, but groups may also differ in such other factors as age at disease onset, duration, and severity.
NEEDED RESEARCH
The uncertainties and inconsistencies in this sketch of mortality and health differences suggest various directions for future research: to clarify the health status at older ages of particular groups, to define more clearly what appear to be contradictions in particular areas of health and disease, and to resolve apparent conflicts between indicators.
Research Need 1: Attempt a systematic decomposition of racial and ethnic health differences in mortality and morbidity among older people to determine the relative contribution of particular diseases and conditions. Try to assign differences in the prevalence of specific diseases and conditions to differences in the prevalence of major risk factors.
Racial and ethnic differences in mortality have in fact been decomposed in relation to various diseases and conditions with reference to people of all ages (Wong et al., 2002). A focus on older people would be useful. Moving beyond such decomposition to assess the contribution of risk factors of all types to differences would be a complex exercise, though perhaps a more manageable challenge than the World Health Organization’s (2002) attempt to assess the contribution of all major risk factors to the global disease burden. If such partitioning can be accomplished, it should be possible to refine the research agenda to focus on the most critical areas.
The health disadvantages of blacks and American Indians and Alaska Natives appear to be the most troubling. Black disadvantages are the best documented, so the research emphasis for blacks might be more appropriately on understanding differences, which we consider in subsequent chapters.
Research Need 2: Clarify the contrasts between mortality rankings and morbidity rankings, particularly between older whites and Hispanics, and assess the relative contributions of diseases and conditions to differences in mortality and overall health.
One problematic contrast is the consistently poorer self-reported health among Hispanics than would appear warranted by mortality levels. Another is the higher incidence of heart disease mortality among blacks than whites, despite the higher reported diagnoses of the disease among whites. To understand such apparent contradictions, it would be useful to be able to assess, on a continuing basis, how much each disease or condition adds to mortality or detracts from overall health, as has been done for the population as a whole (Wong et al., 2002) but not for older adults or different ethnic
groups. Some of the differences between mortality and morbidity indicators appear to vary by age group. Although various explanations are possible, such as differences in the proportion of recent immigrants across age groups, there is as yet no adequate support for any explanation.
In sorting out the possible discrepancies in group comparisons, measurement and other methodological issues require continued attention. For instance, misclassification has an important effect on statistics for some minority groups; ethnic identification and misidentification therefore need further study. The reliability and comparability of such measures as self-reported health require continued attention. Issues such as the black-white mortality crossover at the oldest ages have received much attention from demographers attempting to sort out the methodological issues. Other examples of apparent crossover, or at least convergence, also exist, as well as cases—such as with black-white morbidity—for which rates do not converge.
For some group and subgroup comparisons, inconsistencies may not be evident simply because of the lack or weakness of data. For older American Indians and Alaska Natives, for instance, higher mortality than average may or may not be a problem: the data are too uncertain to be sure. Levels of disability and specific conditions, such as diabetes, indicate health problems in this population. American Indians and Alaska Natives living on or near reservations appear to be in poorer health than others in the group. The small size of the group, however—150,000 American Indians and Alaska Natives are aged 65 and older—makes national samples less practical, though it should be feasible to study representative samples of those living on or near reservations.
Similar attention may be needed to establish the health status of other selected subgroups. This is especially true of the Hispanic and Asian groups, which are known to be heterogeneous with respect to health. Native Hawaiians, for instance, who appear to have high levels of diabetes, need to be distinguished from other Asians, who are the least likely to die of diabetes among the major groups. Subgroups can be small and costly to study, even if the focus is regional rather than national. Rather than considering all subgroups, the focus should be on subgroups that theory and prior research suggest are in substantially poorer health than the general population. As much use as possible should be made of existing data sets.
Research Need 3: When particular diseases are especially prevalent for specific racial and ethnic groups, collect more indicators of biological and functional performance in order to identify possibilities for intervention.
One area of functioning that deserves attention is differences among groups in cognitive ability and other aspects of mental health. Research would require development of measurement approaches that take account
of differences in language, culture, and education among older people. Although differences in cognitive ability often mimic those in physical disability and disease, some differences do not fit this pattern. Hispanics perform worse on cognitive tests than might be expected given their life expectancy levels. In addition, previous results in this area have often been contradictory. This is partly due to reliance on nonrepresentative samples, but may also be due to tests for cognitive impairment that are not culturally sensitive. Traditional scales for indicating depression may also need to be modified for work focusing on older persons of different racial and ethnic groups (Turvey et al., 1999). Future developments in neuropsychiatric assessment and imaging techniques may help control for the effects of education and language in cognitive assessment.
Comparisons among groups, extending beyond the five major groups, might be useful in suggesting what aspects or consequences of racial and ethnic identity are really critical for health and disease and what additional dimensions should be measured. Some comparisons might involve multiracial or multiethnic groups. Study of black-white unions, for instance, suggests that the race of the mother is more important than the race of the father for infant health (Polednak and King, 1998). Other comparisons might involve racial and ethnic groups in other societies. For instance, immigrant groups in the United States lose their health advantage over time; this does not appear to be true in the United Kingdom (Nazroo, 2004), which raises important questions about mechanisms. To take another example, deaths from respiratory conditions in South Africa are considerably less common among blacks than whites (Bradshaw et al., 2004), suggesting a parallel with the U.S. situation and the possibility of investigating possible protective factors cross-nationally.
Why racial and ethnic differences in health exist is obviously a central issue for further research. The existence of some health differences may be clear, but their meaning is not. The relatively high mortality of blacks and the relatively low mortality of Asians and Hispanics give rise to several possible lines of investigation. Research on the selection of immigrants by health status may help clarify some differences involving these groups. Socioeconomic factors obviously differentiate groups and play a role in health differences, but how much of a role, and in what ways do such factors contribute? Differences at older ages require study of cohort selectivity and the effect of differential mortality on the characteristics of survivors. We consider these and other possible roots of differences in the following chapters.
Is there any basis, from looking at differences, for deciding which health differences especially need to be explained? Various plausible arguments might be made. For instance, it is important to understand the factors limiting the health of groups that are both relatively large and in the poorest
health or at greatest risk of illness relative to the general population. This would certainly include black and American Indians and Alaska Natives, but also significant portions of other racial and ethnic groups. Another priority might be explaining differences that go in unexpected directions or are of unexpected size. If, for instance, the reasons for the Asian advantage in mortality and the more limited Hispanic advantage could be understood, that might provide hints about how to improve population health generally. Such arguments need not exclude research attention to other health differences, whether for theoretical or practical reasons, and would have to be qualified by what is not known yet about health differences. We briefly consider arguments about the importance of differences before turning to explanatory factors.
WHY HEALTH DIFFERENCES MATTER
The main reasons for concern about health differences are their relationship to the well-being of individuals and to society as a whole. These two concerns are different and sometimes even at odds: in some circumstances, for instance, societal well-being might demand that individuals be quarantined, whether or not this is beneficial to their own health.
What is an individual’s well-being? Beyond health and economic well-being generally, it includes many other important dimensions, such as physical security, the freedom to participate in society, love and companionship, and the sense of being treated fairly. All such dimensions of well-being should be considered together, but we concern ourselves here, for illustration, with the health and income dimensions. There are important complementarities between health and income. Health is needed to earn income, and to enjoy it. Income is needed to ensure health, and people with lower incomes suffer from worse health and live shorter lives. Health and income should not be thought of as two separate contributors to well-being; they are intimately connected. Physical functions are involved in almost all aspects of earning a living and consuming goods, and health problems have different effects on different activities.
Many people care about the well-being of individuals, and many care particularly about those who have the lowest levels of well-being (Rawls, 1971). In the United States, the income component of well-being varies by race; black earnings and incomes are lower than white earnings and incomes, for example. Health differences show the same pattern. As a result, the racial gap in either income alone or health alone understates the racial gap in well-being (Deaton, 2002). In addition, blacks in the United States have historically suffered from deprivations beyond income and health, particularly deprivations of civil rights. Given this background of historical and current deprivation in multiple dimensions, racial differences
in health are less tolerable than they would be if the history were more benign, and their documentation and remediation are more important.
It is important to recognize that the same arguments may not apply with equal force to all minority groups. For example, the household incomes and health of some Asian groups exceed those of native-born non-Hispanic whites. Similarly, while Hispanic incomes are similar to those of blacks and are well below those of the white majority, Hispanic health is currently, on particular though not all indicators, at least as good as that of the white majority. On such grounds, it is appropriate to distinguish among ethnic and racial minorities when evaluating the case for reducing health differences. In particular, the argument for reducing the health disadvantages of blacks is quite compelling.
There is also a separate argument about process, primarily, but not exclusively, in the provision of health care (Deaton, 2002; Sen, 2001). The extent to which health care contributes to health status is debated, but it is reasonable to suppose that some part of the variation in individuals’ health status is attributable to variations in health care. If access to or quality of health care is unfairly linked to racial or ethnic identity, it deserves a remedy. This would be true even if the role of health care in maintaining health or improving longevity could not be conclusively demonstrated. Unfairness is not eliminated because its consequences are hard to demonstrate. Racial and ethnic differences in health care could be a social problem even if there were no differences in health across racial and ethnic groups, or if, for some other reason, the group that was adversely affected had superior health outcomes. Some Americans are also denied access to jobs, or housing, or are treated disrespectfully because of their race or ethnicity. These differences are of concern in their own right, and, like unequal health care, may also affect health, although the evidence that discrimination is involved in the variation in care and produces health differences remains uncertain and controversial.
These two arguments imply that black-white health differences and American Indian and Alaska Native-white health differences may be of particular concern. This is in part because blacks and American Indians and Alaska Natives have suffered, and in some cases continue to suffer, other deprivations that make their relatively poor health. There is reason to suspect that differences in health care may contribute to their inferior health, either because areas where blacks and American Indians and Alaska Natives live are served less well, or because of medically different treatment. But individual differences in preferences and choices may also be contributing factors. The health differences of other racial or ethnic groups may also be of particular concern: examples might include American Indian and Alaska Native on reservations, Native Hawaiians, and Puerto Ricans. These arguments apply to health inequalities in general, in addition to those involving
race and ethnicity. For example, there is a large literature on health differences across income, wealth, and educational groups, showing that the poor typically have far worse health than the rich. (Concern about such inequalities is often greater in other countries than in the United States [Gwatkin, 2000; Independent Inquiry into Inequalities in Health, 1998]).
It is often argued that health inequities—including those across racial and ethnic groups—are important because they identify lives that can be saved. If there is no “biological” reason why poor people should be sicker than rich people or why blacks or American Indians and Alaska Natives should be sicker than whites, Hispanics, or Asians, then Americans who are poor or black or from native populations are obvious targets for health interventions. Yet it is not clear whether such targeting is the most effective way, from a medical standpoint, of improving population health.
One issue that naturally arises when group differences in health are discussed is the question of within-group heterogeneity in health. The need for health care is best identified by health status, not by membership in a socioeconomic or racial or ethnic group. Many poor people are not sick, and many rich people are. If the objective is to improve health, one should simply select people by their need for care, not by their socioeconomic status or ethnicity. In many cases, though, selecting on health status may be too late to do much good. If the goal is to prevent a disease or health-threatening condition, one needs to select people at risk, and although race or ethnicity is never the sole relevant risk factor, it is often a major risk factor. So, for example, a strategy for reducing hypertension or diabetes may target racial or ethnic groups that are at high risk for those conditions once other risk factors have been taken into account.
It is also worth asking why health differences matter from a research perspective. For example, it costs money to collect data on health differences, especially for small, hard-to-sample ethnic groups, and policy makers must decide whether or when public support for such efforts is justified. Policy priorities also depend to some extent on what causes health differences, so that it becomes an important goal of research to uncover mechanisms. For example, some people argue that health differences that are “chosen,” through differences in behaviors, are a less important issue for public policy than are differences that are involuntary or that are imposed by other people’s behavior. In particular, if research shows that black-white health differences are in large part attributable to differences in health care, the policy agenda would be much clearer than it currently is. One good reason for caring about black-white health differences is the possibility that this might be the case, that there are more “preventable” deaths among minorities, and that some relatively straightforward policies could bring the health of blacks closer to that of whites. The extent to which health care
differences are in fact responsible for health differences between groups is an urgent research priority.
Ethnic differences in health also generate a basic research agenda. Currently, researchers are far from agreement on the causes of health differences. A good example of such an issue is the Hispanic health paradox (the high levels of Hispanic health relative to their incomes) and the effects on health of the length of time that Hispanics remain in the United States. While these may not be first-order issues given the relatively good health of Hispanics in general, they are fundamental scientific questions concerning the social determinants of health.
These arguments have a number of implications for thinking about reducing health differences. First, it is important to see reductions of health inequalities within a context of improving health more generally. Some health innovations that are clearly a good thing might exacerbate racial health differences. Thus evaluating health policies exclusively on the basis of their impact on racial and ethnic health differences would obviously be a mistake. But to say that we care about these health differences also means that, at least along the race or ethnic dimension, we should as a society be willing to devote significant additional resources to reducing the black-white gap in health outcomes.


