
19
An Exploratory Investigation into Racial Disparities in the Health of Older South Africans
Debbie Bradshaw, Rosana Norman, Ria Laubscher, Michelle Schneider, Nolwazi Mbananga, and Krisela Steyn
South Africa is a middle-income country with a heterogeneous population. The achievements in transforming from its Apartheid past to a non-racial democracy have generated worldwide admiration that almost parallels the notoriety achieved previously for its constitutional racial segregation and exploitation. Structured around a population register of racial classification, the economy, social, and political spheres were mutually reinforcing in building a society steeped in racism and economically favoring the white minority elite. A legacy that South Africa now has to grapple with is an income distribution that is among the most unequal in the world and that more than half of the South African people, mostly black, live in conditions of poverty, with 11.5 percent in conditions of extreme poverty (United Nations Development Programme, 2002).
Currently totaling approximately 46 million, the people of South Africa have diverse origins. Ancestors of the Khoisan flourished in Southern Africa for thousands of years as hunter-gatherers. Around 300 to 500 AD, Bantu-speaking people moved south from West Africa, bringing Iron Age settlements to Southern Africa. Nguni-speaking people settled in the eastern part and Sotho-speaking people settled in the northern part. European explorers reached South Africa many years later and eventually established an outpost at the Cape to provide provisions for the passing sea trade in 1652. An ensuing struggle for land, resources, and political power occurred that involved the British, the Boers, the Xhosa, and the Zulu peoples as well as other smaller groups. The current population profile reflects this diversity, including people of Indian descent who were brought as indentured
laborers to work on the sugar plantations or came as “passengers” to trade as merchants. There are 11 official languages, complemented by several other indigenous languages and dialects. The largest organized religion is Christianity; others include Hinduism, Islam, and Judaism. In addition, many people hold a “traditionalist” belief system. The rich heritage of South Africa has resulted in enormous cultural and ethnic diversity.
The complexities of race and ethnicity have been debated extensively by social scientists and are now to a large extent accepted as social and cultural constructs rather than biologically based. These debates have highlighted the fluidity of classifications by race or population group. The current population classification in South Africa is largely based on the practice of the national statistics office, Statistics South Africa, in its collection of demographic and other official statistics. The 1996 Census (Statistics South Africa, 1996) incorporated self-reported population groups: Black/African (77 percent), coloured (9 percent), White (11 percent), Asian/ Indian (2.6 percent), and other (0.9 percent). These groupings have evolved from the 1950 Population Registration Act, which racially classified people and formed the basis of Apartheid in conjunction with the Group Areas Act (1950), which defined where people could or could not live and the Bantu Authorities Act (1951), which resulted in forced relocations. This population classification incorporated elements of descent and social standing. While “Black” was defined as “a person who is, or is generally accepted as a member of any aboriginal race or tribe of Africa,” the category of “White” incorporated extensive social criteria and the category of “Coloured” was defined in the negative, as a person who is not a white or black. In a critical evaluation of the South African notions of race, West (1988) described these classifications defined by legislation as a “farrago of imprecision” (West, 1988, p. 103) that were far from being based on physical characteristics and concluded that South Africans cannot be categorized easily into the population groups, races, tribes, or cultures. He reiterated that the classification system “existed to divide and control in terms of access to political rights and economic resources and thereby maintain power and privilege” (West, 1988, p. 110).
The profound economic and social impacts of Apartheid and these population group classifications make it important to investigate the resulting inequalities in terms of health and other social dimensions. The 1996 Census reveals that household expenditures differed markedly by population group (Statistics South Africa, 2000). For example, 79 percent of white male-headed households were in the highest expenditure category, compared to only 5.8 percent of African male-headed households (Figure 19-1). Similar trends were observed for female-headed households. Unemployment levels also follow these racial disparities. It is estimated that in 1999, 25 percent of African men were unemployed and 35 percent of African women, compared with 4
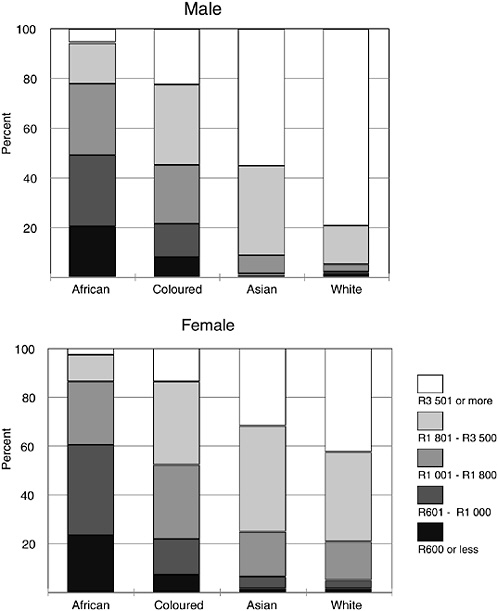
FIGURE 19-1 Monthly household expenditure by population group and gender of household head.
SOURCE: Statistics South Africa (1996).
percent of white men and 5 percent of white women (Statistics South Africa, 2001b). These figures are based on the more conservative definition of unemployment, which requires that the respondent sought work in the past month and unemployment can be considered to be higher. The figures hint at the conflation of race, class, and gender in South African society.
The South African population is undergoing a demographic transition. The total fertility rate has been declining over the past 30 years and has reached a level of 2.9 children (Department of Health, Medical Research Council, and Macro International, 1999). The population is relatively young, with about a third younger than the age of 15, another third between the ages of 15 and 34, and the remaining third aged 35 or older. Just over 5 percent of the population was over the age of 65 at the time of the Census. Although Africans comprise the largest number of elderly, the proportions of whites and Asians who are elderly are larger than that for Africans and coloureds. The Census reveals that a large number of the elderly live in poor conditions. For example, 13 percent live in homes without toilets and 23 percent without running water (Booysen, 2000). South Africa has a social pension that is accessed on the basis of a means test. It is limited (parity purchasing power of approximately $140 per month in the year 2002), but plays an important role in household income for poor families.
The absolute numbers of elderly can be expected to grow, and their health is of growing social concern. The general disintegration of family care and the lack of institutional care or support poses a threat to the well-being of the elderly. Furthermore, it is not clear how poverty aggravates the ill health of the aged, or how recent retrenchments are likely to affect their health. General unemployment puts added pressure on the old-age pension, with other household expenses, such as school fees competing for the money. There is mounting evidence of the added burden that HIV/AIDS is placing on the elderly, particularly Africans. Not only are they going through the emotional trauma of losing young members of the family and losing the economic support of their children, but they have the added burden of looking after orphaned grandchildren after having nursed a dying child.
This chapter sets out to investigate racial and socioeconomic differentials in aging health in South Africa. Data are examined to describe these differences in health and the prevalence of risk factors. The extent to which such racial differences can be accounted for by socioeconomic factors are then considered, allowing contrasts and comparisons with the situation in the United States.
HEALTH IN SOUTH AFRICA
Efforts to investigate racial disparities in health have been thwarted by the lack of reliable statistics, particularly mortality data. As long ago as 1945, the complete inadequacy of vital statistics for the “native population” (sic) was highlighted (Luke, 1945). For many years, this has been largely ignored. Attempts to extend death registration to Africans living in rural areas during the late 1970s were not successful and analysis of the available statistics showed problems such as underregistration and misclassification of the cause of death (Botha and Bradshaw, 1985). The cat-
egory “population group” was dropped from the death notification forms in 1991 with the repeal of the Population Registration Act. However, since 1994, the new government has prioritized the development of a national health information system (Department of Health, 1997) and has initiated efforts to improve vital registration and conduct national health surveys. In addition, the importance of monitoring racial disparities has been highlighted and in 1998, a new death notification form was introduced that included population group and other socioeconomic indicators. Because the data have not yet been processed, it is currently impossible to investigate racial disparities in mortality based on vital registrations.
The first comprehensive Census was conducted in 1996 and the first national Demographic and Health Survey (SADHS) was conducted in 1998 (Department of Health, Medical Research Council, and Macro International, 1999). They have revealed clear racial disparities in health status; for example, the infant mortality rate for Africans was found to be 47 per 1,000, compared to 11 per 1,000 for white South Africans.
Although registration of child deaths remains a problem, the registration of adult deaths has improved markedly. Dorrington, Bourne, Bradshaw, Laubscher, and Timaeus (2001) estimate that registration has increased from about 50 percent of adult deaths being registered in 1990 to more than 90 percent in 2000. Although death registration has improved, there is a time lag in the processing of statistics; 1996 is the latest year for which the cause of death statistics are available, but these do not include population group details.
Careful analysis of the available cause of death information suggests that the South African population is undergoing a health transition with the coexistence of both poverty-related diseases, such as tuberculosis (TB) and diarrhea, with the emerging chronic diseases associated with a Western lifestyle. Furthermore, this has been compounded by high rates of injury and more recently by the HIV/AIDS epidemic, which spread rapidly during the 1990s (Bradshaw, Schneider, Dorrington, Bourne, and Laubscher, 2002). The SADHS showed that the previous downward trend in childhood mortality was reversed by the mid-1990s and Dorrington et al. (2001) showed that the age pattern of deaths of adults was shifting toward young adults in the late 1990s. The researchers concluded that the rise in mortality in young adults was largely from AIDS. Statistics South Africa, a government agency, had initially refuted the changing age pattern and then questioned whether the observed change could be attributed to AIDS alone. In a report released in December 2001, on the numbers of deaths for 1997 to 2000 (Statistics South Africa, 2001a), the agency also concludes that there has been a changing age pattern, with an increase in the number of young adult deaths. Statistics South Africa is currently undertaking a project to provide more updated cause of death information. However, it is clear that
South Africa is now experiencing a quadruple burden of disease: poverty-related diseases, chronic diseases, injuries, and AIDS.
The Actuarial Society of South Africa (2001) has developed a demographic model of the impact of the AIDS epidemic. The model incorporates estimates of population group differentials in mortality in 1985 (Bradshaw et al., 1992; Dorrington, Bradshaw, and Wegner, 1999) and the projected trend for the whole population (Dorrington et al., 2001). Assuming no anti-AIDS treatment interventions and calibrated to match the levels of HIV observed among pregnant women attending antenatal services in the public sector during the 1990s, the model is used to project a possible trend in premature adult mortality (45Q15) (see Figure 19-2). There is considerable
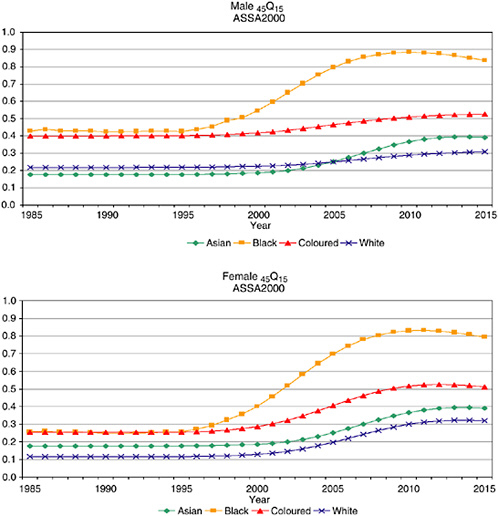
FIGURE 19-2 Projected trends in adult mortality, 45Q15, based on ASSA2000.
SOURCE: Actuarial Society of South Africa (2001).
evidence that the epidemic is having its greatest toll on Africans, but there is less certainty about the extent of the impact on other population groups. The projections are merely a best estimate and should be considered for illustrative purposes only. It should be noted that period estimates exaggerate the effect of AIDS mortality by cumulating the age-specific death rates, all at their highest levels. In reality, an individual is exposed to changing levels of mortality. While cohort estimates would reflect an individual’s risk more accurately, it is nonetheless standard to use period estimates of life expectancy and mortality.
INVESTIGATING DISPARITIES IN THE HEALTH OF OLDER SOUTH AFRICANS
Clearly, the South African setting provides extensive scope for investigating racial disparities in the health and health determinants in aging. Data from 1985 show that the mortality for white South Africans 45 years and older was lower than that experienced by African and coloured South Africans (Figure 19-3). The mortality for Asian South Africans was between the groups with high levels of mortality in the oldest ages. The age-specific death rates and the ratios relative to white South Africans are shown for people aged 45 years and older in Table 19-1.
Unfortunately the data limitations severely restrict the opportunities to assess whether these differentials in mortality persist today and whether they can be attributed to differences in socioeconomic conditions. Analysis of the trends in the more recent mortality data suggests that the all-cause mortality in the elderly has not changed (Dorrington et al., 2001), but there is no information on population group differentials. However, making use of two new sources of data, this study aims to investigate population group differences in the cause of death profile among older South Africans and selected adult health indicators for a broader age range. The health indicators are explored for all adults because the sample size is more robust than that for older South Africans and they may reflect trends that extend to the elderly.
Toward the end of 1998, an evaluation of the new death notification form that reintroduced the collection of population group information was conducted by the National Health System of South Africa (NHISS/SA) Technical Committee on Vital Registration and described by Kielkowski et al. (2001). Although the study was designed to provide a nationally representative sample of deaths, the sampling procedures were not followed because of logistical constraints. The realized sample of 16,230 death forms spans the whole country, but because some provinces are overrepresented, the sample cannot be considered nationally representative. Although rates cannot be calculated from these data, by assuming that the bias is independent of the population group of the deceased, the data set can be used as a
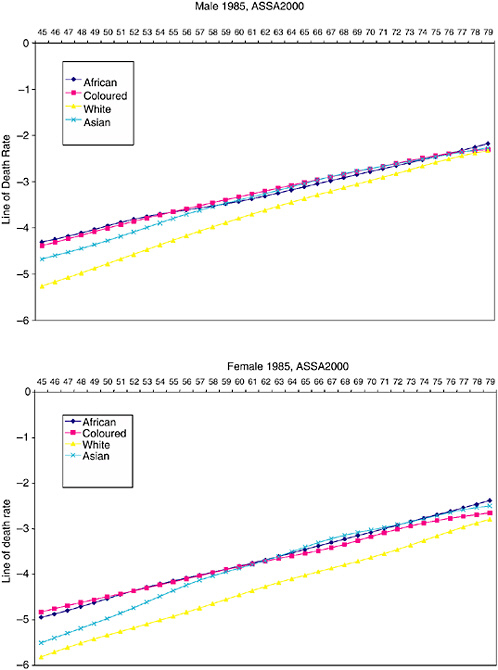
TABLE 19-1 Death Rates per 100,000 by Population Group and Death Rate Ratios Relative to White South Africans, 1985, Based on ASSA 2000
|
Panel A: Death Rates Per 100,000 |
||||
|
MALE |
||||
|
Age Group |
African |
Coloured |
White |
Asian |
|
45-49 |
7,481 |
7,076 |
3,128 |
5,347 |
|
50-54 |
10,527 |
10,138 |
5,112 |
10,728 |
|
55-59 |
13,357 |
13,968 |
8,281 |
13,556 |
|
60-64 |
17,072 |
18,772 |
12,783 |
17,430 |
|
65-69 |
23,055 |
24,758 |
18,719 |
23,589 |
|
70-74 |
30,622 |
31,932 |
26,466 |
31,331 |
|
75-79 |
40,523 |
39,040 |
36,457 |
41,619 |
|
FEMALE |
||||
|
Age group |
African |
Coloured |
White |
Asian |
|
45-49 |
4,095 |
4,520 |
1,823 |
2,507 |
|
50-54 |
6,200 |
6,217 |
2,807 |
6,277 |
|
55-59 |
8,686 |
8,576 |
4,318 |
8,808 |
|
60-64 |
12,027 |
11,644 |
6,812 |
12,329 |
|
65-69 |
17,166 |
15,534 |
10,065 |
17,722 |
|
70-74 |
24,272 |
22,276 |
14,985 |
25,043 |
|
75-79 |
33,927 |
28,593 |
23,319 |
35,734 |
|
Panel B: Death Rate Ratios Compared to White South Africans |
||||
|
MALE |
||||
|
Age Group |
African |
Coloured |
White |
Asian |
|
45-49 |
2.39 |
2.26 |
1.00 |
1.71 |
|
50-54 |
2.06 |
1.98 |
1.00 |
2.10 |
|
55-59 |
1.61 |
1.69 |
1.00 |
1.64 |
|
60-64 |
1.34 |
1.47 |
1.00 |
1.36 |
|
65-69 |
1.23 |
1.32 |
1.00 |
1.26 |
|
70-74 |
1.16 |
1.21 |
1.00 |
1.18 |
|
75-79 |
1.11 |
1.07 |
1.00 |
1.14 |
|
FEMALE |
||||
|
Age Group |
African |
Coloured |
White |
Asian |
|
45-49 |
2.25 |
2.48 |
1.00 |
1.38 |
|
50-54 |
2.21 |
2.22 |
1.00 |
2.24 |
|
55-59 |
2.01 |
1.99 |
1.00 |
2.04 |
|
60-64 |
1.77 |
1.71 |
1.00 |
1.81 |
|
65-69 |
1.71 |
1.54 |
1.00 |
1.76 |
|
70-74 |
1.62 |
1.49 |
1.00 |
1.67 |
|
75-79 |
1.45 |
1.23 |
1.00 |
1.53 |
|
SOURCE: Actuarial Society of South Africa (2001). |
||||
case-control study to explore relative differences in the risk of death from a particular cause among people aged 45 and older. This has been done using a logistics regression to estimate the age-adjusted odds ratio and the 95 percent confidence interval for broad categories of cause of death for exploratory purposes. The profile of the causes of death for each population group is presented. Given the hugely different age patterns of the population groups, the proportions of the cause of death for each population group have been weighted to represent the average age distribution of all the deaths in the sample. Thus if the profile of causes differs merely because of the underlying age pattern, the weighted proportions will remove this effect. A fairly large proportion of the sample (77.8 percent) had population group specified, but the remainder (22.2 percent) had no details and could not be included in this analysis.
The second important data source is that of the adult health questionnaire in the South African Demographic and Health Survey conducted in 1998. Selected data will be analyzed in an attempt to sort out the relationships between health and population group, socioeconomic status, urban/ rural residence, and education level. The survey did not include a full clinical assessment, but rather had selected indicators that could be measured by lay interviewers after special training. These included the measurement of peak flow, an indicator of respiratory pathology, and hypertension, a risk factor involved in the development of cardiovascular and other chronic diseases. The questionnaire focused, although not exclusively, on chronic respiratory conditions and diseases of lifestyle. For this analysis, the following health outcomes representing the spectrum of conditions in the health transition will be included:
-
Peak flow, an objective measure that provides an indicator of respiratory disease (acute and chronic);
-
Hypertension, an objective measure of a risk factor for chronic diseases;
-
Ever had tuberculosis (TB) (self-reported), a common poverty-related disease;
-
Smoking, a risky lifestyle and determinant of future burden in adult health (self-reported); and
-
Incidence of injury (self-reported), any type of injury that was treated by a doctor or nurse during the previous 30 days.
An asset index for the sample has been developed using factor analysis based on living conditions and selected household assets (Booysen, 2001). This has been used to rank the households into poverty-related quintiles. In addition, the education level and the urban/rural residence are investigated. Some of these analyses have been presented elsewhere (Norman, Bradshaw,
and Steyn, 2001; Steyn, Gaziano, Bradshaw, Laubscher, and Fourie, 2001), but not focusing on population group differences.
Logistic regression analysis was used to calculate adjusted odds ratios (ORs) and 95 percent confidence intervals (95 percent CIs) for males and females separately. The survey set option was used in the STATA statistical package (STATA Corporation, 1999) to take into account the complex sampling design that involved two-stage cluster sampling. A main effects regression model was used to assess the relationship with the mean peak flow, standardized for age, height, and weight (Department of Health, Medical Research Council, and Macro International, 2002). A multinomial logistic regression was used to calculate the relative risk ratios (RRs) and 95 percent CIs for light and heavy smoking compared with no smoking.
In the first instance, a model including only population group and age was fitted to obtain age-adjusted comparison between the population groups (Model I). This was followed by fitting a model that included the asset index quintiles, education, and urban/rural residence in addition to age and population group in order to investigate the independent effects of these factors (Model II). Membership of a medical aid (private health care insurance) was included in the models for self-reported injuries to allow for access to medical care.
CAUSE OF DEATH AMONG PEOPLE AGED 45 YEARS AND OLDER
In the 1998-1999 sample of deaths, there were 8,647 over the age of 45 years. The majority of the deaths in this age range were African (49 percent) while 15 percent were white, 12 percent were coloured, and 1 percent were Asian. Because there were only 109 deaths among Asians (over the age of 45), this group was excluded from the analysis. In this age range, there were more male (54 percent) than female (46 percent) deaths, reflecting the higher male mortality rates.
The profiles of the underlying cause of death for the sample are shown in Figure 19-4 by population group and gender. Although weighted for age to match the overall age distribution of the deaths, it must be reiterated that the sample cannot be considered nationally representative. The age-adjusted ORs of dying from a selected cause, comparing the white and coloured with Africans, are shown in Table 19-2, separately for males and females.
These ORs give an indication of the differences in the profiles, but not the absolute levels of mortality. It can be seen that the ill-defined causes of death have a higher proportion among the Africans than the white and coloured South Africans. (Ill-defined causes of death arise when the death is known to be from natural causes, but information about the conditions resulting in death is insufficient.)
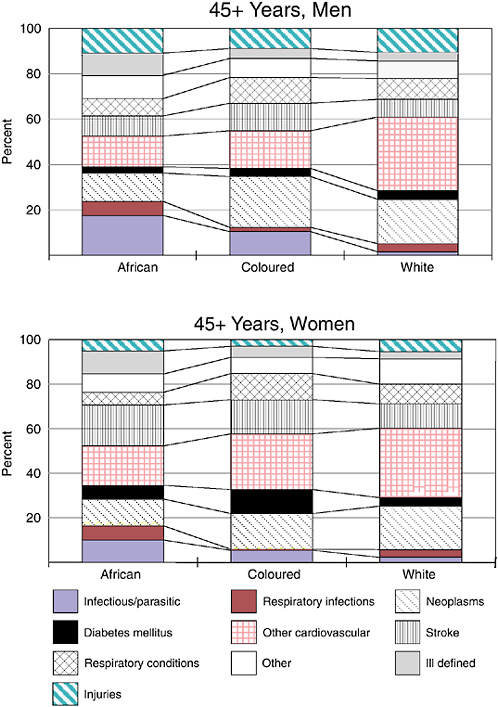
TABLE 19-2 Age-Adjusted Odds Ratio* of Death from Specified Causes for 45 Years and Older by Gender, 1998-1999
In terms of profiles, it is clear that white South Africans were at much lower risk of dying from infectious diseases, such as diarrhea and TB, and respiratory infectious diseases, such as pneumonia, while they were at higher risk of dying from ischemic heart diseases, cancers, and diabetes than Africans. The risk of dying from stroke was significantly lower among white women than African women. When compared to Africans, the risk profile for coloured South Africans was similar to that of whites. In addition, compared with African women, the coloured women had a much higher risk of respiratory conditions such as asthma and chronic bronchitis. The relative risk of injury death was higher among whites, but this was not statistically significant.
RELATIONSHIP OF POPULATION GROUP AND SELECTED ADULT HEALTH INDICATORS
The 1998 Demographic and Health Survey has been analyzed to investigate the relationship between health and population group, having adjusted for socioeconomic variables. Figure 19-5 shows the mean difference in standardized peak flow for each population group relative to Africans, using Model I, which adjusts for age only, followed by Model II, which adjusts for the other socioeconomic variables as well as age. The approximate 95 percent CIs for the mean effect shown on the graph and the differences that are statistically significant are indicated with an asterisk. The standardized peak flow is in the form of a Z-score of the relative difference from the expected value for a given age, height, weight, and sex.
Figure 19-5 shows that the mean peak flow for white men is significantly higher than that for African men even after socioeconomic factors are taken into account. The peak flow for white women is significantly higher than that for African women, but this is not significant once the socioeconomic factors are taken into account. Figure 19-5 also shows that the mean peak flow for Asian women is significantly lower than that for African women, even after socioeconomic factors are taken into account. In the SADHS report (Department of Health, Medical Research Council, and Macro International, 2002), it is noted that there is a bias in the data, affecting the low peak flow readings. Measuring peak flow requires that the respondent be coached to blow with full effort. In an attempt to obtain accurate readings, the highest of three attempts is used. The fieldwork instructions required that respondents with a peak flow of less than 200ml be referred to the nearest clinic for examination. Analysis of the data revealed an unexpected concentration of observations just above 200ml. This could have arisen through misreporting of values by fieldworkers to avoid having to write a referral letter for the respondent concerned. Alternatively, this could have arisen through the fieldworker giving more encouragement
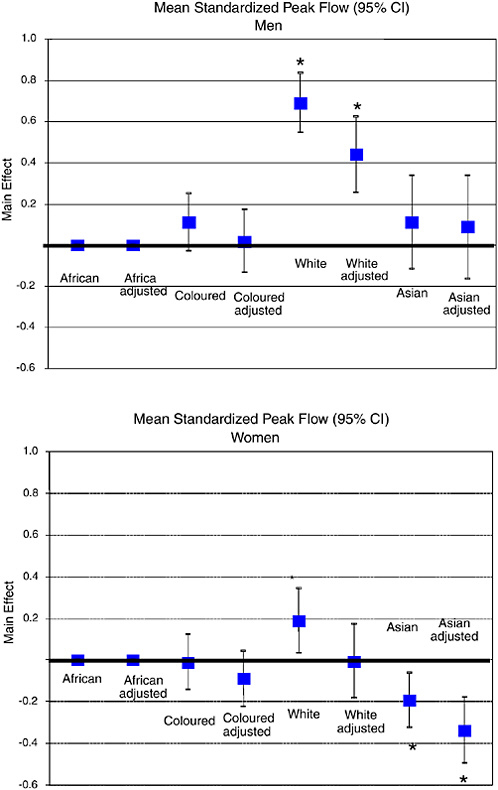
to the respondent when the readings were low compared to higher readings. Because women generally have a smaller physique than men and consequently have lower peak flow, the impact of this bias has a greater effect on the data for women.
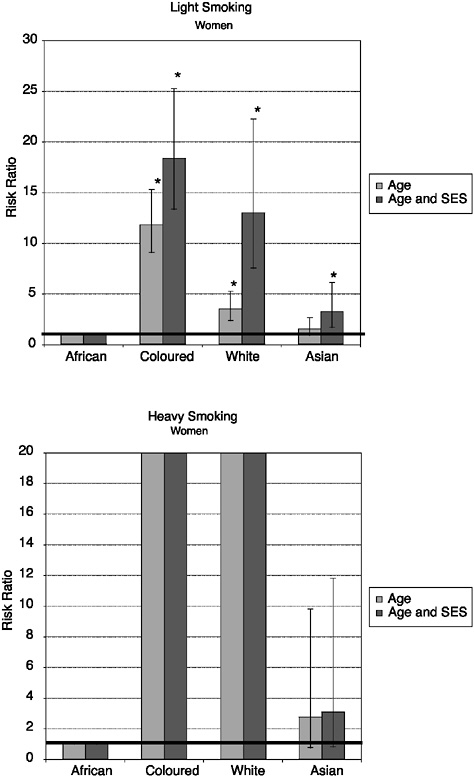
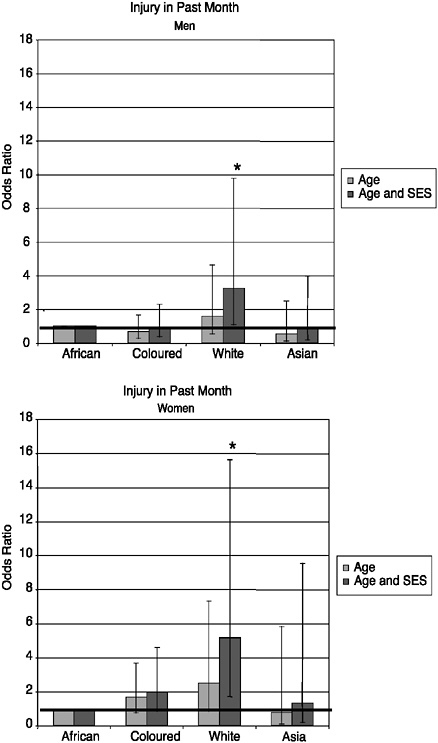
Figures 19-6 through 19-9 show the adjusted odds ratios of the outcome for each population group relative to the African group using Model I and Model II. The first odds ratio is adjusted for age only, while the second odds ratio is adjusted for the other socioeconomic factors as well. The confidence intervals for the odds ratios are displayed on the figures and those that are statistically significantly different are indicated with an asterisk. Full details of the analyses are shown in Tables 19-3a through 19-5.
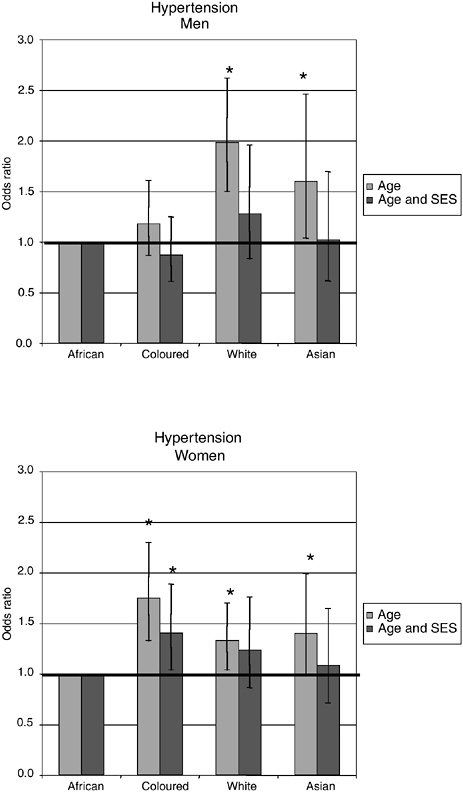
Hypertension is significantly higher among white and Asian men compared with African men using Model I, but the differences are not significant when adjusted for socioeconomic factors using Model II (Figure 19-6). The prevalence of hypertension is significantly higher among coloured and white women, but remains significant, even after adjusting for socioeconomic factors, only for the coloured women.
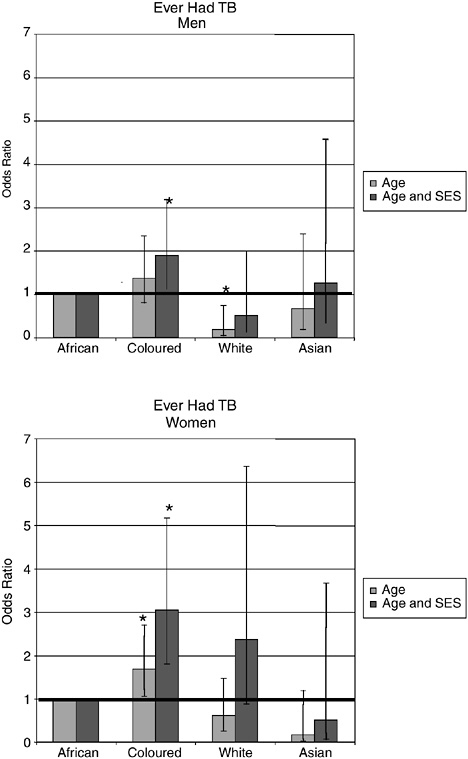
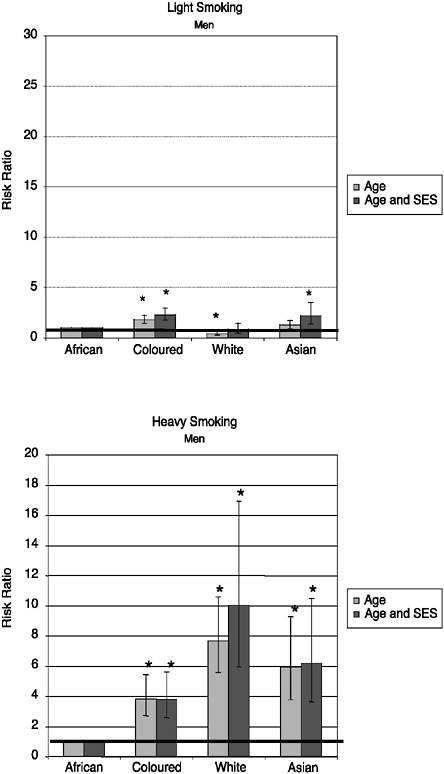
The results based on the self-reported information about ever having had TB diagnosed by a doctor or a nurse are shown in Figure 19-7. These suggest that white and Asian South Africans have been protected from having this disease, but when the other socioeconomic factors are taken into account, they are not significantly different. Coloured men and women had significantly higher prevalence of TB once the socioeconomic factors had been taken into account. Figure 19-8 shows that for heavy smoking, African men smoke significantly less than coloured, white, or Asian men, regardless of socioeconomic variables. African women smoke significantly less than women in the white and coloured population groups, and this population group difference is particularly marked with heavy smoking. For light smoking, no significant differences were observed between white men and African men after adjusting for socioeconomic status, but coloured and Asian men had significantly higher levels of light smoking than African men in the fully adjusted model. As Figure 19-9 indicates, self-reported incidence of injury in the previous month was significantly higher among white men and women once socioeconomic factors were considered.
DISCUSSION
This study is based on secondary analysis of data sets that were not specifically designed to answer questions regarding the health of the elderly, and the analyses have several limitations. The mortality data have the problem that the underlying cause of death was not known in a proportion of the deaths, and this varied according to population group (highest proportion among Africans). Furthermore, the lack of current mortality rates
TABLE 19-3a Racial Disparities in Mean Peak Flow Among Men, SADHS 1998
|
Demographic Variables |
P-Value Model |
Estimate |
Standard Error |
P-Value Estimate |
Design Effect |
|
Model I (R-square = 0.0339) |
|||||
|
Intercept |
0.0018 |
–0.0110 |
0.0357 |
0.7588 |
1.75 |
|
Population group |
<0.0001 |
|
|||
|
African |
|
0.0000 |
|
||
|
Coloured |
0.1079 |
0.0718 |
0.1331 |
2.26 |
|
|
White |
0.6896 |
0.0735 |
<0.0001 |
2.10 |
|
|
Asian |
0.1095 |
0.1156 |
0.3448 |
1.91 |
|
|
Age |
0.0018 |
|
|||
|
15-24 |
|
0.0000 |
|
||
|
25-34 |
–0.0725 |
0.0498 |
0.1458 |
1.36 |
|
|
35-44 |
–0.1845 |
0.0553 |
0.0009 |
1.56 |
|
|
45-54 |
–0.1492 |
0.0691 |
0.0310 |
1.87 |
|
|
55-64 |
–0.2257 |
0.0810 |
0.0054 |
2.05 |
|
|
65+ |
–0.1993 |
0.0722 |
0.0059 |
1.56 |
|
|
Model II (R-square = 0.0484) |
|||||
|
Intercept |
0.9292 |
–0.0468 |
0.1053 |
0.6566 |
1.80 |
|
Population group |
<0.0001 |
|
|||
|
African |
|
0.0000 |
|
||
|
Coloured |
0.0176 |
0.0775 |
0.8208 |
2.18 |
|
|
White |
0.4385 |
0.0928 |
<0.0001 |
1.96 |
|
|
Asian |
0.0868 |
0.1279 |
0.4974 |
1.99 |
|
|
Age |
0.0404 |
|
|||
|
15-24 |
|
0.0000 |
|
||
|
25-34 |
–0.0909 |
0.0501 |
0.0701 |
1.37 |
|
|
35-44 |
–0.1731 |
0.0545 |
0.0016 |
1.49 |
|
|
45-54 |
–0.1040 |
0.0702 |
0.1385 |
1.81 |
|
|
55-64 |
–0.1577 |
0.0855 |
0.0655 |
2.07 |
|
|
65+ |
–0.1085 |
0.0814 |
0.1827 |
1.68 |
|
|
Asset index (quintiles) |
0.4220 |
|
|||
|
Poorest group |
|
0.0000 |
|
||
|
Second poorest |
–0.0419 |
0.0643 |
0.5149 |
1.32 |
|
|
Middle group |
0.0491 |
0.0692 |
0.4787 |
1.47 |
|
|
Fourth poorest |
0.0491 |
0.0849 |
0.5627 |
1.83 |
|
|
Richest group |
0.1250 |
0.0916 |
0.1728 |
1.57 |
|
|
Education |
<0.0001 |
|
|||
|
None |
|
0.0000 |
|
||
|
1-7 years |
–0.0551 |
0.0741 |
0.4570 |
1.61 |
|
|
8-12 years |
0.1018 |
0.0764 |
0.1835 |
1.62 |
|
|
>12 years |
0.3075 |
0.1006 |
0.0023 |
1.49 |
|
|
Geographic setting |
0.0342 |
|
|||
|
Urban |
|
0.0000 |
|
||
|
Rural |
–0.1207 |
0.0567 |
0.0342 |
2.13 |
|
|
SOURCE: Norman et al. (2001). |
|||||
TABLE 19-3b Racial Disparities in Mean Peak Flow Among Women, SADHS 1998
|
Demographic Variables |
P-Value Model |
Estimate |
Standard Error |
P-Value Estimate |
Design Effect |
|
Model I (R-square = 0.0044) |
|||||
|
Intercept |
0.0236 |
–0.0030 |
0.0326 |
0.9275 |
1.59 |
|
Population group |
0.0018 |
|
|||
|
African |
|
0.0000 |
|
||
|
Coloured |
–0.0127 |
0.0679 |
0.8511 |
2.37 |
|
|
White |
0.1885 |
0.0792 |
0.0176 |
2.92 |
|
|
Asian |
–0.1952 |
0.0668 |
0.0035 |
0.89 |
|
|
Age |
0.0018 |
|
|||
|
15-24 |
|
0.0000 |
|
||
|
25-34 |
–0.0231 |
0.0448 |
0.6062 |
1.36 |
|
|
35-44 |
–0.0566 |
0.0481 |
0.2399 |
1.42 |
|
|
45-54 |
–0.1185 |
0.0557 |
0.0337 |
1.61 |
|
|
55-64 |
–0.1038 |
0.0557 |
0.0624 |
1.41 |
|
|
65+ |
–0.0697 |
0.0556 |
0.2871 |
1.83 |
|
|
Model II (R-square = 0.0162) |
|||||
|
Intercept |
<0.0001 |
–0.0858 |
0.0830 |
0.3017 |
1.66 |
|
Population group |
0.0002 |
|
|||
|
African |
|
0.0000 |
|
||
|
Coloured |
–0.0908 |
0.0671 |
0.1764 |
1.92 |
|
|
White |
–0.0062 |
0.0910 |
0.9460 |
2.29 |
|
|
Asian |
–0.3378 |
0.0799 |
<0.0001 |
1.05 |
|
|
Age |
0.8073 |
|
|||
|
15-24 |
|
0.0000 |
|
||
|
25-34 |
–0.0187 |
0.0450 |
0.6779 |
1.35 |
|
|
35-44 |
–0.0191 |
0.0498 |
0.7007 |
1.44 |
|
|
45-54 |
–0.0533 |
0.0588 |
0.3651 |
1.61 |
|
|
55-64 |
–0.0030 |
0.0626 |
0.9619 |
1.54 |
|
|
65+ |
0.0591 |
0.0740 |
0.4250 |
1.92 |
|
|
Asset index (quintiles) |
0.8556 |
|
|||
|
Poorest group |
|
0.0000 |
|
||
|
Second poorest |
–0.0063 |
0.0480 |
0.8957 |
1.06 |
|
|
Middle group |
0.0188 |
0.0535 |
0.7258 |
1.23 |
|
|
Fourth poorest |
–0.0356 |
0.0785 |
0.6507 |
2.06 |
|
|
Richest group |
0.0261 |
0.0842 |
0.7564 |
1.75 |
|
|
Education |
0.011 |
|
|||
|
None |
|
0.0000 |
|
||
|
1-7 years |
0.0700 |
0.0552 |
0.2055 |
1.54 |
|
|
8-12 years |
0.2012 |
0.0663 |
0.0025 |
1.98 |
|
|
>12 years |
0.3058 |
0.0914 |
0.0009 |
1.57 |
|
|
Geographic setting |
0.0021 |
|
|||
|
Urban |
|
0.0000 |
|
||
|
Rural |
–0.1821 |
0.0589 |
0.0021 |
2.82 |
|
|
SOURCE: Norman et al. (2001). |
|||||
TABLE 19-3c Racial Disparities in Hypertension (BP≥160/95 mmHg ± antihypertensive medication), SADHS 1998
|
|
Men: Hypertensives = 704 Normatensives = 5,049 |
Women: Hypertensives = 1,280 Normatensives = 6,793 |
||
|
Sociodemographic Characteristics |
Odds Ratio |
95% CI |
Odds Ratio |
95% CI |
|
Model I |
||||
|
Population group |
||||
|
African |
1.00 |
— |
1.00 |
— |
|
Coloured |
1.18 |
0.87-1.61 |
1.75 |
1.33- 2.30 |
|
White |
1.98 |
1.50-2.62 |
1.33 |
1.04- 1.70 |
|
Asian |
1.60 |
1.04-2.46 |
1.40 |
0.99- 1.99 |
|
Age |
||||
|
15-24 |
1.00 |
— |
1.00 |
— |
|
25-34 |
2.76 |
1.67- 4.56 |
3.29 |
2.10- 5.14 |
|
35-44 |
7.53 |
4.65-12.18 |
8.20 |
5.34-12.60 |
|
45-54 |
18.09 |
11.35-28.87 |
21.20 |
13.89-32.35 |
|
55-64 |
20.08 |
12.54-32.17 |
35.80 |
23.48-54.60 |
|
65+ |
29.90 |
18.45-48.45 |
43.00 |
28.58-64.70 |
|
Model II |
||||
|
Population group |
||||
|
African |
1.00 |
— |
1.00 |
— |
|
Coloured |
0.87 |
0.61- 1.25 |
1.40 |
1.04- 1.89 |
|
White |
1.28 |
0.84- 1.96 |
1.23 |
0.87- 1.76 |
|
Asian |
1.02 |
0.62- 1.70 |
1.08 |
0.71- 1.65 |
|
Age |
||||
|
15-24 |
1.00 |
— |
1.00 |
— |
|
25-34 |
2.79 |
1.69- 4.61 |
3.41 |
2.16- 5.38 |
|
35-44 |
7.98 |
4.94-12.87 |
8.26 |
5.31-12.83 |
|
45-54 |
19.21 |
12.00-30.75 |
22.26 |
14.31-34.62 |
|
55-64 |
21.10 |
13.08-34.02 |
39.62 |
25.12-62.51 |
|
65+ |
32.74 |
19.91-53.86 |
48.27 |
30.72-75.85 |
|
Asset index (quintiles) |
||||
|
Poorest group |
1.00 |
— |
1.00 |
— |
|
Second poorest |
1.14 |
0.78- 1.68 |
1.00 |
0.74- 1.35 |
|
Middle group |
1.11 |
0.75- 1.67 |
1.00 |
0.73- 1.36 |
|
Fourth poorest |
1.77 |
1.15- 2.73 |
1.33 |
0.94- 1.87 |
|
Richest group |
2.20 |
1.35- 3.59 |
1.13 |
0.75- 1.72 |
|
Education |
||||
|
None |
1.00 |
— |
1.00 |
— |
|
1-7 years |
0.99 |
0.70- 1.39 |
1.19 |
0.94- 1.50 |
|
8-12 years |
1.19 |
0.84- 1.68 |
1.11 |
0.84- 1.46 |
|
> 12 years |
0.75 |
0.43- 1.31 |
0.58 |
0.36- 0.92 |
|
Geographic setting |
||||
|
Urban |
1.00 |
— |
1.00 |
— |
|
Rural |
1.06 |
0.82- 1.37 |
0.63 |
0.50- 0.80 |
|
SOURCE: Norman et al. (2001). |
||||
TABLE 19-3d Racial Disparities in “Ever Had TB,” SADHS 1998
|
|
Men: Ever Had TB = 188 Not Had TB = 5,539 |
Women: Ever Had TB = 196 Not Had TB = 7,848 |
||
|
Sociodemographic Characteristics |
Odds Ratio |
95% CI |
Odds Ratio |
95% CI |
|
Model I |
||||
|
Population group |
||||
|
African |
1.00 |
— |
1.00 |
— |
|
Coloured |
1.37 |
0.80- 2.34 |
1.69 |
1.05-2.70 |
|
White |
0.19 |
0.05- 0.74 |
0.61 |
0.25-1.47 |
|
Asian |
0.67 |
0.18- 2.40 |
0.17 |
0.02-1.19 |
|
Age |
||||
|
15-24 |
1.00 |
— |
1.00 |
— |
|
25-34 |
3.10 |
1.54- 6.26 |
1.40 |
0.77-2.55 |
|
35-44 |
5.40 |
2.72-10.72 |
1.64 |
0.91-2.92 |
|
45-54 |
7.48 |
3.72-15.02 |
2.12 |
1.18-3.80 |
|
55-64 |
5.61 |
2.62-12.00 |
1.84 |
1.02-3.31 |
|
65+ years |
7.02 |
3.48-14.18 |
2.59 |
1.43-4.65 |
|
Model II |
||||
|
Population group |
||||
|
African |
1.00 |
— |
1.00 |
— |
|
Coloured |
1.89 |
1.13- 3.18 |
3.05 |
1.80-5.17 |
|
White |
0.50 |
0.13- 1.99 |
2.36 |
0.88-6.36 |
|
Asian |
1.25 |
3.42- 4.56 |
0.51 |
0.07-3.67 |
|
Age |
||||
|
15-24 |
1.00 |
— |
1.00 |
— |
|
25-34 |
3.12 |
1.54- 6.30 |
1.45 |
0.79-2.67 |
|
35-44 |
5.14 |
2.52-10.49 |
1.67 |
0.92-3.04 |
|
45-54 |
6.57 |
3.12-13.83 |
2.11 |
1.15-3.86 |
|
55-64 |
4.27 |
1.89- 9.40 |
1.74 |
0.94-3.24 |
|
65+ |
5.59 |
2.56-12.21 |
2.36 |
1.19-4.66 |
|
Asset index (quintiles) |
||||
|
Poorest group |
1.00 |
— |
1.00 |
— |
|
Second poorest |
0.82 |
0.43- 1.56 |
0.53 |
0.33-0.83 |
|
Middle group |
0.50 |
0.30- 0.84 |
0.43 |
0.26-0.71 |
|
Fourth poorest |
056 |
0.28- 1.12 |
0.39 |
0.20-0.74 |
|
Richest group |
0.38 |
0.17- 0.83 |
0.16 |
0.07-0.36 |
|
Education |
||||
|
None |
1.00 |
— |
1.00 |
— |
|
1-7 years |
0.96 |
0.62- 1.49 |
1.35 |
0.85-2.15 |
|
8-12 years |
0.70 |
0.40- 1.22 |
1.03 |
0.60-1.78 |
|
> 12 years |
0.14 |
0.03- 0.64 |
0.59 |
0.15-2.30 |
|
Geographic setting |
||||
|
Urban |
1.00 |
— |
1.00 |
— |
|
Rural |
0.80 |
0.47- 1.39 |
1.07 |
0.68-1.68 |
|
SOURCE: Norman et al. (2001). |
||||
TABLE 19-4a Racial Disparities in Light Smoking (1-14 tobacco equivalents*/day), SADHS 1998
|
|
Men: Light Smokers = 2,051 Nonsmokers = 2,678 |
Women: Light Smokers = 780 Nonsmokers = 6,276 |
||
|
Sociodemographic Characteristics |
Odds Ratio |
95% CI |
Odds Ratio |
95% CI |
|
Model I |
||||
|
Population group |
||||
|
African |
1.00 |
— |
1.00 |
— |
|
Coloured |
1.80 |
1.46-2.22 |
11.77 |
9.08-14.26 |
|
White |
0.41 |
0.46-0.67 |
3.50 |
2.33- 5.25 |
|
Asian |
1.30 |
0.88-1.93 |
1.52 |
0.88- 2.61 |
|
Age |
||||
|
15-24 |
1.00 |
— |
1.00 |
— |
|
25-34 |
3.70 |
3.01-4.55 |
1.66 |
1.15- 2.37 |
|
35-44 |
4.92 |
3.94-6.14 |
3.31 |
2.30- 4.76 |
|
45-54 |
3.14 |
2.41-4.10 |
3.63 |
2.50- 5.27 |
|
55-64 |
3.68 |
2.78-4.85 |
1.97 |
1.29- 3.00 |
|
65+ |
3.30 |
2.50-4.34 |
1.72 |
1.11- 2.64 |
|
Model II |
||||
|
Population group |
||||
|
African |
1.00 |
— |
1.00 |
— |
|
Coloured |
2.28 |
1.75-2.97 |
18.34 |
13.34-25.23 |
|
White |
0.84 |
0.48-1.45 |
12.96 |
7.55-22.24 |
|
Asian |
2.19 |
1.38-3.49 |
3.20 |
1.68- 6.11 |
|
Age |
||||
|
15-24 |
1.00 |
— |
1.00 |
— |
|
25-34 |
3.84 |
3.11-4.75 |
1.47 |
1.01- 2.13 |
|
35-44 |
4.94 |
3.92-6.21 |
2.61 |
1.79- 3.80 |
|
45-54 |
2.91 |
2.19-3.87 |
2.54 |
1.71- 3.78 |
|
55-64 |
3.16 |
2.36-4.24 |
1.22 |
0.77- 1.95 |
|
65+ |
2.76 |
2.04-3.73 |
0.96 |
0.59- 1.56 |
|
Asset index (quintiles) |
||||
|
Poorest group |
1.00 |
— |
1.00 |
— |
|
Second poorest |
0.77 |
0.60-0.98 |
0.88 |
0.59- 1.32 |
|
Middle group |
0.57 |
0.44-0.73 |
0.99 |
0.65- 1.50 |
|
Fourth poorest |
0.61 |
0.46-0.82 |
0.72 |
0.44- 1.17 |
|
Richest group |
0.37 |
0.25-0.54 |
0.39 |
0.22- 0.71 |
|
Education |
||||
|
None |
1.00 |
— |
1.00 |
— |
|
1-7 years |
0.88 |
0.68-1.13 |
0.65 |
0.48- 0.89 |
|
8-12 years |
0.73 |
0.56-0.95 |
0.26 |
0.17- 0.38 |
|
> 12 years |
0.35 |
0.23-0.54 |
0.16 |
0.09- 0.31 |
|
Geographic setting |
||||
|
Urban |
1.00 |
— |
1.00 |
— |
|
Rural |
0.72 |
0.59-0.87 |
0.53 |
0.36- 0.77 |
|
SOURCE: Norman et al. (2001). |
||||
TABLE 19-4b Racial Disparities in Heavy Smoking (≥ 15 tobacco equivalents*/day), SADHS 1998
|
|
Men: Heavy Smokers = 477 Normatensives = 2,678 |
Women: Heavy Smokers = 153 Normatensives = 6,276 |
||||
|
Sociodemographic Characteristics |
Odds Ratio |
95% CI |
Odds Ratio |
95% CI |
||
|
Model I |
||||||
|
Population group |
||||||
|
African |
1.00 |
— |
1.00 |
— |
||
|
Coloured |
3.84 |
2.71- 5.43 |
49.67 |
25.02- 98.61 |
||
|
White |
7.68 |
5.57-10.58 |
86.17 |
41.54-178.78 |
||
|
Asian |
5.93 |
3.79- 9.28 |
2.73 |
0.76- 9.79 |
||
|
Age |
||||||
|
15-24 |
1.00 |
— |
1.00 |
— |
||
|
25-34 |
5.44 |
3.64- 8.12 |
2.70 |
1.23- 5.91 |
||
|
35-44 |
6.89 |
4.57-10.39 |
4.78 |
2.34- 9.78 |
||
|
45-54 |
6.42 |
4.14- 9.94 |
3.39 |
1.53- 7.50 |
||
|
55-64 |
4.77 |
2.94- 7.75 |
3.27 |
1.52- 7.05 |
||
|
65+ |
4.48 |
2.68- 7.50 |
0.93 |
0.26- 3.31 |
||
|
Model II |
||||||
|
Population group |
||||||
|
African |
1.00 |
— |
1.00 |
— |
||
|
Coloured |
3.81 |
2.57- 5.61 |
49.32 |
21.59-112.67 |
||
|
White |
10.04 |
5.95-16.93 |
161.46 |
62.82-414.97 |
||
|
Asian |
6.17 |
3.64-10.48 |
3.09 |
0.81- 11.79 |
||
|
Age |
||||||
|
15-24 |
1.00 |
— |
1.00 |
— |
||
|
25-34 |
5.80 |
3.85- 8.76 |
2.71 |
1.22- 6.05 |
||
|
35-44 |
7.21 |
4.78-10.87 |
4.66 |
2.19- 9.92 |
||
|
45-54 |
6.33 |
4.07- 9.85 |
2.95 |
1.36- 6.41 |
||
|
55-64 |
4.57 |
2.71- 7.69 |
2.57 |
1.15- 5.75 |
||
|
65+ |
4.29 |
2.45- 7.54 |
0.68 |
0.19- 2.53 |
||
|
Asset index (quintiles) |
||||||
|
Poorest group |
1.00 |
— |
1.00 |
— |
||
|
Second poorest |
1.11 |
0.60- 2.06 |
0.48 |
0.11- 2.13 |
||
|
Middle group |
0.64 |
0.33- 1.21 |
0.73 |
0.18- 3.01 |
||
|
Fourth poorest |
0.86 |
0.45- 1.66 |
1.07 |
0.25- 4.54 |
||
|
Richest group |
0.79 |
0.38- 1.64 |
0.79 |
0.18- 3.55 |
||
|
Education |
||||||
|
None |
1.00 |
— |
1.00 |
— |
||
|
1-7 years |
0.99 |
0.62- 1.59 |
0.51 |
0.21- 1.27 |
||
|
8-12 years |
0.82 |
0.49- 1.36 |
0.26 |
0.10- 0.66 |
||
|
> 12 years |
0.42 |
0.20- 0.85 |
0.09 |
0.03- 0.27 |
||
|
Geographic setting |
||||||
|
Urban |
1.00 |
— |
1.00 |
— |
||
|
Rural |
0.62 |
0.42- 0.93 |
0.68 |
0.18- 2.55 |
||
|
SOURCE: Norman et al. (2001). |
||||||
TABLE 19-5 Racial Disparities in Self-Report Injury in Past Month, SADHS 1998
|
|
Men: Injured = 80 Not Injured = 5,673 |
Women: Injured = 95 Not Injured = 7,978 |
||
|
Sociodemographic Characteristics |
Odds Ratio |
95% CI |
Odds Ratio |
95% CI |
|
Model I |
||||
|
Population group |
||||
|
African |
1.00 |
— |
1.00 |
— |
|
Coloured |
0.69 |
0.28- 1.66 |
1.67 |
0.76- 3.67 |
|
White |
1.58 |
0.54- 4.63 |
2.49 |
0.85- 7.33 |
|
Asian |
0.53 |
0.11- 2.48 |
0.79 |
0.11- 5.82 |
|
Age |
||||
|
15-24 |
1.00 |
— |
1.00 |
— |
|
25-34 |
1.55 |
0.51- 4.71 |
0.76 |
0.33- 1.76 |
|
35-44 |
2.10 |
0.88- 5.02 |
0.90 |
0.51- 1.57 |
|
45-54 |
2.22 |
0.87- 5.66 |
1.07 |
0.58- 1.98 |
|
55-64 |
1.81 |
0.65- 5.03 |
0.79 |
0.30- 2.08 |
|
65+ |
0.97 |
0.24- 3.89 |
1.04 |
0.50- 2.17 |
|
Medical Aid |
||||
|
Yes |
1.00 |
|
1.00 |
|
|
No |
0.91 |
0.42- 2.00 |
0.96 |
0.43- 2.15 |
|
Model II |
||||
|
Population group |
||||
|
African |
1.00 |
— |
1.00 |
— |
|
Coloured |
0.92 |
0.37- 2.29 |
1.97 |
0.85- 4.58 |
|
White |
3.24 |
1.08- 9.78 |
5.17 |
1.71-15.64 |
|
Asian |
0.84 |
0.18- 3.96 |
1.33 |
0.18- 9.54 |
|
Age |
||||
|
15-24 |
1.00 |
— |
1.00 |
— |
|
25-34 |
1.56 |
0.53- 4.60 |
0.73 |
0.31- 1.70 |
|
35-44 |
2.31 |
0.96- 5.54 |
0.83 |
0.46- 1.51 |
|
45-54 |
2.71 |
0.99- 7.40 |
1.00 |
0.49- 2.05 |
|
55-64 |
2.36 |
0.73- 7.67 |
0.79 |
0.32- 1.98 |
|
65+ |
1.49 |
0.31- 7.02 |
1.02 |
0.43- 2.41 |
|
Medical aid |
||||
|
Yes |
1.00 |
|
1.00 |
|
|
No |
0.74 |
0.31- 1.76 |
0.82 |
0.35- 1.94 |
|
Asset index (quintiles) |
||||
|
Poorest group |
1.00 |
— |
1.00 |
— |
|
Second poorest |
1.12 |
0.35- 3.57 |
2.63 |
0.85- 8.13 |
|
Middle group |
0.69 |
0.20- 2.37 |
2.09 |
0.59- 7.44 |
|
Fourth poorest |
0.55 |
0.18- 1.64 |
1.62 |
0.44- 5.93 |
|
Richest group |
0.22 |
0.06- 0.81 |
0.63 |
0.16- 2.45 |
|
Education |
||||
|
None |
1.00 |
— |
1.00 |
— |
|
1-7 years |
2.89 |
0.86- 9.69 |
1.31 |
0.54- 3.16 |
|
8-12 years |
3.65 |
1.04-12.88 |
0.90 |
0.31- 2.63 |
|
> 12 years |
1.20 |
0.20- 7.07 |
0.75 |
0.16- 3.40 |
|
Geographic setting |
||||
|
Urban |
1.00 |
— |
1.00 |
— |
|
Rural |
0.40 |
0.18- 0.88 |
0.37 |
0.14- 0.99 |
|
SOURCE: Norman et al. (2001). |
||||
limits the analysis to a comparison of the cause of death patterns experienced by the population groups. The Demographic and Health Survey is a cross-sectional study with consequent limits on analyses. Nevertheless, the discussion attempts to consolidate the findings that have been observed through these exploratory analyses.
Whether the higher mortality of Africans and coloureds has persisted over the past 15 years is unclear. However, the current cause of death profile suggests that the population groups remain at different stages of the health transition with Africans affected more by the infectious diseases and coloured and white South Africans affected more by noncommunicable diseases. This pattern would tend to suggest that the differences in mortality rates have persisted.
The mean standardized peak flow for white men and women was significantly higher than for African men and women. This would be consistent with a lower mortality experienced by whites. The peak flow of the other population groups was not significantly different, with the exception of Asian women, who had a lower peak flow. This may result from the higher prevalence of underweight among this group of women, but also could be related to the upward bias observed in the lower peak flow values that occurred as a result of the fieldwork requirements. Although this upward bias did not affect large numbers of observations, it affected the results for women more than for men due to the smaller body size of women.
For peak flow, the difference between white and African men remained significant even after the socioeconomic factors were considered. However, for women, the difference between whites and Africans was no longer significant, while the difference with Asians was even greater. Without additional information from other studies, drawing conclusions is difficult.
The hypertension patterns are particularly interesting. Although the prevalence was lower among Africans, in general, this effect was removed when socioeconomic factors were taken into account. The exception is for coloured women, who had significantly higher prevalence than African women. This is likely to be associated with other determinants of hypertension; in particular, the somewhat higher use of alcohol among coloured women could play a role.
Cooper, Rotimi, and Ward (1999) note that although 25 percent of all Americans are hypertensive, 35 percent of black Americans have hypertension. Furthermore, the disease is particularly virulent for black Americans, accounting for 20 percent of their deaths—double the figure for whites in the United States. These authors suggest that in order to understand this phenomenon, conventional hypotheses concerning race should be abandoned. Instead, it should be acknowledged that hypertension arises through different pathways and involves complex interactions among external factors
and internal physiology. The external factors include diet and/or stress. Many Americans have known behavioral risk factors for hypertension, such as obesity, high salt intake, long-term psychological stress, alcohol abuse, and a sedentary lifestyle. The internal physiology includes biological systems that regulate blood pressure as well as the genes involved in controlling blood pressure. Genetic factors have been determined to account for 25 to 40 percent of the variability in blood pressure among people, and as many as 10 to 15 genes can play a role in this variation. In addition, the environmental influences necessary to result in the expression of these hypertension-causing traits are essential. An individual with a given mix of alleles may be susceptible to high blood pressure, but hypertension will only develop for these people when exposed to a specific setting.
Studying the African diaspora is invaluable for evaluating changing environmental and social effects on the expression of the disease in the African population. In Cooper, Rotimi, and Ward’s study (1999), the American and Jamaican blacks shared on average of 75 percent of their genetic heritage with the Nigerians, the other participating group. The investigators found that the incidence of hypertension drops dramatically from America across the Atlantic to Africa. The greatest difference was between urban African Americans (33 percent) and rural Nigerians (7 percent), and Jamaicans were in between at 26 percent.
Cooper et al. (1999) suggest that race does not explain why hypertension is so high in African Americans. Race is not the underlying cause. Instead, racial designation is but a proxy measure for other variables such as socioeconomic status. The findings in our study would tend to confirm their observations that race is not a determinant of hypertension. However, in South Africa, hypertension is associated with increasing socioeconomic status, while in the United States, hypertension appears to be associated with disadvantage. This can be explained by the fact that socioeconomic status has been used on a relative scale within each country. The average gross domestic product, an indicator of economic wealth, in the United States is somewhat higher than the average in South Africa. In 2000 it was PPP $34,142 in the United States compared with PPP $9,401 in South Africa (United Nations Development Programme, 2002). Furthermore, the range and distribution of socioeconomic conditions differ enormously between these countries.
Popkin (2001) has developed a model of the nutrition transition of societies in different stages of development. Starting with a pattern based on hunting and gathering (collecting food) and moving into a deficient diet (famine), passing through an adequate diet (receding famine) and moving into a stage of overnutrition (nutrition-related noncommunicable disease), the final stage is one of a “healthy alternative” (behavioral change). The determinants of this transition also affect other lifestyles that would be
related to hypertension, such as physical activity and alcohol use. The contrasting relationships between hypertension and socioeconomic status seen in South Africa and the United States can be explained in terms of the Popkin model that South Africa is in an earlier stage of development than the United States.
The differences in tobacco smoking in South Africa persist even after socioeconomic factors have been taken into account, suggesting that cultural factors also play a role in determining smoking patterns in South Africa. This highlights the complexities of an investigation into racial disparities in health where race is not only a proxy measure of socioeconomic status, but includes a cultural/ethnic dimension.
The findings regarding injuries are difficult to interpret. The higher incidence of self-reported injury observed among the white South Africans in the Demographic and Health Survey could be an artifact of the subjective nature of the question and better access to medical care (despite the statistical adjustment for having medical aid/private insurance) because the definition of injury in this study is based on it being “severe enough to seek medical attention.” The cause of death data from the 1998-1999 sample of deaths shows that the proportion of injury deaths was higher among whites compared to Africans (for people older than age 45). However, this does not necessarily confirm the observation from the Demographic and Health Survey because it provides no information about the injury death rate, and it may be possible that the rate for white South Africans is lower than it is for Africans. On the other hand, the pattern of self-reported injury observed in the survey correlates with reported alcohol use, a known risk factor for injury. Alcohol use was highest among the white South Africans (71 percent of men and 51 percent of women), followed by coloured South Africans (45 percent of men and 23 percent of women), Africans (41 percent of men and 12 percent of women), and Asians (37 percent of men and 9 percent of women), and would tend to suggest that cultural and lifestyle factors may play a role in the determination of injury patterns. Clearly, this needs further investigation.
CONCLUSIONS
This exploratory attempt to investigate racial differentials has highlighted both the complexities of the issues and the lack of longitudinal data. It does suggest that population group differences are likely to be confounded by socioeconomic factors as well as cultural factors that influence health outcomes through health-related behaviors. In the case of hypertension, interesting anomalous findings between South Africa and the United States can be explained by the fact that South Africa is not as wealthy as the United States. However, observations from both countries suggest that race
is a proxy measure for other variables such as socioeconomic status and is not a determinant of hypertension per se.
Compared to many developing countries, South Africa can be considered data rich. However, this investigation reveals that there is a need for improved data to compile a more complete description of the differentials in health, in this case, for the older segment of the population. Once the death statistics, post-1998, containing the population group of the deceased become available, there will be more scope to describe the differentials and examine the relationships among population group, socioeconomic factors, and mortality. However, the mortality data will have limitations, making it timely to reflect on the issues that need to be investigated with a view to conducting more directed data collection for investigating racial disparities in health.
In terms of the well-being of older South Africans, we clearly face many challenges, and it is imperative to obtain more coherent information to monitor inequalities arising from the legacy of Apartheid and also new trends in health. Investigating the differential impact of AIDS on the older population will be particularly important.
REFERENCES
Actuarial Society of South Africa. (2001). The AIDS and demographic model. Available: http://www.assa.org.za/aidsmodelo.asp [accessed May 30, 2002].
Booysen, D. (2000). Profiling those South African 65 years and older. Pretoria, South Africa: Statistics South Africa.
Booysen, F. (2001). The measurement of poverty. In D. Bradshaw and K. Steyn (Eds.), Poverty and chronic diseases in South Africa (Medical Research Council Technical Report; pp. 5-38). Parowvallei, South Africa: Medical Research Council.
Botha, J.L., and Bradshaw, D. (1985). African vital statistics—a black hole? South African Medical Journal, 67, 977-981.
Bradshaw, D., Schneider, M., Dorrington, R., Bourne, D., and Laubscher, R. (2002). South African cause of death profile in transition: 1996 and future trends. South African Medical Journal, 92, 624-628.
Cooper, R.S., Rotimi, C.N., and Ward, R. (1999, February). The puzzle of hypertension in African-Americans. Scientific American, 56-63.
Department of Health. (1997). White paper for the transformation of the health system in South Africa (Government Gazette, 17910, Notice 667 of 1997). Pretoria, South Africa: Author.
Department of Health, Medical Research Council, and Macro International. (1999). South African Demographic and Health Survey 1998 (Preliminary Report). Pretoria, South Africa: Department of Health.
Department of Health, Medical Research Council, and Macro International. (2002). South African Demographic and Health Survey 1998. (Full Report). Pretoria, South Africa: Department of Health.
Dorrington, R., Bourne, D., Bradshaw, D., Laubscher, R., and Timaeus, I.M. (2001). The impact of HIV/AIDS on adult mortality in South Africa. (MRC Technical Report). Cape Town, South Africa: Medical Research Council.
Dorrington, R.E., Bradshaw D., and Wegner, T. (1999). Estimates of the level and shape of mortality rates in South Africa around 1985 and 1990 derived by applying indirect demographic techniques to reported deaths. (MRC Technical Report). Cape Town, South Africa: Medical Research Council.
Kielkowski, D., Bah, S., Bradshaw, D., Cassim, M., Esterhuizen, E., Khotu, S., Mavimbela, N., Sitas, F., and Urban, M. (2001). Evaluation of the New Death Notification Form (BI 1663) (Final Report). NHISS/SA Technical Committee of Vital Registration. Pretoria Department of Health, Medical Research Council, and Statistics South Africa.
Luke, F.R. (1945). The National Health Service (Presidential Address). South African Medical Journal, 19, 18-21.
Norman, R., Bradshaw, D., and Steyn, K. (2001). Chronic diseases, risk factors and lifestyles based on the South Africa Adult Demographic and Health Survey . In D. Bradshaw and K. Steyn (Eds.), Poverty and chronic diseases in South Africa (Medical Research Council Technical Report; pp. 53-103). Parrowvallei, South Africa: Medical Research Council.
Popkin, B.M. (2001). An overview on the nutrition transition and its health implications: The Bellagio meeting. Public Health Nutrition, 5(1A), 93-103.
STATA Corporation. (1999). Statistical software: Release 7.0. College Station, TX: STATA Corporation.
Statistics South Africa. (1996). The People of South Africa Population Census, 1996. Census in Brief. (Report No. 03-01-11). Pretoria, South Africa: Statistics South Africa.
Statistics South Africa. (2000). Measuring poverty in South Africa. Pretoria, South Africa: Statistics South Africa.
Statistics South Africa. (2001a). Advanced release of recorded deaths, 1997-2000. (Statistical Release P0309.1). Pretoria, South Africa: Statistics South Africa.
Statistics South Africa. (2001b). South Africa in transition: Selected findings from the October Household Survey of 1999 and changes that have occurred between 1995 and 1999. Pretoria, South Africa: Statistics South Africa.
Steyn, K., Gaziano, T., Bradshaw, D., Laubscher, J.A., and Fourie, J.M. (2001). Hypertension in South African adults: Results from the Demographic Health Survey, 1998. Journal of Hypertension , 19(9), 1717-1725.
United Nations Development Programme. (2002). Deepening democracy in a fragmented world: Human Development Report 2002. New York: Oxford University Press.
West, M. (1988). Confusing categories: Population groups, national state and citizenship. In E. Boonzaier and J. Sharp (Eds.), The uses and abuses of political concepts (pp. 78-99). Cape Town and Johannesburg, South Africa: David Phillip.


