
2
Today’s Pandemic Threat: H5N1 Influenza
OVERVIEW
There is particular pressure to recognize and heed the lessons of past influenza pandemics in the shadow of the worrisome 2003–2004 flu season. An early-onset, severe form of influenza A (H3N2) made headlines when it claimed the lives of several children in the United States in late 2003. As a result, stronger than usual demand for annual flu inactivated vaccine outstripped the vaccine supply, of which 10 to 20 percent typically goes unused. Because statistics on pediatric flu deaths had not been collected previously, it is unknown if the 2003–2004 season witnessed a significant change in mortality patterns.
Then, even more alarmingly, 34 human cases of H5N1 avian influenza—a highly pathogenic flu that has ravaged poultry stocks in several Asian countries—were confirmed in Thailand and Vietnam. Twenty-three (68 percent) of these patients, mostly children and young adults, had died of the disease by early 2004. Another six confirmed human deaths occurred in Vietnam during a resurgence of the epidemic during the summer of 2004, as this report was being prepared (ProMED-mail, 2004a,b). Thailand has confirmed another four deaths (ProMED-mail, 2004c,d), with one case possibly having been transmitted from human to human (ProMED-mail, 2004e).
The past decade has seen increasingly frequent and severe outbreaks of highly pathogenic avian influenza, as described in the Summary and Assessment. The current ongoing epidemic of H5N1 avian influenza in Asia is unprecedented in its scale, in its spread, and in the economic losses it has
caused. Tens of millions of birds died of influenza and hundreds of millions were culled to protect humans.
The chapter begins with a reconstruction of the descent of the virus that infected and killed humans in Thailand and Vietnam during the winter of 2003–2004 from the H5N1 virus first known to have infected humans (in Hong Kong in 1997). These findings indicate that domestic ducks in southern China played a central role in the generation and maintenance of H5N1 and that wild birds spread the virus across Asia, to the point where it is now endemic in the region—an ecological niche from which it now presents a long-term pandemic threat to humans.
The chapter continues with descriptions of the approach taken by two countries most severely affected by the H5N1 epidemic: Thailand and Vietnam. Each country’s circumstances and their handling of the epidemic—beyond the use of common, time-tested strategies for detecting and stamping-out of infection—were unique, as illustrated in these contributions. The diversity of these responses, and their resulting outcomes, offer important lessons for the control of future avian flu outbreaks—a key protection against a human pandemic.
K.S. Li,4 Y. Guan,1,5 J. Wang,1,2 G.J.D. Smith,1,2 K.M. Xu,1,2 L. Duan,1,2 A.P. Rahardjo,6 P. Puthavathana,7 C. Buranathai,8 T.D. Nguyen,9 A.T.S. Estoepangestie,3 A. Chaisingh,5 P. Auewarakul,4 H.T. Long,10 N.T.H. Hanh,7 R.J. Webby,11 L.L.M. Poon,2 H. Chen,1,2 K.F. Shortridge,1,2 K.Y. Yuen,2 R.G. Webster, J.S.M. Peiris1,2
Reprinted by permission from Nature (Li et al., 2003), Copyright 2003, Macmillan Publishers Ltd.
|
1 |
Correspondence and requests for materials should be addressed to Y. Guan (yguan@hkucc.hku.hk). The sequences reported in this paper have been deposited in GenBank under accession numbers AY651320–AY651758. |
|
2 |
We acknowledge K. Stöhr and the World Health Organization for facilitating the study; L.J. Zhang, C.L. Cheung, and Y.H.C. Leung for technical assistance; N. Ng and colleagues for provision of computing facilities; and T.M. Ellis, K. Dyrting, W. Wong, P. Li, and C. Li of the Department of Agriculture, Fisheries and Conservation of Hong Kong for their support of field work, and W. Lim, for virus isolates. We also thank S. Naron for editorial assistance. These studies were supported by a grant from the National Institutes of Health, a grant from The Wellcome Trust, the Ellison Foundation, the Li Ka Shing Foundation, and grants from the Research Grants Council of Hong Kong. |
A highly pathogenic avian influenza virus, H5N1, caused disease outbreaks in poultry in China and seven other east Asian countries between late 2003 and early 2004; the same virus was fatal to humans in Thailand and Vietnam (WHO, 2004a). Here we demonstrate a series of genetic reassortment events traceable to the precursor of the H5N1 viruses that caused the initial human outbreak in Hong Kong in 1997 (Claas et al., 1998; Guan et al., 1999; Xu et al., 1999) and subsequent avian outbreaks in 2001 and 2002 (Guan et al., 2002, 2004). These events gave rise to a dominant H5N1 genotype (Z) in chickens and ducks that was responsible for the regional outbreak in 2003–04. Our findings indicate that domestic ducks in southern China had a central role in the generation and maintenance of this virus, and that wild birds may have contributed to the increasingly wide spread of the virus in Asia. Our results suggest that H5N1 viruses with pandemic potential have become endemic in the region and are not easily eradicable. These developments pose a threat to public and veterinary health in the region and potentially the world, and suggest that long-term control measures are required.
The Asian outbreak of highly pathogenic avian influenza H5N1 disease in poultry in 2003 and 2004 was unprecedented in its geographical extent, and its transmission to humans was an ominous sign (WHO, 2004a). To trace the ecological and genetic origins of these outbreaks, we compared H5N1 viruses recently isolated from poultry in Indonesia, Thailand, and Vietnam as well as from humans in Thailand and Vietnam with 253 H5N1 isolates obtained during prospective surveillance of live poultry markets in Hong Kong and in Guangdong, Hunan, and Yunnan provinces, China, from 2000 to 2004 (Figure 2-1). Results of this surveillance are summarized
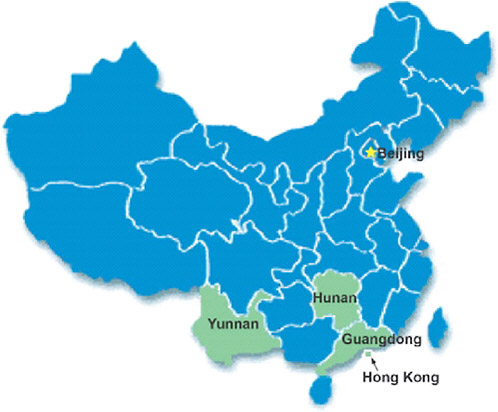
FIGURE 2-1 Map of China showing Hong Kong and Guangdong, Hunan, and Yunnan provinces, where influenza surveillance was conducted.
in Table 2-1. Since 2001, H5N1 viruses have continued to circulate in mainland China with a seasonal pattern, peaking from October to March, when the mean temperature is below 20°C (Figure 2-2). The survival and viability of influenza A virus are known to increase at lower environmental temperatures (Shortridge et al., 1998). H5N1 viruses were isolated exclusively from aquatic poultry during 2000; however, from 2001 onwards they were isolated from both aquatic and terrestrial poultry, although the rate of isolation remained greatest in ducks.
The genes of the virus isolates that encode the surface antigens haemagglutinin (HA) and neuraminidase (NA) were derived from the Goose/Guangdong/1/96 (Gs/Gd)-like lineage. Six genes, which encode internal viral proteins, arose from many other sources through reassortment and served as the basis for assignment to different genotypes (Figure 2-3). By 2001, six H5N1 reassortants (genotypes A, B, C, D, E, and X0) had been isolated from aquatic and, for the first time since 1997, terrestrial poultry (Guan et al., 1999, 2002). From 2002 onwards, eight new H5N1
genotypes (V, W, X1, X2, X3, Y, Z, and Z+) were detected. Genotypes A, C, D and E and their common precursor Gs/Gd were no longer found, suggesting that later genotypes had acquired a survival advantage by means of adaptation. At least nine genotypes of H5N1 viruses continued to circulate in southern China in 2002. All genotypes, except for Gs/Gd and X0–X3, had a five-amino-acid deletion (position 80–84) in the NS1 protein. Similarly, viruses isolated in 2002 and later, except for genotypes B, W, and Z+, had a 20-amino-acid deletion in the stalk of the NA molecule (position 49–68). Deletion in the NA stalk may be associated with adaptation of influenza viruses to land-based poultry (Matrosovich et al., 1999).
Since January 2002, genotype Z, which contains both the NA and NS1 deletions, has become the dominant H5N1 virus in southern China (Table 2-1 and Figure 2-3). In February 2003, human H5N1 disease was diagnosed for the first time since December 1997. The human isolates (A/HK/ 212/03 and A/HK/213/03) had the same gene constellation as genotype Z, but lacked the NA stalk deletion, and were designated genotype Z+ (Figure 2-3) (Guan et al., 2004). Sixty-two H5N1 virus isolates from 2003 were genetically sequenced and 60 of them belonged to genotype Z (Table 2-1). All of the viruses that caused outbreaks in Indonesia, Thailand, and Vietnam in late 2003 and early 2004 (Hien et al., 2004; WHO, 2004a) were genotype Z viruses (Figure 2-4).
Although all viruses tested derived their HA genes from Gs/Gd-like viruses, the Z and Z+ genotypes, as well as the single known isolate of genotype V (Ck/ST/4231/03), formed a distinct sublineage (2002/04-V, Z, Z+; 81% bootstrap support) that included viruses from Hong Kong; Guangdong, Hunan, and Yunnan provinces of mainland China; Indonesia; Thailand; and Vietnam (Figure 2-4a). Within this sublineage, viruses isolated from humans and poultry in Thailand and Vietnam formed a separate group (96% bootstrap) most closely related to H5N1 viruses isolated from poultry and wild birds in Hong Kong (genotypes Z and Z+). Viruses isolated in Indonesia formed a separate group related to those isolated in Yunnan (Figure 2-4a).
Phylogenetic relationships of the other seven gene segments were broadly consistent with those of the HA gene (Figure 2-4b; see also Supplementary Figs 1 and 2).12 The M and NS genes were closest to those of influenza viruses of diverse subtypes isolated from ducks in southern China, suggesting that aquatic avian viruses were the gene donors for these new reassortants (Figure 2-4b; see also Supplementary Fig. 2).12 Bi-directional transmission of influenza virus between terrestrial and aquatic poultry gave
|
12 |
Supporting online material, http://www.nature.com/nature/journal/v430/n6996/suppinfo/nature02746.html. |
TABLE 2-1 Analysis of H5N1 Influenza viruses isolated from poultry in Hong Kong and mainland China during 2000–04
|
|
2000 |
2001 |
||
|
Aquatic |
Terrestrial |
Aquatic |
Terrestrial |
|
|
Sampling |
||||
|
Hong Kong |
||||
|
H5N1-Positive/ total tested |
33/533 |
0/8,256 |
37/606 |
36/16,116 |
|
Non-H5N1 isolates |
16 |
715 |
11 |
983 |
|
Mainland China |
||||
|
H5N1-Positive/ total tested |
0/445 |
0/1,891 |
38/2,579 |
10/3,197 |
|
Non-H5N1 isolates |
122 |
143 |
468 |
290 |
|
Total number sampled |
11,125 |
22,498 |
||
|
Genetic Analysis |
||||
|
Hong Kong |
||||
|
Number of viruses analysed (genotypes detected) |
11 (9Gs/Gd; 2C) |
— |
13 (4B, 9C) |
24 (13A, 4B, 4C, 1D, 2E) |
|
Mainland China |
||||
|
Number of viruses analysed (genotypes detected) |
— |
— |
7 (2B, 5X0) |
1 (1X0) |
|
Number of Genotypes |
2 |
6 |
||
|
Faecal droppings from apparently healthy poultry in live poultry markets in Hong Kong (2000–04), Guangdong (2000–04) and Hunan and Yunnan (2002–04) provinces were sampled monthly for influenza virus isolation. For each month that H5N1 virus was identified, one isolate was selected from each type of infected poultry for sequencing. During H5N1 disease outbreaks, additional isolates were sequenced. Of a total of 96,235 samples, 253 H5N1 virus isolates were genetically sequenced and analysed. |
||||
rise to new H9N2 reassortants (Li et al., 2003), and a similar mechanism may generate novel H5N1 reassortants.
It is notable that in the short time since its emergence in 2002, genotype Z has replaced genotypes A–E, X, and Y to become dominant in both aquatic and terrestrial poultry in this region (Table 2-1). To define the genetic stability of this new gene constellation, we analysed the rates of non-synonymous (Ka) and synonymous (Ks) nucleotide substitutions in six internal gene segments of genotype Z viruses isolated in 2002–04. A Ka/Ks ratio >1 suggests evidence of positive natural selection (Presgraves et al., 2003). Of these internal genes, the M2 gene was under positive selection pressure in late 2002 to early 2003, but under less selection pressure in late 2003 to early 2004. The NS1 and NS2 genes, acquired in late 2000, were also under positive selection pressure (Supplementary Table 1).12 These
|
2002 |
2003 |
2004 |
|||
|
Aquatic |
Terrestrial |
Aquatic |
Terrestrial |
Aquatic |
Terrestrial |
|
14/578 |
323/14,691 |
4/3,694 |
112/12,146 |
1/756 |
0/1,807 |
|
10 |
369 |
12 |
288 |
0 |
20 |
|
73/4,539 |
8/4,059 |
297/7,209 |
50/10,308 |
152/1152 |
26/1,673 |
|
507 |
297 |
301 |
361 |
22 |
75 |
|
23,867 |
33,357 |
5,388 |
|||
|
12 (1B, 8Z, 3Z+) |
100 (7B, 8X0, 2X1, 3X2, 1X3, 10Y, 69Z) |
4 (4Z) |
38 (37Z, 1Z+) |
1 (1Z) |
— |
|
10 (3B, 5Z, 2W) |
7 (7Z) |
11 (11Z) |
9 (8Z, 1V) |
3 (3Z) |
2 (2Z) |
|
9 |
3 |
1 |
|||
findings suggest that the gene constellation of genotype Z viruses has not yet fully adapted to poultry, and this raises the possibility that they may continue to evolve through mutation or reassortment to achieve greater viral fitness (Webster et al., 1992).
The presence of residue Asp 31 in the M2 protein invariably confers resistance to the amantadines (Scholtissek et al., 1998), a group of antiviral drugs used for treatment of human influenza. Sequence analysis revealed that Asp 31 was present in all avian and human genotype Z viruses isolated in Thailand and Vietnam, but in only one of six viruses isolated from poultry in Indonesia. Asp 31 was also observed in some genotype B, Y, and Z+ viruses. The distribution of this mutation in different virus genotypes suggests that it was independently acquired rather than having descended from a single lineage of amantadine-resistant M2 genes (Figure 2-4b).
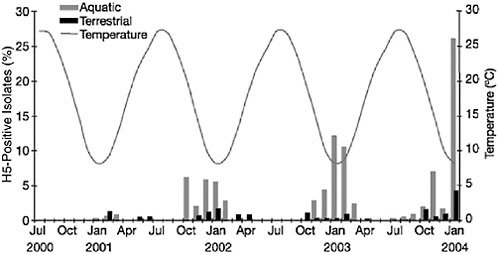
FIGURE 2-2 Seasonality of the isolation of avian H5N1 viruses from domestic poultry in mainland China during July 2000 to January 2004 (see Table 2-1). The mean monthly temperature in southern China (approximated from the monthly average temperatures of the cities Changsha, Kunming, and Xiamen) is shown for reference.
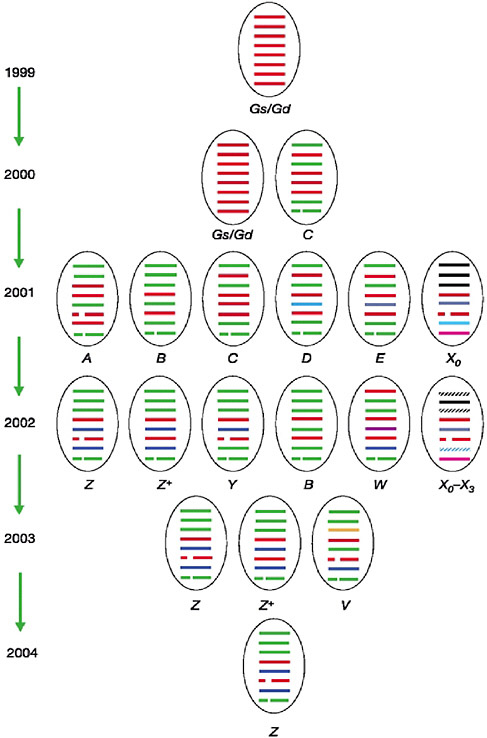
FIGURE 2-3 The genotypes of H5N1 influenza virus reassortants from eastern Asia. The eight gene segments are (horizontal bars starting at the top downwards): PB2, PB1, PA, HA, NP, NA, M, and NS. Each colour represents a virus lineage (red indicates origin from Gs/Gd/1/96). Genotypes (indicated by letters) were defined by gene phylogeny: a distinct phylogenetic lineage with bootstrap support ≥70% (≥50% for M, NP, and PA genes) indicated a common origin. Genotypes A, B, and C were reassortants of Gs/Gd/1/96 and one or more aquatic avian viruses. Genotype D was created when the NP gene of genotype C was replaced by that of a Dk/HK/Y280/97-like virus (H9N2 subtype). Genotype E was created when the NP gene of genotype C was replaced by that of another avian virus. Further reassortment of genotype E with other aquatic avian influenza viruses gave rise to the genotypes X0−X3, distinguished by the sources of their PB2, PA, and NS genes. Genotype W differs from genotype B only in its PB2, NP, and M genes. Further reassortment of genotype A or B with other aquatic avian viruses gave rise to genotypes V, Y, Z, and Z+. Alternatively, genotype V may have resulted from reassortment of genotype Z with other aquatic avian viruses.
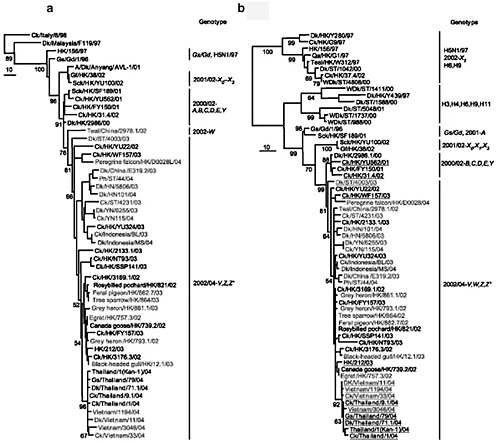
FIGURE 2-4 Phylogenetic relationships of the haemagglutinin (a) and matrix protein (b) genes of representative influenza A viruses isolated in southeastern Asia, including 2 of 6 from Indonesia, 5 of 8 from Thailand, and 4 of 12 from Vietnam. Trees were generated by using maximum parsimony in the PAUP* program (Swofford, 2001) (neighbor-joining analysis with the Tamura–Nei γ-model, implemented in the MEGA program [Kumar et al., 2001], revealed the same relationships). Numbers below branches indicate bootstrap values from 1,000 replicates. Only bootstrap values that define important groups have been included owing to space constraints. Analysis was based on nucleotides 1–1012 (1,012 bp) of the HA gene and 90–945 (856 bp) of the M gene. The HA tree was rooted to A/tern/South Africa/61 and the M tree to A/equine/Prague/1/56. Scale bar, 10 nucleotide changes. Green text indicates viruses isolated from wild birds in Hong Kong; pink text indicates viruses from smuggled birds in China; and other colours show the country of origin of isolates from the late 2003 to early 2004 H5N1 outbreak. Underlined viruses have the amantadine-resistance mutation (Ser31Asn) in the M2 ion channel. Ck, chicken; Dk, duck; Gd, Guangdong; Gf, Guinea fowl; Gs, goose; HK, Hong Kong; HN, Hunan; Qa, quail; SCk, silky chicken; ST, Shantou; WDk, wild duck; YN, Yunnan.
NOTE: For color figure, please see original figure. Available at: http://www.nature.com.
Mutations Ser64Ala and Glu66Ala in the M2 protein were also observed in genotype Z and Z+ viruses from highly pathogenic avian influenza H5N1 outbreaks in Kowloon and Penfold parks in Hong Kong in December 2002, from viruses isolated from humans in Hong Kong in February 2003, and from viruses isolated in Thailand and Vietnam in 2003–04. The remaining genotype Z viruses, including those isolated from Indonesia and mainland China in 2003–04, maintained Ser 64 in the M2 protein. Residue Ser 64 is the predominant site of post-translational phosphorylation in the M2 protein (Holsinger et al., 1995; Thomas et al., 1998). The mutation Ser64Ala induces no significant change in ion-channel activity (Holsinger et al., 1995), and phosphorylation of the cytoplasmic tail does not affect intracellular transport of M2 protein or viral assembly (Thomas et al., 1998). Therefore, the biological role of phosphorylation at position 64 of M2 is still unclear. The biological significance of residue 66 of the M2 ion channel has not been reported.
The molecular determinants of H5N1 transmission to humans in Vietnam and Thailand in 2004 are unclear. In H5N1 viruses recently isolated from humans and poultry in Thailand and Vietnam, amino acid residues at the receptor-binding pocket of HA1—that is, positions Gln 222 and Gly 224 (positions 226 and 228 for H3 influenza numbering)—retain configurations (2,3-NeuAcGal linkages) predicted to have affinity for avian cell-surface receptors (Ha et al., 2001). The substitution Ser227Asn, identified in viruses isolated from two patients with H5N1 influenza after visiting Fujian Province, China, in 2003 (Guan et al., 2004), was not seen in any other H5N1 viruses. Other amino acid residues relevant to receptor binding (residues 91, 130–134, 149, 151, 179, 186, 190–191, 220–225) were identical to those of A/HK/156/97 and Gs/Gd-like viruses (Claas et al., 1998), with the exception of A/Vietnam/3046/04, which had an Ala134Val mutation.
The HA molecules of most genotype Z viruses isolated since late 2002 in Hong Kong, of two out of six isolates from Indonesia, and of all isolates from Thailand, Vietnam, and Yunnan Province in late 2003 and early 2004 had acquired a potential N-linked glycosylation site at positions 154–156. Glycosylation at this site, adjacent to the receptor-binding (Claas et al., 1998) and antigenic sites (Kaverin et al., 2002) at the globular tip of the H5 influenza HA molecule (Supplementary Fig. 3),13 is capable of altering the receptor-binding profile (Iwatsuki-Horimoto et al., 2004) and may help the virus to evade the host antibody response.
Lys 627 in the PB2 protein has been associated with increased virulence of H5N1 viruses in mice (Hatta et al., 2001) and of H7N7 viruses in
|
13 |
Supporting online material, http://www.nature.com/nature/journal/v430/n6996/suppinfo/nature02746.html. |
humans (Fouchier et al., 2004). Three out of four H5N1 human virus isolates from Vietnam had this mutation, but the human virus from Thailand did not, nor did any other avian influenza viruses tested. No recent H5N1 viruses characterized in this study had Glu 92 in the NS1 protein, which is reportedly associated with increased virulence in pigs (Seo et al., 2002).
The apparently simultaneous occurrence of H5N1 outbreaks across eastern Asia remains unexplained, but the presence of H5N1 viruses in dead migratory birds suggests that wild bird populations may be involved. In Hong Kong between late 2002 and the time of this report, genotype Z+ H5N1 virus was isolated from a dead little egret (Egretta garzetta), and genotype Z viruses were isolated from two dead grey herons (Ardea cinerea), a black-headed gull (Larus ridibundus), a feral pigeon (Columba livia), a tree sparrow (Passer montanus), and a peregrine falcon (Falco peregrinus). In the gene phylogenies, the H5N1 viruses isolated from wild birds have either an out-group or sister-group relation to recent Thailand and Vietnam H5N1 isolates (Figure 2-4; see also Supplementary Figs 1 and 2).13 The timing and distribution of the H5N1 infection in poultry in China from 2001 onwards (Figure 2-2) coincides with the general period of winter bird migration to southern China; however, it is not known whether the H5N1 virus has become established in wild bird populations. The potential role of wild birds in the maintenance and spread of H5N1 viruses must be considered in strategies for regional control.
H5N1 virus is now endemic in poultry in Asia (Table 2-1) and has gained an entrenched ecological niche from which to present a long-term pandemic threat to humans. At present, these viruses are poorly transmitted from poultry to humans, and there is no conclusive evidence of human-to-human transmission. However, continued, extensive exposure of the human population to H5N1 viruses increases the likelihood that the viruses will acquire the necessary characteristics for efficient human-to-human transmission through genetic mutation or reassortment with a prevailing human influenza A virus. Furthermore, contemporary human H3N2 influenza viruses are now endemic in pigs in southern China (Peiris et al., 2001) and can reassort with avian H5N1 viruses in this ‘intermediate host.’ Therefore, it is imperative that outbreaks of H5N1 disease in poultry in Asia are rapidly and sustainably controlled. The seasonality of the disease in poultry, together with the control measures already implemented, are likely to reduce temporarily the frequency of H5N1 influenza outbreaks and the probability of human infection. However, complacency would be
|
13 |
Supporting online material, http://www.nature.com/nature/journal/v430/n6996/suppinfo/nature02746.html. |
unwise. Governments in the region face an endemic and recurrent problem that presents a serious threat to human health. Although other countries in the region have been affected, Hong Kong has remained remarkably free of H5N1 outbreaks in poultry in 2004, thanks to preventive measures implemented over the past few years (Sims et al., 2003).
Methods
Surveillance, Virus Isolation and Characterization
Faecal droppings from apparently healthy poultry in live poultry markets in Hong Kong and in Guangdong, Hunan, and Yunnan provinces were sampled monthly for influenza virus isolation. Methods used for virus isolation and characterization have been previously described (Guan et al., 2000). In addition to systematic surveillance in the poultry markets, sick or dead poultry from markets and farms in Hong Kong were similarly studied. This analysis included representative H5N1 viruses isolated from birds in Vietnam (n = 8), Thailand (n = 7), and Indonesia (n = 6), and from humans in Vietnam (n = 4) and Thailand (n = 1) during the 2003–2004 H5N1 outbreak.
Genetic Analysis
All sequences were edited with the Staden software package and aligned with ClustalX. Phylogenetic trees were generated using PAUP* version 4.0 (Swofford, 2001) and MEGA version 2.1 (Kumar et al., 2001). Ka/Ks analysis was conducted by the Pamilo–Bianchi–Li method as implemented in MEGA.
AVIAN INFLUENZA OUTBREAK IN THAILAND: CURRENT POLICIES14
Chantanee Buranathai
Bureau of Disease Prevention Control and Veterinary Services
Department of Livestock Development
Thailand
The current policies and strategies implemented by the Department of Livestock Development (DLD) during the outbreak of highly pathogenic influenza outbreak (HPAI) in 2004 are aimed to (1) contain and eradicate the disease, (2) compensate and restore the loss, (3) improve biosecurity of the poultry system, (4) ensure public safety, and (5) establish a reliable early warning system.
Stamping-Out and Preemptive Culling
Because HPAI is an emerging disease in Thailand, the policy is to contain and eradicate the disease as fast as possible. Therefore, the most stringent measures have been applied. During the initial phase, HPAI-infected premises were stamped-out and disinfected, and preemptive culling was done on premises in the 5-kilometer-radius zone. In the second phase, infected premises and poultry within a 1-kilometer radius were depopulated, followed by disinfection. During the final phase, where sporadic cases were found, infected premises were stamped-out, then samples from the neighboring population were collected for virus isolation. If an HPAI-positive premise was detected, that particular premise was depopulated.
Compensation Scheme
Farmers whose farms are depopulated are compensated by the government in two phases. The initial compensation, right after their farms are stamped-out, is 40 baht ($1) per layer and 20 baht per broiler as well as payment for eggs that had been destroyed. The initial compensation is meant to support farmers when they lose income. The second compensation is arranged when farmers are ready to restock their farms. They can choose between cash or poultry to start the flock. If they prefer cash, the government will pay 100 baht per layer and 20 baht per broiler. The total of 140 baht per layer is equal to or slightly more than average market price, which means 100 percent compensation. HPAI is a special case which the Thai Government agreed to pay 100 percent compensation.
Farm Standard and Biosecurity System
The Department of Livestock Development established the “Farm Standard” for layer, broiler, duck, and other species of poultry. The standard is also divided by nature of the house, size, and type of the farm. The standard is a guideline for poultry farmers to improve the biosecurity system on their farms to prevent avian influenza outbreak. The DLD provides several training courses to educate farmers on disease prevention and control, on the concept of biosecurity, and on how to improve the animal house to meet
the biosecurity standard. Only a farm that complies with all requirements will be allowed to restock. Noncompliant farms will not be given permission and infringement of this regulation in unlawful.
Movement Control
From the start of the outbreak until the present, movement control measures have been enforced in every province. Sixty-five checkpoints were set up by the DLD; in addition, more checkpoints can be set by the command of provincial governors, in cooperation with police or military. The DLD is the national authority that issues permits for animal movement. Stringent procedures for movement control have been implemented to prevent spread of the disease. Ten days prior to the movement, cloacal swabs are taken for virus isolation. Only HPAI-negative farms can obtain the movement permit.
Traceability
A database on poultry population is being updated and improved to facilitate planning for disease control, movement control, and epidemiology study in the future.
Vaccination
The Ministry of Agriculture and Cooperatives has a policy of no avian influenza (AI) vaccination. This policy is currently emphasized and implemented.
Surveillance
Three rounds of active and proactive surveillance have been conducted. Collection of samples prior to movement is also considered active surveillance. Passive surveillance from avian cases that come to the DLD laboratory network for diagnosis is ongoing. In addition, DLD staff have been conducting a slaughterhouse surveillance program at the ante-mortem area and checking for virus residue in the finished products. After the final phase of the outbreak, sero-surveillance will be conducted nationwide to evaluate the infection status and identify risk areas. Clinical surveillance will be applied at all times. To support the national surveillance program for AI, the DLD allocated funding to the National Institute of Animal Health, and all Regional Diagnostic Centers were mandated to improve their facilities and increase capacity. Information technology will be developed to ensure the reliability of an early warning system.
Slaughterhouse Standard
Guidelines for standard slaughterhouse and sanitary practice were established and distributed. The DLD is proposing a law to enforce the standard slaughterhouse practice and to regulate the registration of slaughterhouses.
THE 2003–2004 H5N1 AVIAN INFLUENZA OUTBREAK IN VIETNAM
T.D. Nguyen, DVM, PhD15
National Institute for Veterinary Research
Introduction
Avian influenza, also known as bird flu, was officially declared to have occurred in Vietnam for the first time on December 23, 2003. The outbreak was first reported in south Vietnam and spread at a galloping speed. Within 6 weeks, 57 of the 64 Vietnamese provinces were affected. However, the outbreak was contained within 2 months. Important lessons can be learned from analyzing the rapid spread of the outbreak and the relatively rapid response to it. This section describes how poultry is raised in Vietnam, how the avian influenza outbreak occurred, and how the country tried to control the disease. It also discusses factors that influenced the effectiveness of AI control measures as applied in Vietnam.
Poultry Production in Vietnam
Vietnam has a population of 260 million domestic birds, including 192 million chickens and 68 million ducks. The population of geese and ratites is very small and that of quails and pigeons and other birds is not known.
Poultry production consists mainly of chickens and ducks raised by individual families, often in their backyards. Chickens are bred in farms that provide chicks both to the poultry industry for broiler stock and to households. Poultry farms are often small and typically contain only 100 to 500 broilers. A few chicken breeding farms supply day-old chicks to nearly all of the country.
Ducks are largely raised in the traditional way, which consists of growing laying ducks throughout the year and meat ducks in the months of May
and October. Laying ducks are normally unconfined; they scavenge in the rice fields during the day and return home at night. The more numerous meat ducks are kept in the rice fields to collect the fallen rice grains during the harvest seasons. Recently, with the introduction of supermeat ducks and Muscovy ducks from abroad, industrial duck raising has begun in some places.
Many households own both ducks and chickens, housing them together in the backyard. For farmers, keeping chickens and ducks provides one of the most important sources of income. Because of the small scale of poultry production, traders go from house to house buying live birds to sell at the markets. This practice renders the control of animal movement nearly impossible.
Chicken and duck pens are made of local materials such as bamboo, wood, or brick. The pens—even pens used for growing industrial broilers—are sometimes located next to human dwellings. The diversity of chicken-raising settings greatly complicates the practice of biosecurity.
The birds are sold alive because Vietnamese consumers prefer their poultry to be as fresh as possible. Live chickens, especially cockerels, also serve an important ceremonial and spiritual function. They are used as a tribute dedicated to people’s ancestors in the New Year or to their deceased parents on their memorial days. As a result, industrial slaughterhouses for birds are almost nonexistent and sanitary meat inspection cannot effectively be implemented.
Vietnam is not a poultry-exporting country; rather, poultry for breeding stock is imported into Vietnam. Poultry imports from neighboring countries are largely unregulated by such practices as animal health inspection.
This is the environment into which AI was introduced in Vietnam.
The Avian Influenza Outbreak
First Signs of the Outbreak
Birds began to die on many farms in the Tien Giang and Long An provinces in December 2003. The local veterinary officials initially reported the cause of death as Pasteurella, a common bacterium that is particularly virulent in Southeast Asia; subsequently, the disease was said to be caused by an unknown virus. At the same time, the disease was reported in the Province of Ha Tay in North Vietnam. Avian influenza was eventually diagnosed based on the nonreactivity of the virus toward anti-Newcastle serum and its characteristic behavior in the hemagglutination inhibition test. Thus confirmed, avian influenza was officially declared to have occurred in the country on December 23. Urgent measures, such as circling
the outbreak, control of animal and human movement, establishment of checkpoints, disinfection, and culling diseased birds, were recommended. However, these measures cannot, by law, be implemented until a state of emergency (literally the presence of epidemic disease) is declared by the Chairman of the province or by the Minister of Agriculture. The state of emergency was imposed in a timely manner in some provinces, but others were slow to take this step. In some cases, delayed AI confirmation resulted from a lack of diagnostic facilities; in others, government officials failed to recognize the importance of the threat. The outbreak peaked at the beginning of February 2004, when four million birds were destroyed in a single day, on February 6 (Ministry of Agriculture and Rural Development of Vietnam, 2004).
Features of the Outbreak in Vietnam
-
Both terrestrial birds (chickens and quails) and aquatic birds (ducks and Muscovy ducks), particularly adult animals, developed clinical disease and suffered high rates of both morbidity and mortality.
-
AI infected more birds in industrial operations than in backyard settings.
-
The patchy distribution of infected farms and the results of genetic viral analysis suggest that there was a single infection source, and that the disease spread from bird to bird.
-
The high virulence of the H5N1 virus was characterized not only by acute and severe infection in humans, but also by the sudden death of chickens without AI typical lesions. Beyond the 15 AI confirmed cases in humans, the flu failed to infect chicken farmers and veterinarians who were in direct contact with diseased birds.
-
When human cases of H5N1 influenza were confirmed and publicized in the media, farmers were willing to cull their chickens.
Control Program
Diagnostic testing. The following methods were used: isolation of the virus in embryonated chicken eggs, and hemagglutination (HA), and hemagglutination inhibition (HI) tests; the Directigen Flu A (Becton & Dickinson, Cockeysville, MD), which detects the NP protein; and RT-PCR tests. At the beginning of the outbreak, each infected farm was sampled and tested. Later, as the number of infected farms ballooned, any farm that experienced a massive sudden death of birds (more than 10 percent of the population within 2 days), or at which dead birds had hemorrhagic lesions in the internal organs, was considered to be infected with avian influenza.
Information. A headquarters was established in the main building of the Ministry of Agriculture and Rural Development. Every province reported new AI cases and related issues to the headquarters on a daily basis.
Animal transport restriction. Early in the outbreak, the transport of birds in and out of affected provinces was prohibited. Nevertheless, although checkpoints were set up, birds continued to move in and out of affected areas. Chickens from outbreak regions continued to be sold until the Prime Minister launched a coordinated effort to control AI on February 4.
Disposal. Burial was the main method of bird disposal, but the disposal of culled chickens was difficult to enforce at first because no compensation was offered to farmers. Later, differences in the compensation rates between provinces resulted in birds being moved from provinces that offered relatively low compensation rates to provinces that offered farmers more money for their birds.
Disinfection. The government provided free disinfectants that were widely used in both affected and nonaffected farms. In many breeding farms, disinfection was performed as a preventive measure to preserve the breeding stock.
Despite several requests by poultry companies, the government decided not to vaccinate against AI, and instead relied on disease detection and stamping-out to control the outbreak.
Government Response
The Vietnamese government issued several important and decisive directives and orders in response to the AI outbreak, including the following:
-
A Steering Committee led by the Director of the Department of Animal Health was established on January 10, 2004, as a result of the Prime Minister’s telegram to the Chairmen of provinces (No. 71/CP-NN dated on January 8), that officially declared the AI outbreak in Vietnam.
-
A new National Steering Committee, led by the Minister of Agriculture, was established on January 28 following the Prime Minister’s decision (No. 13/2004/QD-TTg) concerning the AI outbreak. This decision was significant because it described AI as a threat to the health of humans as well as animals, and required agencies other than Agriculture to take part in the effort to control the outbreak.
-
Following the Prime Minister’s telegram to the Chairmen of provinces (No. 159/CP-NN on February 4), members of the government were
-
sent to every province to provide direct guidance on the control of AI. This decision also led to the implementation of severe control measures, such as prohibiting the circulation and consumption of poultry and poultry products.
-
On February 6, Vietnam’s most powerful political body, the Politics Bureau, issued a Directive (No. 35) requesting all levels of government and every citizen to participate in the effort to stop the spread of AI.
Containment of the Outbreak
Following the implementation of control measures, the outbreak began to wane from its peak on February 6, 2004. After that date, the number of reported new cases steadily decreased (Figure 2-5).
No new cases of AI were reported in the weeks following February 27, 2004. At the end of March, the government declared that the AI outbreak had been contained. The outbreak resulted in the loss of 40 million chickens and ducks worth an estimated US$120 million (according to the World Bank). This figure does not include the cost of compensating farmers for their losses.
Vietnam’s response to AI, and its control of the outbreak within 2 months, was comparable to that of other countries at similar stages of scientific and economic development that were affected by AI.
Key Factors in Controlling the Outbreak
Several positive factors contributed to the control of the AI outbreak in Vietnam. These include:
-
The decisive determination of the Vietnamese government to extinguish the outbreak by applying lessons learned from efforts to control Severe Acute Respiratory Syndrome (SARS) in Vietnam in early 2003.
-
Vietnam’s political structure, which organizes and involves every citizen. Orders and directions from the central government effectively reach every person and can be clearly understood, observed, and fulfilled.
-
The decision to ban the movement and consumption of poultry and poultry products. This decision, which was based on advice from scientific experts, limited the spread of disease and allowed officials to detect the appearance of new cases following a 21-day incubation period. This measure was also hoped to reduce the risk of human infection with AI, both within Vietnam and throughout the world.
-
Public awareness of the AI outbreak. The media provided news of the development of the outbreak, information regarding the nature of the disease, and descriptions of effective measures against AI. The government’s awareness campaign helped people to understand the crisis and enlisted
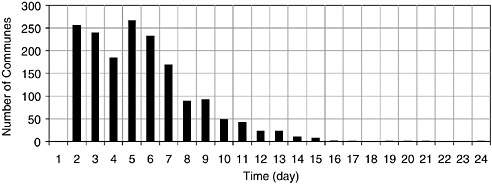
FIGURE 2-5 Number of communes declared as newly affected by the highly pathogenic avian influenza (HPAI) during February 2004 in Vietnam.
SOURCE: Animal Health Department (2004).
-
public support to stop the transport of birds. This proved far more effective than checkpoints in controlling the spread of disease.
-
The virulence of H5N1 and the severity of its avian symptoms (rapid death), which made its presence easy to detect.
-
Public fear of becoming infected with AI, which led to increased cooperation with infection control measures.
Lessons Learned
In retrospect, efforts to control infectious diseases can always be improved. The following aspects of the recent response to AI demand critical examination in order to improve the response to future outbreaks:
-
The 1-month delay between official recognition of the outbreak (on January 8) and the decision, following the appearance of human cases of AI, to ban poultry movement and establish the National Steering Committee (February 4). This delay allowed farmers to sell infected chickens and consequently spread the disease. A thorough, consistent, and updated scientific understanding of AI and consensus on the risk it poses to human health is clearly needed. Several scientific workshops have been organized since then to build such a consensus.
-
Vietnam’s preparedness for AI. H5N1 AI has been reported repeatedly in neighboring Hong Kong and in the nearby southern provinces of China, a region considered to be the epicenter of influenza. Logically, Vietnam should have been prepared to face influenza in general and AI in particular. The following specific areas require attention to prepare Vietnam against influenza:
-
Diagnosis and virus typing. The confirmation of H5N1 AI virus was possible thanks to the generous aid from the Centers for Disease Control and Prevention (CDC) in Atlanta, Georgia. This agency provided NA protein typing and reagent supplies, as well as a team of workers who performed direct diagnosis during the outbreak. However, because this process is time consuming, it would be better to put in place a system of early, on-the-spot detection and virus characterization. This would help Vietnamese authorities react in time to prevent farmers from selling infected birds, thereby limiting disease transmission.
-
Disease and virus surveillance and monitoring. Like many other developing countries, Vietnam had no systemic surveillance or program to monitor AI viral circulation. The unprecedented outbreak, therefore, surprised Vietnam.
-
Institutional preparedness. Although Vietnam has made general preparations for infectious disease, there is no institutional preparedness for specific diseases; it can thus be argued that the country was insufficiently prepared for AI. Many other countries have detailed plans for AI that include a compensation policy for farmers who cull their flocks; regulations on bird disposal; and guidelines outlining the responsibilities of various governmental authorities in such public health emergencies and the paths of communication among them. Such a plan would help with the timely and efficient control of infectious disease. However, there is an important cultural hurdle that needs to be overcome: In the Vietnamese language, the equivalent in English for “declaration of a state of emergency” is cong bo dich, literally “public declaration on the epidemic.” Many people would perceive such a declaration as a concern only to animal health officials; instead, there needs to be a way to declare a state of emergency that duly activates other state agencies.
-
Technical preparedness. Before 2003, Vietnam had never experienced an AI outbreak. The disease was not included in the curriculum of any of the country’s veterinary schools; consequently, many veterinarians incorrectly assumed that its symptomology would resemble influenza in humans and did not suspect that influenza was causing massive mortality in chickens. The country was also ill prepared to deal with the diagnosis and typing of the virus, and had to rely on CDC for help in this effort.
In general terms, Vietnam responded effectively to the AI outbreak; thankfully, no human-to-human transmission occurred. However, if Vietnam had been better prepared for AI, the country would not have lost 15 human lives and as much as 40 million poultry, which has severely affected the rural economy.
Considerations for the Future
It is widely accepted that new influenza viruses will continue to emerge as a result of mutation and genetic reassortment (Guan et al., 1999; Hoffmann et al., 2000; Xu et al., 1999). Research indicates that virus-receptor specificity does not prevent the direct transmission of avian influenza to humans, as was once believed (Matrosovich et al., 2004), and it is now known that any animal, not just the pig (Guan et al., 1999), can serve as the vessel for viral reassortment. The process that allowed H5N1 and H9N2 (Katz, 2003) and H7N7 avian influenza viruses to directly and readily infect humans on other occasions occurred during the 2003–04 AI outbreak in Asia and can be expected to continue (Guan et al., 2004) as the virus becomes increasingly virulent. Consequently, the more we know about this virus, the more we recognize that it is unpredictable and mysterious, and the more we are frightened by it.
One of the issues that arose during the AI outbreak in Vietnam was how to adequately raise government and public awareness of the threat posed by a newly emerged virus, and who should alert decision makers and the public to this danger. The World Health Organization (WHO) Global Influenza Program has foreseen a potential conflict of interest between public health and agriculture/veterinary sectors in relation to surveillance and reporting of animal influenza (Stöhr, 2003). Moreover, evidence indicates that all human influenza viruses are of avian origin. WHO advises that “assessment of the risk to humans needs to be based on a risk assessment of the disease situation in poultry that considers the prevalence of highly pathogenic avian influenza and the adequacy of the surveillance system. A reliable system of review and verification is needed to ascertain that poultry are disease free in an area or country” (WHO, 2004b). Clearly, cooperation between animal and human health institutions should be strengthened. A designated group of experts in both fields in each country could effectively take responsibility for monitoring influenza and notifying government decision makers in the event of an outbreak.
If the next influenza pandemic is imminent, it will probably strike first in poor countries, where public health services are meager and veterinary services are even worse, where vaccine and anti-influenza drugs are not likely to be available, and where disease management is often disorganized and ineffective. Therefore, such countries should be provided with a basic system for AI detection based on cheap and simple techniques. As previously discussed, the highly pathogenic avian influenza (HPAI) virus is readily infecting humans, but there has been no pandemic yet. Most major avian influenza epidemics have been caused by novel HPAI viruses that resulted from reassortment (Sturm-Ramirez et al., 2004). However, the low pathogenic avian influenza (LPAI) viruses that became HPAI after several passages
through chickens can also cause epidemic avian influenza. Will the next human influenza pandemic follow the same pattern or will it be caused by a reassorted virus?
To avert an influenza pandemic, it will also be necessary to prioritize the mobilization of public health resources both before and during an influenza outbreak. Three months after the AI outbreak was controlled, attention to AI in Vietnam was already decreasing, as it naturally must. Influenza viruses can change the world, but life must and will go on. The best preparation would be to devise monitoring and reporting mechanisms that guarantee that an outbreak of disease receives appropriate attention from decision makers and the public in time to avert major consequences.
REFERENCES
Animal Health Department. 2004. Number of communes declared as newly affected by the HPAI during February in Vietnam. Animal Health Department of Vietnam.
Claas EC, Osterhaus AD, van Beek R, De Jong JC, Rimmelzwaan GF, Senne DA, Krauss S, Shortridge KF, Webster RG. 1998. Human influenza A H5N1 virus related to a highly pathogenic avian influenza virus. Lancet 351:472–477.
Fouchier RA, Schneeberger PM, Rozendaal FW, Broekman JM, Kemink SA, Munster V, Kuiken T, Rimmelzwaan GF, Schutten M, Van Doornum GJ, Koch G, Bosman A, Koopmans M, Osterhaus AD. 2004. Avian influenza A virus (H7N7) associated with conjunctivitis and a fatal case of acute respiratory distress syndrome. Proc Natl Acad Sci U S A 101:1356–1361.
Guan Y, Shortridge KF, Krauss S, Webster RG. 1999. Molecular characterization of H9N2 influenza viruses: Were they the donors of the “internal” genes of H5N1 viruses in Hong Kong? Proc Natl Acad Sci USA 96:9363–9367.
Guan Y, Shortridge KF, Krauss S, Chin PS, Dyrting KC, Ellis TM, Webster RG, Peiris M. 2000. H9N2 influenza viruses possessing H5N1-like internal genomes continue to circulate in poultry in southeastern China. J Virol 74:9372–9380.
Guan Y, Peiris JS, Lipatov AS, Ellis TM, Dyrting KC, Krauss S, Zhang LJ, Webster RG, Shortridge KF. 2002. Emergence of multiple genotypes of H5N1 avian influenza viruses in Hong Kong SAR. Proc Natl Acad Sci USA 99:8950–8955.
Guan Y, Poon LL, Cheung CY, Ellis TM, Lim W, Lipatov AS, Chan KH, Sturm-Ramirez KM, Cheung CL, Leung YH, Yuen KY, Webster RG, Peiris JS. 2004. H5N1 influenza: A protean pandemic threat. Proc Natl Acad Sci USA 101:8156–8161.
Ha Y, Stevens DJ, Skehel JJ, Wiley DC. 2001. X-ray structures of H5 avian and H9 swine influenza virus hemagglutinins bound to avian and human receptor analogs. Proc Natl Acad Sci USA 98:11181–11186.
Hatta M, Gao P, Halfmann P, Kawaoka Y. 2001. Molecular basis for high virulence of Hong Kong H5N1 influenza A viruses. Science 293:1773–1775.
Hien TT, Nguyen TL, Nguyen TD, Luong TS, Pham PM, Nguyen VC, Pham TS, Vo CD, Le TQ, Ngo TT, Dao BK, Le PP, Nguyen TT, Hoang TL, Cao VT, Le TG, Nguyen DT, Le HN, Nguyen KT, Le HS, Le VT, Christiane D, Tran TT, Menno de J, Schultsz C, Cheng P, Lim W, Horby P, Farrar J; World Health Organization International Avian Influenza Investigative Team. 2004. Avian influenza A (H5N1) in 10 patients in Vietnam. N Engl J Med 350:1179–1188.
Hoffmann E, Stech J, Leneva I, Krauss S, Scholtissek C, Chin PS, Peiris M, Shortridge KF, Webster RG. 2000. Characterization of the influenza A virus gene pool in avian species in southern China: Was H6N1 a derivative or a precursor of H5N1? J Virol 74:6309–6315.
Holsinger LJ, Shaughnessy MA, Micko A, Pinto LH, Lamb RA. 1995. Analysis of the post-translational modifications of the influenza virus M2 protein. J Virol 69:1219–1225.
Iwatsuki-Horimoto K, Kanazawa R, Sugii S, Kawaoka Y, Horimoto T. 2004. The index influenza A virus subtype H5N1 isolated from a human in 1997 differs in its receptor-binding properties from a virulent avian influenza virus. J Gen Virol 85:1001–1005.
Katz JM. 2003. The impact of avian influenza viruses on public health. Avian Disease 47: 914–920.
Kaverin NV, Rudneva IA, Ilyushina NA, Varich NL, Lipatov AS, Smirnov YA, Govorkova EA, Gitelman AK, Lvov DK, Webster RG. 2002. Structure of antigenic sites on the haemagglutinin molecule of H5 avian influenza virus and phenotypic variation of escape mutants. J Gen Virol 83:2497–2505.
Kumar S, Tamura K, Jakobsen IB, Nei M. 2001. MEGA2: Molecular evolutionary genetics analysis software. Bioinformatics 17:1244–1245.
Li KS, Xu KM, Peiris JS, Poon LL, Yu KZ, Yuen KY, Shortridge KF, Webster RG, Guan Y. 2003. Characterization of H9 subtype influenza viruses from the ducks of southern China: A candidate for the next influenza pandemic in humans? J Virol 77:6988–6994.
Matrosovich M, Zhou NN, Kawaoka Y, Webster RG. 1999. The surface glycoproteins of H5 influenza viruses isolated from humans, chickens, and wild aquatic birds have distinguishable properties. J Virol 73:1146–1155.
Matrosovich MN, Matrosovich TY, Gray T, Roberts NA, Klenk HD. 2004. Human and avian influenza viruses target different cell types in cultures of human airway epithelium. Proc Natl Acad Sci USA 101:4620–4624.
Ministry of Agriculture and Rural Development of Vietnam. 2004 (May). Final Report of Avian Influenza Outbreak in Vietnam. Ministry of Agriculture and Rural Development of Vietnam.
Peiris JS, Guan Y, Markwell D, Ghose P, Webster RG, Shortridge KF. 2001. Co-circulation of avian H9N2 and contemporary “human” H3N2 influenza viruses in pigs in southeastern China: Potential for genetic reassortment? J Virol 75:9679–9686.
Presgraves DC, Balagopalan L, Abmayr SM, Orr HA. 2003. Adaptive evolution drives divergence of a hybrid inviability gene between two species of Drosophila. Nature 423:715–719.
ProMED-mail. 2004a (August 13). PRO/AH/EDR> Avian influenza, human—East Asia (38). Published date: August 13, 2004. Archive number: 20040813.2249. Available at http://www.promedmail.org. Source: WHO Outbreak News, 13 Aug 2004 [edited]: http://www.who.int/csr/don/2004_08_13/en/print.html. “Human cases of avian influenza: situation in Viet Nam.”
ProMED-mail. 2004b (September 29). PRO/AH/EDR> Avian influenza, human—East Asia (49): Viet Nam. Published date: September 29, 2004. Archive number: 20040929.2692. Available at http://www.promedmail.org.
ProMED-mail. 2004c. PRO/AH/EDR> Avian influenza—Eastern Asia (98): Viet Nam, Thailand. Published date: July 27, 2004. Archive number: 20040727.2058. Available at http://www.promedmail.org.
ProMED-mail. 2004d (October 25). PRO/AH/EDR> Avian influenza, human—Thailand (08). Published date: October 25, 2004. Archive number: 20041025.2886. Available at http://www.promedmail.org.
ProMED-mail. 2004e. PRO/AH/EDR> Avian influenza, human—East Asia (46): Thailand, susp. Published date: September 25, 2004. Archive number: 20040925.2647. Available at http://www.promedmail.org.
Scholtissek C, Quack G, Klenk HD, Webster RG. 1998. How to overcome resistance of influenza A viruses against adamantane derivatives. Antiviral Res 37:83–95.
Seo SH, Hoffmann E, Webster RG. 2002. Lethal H5N1 influenza viruses escape host antiviral cytokine responses. Nature Med 8:950–954.
Shortridge KF, Zhou NN, Guan Y, Gao P, Ito T, Kawaoka Y, Kodihalli S, Krauss S, Markwell D, Murti KG, Norwood M, Senne D, Sims L, Takada A, Webster RG. 1998. Characterization of avian H5N1 influenza viruses from poultry in Hong Kong. Virology 252:331–342.
Sims LD, Ellis TM, Liu KK, Dyrting K, Wong H, Peiris M, Guan Y, Shortridge KF. 2003. Avian influenza in Hong Kong 1977–2002. Avian Diseases 47:832–838.
Stöhr K. 2003. The WHO Global Influenza Program and its Animal Influenza Network. Avian Diseases 47:934–938.
Sturm-Ramirez KM, Ellis T, Bousfield B, Bissett L, Dyrting K, Rehg JE, Poon L, Guan Y, Peiris M, Webster RG. 2004. Reemerging H5N1 influenza viruses in Hong Kong in 2002 are highly pathogenic to ducks. J Virol 78(9):4892–4901.
Swofford DL. 2001. PAUP*: Phylogenetic Analysis Using Parsimony (and Other Methods) 4.0 Beta. Sunderland, MA: Sinauer Associates.
Thomas JM, Stevens MP, Percy N, Barclay WS. 1998. Phosphorylation of the M2 protein of influenza A virus is not essential for virus viability. Virology 252:54–64.
Webster RG, Bean WJ, Gorman OT, Chambers TM, Kawaoka Y. 1992. Evolution and ecology of influenza A viruses. Microbiol Rev 56:152–179.
WHO (World Health Organization). 2004a. Avian influenza A (H5N1). Weekly Epidemiol Rev 79:65–70.
WHO. 2004b. Assessment of Risk to Human Health Associated with Outbreaks of Highly Pathogenic H5N1 Avian Influenza in Poultry. [Online]. Available: http://www.who.int/csr/disease/avian_influenza/assessment2004_05_14/en/.
Xu X, Subbarao K, Cox NJ, Guo Y. 1999. Genetic characterization of the pathogenic influenza A/Goose/Guangdong/1/96 (H5N1) virus: Similarity of its hemagglutinin gene to those of H5N1 viruses from the 1997 outbreaks in Hong Kong. Virology 261:15–19.


