
7
The Transition to Marriage
INTRODUCTION
In all regions of the world, most people over age 30 are either currently in a long-term coresidential sexual union, or they have been at one time in their lives. Even in populations of European origin, who have generally exhibited the smallest percentages of adults ever in unions, the fraction of the population who never married is on the order of 10 or 15 percent (with some exceptions, for example, 19th century Ireland—Watkins, 1986). Given that the vast majority of adults marry, examining the transition to marriage in a particular cultural and historical milieu is crucial to understanding the transition to adulthood in that setting.
It is important to stress, however, that although the transition into marriage is a key component of the transition to adulthood in most contexts, marriage, in and of itself, is not necessarily a marker of adulthood, particularly for the numerous young women who wed during their teenage years. As we discuss in Chapter 1, one of the preconditions for a successful transition to adulthood is the taking on of adult roles in an appropriate time and sequence, giving young people: (1) the opportunity to acquire an appropriate amount of human and social capital, (2) the knowledge and means to sustain health during adulthood, and (3) the capability to make choices through the acquisition of a sense of self and a sense of personal competence. Early marriage is unlikely to satisfy those preconditions. Moreover, marriage during the teenage years is associated with an increased probability of divorce (Goldman, 1981; Singh and Samara, 1996; Tilson and Larsen, 2000), although studies have yet to establish whether it is early
marriage per se or the characteristics of those who marry early that increases the risk of dissolution.
Despite the fact that marriage or union formation is nearly universal, many aspects of this transition vary from place to place. This variation makes the meaning of marriage—both in and of itself and in relation to the transition to adulthood more broadly—quite different in different contexts.
In this chapter, we examine various aspects of the transition to marriage with a focus on changes in the last several decades. First, we describe the prevalence of marriage among young people under age 30, focusing especially on the timing of marriage. Second, we consider differentials in age at marriage. Third, we explore some of the global changes described in Chapter 2 and their possible implications for changes in the timing of marriage. Fourth, we look at the terms and conditions of marriage, including the age difference between spouses, polygyny, the decision making process surrounding marriage, consanguinity, the nexus between marital behavior and household formation and structure, and financial transfers between families. Finally, we provide data on changes in the legal age at marriage across countries and review the limited literature on interventions that have been designed to encourage young women and their families to delay marriage. Note that, although constrained by the available data, we give attention to young men as well as women. Given that the literature focuses on the timing and conditions of women’s marriage, this concern with the marriage of men is a distinctive feature of our treatment.
TRENDS IN MARRIAGE PREVALENCE AND TIMING
Trends in Marriage Prevalence
The data on marriage prevalence and timing among young people come from two sources: the United Nations (UN) Population Division database and the Demographic and Health Surveys (DHS). The advantage of the UN data base is that the data are available for a large number of developing countries; the advantage of the DHS data is that there is information on age at first marriage rather than information simply on current marital status by age. A more extensive discussion of the data, including a discussion of the regional weights we employ and the degree of coverage of each data source, appears in Appendix A at the end of the volume.
Before turning to the findings on marriage trends, a cautionary note is in order. We are assuming here that the reporting of age and marital status in the censuses and surveys on which our analysis is based is accurate. In certain populations, however, this assumption may be questionable. In Africa, where formation of a marital union has been described as a process that takes place in stages, marriage is not a well-defined event and therefore
age at marriage is difficult to establish (van de Walle and Meekers, 1994). To the extent that particular rites and ceremonies have lost significance or been eliminated as the population becomes more urbanized and better educated, comparisons over time are problematic. In countries in which, at least officially, early marriage violates newly passed legislation, observed declines in the proportion married at or by a particular age may simply reflect increases in deliberate misreporting. For example, Amin and Al-Bassusi (2003) speculate that, in Bangladesh, the implementation of a new law requiring girls to be at least 18 when they marry resulted in a precipitous and, they believe, improbable decline in the proportion of 15-19-year-olds reporting being married. Feng and Quanhe (1996) report that in China, a gap between the marriage ceremony, when couples are permitted by custom to live together, and marriage registration means that the reporting of age at marriage is problematic, at least in the recent past, when the legal age of marriage was higher than the desired age for many young people. While age misreporting may lead to an exaggeration of change in certain populations, in others it may lead to an underestimation of the decline in early marriage over time. In countries in which age is not reported with a great deal of accuracy, the timing of an event that occurred in the remote past is often estimated to take place closer to the survey than it actually did. Older women are thus more likely to report that a marriage took place at a later age (Blanc and Rutenberg, 1990).
Note also that the definition of marriage used in censuses and standardized surveys varies. For the DHS, marriage is a self-defined state. Respondents are coded as married if they say so in response to questions on whether they are currently or ever married or are living with a man. Age at first marriage is thus typically age at first cohabitation with a partner or husband (Kishor, 2003). As for censuses, countries typically define marriage to reflect the forms of marriage and union that are generally recognized and accepted and obtain information accordingly; as a result, for the most part, data on marriage or union status is largely comparable between censuses and surveys. For example, in Latin America, census questions on marital or union status include the category “consensual union” because this is a widely occurring and acknowledged form of union. However, in countries in which cohabitation or living together is much less common, “consensual union” may not be explicitly included as a category, with the result that this type of arrangement may be underreported. Note that we do not separately assess trends in consensual unions because of variability in how data were collected and fluid definitions of marriage. For DHS data, we could present the percentage of respondents currently in a consensual union, but we are not able to compare cohorts because we do not have information on marriages that began as consensual unions. For the UN database we could compare the percentage of those in a consensual union
by age group for two censuses or surveys but only for those countries with a separate consensual union category, which is a subset of countries in which consensual unions are common.
Tables 7-1 and 7-2, based on the UN database, show the percentage of women and men ever in a union1 by age group from data collected at two different points in time. For women the age groups are 15-19, 20-24, and 25-29, and for men—for whom marriage during the teenage years is rare—they are 20-24 and 25-29. An annualized rate of change is calculated, since the interval between the two times varies by country. Note that for these tables as well as all subsequent tables that present regional data, the individual country data are provided in appendix tables at the end of the chapter.
For all regions except former Soviet Asia and South America, where early marriage was not that common even 10-20 years ago, teenage marriage has declined among women; whereas 27 percent of 15-19-year-old women in the developing world were married in 1970-1989, 21 percent were married in 1990-2000.2 The reduction in the percentage of married 15-19-year-olds is particularly striking in Africa.3 The percentage married among 20-24-year-olds has also fallen markedly in most regions, with the exception, again, of South America. While the majority of women in developing countries were married by ages 25-29, there are regions in which 15-25 percent of women were still not married by their late 20s, including South America, the Caribbean and Central America, the Middle East, the former Soviet Asia, and Eastern and Southern Africa, as well as certain countries in Asia (e.g., Myanmar, the Philippines, and Thailand).
For the most part, regions with a relatively high percentage married at younger ages also had a relatively high percentage married at older ages (e.g., Africa) and vice versa (e.g., the former Soviet Asia). The exception is
China,4 which ranks very low in the level of young marriage and relatively high in the level of marriage at older ages.
Not only is marriage during the teenage years uncommon among men, but also marriage in the early 20s is much less frequent among men than among women and, in some regions, has declined substantially in recent years. For example, in Eastern and Southern Africa, Eastern Asia, the former Soviet Asia, and the Middle East, there has been a sizeable reduction in the percentage of men married at ages 20-24 in the last decade or so.
By ages 25-29, considerable numbers of men in developing countries have wed. However, in certain regions, marriage is postponed until the 30s for a large fraction of men. In South America and the few countries of Western/Middle Africa for which there are data, this pattern is observed in the earlier period and seems to have stabilized. In the Middle East, where nearly half of men were not married in this age group, and in the former Soviet Asia, there is recent evidence of increasing delay.
In summary, Tables 7-1 and 7-2 reveal declines in the proportion ever married for both sexes in most regions; the exceptions are South America for both men and women and, for men only, Western/Middle Africa and South-central/South-eastern Asia. For six of the eight regional groupings, the patterns for men more or less parallel those for women. The exceptions are Western/Middle Africa, where there are substantial declines in the proportions married for women at ages 15-19 and 20-24 but virtually no change for men at ages 20-24 and 25-29, and South-central/South-eastern Asia, where there is no change for men but declines for women at ages 15-19 and 20-24. While five of the eight regions have had declines in the proportions married among young people of both sexes, in China and the Middle East the change has been most consistent across the three age groups for women and the two age groups for men.
Tables 7-3 and 7-4, which are also based on the UN database, are similar to Tables 7-1 and 7-2 in that they show levels of union formation by age, gender, and time, but they also break countries down by income group as designated by the World Bank, rather than region (World Bank, 2002b).5 For both men and women there is very little difference in the percentage in a union in the lower middle- and upper middle-income categories. There is
|
4 |
For Eastern Asia, data are available only for China, which contains 98 percent of the region’s population. |
|
5 |
China is excluded from the lower-middle category because it is so numerically dominant that the weighted average for the category simply reflects its percentages. Given that China is the only country in the Eastern Asia regional grouping, the percentages for the country can be found in Tables 7-1 and 7-2. |
a large contrast, however, between the low-income category and these other two. That is, men and women in low-income countries married earlier than their counterparts in wealthier countries. Among women, proportions ever married at ages 15-19 and 20-24 have declined in countries in all income categories; however, at ages 25-29, declines have occurred only among those in the more affluent countries, that is, those in the lower middle- and the upper middle-income categories. Among men, while there is evidence of a decline in proportions ever married for those in lower middle- and upper middle-income countries, there is no change over time among men in low-income countries.
Trends in Marriage Timing
To reflect the earlier timing of marriage among women, we examined the proportions in a union before ages 18, 20, and 25 for women and before ages 20, 25, and 30 for men. We compared these proportions across age groups (20-24, 30-34, and 40-44) in order to get a sense of time trends. Tables 7-5 and 7-6, which are based on the DHS, provide data on the percentage of women ever in a union by ages 18 and 20 for three cohorts and by age 25 for two cohorts by region and income level.
The trends revealed by Table 7-5 are more or less consistent with those shown in Table 7-1. First, the regional rankings essentially follow the same sequence; moreover, the ranking changes little by age group. Western/Middle Africa is generally the region with the greatest percentage of women marrying at young ages, followed by South-central/South-eastern Asia, Eastern/Southern Africa, and the Caribbean and Central America. The Middle East, South America, and the former Soviet Asia have smaller proportions of women who married early. Second, a comparison of the percentage married by ages 18 and 20 across age cohorts indicates that there has been little change in South America, the Caribbean and Central America, and the former Soviet Asia. Indeed, in the former Soviet Asia, a greater percentage of 20-24-year-olds have married early than 30-34-year-olds. Other regions reveal a considerable decline in the percentage married by these ages, with a slightly greater percentage decline by age 18 than by age 20. The fall-off in early marriage is particularly sizeable in the Middle East, where there has been a 49 percent decline between 20-24-year-olds and 40-44-year-olds in the percentage married by age 18, and a 38 percent decline in the percentage married by age 20.
As for marriage by age 25, in all regions except South America, over 80 percent of women have married or are living with a partner by that age, with little change across the 30-34 and 40-44 age cohorts, except for the Middle East and sub-Saharan Africa. Comparing the 30-34-year-old cohort with the 40-44-year-old cohort for all three ages at marriage, it is clear that
TABLE 7-1 Percentage of Women Ever Married by Age, Time Period, and Regiona (Weightedb Averages)
|
Region |
Region Population Represented |
Ages 15-19 |
||
|
Time 1c 1970-1989 |
Time 2 1990-2000 |
Annual Change |
||
|
Africa |
||||
|
Eastern/Southern Africa |
89.8 |
37.5 |
24.5 |
−.75 |
|
Western/Middle Africa |
30.8 |
53.0 |
38.4 |
−.89 |
|
Asia |
||||
|
Eastern Asiad |
98.1 |
4.2 |
1.3 |
−.24 |
|
South-central/South-eastern Asia |
93.3 |
39.6 |
32.3 |
−.64 |
|
Former Soviete Asia |
37.8 |
9.4 |
9.6 |
.02 |
|
Latin America and Caribbean |
||||
|
Caribbean/Central America |
87.5 |
20.6 |
18.1 |
−.27 |
|
South Americaf |
99.9 |
14.4 |
16.3 |
.12 |
|
Middle Eastg |
||||
|
Western Asia/Northern Africa |
62.8 |
21.0 |
14.9 |
−.59 |
|
TOTAL |
86.5 |
26.6 |
20.8 |
−.48 |
|
aRegional groupings based on United Nations World Population Prospects: The 2002 Revision (2003b). bWeighting is based on United Nations population estimates for year 2000 (World Population Prospects: The 2000 Revision, POP/DB/WPP/Rev. 2000/3/F1. February 2001). cFor several countries, the first survey/census was before 1970: Chad, Gabon, Cambodia, Palestine, Namibia. dThere are 3 countries in this region, China, North Korea, and Mongolia; data are available only for China, which contains 98% of the region’s population ages 10-24. |
||||
the percentage decline in marriage prevalence is greater during the teenage years, that is, by ages 18 and 20, than it is by age 25. In short, in most regions there has been a greater reduction in early marriage than in marriage during the 20s, suggesting an increase in age at marriage among women in the developing world rather than a retreat from the institution of marriage.
Table 7-6 presents these same data by World Bank income group; however because lower middle- and upper middle-income countries are not as well represented by the DHS, these data are not as useful as the comparable UN data. As with Table 7-3, little difference is observed in the percentage married in the lower middle- and upper middle-income categories, whereas a large contrast between the low-income category and these other two is apparent.
In summarizing the data on trends among women, we must emphasize that while marriage during the teenage years is declining in many regions of
|
Ages 20-24 |
Ages 25-29 |
||||
|
Time 1c 1970-1989 |
Time 2 1990-2000 |
Annual Change |
Time 1c 1970-1989 |
Time 2 1990-2000 |
Annual Change |
|
77.2 |
65.6 |
−.71 |
89.2 |
83.4 |
−.38 |
|
85.1 |
78.6 |
−.40 |
93.5 |
92.3 |
−.05 |
|
60.1 |
45.9 |
−1.19 |
95.9 |
91.6 |
−.36 |
|
80.6 |
77.4 |
−.30 |
93.7 |
93.4 |
−.02 |
|
61.2 |
54.0 |
−.70 |
85.0 |
80.7 |
−.42 |
|
59.4 |
56.1 |
−.35 |
81.0 |
79.3 |
−.20 |
|
51.1 |
51.3 |
.03 |
75.9 |
76.0 |
.00 |
|
64.5 |
54.6 |
−.95 |
87.7 |
81.4 |
−.58 |
|
70.8 |
63.9 |
−.56 |
91.6 |
89.4 |
−.18 |
|
eFormer Soviet Asia includes former Soviet Republics in South-central and Western Asia. f15-19-year-old married data not available for Argentina, Survey 1. gData for Bahrain limited to 15-19 age group, other data in nonstandard age groups. SOURCES: United Nations Population Division Database on Marriage Patterns (Pop/1/DB/2000/3), 73 countries, 1960-2001. See Appendix Table 7-1a for list of countries. |
|||||
the world, substantial proportions are still marrying extremely early. Indeed, as Table 7-5 indicates, in six of seven regions, at least one-fifth of women currently ages 20-24 married prior to age 18. The UN Convention on the Rights of the Child defines childhood as extending to the age of 18. Thus, according to these data, outside China, 38 percent of women in developing countries marry as minors.
Recently, Demographic and Health Surveys have been conducted among men in a number of countries in sub-Saharan Africa, Central America and the Caribbean, and the former Soviet Asia. However, only in sub-Saharan Africa and Latin America are there a sufficient number of countries with male surveys to aggregate the data and generate regional averages.6Table 7-7 provides regional data on the percentage of men
TABLE 7-2 Percentage of Men Ever Married, by Age, Time Period, and Region (Weighted Averages)
|
Region |
Region Population Represented |
Ages 20-24 |
Ages 25-29 |
||||
|
Time 1a 1970-1989 |
Time 2 1990-2000 |
Annual Change |
Time 1a 1970-1989 |
Time 2 1990-2000 |
Annual Change |
||
|
Africa |
|||||||
|
Eastern/Southern Africa |
89.8 |
36.0 |
27.8 |
−.56 |
71.8 |
66.5 |
−.42 |
|
Western/Middle Africa |
30.8 |
28.4 |
26.5 |
−.10 |
61.6 |
60.5 |
−.04 |
|
Asia |
|||||||
|
Eastern Asia |
98.1 |
39.0 |
24.9 |
−1.17 |
82.7 |
77.2 |
−.46 |
|
South-central/South-eastern Asia |
93.3 |
41.6 |
41.4 |
−.03 |
77.5 |
77.2 |
−.01 |
|
Former Soviet Asia |
37.8 |
31.9 |
23.9 |
−.81 |
78.0 |
66.0 |
−1.20 |
|
Latin America and Caribbean |
|||||||
|
Caribbean/Central America |
87.5 |
38.4 |
37.5 |
−.14 |
72.0 |
68.8 |
−.36 |
|
South America |
99.9 |
28.3 |
29.3 |
.06 |
65.3 |
62.8 |
−.18 |
|
Middle Eastb |
|||||||
|
Western Asia/Northern Africa |
62.6 |
24.9 |
16.8 |
−.78 |
63.0 |
53.4 |
−.91 |
|
TOTAL |
86.5 |
37.9 |
33.0 |
−.41 |
76.0 |
73.1 |
−.24 |
|
aFor several countries, the first survey/census was before 1970: Chad, Gabon, Cambodia, Palestine, Namibia. bBahrain excluded; data in nonstandard age groups. NOTES: For source of regional groupings and population data for weighted averages, see Table 7-1. Further detail can be found in Appendix A. SOURCES: United Nations Population Division Database on Marriage Patterns (Pop/1/DB/2000/3), 72 countries, 1960-2001. See Appendix Table 7-1b for list of countries. |
|||||||
married by ages 20, 25, and 30 by age group for 29 countries with surveys between 1994 and 2001:9 in Eastern and Southern Africa, 14 in Western and Central Africa, and 6 in Latin America. As with the data on women, the weighted averages shown are the country’s percentage of the region’s population ages 10-24 in 2000.
This table indicates slight declines in the proportion of men married across cohorts at ages 20 and 25 in both regions of Africa, declines that are considerably smaller than those seen for women in sub-Saharan Africa. Note that, in comparison to Table 7-2, a smaller decline is observed for Eastern and Southern Africa and a slightly larger decline for Western and Middle Africa. These discrepancies arise because of differences in the countries included in the analyses. Data from Nigeria, which has nearly half of the population of Western Africa and where there has been a considerable decline in early marriage for young men (11 percent married by age 20 among 20-24-year-olds, compared with 19 percent among 40-44-year-olds) are not provided in the UN database. And the DHS was not conducted among men in South Africa, where there has been a large decline in early marriage. In 1985, according to the UN database, 17 percent of South African men ages 20-24 were married, compared with 9 percent in 1996. Among men ages 25-29 the decline is also substantial; half were married in 1985 compared with one-third in 1996.7 As for South America and the Caribbean and Central America, the DHS data, which are less representative than the UN data, show little change and are broadly consistent with the UN data.
DIFFERENTIALS IN AGE AT MARRIAGE
Tables 7-8, 7-9, and 7-10 are limited to women ages 20-24 and indicate the percentage ever married by age 18 by years of schooling attained, by an asset index score, and by rural-urban residence, respectively. Table 7-11 is limited to men ages 20-24 from sub-Saharan Africa and Latin America and the Caribbean and indicates the percentage ever married by age 20 by the same three factors: years of schooling attained, an asset index score, and
TABLE 7-3 Percentage of Women Ever Married, by Age, Time Period, Incomea Group (Weighted Averages)
|
Income Level |
Income Group Population Represented |
Ages 15-19 |
||
|
Time 1b 1970-1989 |
Time 2 1990-2000 |
Annual Change |
||
|
Low |
81.0 |
42.5 |
34.1 |
−.66 |
|
Lower Middlec |
29.4 |
19.6 |
14.5 |
−.50 |
|
Upper Middled |
92.7 |
15.7 |
14.4 |
−.15 |
|
TOTAL |
63.9 |
34.6 |
27.8 |
−.55 |
|
aWorld Bank income classifications. SOURCE: World Bank (2002b). bFor several countries, the first survey/census was before 1970: Chad, Gabon, Cambodia, Palestine, Namibia. cChina excluded; see Table 7-1 for data on China. d15-19-year-old married data not available for Argentina, Survey 1. Data for Bahrain limited to 15-19 age group, other data in nonstandard age groups. |
||||
rural-urban residence. Note that the asset index score is based on a methodology used by Filmer and Pritchett (1999) and is generated from answers to questions on ownership of assets and housing characteristics.8 Weights for each item are derived from principal components analysis. The index is computed separately for each country, and households are then assigned a score based on whether they fall into the top 20 percent, the middle 40 percent, or the bottom 40 percent.
As expected, very large differentials by education, household wealth, and residence are observed for both sexes. Women and men with 8 or more years of schooling are much less likely to marry early than are those with 0-3 years of schooling.9 Women and men in the top wealth category are much less likely to marry at young ages than are those in the bottom category, and those in urban areas are much less likely to marry early than young people living in the countryside. While these differentials are considerable for women, greater variability exists in the timing of marriage by education than by household economic status or residence. For example, in
|
Ages 20-24 |
Ages 25-29 |
||||
|
Time 1b 1970-1989 |
Time 2 1990-2000 |
Change Annual |
Time 1b 1970-1989 |
Time 2 1990-2000 |
Annual Change |
|
83.4 |
79.8 |
−.25 |
95.0 |
94.6 |
−.02 |
|
59.2 |
52.1 |
−.63 |
81.6 |
77.4 |
−.35 |
|
54.1 |
49.7 |
−.42 |
78.3 |
75.4 |
−.27 |
|
74.6 |
70.3 |
−.49 |
90.1 |
88.6 |
−.11 |
|
NOTES: For source of regional groupings and population data for weighted averages, see Table 7-1. Further detail can be found in Appendix A. SOURCES: United Nations Population Division Database on Marriage Patterns (Pop/1/DB/2000/3), 72 countries, 1960-2001. See Appendix Table 7-1a for list of countries. |
|||||
Eastern and Southern Africa, over four times as many women with 0-3 years of schooling marry before age 18 as do women with 8+ years of schooling, whereas 1.9 times as many women in low-status households marry before 18 as do women in high-status households, and 1.6 times as many women in rural areas marry before age 18 than do women in urban areas. In contrast, in the regions in which data are available for men, the differentials by socioeconomic status are nearly as large, or larger than, the differentials by schooling, suggesting that household economic status is a potentially more important factor than schooling in determining timing of marriage for men than for women.
FACTORS AFFECTING THE RISE IN AGE AT MARRIAGE
In all regions of the developing world except for South America, fewer young women are married than in the recent past, and in a number of regions, fewer young men are married as well. The fact that this pattern is quite widespread is support for our assumption that global changes are affecting the transition to adulthood. In trying to assess the mechanism for this transformation, it is important to note that the reduction in marriage is occurring in a diversity of settings. More importantly, for women, the change is occurring not only in the teenage years but also in the 20s, suggesting that policy shifts, such as increases in the legal age at marriage,
TABLE 7-4 Percentage of Men Ever Married, by Age, Time Period, Incomea Group (Weighted Averages)
|
Income Level |
Income Group Population Represented |
Ages 20-24 |
Ages 25-29 |
||||
|
Time 1b 1970-1989 |
Time 2 1990-2000 |
Annual Change |
Time 1b 1970-1989 |
Time 2 1990-2000 |
Annual Change |
||
|
Low |
81.0 |
40.9 |
40.6 |
−.01 |
76.4 |
76.6 |
.03 |
|
Lower Middlec |
29.5 |
30.7 |
24.6 |
−.57 |
67.5 |
60.0 |
−.67 |
|
Upper Middled |
92.7 |
30.8 |
27.9 |
−.28 |
68.2 |
62.7 |
−.48 |
|
TOTAL |
63.9 |
37.6 |
35.9 |
−.14 |
73.6 |
71.6 |
−.17 |
|
aWorld Bank income classifications. SOURCE: World Bank Development Indicators, 2002. bFor several countries, the first survey/census was before 1970: Chad, Gabon, Cambodia, Palestine, Namibia. cChina excluded, see Table 7-2 for data on China. dBahrain excluded; data in nonstandard age groups. NOTES: For source of regional groupings and population data for weighted averages, see Table 7-1. Further detail can be found in Appendix A. SOURCES: United Nations Population Division Database on Marriage Patterns (Pop/1/DB/2000/3), 71 countries, 1960-2001. See Appendix Table 7-1b for list of countries. |
|||||||
TABLE 7-5 Percentage of Women Ever Married by Ages 18, 20, and 25, by Age at Time of Survey and Region (Weighted Averages)
|
Region |
Population Represented |
Age 18 |
Age 20 |
Age 25 |
|||||
|
20-24 |
30-34 |
40-44 |
20-24 |
30-34 |
40-44 |
30-34 |
40-44 |
||
|
Africa |
|||||||||
|
Eastern/Southern Africa |
91.7 |
36.5 |
45.7 |
52.8 |
54.6 |
62.9 |
69.2 |
83.6 |
88.2 |
|
Western/Middle Africaa |
75.2 |
44.8 |
55.0 |
57.9 |
60.1 |
69.5 |
73.6 |
88.7 |
92.6 |
|
Asia |
|||||||||
|
South-central/South-eastern Asia |
86.0 |
41.5 |
54.2 |
57.6 |
59.5 |
71.0 |
74.3 |
90.4 |
92.4 |
|
Former Soviet Asia |
68.4 |
15.9 |
10.9 |
14.2 |
49.9 |
39.7 |
45.9 |
87.8 |
87.2 |
|
Latin America and Caribbean |
|||||||||
|
Caribbean/Central America |
21.0 |
34.9 |
35.7 |
38.4 |
53.3 |
53.7 |
58.1 |
82.3 |
82.5 |
|
South America |
74.1 |
22.7 |
22.5 |
21.9 |
38.0 |
39.7 |
39.6 |
73.1 |
75.2 |
|
Middle East |
|||||||||
|
Western Asia/Northern Africa |
54.8 |
23.2 |
35.1 |
45.5 |
39.8 |
52.2 |
64.2 |
81.7 |
87.2 |
|
TOTAL—All DHS |
59.8 |
37.7 |
48.2 |
52.0 |
55.5 |
65.0 |
69.1 |
87.2 |
89.8 |
|
aGabon excluded; data on women unavailable at time of this analysis. NOTES: For source of regional groupings and population data for weighted averages, see Table 7-1. Further detail can be found in Appendix A. SOURCES: Demographic and Health Surveys tabulations from 51 countries, 1990-2001. See Appendix Table 7-2 for list of countries. |
|||||||||
TABLE 7-6 Percentage of Women Ever Married by Ages 18, 20, and 25, by Age at Time of Survey and Incomea Level of Country (Weighted Averages)
|
Income Level |
Population Represented |
Age 18 |
Age 20 |
Age 25 |
|||||
|
20-24 |
30-34 |
40-44 |
20-24 |
30-34 |
40-44 |
30-34 |
40-44 |
||
|
Low |
88.9 |
42.5 |
54.7 |
58.3 |
60.9 |
71.5 |
75.4 |
90.8 |
93.2 |
|
Lower Middle |
18.8 |
16.1 |
21.3 |
25.4 |
34.6 |
41.9 |
47.2 |
74.0 |
77.6 |
|
Upper Middleb |
53.1 |
20.9 |
22.8 |
25.1 |
35.7 |
40.1 |
44.0 |
73.0 |
76.9 |
|
TOTAL—All DHS |
59.8 |
37.7 |
48.2 |
52.0 |
55.5 |
65.0 |
69.1 |
87.2 |
89.8 |
|
aWorld Bank income classifications. bGabon excluded; data on women unavailable at time of this analysis. NOTES: For source of regional groupings and population data for weighted averages, see Table 7-1. Further detail can be found in Appendix A. SOURCES: Demographic and Health Surveys from 51 countries, 1990-2001. See Appendix Table 7-2 for list of countries. |
|||||||||
TABLE 7-7 Percentage of Men Ever Married by Ages 20, 25, and 30, by Age at Time of Survey (Weighted Averages)
|
Region |
Population Represented |
Age 20 |
Age 25 |
Age 30 |
|||||
|
20-24 |
30-34 |
40-44 |
30-34 |
40-44 |
30-34 |
40-44 |
|||
|
Africa |
|||||||||
|
Eastern/Southern Africa |
69.5 |
13.8 |
20.0 |
21.3 |
59.3 |
61.0 |
86.7 |
87.7 |
|
|
Western/Middle Africa |
75.5 |
12.0 |
16.2 |
17.5 |
47.7 |
50.9 |
77.0 |
76.5 |
|
|
Latin America and Caribbean |
|||||||||
|
Caribbean/Central America |
13.7 |
22.2 |
20.4 |
21.9 |
55.3 |
58.0 |
76.0 |
80.1 |
|
|
South America |
60.3 |
14.0 |
18.2 |
10.8 |
58.7 |
57.4 |
80.7 |
85.6 |
|
|
TOTAL—All DHS |
60.5 |
13.5 |
18.1 |
16.9 |
54.8 |
56.2 |
81.1 |
82.7 |
|
|
NOTES: For source of regional groupings and population data for weighted averages, see Table 7-1. Further detail can be found in Appendix A. SOURCES: Demographic and Health Surveys tabulations from 29 countries, 1994-2001. See Appendix Table 7-3 for list of countries. |
|||||||||
TABLE 7-8 Percentage of Women Ages 20-24 Ever Married by Age 18, by Years of Schooling and Regiona (Weighted Averages)
|
Region |
Population Represented |
Years of Schooling |
||
|
0-3 |
4-7 |
8+ |
||
|
Africa |
||||
|
Eastern/Southern Africa |
91.7 |
51.2 |
38.6 |
12.6 |
|
Western/Middle Africab |
75.2 |
70.5 |
36.8 |
14.1 |
|
Asia |
||||
|
South-central/South-eastern Asiac |
28.0 |
55.7 |
44.0 |
17.3 |
|
Latin America and Caribbean |
||||
|
Caribbean/Central America |
21.0 |
55.5 |
43.9 |
14.7 |
|
South America |
74.1 |
41.7 |
30.3 |
10.8 |
|
Middle East |
||||
|
Western Asia/Northern Africad |
49.6 |
38.9 |
25.6 |
6.4 |
|
TOTAL—All DHS |
34.4 |
53.2 |
37.6 |
13.5 |
|
aFormer Soviet Asia excluded because too few women with less than 8+ years of schooling. bGabon excluded; data on women unavailable at time of this analysis. cIndia and Pakistan excluded; lack the all women weight. dYemen excluded; lacks the all women weight. NOTES: For source of regional groupings and population data for weighted averages, see Table 7-1. Further detail can be found in Appendix A. SOURCES: Demographic and Health Surveys tabulations from 44 countries, 1990-2001. See Appendix Table 7-4 for list of countries. |
||||
or social shifts, such as the expansion of education, or ideological shifts, such as a change in norms regarding very early marriage, cannot fully explain the changes observed.
There is a substantial literature on the forces behind postponement of marriage among young women, although much of it is speculative, rather than based on rigorous analysis of data. For example, in her discussion of the increase in the age at first marriage among women in Africa, Hertrich argues that, in contrast to earlier generations, there is now a “recognition of a social status for women other than that of wife and mother” (Hertrich, 2002:12). In the two sections that follow we focus on factors, which may be associated with changes in age of marriage, that we are able to address more systematically—namely, education and labor force participation.10
TABLE 7-9 Percentage of Women Ages 20-24 Ever Married by Age 18, by Household Economic Status and Regiona (Weighted Averages)
|
Region |
Population Represented |
Low (bottom 40%) |
Middle (mid 40%) |
High (top 20%) |
|
Africa |
||||
|
Eastern/Southern Africa |
91.7 |
44.6 |
37.1 |
23.6 |
|
Western/Middle Africab |
75.2 |
61.4 |
42.5 |
24.0 |
|
Asia |
||||
|
Former Soviet Asia |
68.4 |
19.0 |
13.8 |
13.3 |
|
Latin America and Caribbean |
||||
|
Caribbean/Central America |
21.0 |
49.6 |
32.3 |
15.5 |
|
South Americac |
72.4 |
31.6 |
19.6 |
14.1 |
|
TOTAL—All DHS |
70.9 |
44.7 |
32.4 |
20.2 |
|
aThese tabulations do not include countries with ever-married samples, since there is no all women weight for socioeconomic status. Thus the Middle East and South-central and South-eastern Asia are excluded. bGabon is excluded; data on women unavailable at time of this analysis. cParaguay excluded; no asset data available. NOTES: For source of regional groupings and population data for weighted averages, see Table 7-1. Further detail can be found in Appendix A. SOURCES: Demographic and Health Surveys tabulations from 38 countries, 1990-2001. See Appendix Table 7-4 for list of countries. |
||||
TABLE 7-10 Percentage of Women Ages 20-24 Ever Married by Age 18, by Rural-Urban Residence and Region (Weighted Averages)
|
Region |
Population Represented |
Rural |
Urban |
|
Africa |
|||
|
Eastern/Southern Africa |
91.7 |
41.0 |
25.3 |
|
Western/Middle Africaa |
75.2 |
52.2 |
30.1 |
|
Asia |
|||
|
South-central/South-eastern Asia |
86.0 |
48.4 |
24.3 |
|
Former Soviet Asia |
68.4 |
17.9 |
13.9 |
|
Latin America/Caribbean |
|||
|
Caribbean/Central America |
21.0 |
44.5 |
27.6 |
|
South America |
74.1 |
31.4 |
20.3 |
|
Middle East |
|||
|
Western Asia/Northern Africa |
54.8 |
28.3 |
16.7 |
|
TOTAL—All DHS |
59.8 |
44.4 |
23.9 |
|
aGabon excluded; data on women unavailable at time of this analysis. NOTES: For source of regional groupings and population data for weighted averages, see Table 7-1. Further detail can be found in Appendix A. SOURCES: Demographic and Health Surveys tabulations from 51 countries, 1990-2001. See Appendix Table 7-4 for list of countries. |
|||
Role of Education for Women
The increase in girls’ educational attainment during the last several decades is widely viewed as the primary cause for the delay in marriage of women (Mathur, Greene, and Malhotra, 2003; United Nations Commission on Population and Development, 2002). In discussions of the positive association between education and age at marriage of women, the autonomy-enhancing effect of school is generally emphasized (Lloyd and Mensch, 1999). While empirical validation of the particular mechanisms is lacking, education is said to give young women greater influence over the timing of marriage and the choice of partner.
Education is also thought to broaden a girl’s perspective on the world, increasing her aspirations and providing her with a more Western outlook on life (Lloyd and Mensch, 1999). Finally, there is a suggestion that education lengthens the marriage search process because of a general tendency for women to marry higher status men (Lloyd and Mensch, 1999).
A purely mechanistic reason exists for the association between education and marriage; school in most countries is incompatible with marriage and childbearing as a matter of policy. However, only in early-marrying societies can such policies influence age at marriage (Lindstrom and Brambila Paz, 2001). While it is frequently asserted that early marriage
TABLE 7-11 Percentage of Men Ages 20-24 Ever Married by Age 20, by Years of Schooling, Rural-Urban Residence, Household Economic Status, and Region (Weighted Averages)
|
Category |
South America |
Caribbean/Central America |
Eastern/Southern Africa |
Western/MiddleAfricaa |
|
Years of Schooling |
||||
|
0-3 |
20.7 |
24.6 |
20.9 |
21.0 |
|
4-7 |
18.0 |
30.9 |
16.7 |
14.5 |
|
8+ |
10.0 |
13.9 |
6.5 |
6.0 |
|
Residence |
||||
|
Rural |
13.4 |
26.5 |
15.5 |
16.0 |
|
Urban |
14.0 |
18.2 |
8.2 |
5.1 |
|
Socioeconomic Status |
||||
|
High |
8.7 |
15.0 |
5.3 |
4.7 |
|
Middle |
12.2 |
22.6 |
13.6 |
11.6 |
|
Low |
19.8 |
25.4 |
21.1 |
18.5 |
|
Population Represented |
60.3 |
13.7 |
69.5 |
75.5 |
|
aGabon included only for residence; missing schooling and household data on men. Niger excluded from schooling; no respondents ages 20-24 with 8 or more years of schooling. NOTES: For source of regional groupings and population data for weighted averages, see Table 7-1. Further detail can be found in Appendix A. SOURCES: Demographic and Health Surveys tabulations from 29 countries, 1994-2001. Insufficient data to aggregate by region for Asia and Middle East, which are excluded. See Appendix Table 7-5 for list of countries. |
||||
deprives girls of educational opportunities, widespread evidence that they are withdrawn from school to marry is lacking, except perhaps in such early-marrying countries as Bangladesh, where girls leave school if an appropriate marriage partner is found (Amin, Mahmud, and Huq, 2002). For the most part, countries in which considerable proportions of young women marry at young ages are the same ones in which educational attainment is low. Hence for most women there is likely to be a distinct gap between school leaving and the earliest ages at which marriage might occur. Figure 7-1 shows, for seven countries for which data are available, that a sizeable lag exists between school leaving and marriage not only among young men but also among young women.11 These graphs, based on questions on current status, compare transitions out of school and into marriage from ages 10 to 29 using census data from the end of the 1990s, providing a rough indicator of the number of years between school leaving and marriage. For example, in Kenya for girls, there is approximately a three-year gap between the age at which 50 percent are out of school and 50 percent are married. In Iran there is a five-year gap, and in China over a six-year gap.
Not only is the link between the transition out of school and into marriage not particularly close for most countries, but also an examination of DHS data indicates that there is not as tight an association between trends in education and age of marriage as one might expect given the emphasis in the literature on the dominant role of educational change as a cause of nuptiality change. Indeed, the region with the largest increase in educational attainment among young people—South-central and Southeastern Asia—is not the region with the largest decline in early marriage. Moreover, while years of schooling have increased in Latin America in the last few decades, almost no change has occurred in age at marriage.
An analysis of the change in the percentage of women ages 20-24 and 40-44 married by age 18 as a function of the change in grades of school attained in 49 DHS countries indicates a weaker association (R = −.46) than
|
11 |
Large public use samples from the two most recent censuses for Mexico (1990 and 2000), Kenya (1989 and 1999), and Vietnam (1989 and 1999) are available from the Integrated Public Use Microdata Series (IPUMS) International web site at the University of Minnesota (http://www.ipums.umn.edu). We also use the 1990 and 2001 surveys of Brazil’s Pesquisa Nacional por Amostra de Domicilios (PNAD); the 1993 South Africa Integrated Household Survey, SALDRU/World Bank, and September 2000 South Africa Labour Force Survey, Statistics South Africa, courtesy of David Lam (University of Michigan); the Child Health and Nutrition Survey in China from 1989 and 1997, courtesy of Emily Hannum (University of Pennsylvania); the 1987 Social and Economic Survey of Households, Statistical Center of Iran, and 1998 Household Expenditure and Income Survey, Statistical Center of Iran, courtesy of Djavad Salehi-Isfahani (Virginia Polytechnic University). |
one might expect, given the determining power often attributed to educational change (Mensch, Singh, and Casterline, 2005). Furthermore, a regression analysis of the amount of intercohort change in early marriage that might be expected to follow from the intercohort change in educational attainment in 39 DHS countries reveals that, in 15 countries, the expected change exceeds the observed change. That is, the magnitude of the decline in early marriage between cohorts is less than would be expected given the increase in schooling (see Mensch, Singh, and Casterline, 2005, for a detailed description of the methodology and findings).12 Indeed, in about half of these 15 countries, the probability of early marriage actually increases between cohorts despite the increase in schooling.
The pattern in the majority of countries, however, is that the percentage marrying at early ages declined from the older to the younger cohort, and this observed decline exceeds the expected decline. The regional differences are considerable. In Latin America and the Caribbean, the expected decline in early marriage following from increased schooling far exceeds the actual decline. In many of these countries, of course, the probability of early marriage has not changed. Perhaps there is a threshold beyond which increased schooling is not associated with a change in age of marriage. By contrast to Latin America, for about two-thirds of sub-Saharan African countries, half or more of the decline in early marriage can be linked to increased schooling. In sum, the rise in schooling hardly appears to be the entire story, although in sub-Saharan Africa a substantial fraction of the reduction in early marriage is associated with the expansion in education.
Links with Women’s Labor Force Participation
Not only is increased schooling widely believed to contribute to the delay in marriage among young women, but also access to wage employment is frequently cited in discussions of rising age at marriage (Mathur, Greene, and Malhotra, 2003). It seems logical that there are greater opportunity costs associated with marriage for young women who are in the paid labor force. Indeed, a daughter’s enhanced income-earning potential is ar-
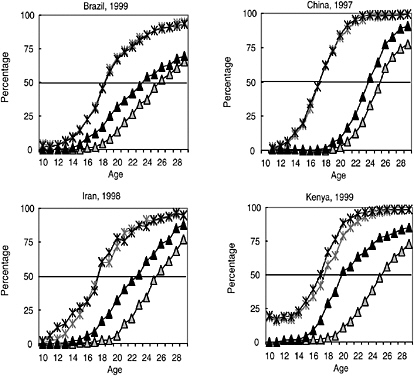
FIGURE 7-1 School and marriage status by single years of age, most recent year.
SOURCE: Large public use samples from most recent censuses for Mexico (2000), Kenya (1999), Vietnam (1999), available from IPUMS-International web site at the University of Minnesota (http://www.ipums.umn.edu). Also included are the 1999 survey of Brazil’s Pesquisa Nacional por Amostra de Domicilios (PNAD); the September 2000 South Africa Labour Force Survey, Statistics South Africa, courtesy of David Lam (University of Michigan); the Child Health and Nutrition Survey in China from 1997, courtesy of Emily Hannum (University of Pennsylvania); the 1998 Household Expenditure and Income Survey, Statistical Center of Iran, courtesy of Djavad Salehi-Isfahani (Virginia Polytechnic University).
gued to be a strong rationale for a parent’s willingness to postpone marriage (Jejeebhoy, 1995). In Bangladesh, for example, where purdah holds sway and cash employment outside the home has been extremely limited for women, adolescent girls who migrate from rural areas to work in the garment industry marry significantly later than their peers from the sending communities who have not had such opportunities (Box 7-1). While those who migrate are likely to be selective for certain characteristics predisposing them to later marriage, the differences in marriage rates are so great—31 percent of 20-24-year-old garment workers who were not married before beginning work married by age 18 compared with 71 percent of the same age group in the sending villages—that it suggests that the experience of work has been transformative for some (Amin et al., 1998).
Analyses of data from the World Fertility Surveys, in which, unlike in
the DHS,13 women were asked about the timing of work relative to marriage, indicate that, controlling for grades attained, women who worked prior to marriage wed later than those who did not work. While those who had jobs in the modern sector had the latest age at marriage, even those who worked in traditional occupations married later than those who did no work at all, evidence that it is not only longer exposure to the possibility of work that produces the association between labor force participation and age at marriage but also that women who work postpone marriage (United Nations, 1987).14
|
BOX 7-1 Since the first garment factory was established in Bangladesh in the late 1970s, the export of manufactured goods (especially garments) has expanded to become a principal component of the nation’s development strategy. By 1995, the number of factories operating in Bangladesh had grown from 700 in 1985 to 2,400 factories, employing approximately 1.2 million people, 90 percent of whom are women (Amin et al., 1998:186). The majority migrate from rural areas to work in the factories and are young and unmarried. Traditional Bangladeshi society is characterized by very early marriage and childbearing (Amin et al., 1998). However, a study conducted by Amin and colleagues (1998) examines how increased opportunities for young women’s labor force participation in Bangladesh may be delaying their age at marriage. In their interviews with young female factory workers, Amin et al. (1998) found that, for some, the decision to pursue factory work is part of a household strategy to improve the household’s economic situation. For others, it is a personal decision, made with parental permission, to avoid domestic work, to save for one’s dowry, or to delay early marriage. As one young factory worker explained: “I knew my father wanted to marry me off, so I went to my cousin who was a garment worker in Dhaka and had come home for a holiday and I told her I wanted to go with her to Dhaka” (Amin et al., 1998:191). Data from the study indicate that factory work appears to reduce the incidence of marriage for the young women surveyed. Of those women who were unmarried when they started factory work, only 31 percent of those ages 20-24, and 29 percent of those age 25-29, were married by the age of 18. The rates of early marriage for factory workers are much lower compared to their nonworking counterparts: the percentage of nonworkers from sending villages married by age 18 was 71 percent among 20-24-year-olds and 82 percent among 25-29-year-olds. For nonworkers from comparable nonsending villages, these percentages were 84 and 91, respectively. Factory work imparts adult skills, such as how to manage income, save money, and budget for expenses, even if young women may not have complete control over their earnings. It exposes adolescent girls to new information, social networks, and lifestyles and raises the opportunity costs of their time. According to Amin et al. (1998:197), “Garment work has direct implications for girls’ reproductive health by enabling them to delay marriage, and by motivating workers to delay childbearing even when they are married.” |
In the United States there is evidence from analysis of recent census data that better labor market conditions for young women reduce marriage rates (Blau, Kahn, and Waldfogel, 2000). Although it seems plausible that the increasing labor force participation of women may be a factor in later age at marriage among women in the developing world, such a causal link has not been established empirically. First, the necessary analysis has not been undertaken. Such analyses require time-series data of good quality and sophisticated econometric models to address the potential endogeneity biases. Not only is there an issue of reverse causality, noted above, whereby delayed marriage may increase the likelihood of entry into the labor force, but the same elements that predispose women to work may encourage later marriage. Second, there are several country examples that challenge an association between the expansion of paid work for women and delayed marriage. In Latin America, the labor force participation of women has risen (see Chapter 5) at the same time that age of marriage has remained fairly stable. In Egypt, the age of marriage has increased considerably while employment opportunities for women have declined substantially (Amin and Al-Bassusi, 2003). In Sri Lanka, employment has no bearing on a young women’s expected age of marriage; late age of marriage is desirable regardless of current work status (Malhotra and Tsui, 1996).
Explanations for Changes in Male Age at Marriage
If the increase in educational attainment dominates discussions of the rise in the age of marriage of women, what explanation is given for changes in young men’s age at marriage? In comparison to women, there is little research that examines the reasons for changes in marriage age for men. Some researchers offer similar explanations for men as for women arguing that the extended educational path taken by men in recent years in many countries may contribute to the rise in their age of marriage (Hertrich, 2002). Yet it is economic reasons that are commonly invoked as the primary reason for the delay in marriage of men (see, for example, Williams and Guest, 2002). For example, in Sri Lanka, with increasing industrialization, a man’s job status, which was not considered important in the past—particular where subsistence agriculture was the dominant form of economic life—is now said to be critical in determining when he marries (De Silva, 1997).
To the best of our knowledge, there are few studies that investigate the association between economic status—whether employment or income—and marriage patterns of men in the developing world. One notable exception is the work of Antoine and his colleagues (Antoine, Djire, and Laplante, 1995). Using hazard models, they compared age at marriage among three
birth cohorts in Dakar, Senegal, and found that the employment status of men had a significant impact on the likelihood of marriage. Moreover, while men of the earlier generation (born between 1930 and 1944) who were unemployed were equally likely to marry as their working counterparts, men in the younger cohorts (born between 1955 and 1964) who were unemployed were significantly and substantially less likely to marry. Apparently economic uncertainty was more a factor in the decision to marry for the younger generation than for the older generation.
There is some discussion in the literature, although for the most part not systematic analysis, that marriage has become more burdensome financially in the last several decades. In the case of African societies, the changing nature of bridewealth, with cash payments replacing payments in kind, is believed to be a contributing factor in delaying marriage of men because more time is needed to acquire the necessary sums and because the responsibility for payments is said to be shifting from the future husband’s extended family to the bridegroom himself (Enel, Pison, and Lefebvre, 1994; Isiugo-Abanihe, 1994; National Research Council, 1993: Chapter 3). (See the section below for a discussion of bridewealth.) More fundamentally, a transformation is said to have emerged in many societies in the nature of the household economy and concomitantly in the necessities essential for the establishment of a household. As has been argued for Indonesia, “the assumption in the past that marriage formed a basic productive economic unit for farming or trading, has been modified by the current requirement that basic consumption needs such as capital for a house, or consumer goods, and basic educational attainments must be achieved before a marriage can ‘wisely’ take place” (Hull, 2002:5).
In countries as diverse as Nigeria and Egypt, researchers have observed that the cost of marriage apparently factors much more into the decision about the timing of a man’s marriage than it did earlier. In Nigeria, the oil boom in the 1970s fueled a change in brides’ expectations of what purchases grooms needed in order to marry (National Research Council, 1993: Chapter 3). In Egypt, where housing, furniture, and appliances are required for marriage and “the bulk of financial obligations … are still borne … by the groom and his family,” the cost of marriage is estimated to have increased dramatically in the last 30 years (Singerman and Ibrahim, 2003:97). While there has not been a rigorous analysis linking the cost of setting up a household with the timing of marriage in Egypt, the fact that the proportion of individuals in the census marriage registration category, katb al-kitaab, in which the marriage is registered but the couple has yet to establish a marital residence, increased fourfold between 1986 and 1996, while the annual rate of marriage barely changed, is an indirect indication that rising costs have lead to a delay in the ceremony (Singerman and Ibrahim, 2003). While this piece of evidence does not firmly establish a link between
the rise in the age of marriage and the costs of marriage, there is enough anecdotal data from Egypt and responses from surveys about the financial burdens of marriage to warrant further investigation.
Perhaps increasing exposure to Western media has altered consumer norms and raised the expectations of young people worldwide, so that men feel obligated to postpone marriage until they have acquired the resources needed to establish a household. Given the current numbers of young people in the developing world and the difficulty of ensuring adequate employment opportunities, one can imagine a scenario in which postponement of marriage among men until their 30s or beyond could become more commonplace. The question is whether the rising cost of establishing a household affects the timing of marriage for most young men, or whether, perhaps, those who are worse off are paradoxically less constrained financially and marry at younger ages.
It is also worthwhile considering whether late marriage is viewed as desirable by young men who may be frustrated by their inability to establish a household, even if that inability stems from rising expectations and not from declining economic circumstances. Furthermore, although marriage in no way imposes sexual exclusivity on men, it is very likely that a postponement in the age at marriage leads to increases in the number of sexual partners before marriage and therefore greater exposure to HIV and other sexually transmitted infections.15
Not only might delayed marriage among men be considered by some to be problematic but also, given the increasingly distorted sex ratios at birth in some Asian countries as a result of a strong preference for male offspring and sex-selective abortion, there is speculation that substantial numbers of men will never marry. Referred to by the Chinese as “bare branches,” that is, “male branches of a family tree that would never bear fruit because no marriage partner might be found for them,” these men are said to be a destabilizing force in society (Hudson and den Boer, 2002:11). Hudson and den Boer, two political scientists who have examined this phenomenon, are alarmed about the destructive consequences for India and China, as well as “the nations of the world,” of large numbers of unmarried men (Hudson and den Boer, 2002:12):
Theory suggests that compared with other males in society, bare branches will be prone to seek satisfaction through vice and violence, and will seek to capture resources that will allow them to compete on a more equal
footing with others. These theoretical predictions are substantiated by empirical evidence so vast and so compelling as to approach the status of social science verity.
While there is no historical precedent on a national scale for as distorted a sex ratio as China currently has, it is not clear that the situation is as dire as Hudson and den Boer make out. First, according to the UN Population Division, the sex ratio at birth in China is currently estimated to be 1.09 rather than the more normal 1.05, hardly that calamitous.16 Second, Chinese men may respond by delaying rather than forgoing marriage; they also may be more likely to choose spouses outside the standard age range. Finally, as women become scarce, the hope is that their value will rise and the sex ratio will adjust.
THE TERMS AND CONDITIONS OF MARRIAGE
While there is a considerable body of literature on the timing of marriage, much less research exists on the terms and conditions of marriage and how they vary by age of the woman at marriage and over time. In particular, little is known about changes in the entry into marriage—the process of acquiring a spouse and the financial exchanges between families—and the nature of marital relations among those newly wed. Yet the marriage experience is at the very core of gender dynamics in most societies. In this next section we review the existing literature on this subject and summarize what little is known about the marital process and marital life for young people in the developing world and how they have changed in recent years.
Age Differences Between Spouses
The magnitude of the age gap between spouses is often regarded as a measure of equity in marriage (Amin and Cain, 1997; Cain, 1984). An analysis of World Fertility Survey data from 28 countries found that the age gap is more likely to be small in countries in which women have relatively high status, there is a bilateral kinship structure (i.e., descent is traced through both parents), and there is neolocal residence following marriage (i.e., the newly married couple lives independently rather than with the relatives of either the wife or the husband). Interestingly, demographic determinants of the age gap, such as the age structure of the pool of potential matches, would appear to matter less than fundamental features of the marriage and family system, suggesting there are clear preferences with
regard to age differences (Casterline, Williams, and McDonald, 1986:13). Although there is very little documentation of the effects of a large age gap on a young bride and it is difficult to disentangle social-structural factors that are a consequence of a large age difference from those that are determinants (Casterline, Williams, and McDonald, 1986), it is reasonable to assume that adolescent girls with much older partners are hindered in their capacity to negotiate with their spouses about sex and reproduction as well as other aspects of domestic life.
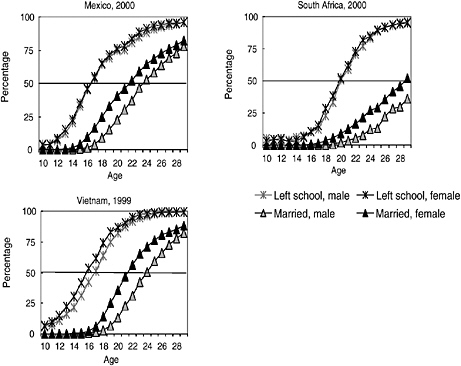
Previous analyses of survey data in developing countries indicate that the age difference between spouses is inversely related to the wife’s age at marriage, even after controlling for education (Mensch, 1986; Mensch, Bruce, and Greene, 1998). Figure 7-2a summarizes recent DHS data on age differences between spouses by age of marriage of the wife. Note that this analysis is restricted to currently married women ages 25-34 because the question on the age of one’s spouse or partner is asked only of women who are married at the time of the survey. Note also that the analysis is restricted to those in first marriages, because higher order marriages tend to take place at older ages well after the transition to adulthood has taken place. The graph confirms that women who marry prior to age 18 are more likely to have spouses who are older. It also shows that there is as much, if not more variation among regions as within regions by age. Age differences are largest in Western and Middle Africa, where polygyny is still common and teenagers often become junior wives of older men. Age differences are smallest in the former Soviet Asia.
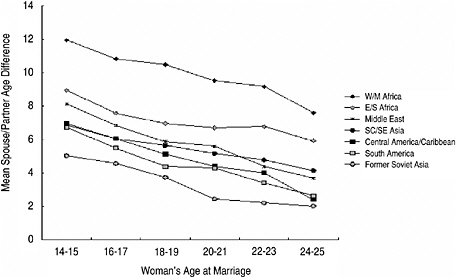
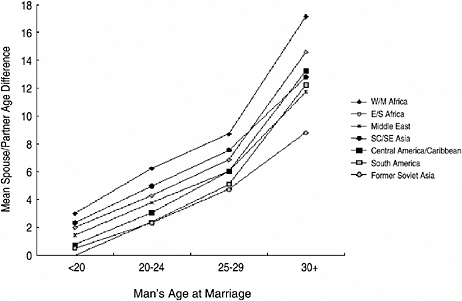
Figure 7-2b presents parallel data from the DHS but instead plots age differences as a function of male age at marriage for the same sample of women. As Casterline, Williams, and McDonald (1986) observed nearly 20 years ago in their analysis of World Fertility Survey data, age differences vary much more as a function of male age at marriage than of female age at marriage because of the greater variance in male age at marriage. Note, however, that no new information is actually provided by this graph, since male age at marriage is equal to female age at marriage plus the age difference. Nevertheless, these findings are broadly consistent with a model in which men accept or choose from a limited age range of marriageable women irrespective of their own age. In some regions, older grooms actually marry younger brides than do younger grooms, possibly a consequence of arranged marriage.
Given that there has been an increase in age of marriage for both men and women in most regions of the world, it is not obvious what the trends are with regard to age differences. In her analysis of data from 55 of 56 African countries17 over the last 50 years, Hertrich (2002) notes a decline in
the difference between male and female median age of marriage.18 She observed that the age difference, while inversely correlated with woman’s age at marriage for the last 40 years and positively correlated with male age at marriage from the mid-1950s through the end of the 1970s, is now not associated with male age at marriage. Quisumbing and Hallman (2005), in their examination of International Food Policy Research Institute (IFPRI) survey data, observed a decrease in the age difference between spouses in Bangladesh,19 Ethiopia, Mexico, and Guatemala, and no change in the Philippines and South Africa, countries in which the age gap between husbands and wives was not large to begin with.20
Table 7-12 compares the distribution of spouse or partner age differences from 42 DHS countries by two age groups, 25-29 and 45-49, among women currently in first marriages. There are two potential problems with this analysis. First, although the vast majority of those ages 25-29 who will eventually marry have already done so, in certain regions first marriage does extend into the 30s or later. Given that the age gap between spouses is inversely related to age at marriage, the distribution of spousal age differences observed here for the younger group may be slightly biased upward in countries in which substantial numbers of women marry late.
Second and more significantly, the sample of 45-49-year-olds is unlikely to be representative of all ever-married 45-49-year-olds in regions in which marital dissolution is considerable. The last column of the table indicates the percentage of ever-married women who are currently in a first marriage by age group. There is a considerable range. While 90 percent of ever-married women ages 45-49 in the Middle East are currently married, only 52 percent of their counterparts in Eastern and Southern Africa are. Not only are there a number of regions with a substantial percentage of ever-married women not in a first marriage, but also the sample of those who are in first marriages is likely to be selective. Women ages 45-49 who are still in first marriages at the time of the survey are likely to have spouses closer in age to themselves than women who are widowed. Moreover, if
TABLE 7-12 Percentage Distribution of Spouse/Partner Age Differences, Among Women Currently in First Marriage, by Age (Weighted Averages)
|
Region |
Population Represented |
0-5 Years |
|
|
45-49 |
25-29 |
||
|
Africa |
|||
|
Eastern/Southern Africa |
79.2 |
47.4 |
51.9 |
|
Western/Middle Africa |
66.9 |
29.2 |
31.7 |
|
Asia |
|||
|
South-central/South-eastern Asia |
67.6 |
52.2 |
53.9 |
|
Former Soviet Asia |
68.4 |
74.4 |
84.5 |
|
Latin America and Caribbean |
|||
|
Caribbean/Central America |
21.0 |
63.3 |
61.3 |
|
South America |
72.4 |
68.6 |
66.2 |
|
Middle East |
|||
|
Western Asia/Northern Africa |
40.7 |
54.2 |
53.9 |
|
TOTAL |
64.2 |
51.9 |
53.5 |
|
NOTES: All cases where the woman is reported as older than her husband are included in the 0-5 category. For source of regional groupings and population data for weighted averages, see Table 7-1. Further detail can be found in Appendix A. |
|||
there is an inverse relationship between the stability of marriage and the spousal age gap, then the mean age difference observed for women ages 45-49 who are currently in a first marriage will be lower than that for all ever-married women ages 45-49.
Comparing age differences among 45-49-year-olds with 25-29-year-olds indicates a narrowing of the gap over time, especially in Eastern and Southern Africa, Western and Middle Africa, the Middle East, and South-central and South-eastern Asia, where there has been a decline in the proportion of women marrying men more than 10 years older, and an increase, in Eastern and Southern Africa, in the proportion of women with an age gap of 5 years or less. Age differences, which were already small in former Soviet Asia, are also narrowing. As discussed above, it is likely that the table underestimates the decline in age differences, because the percentage of women ages 45-49 with an 11+ age difference is undoubtedly larger than observed.
That age differences are shrinking is a function of the fact that the pace of decline in marriage prevalence by age is greater among women than men. For example, in Jordan there has been a sizeable reduction in the age difference between spouses; only 11 percent of women ages 25-29 are
|
6-10 Years |
11+ Years |
% Ever Married Who Are Currently in a First Marriage |
|||
|
45-49 |
25-29 |
45-49 |
25-29 |
45-49 |
25-29 |
|
28.3 |
30.9 |
24.3 |
17.3 |
52 |
71 |
|
25.8 |
34.6 |
45.0 |
33.7 |
64 |
80 |
|
28.9 |
34.2 |
18.9 |
11.9 |
88 |
95 |
|
19.6 |
13.3 |
6.0 |
2.2 |
73 |
86 |
|
23.3 |
24.6 |
13.5 |
14.1 |
68 |
76 |
|
20.2 |
23.4 |
11.2 |
10.3 |
66 |
84 |
|
28.2 |
33.4 |
17.6 |
12.7 |
90 |
96 |
|
27.3 |
32.0 |
20.9 |
14.4 |
|
|
|
SOURCES: Demographic and Health Surveys tabulations from 42 countries, 1994-2001. Côte d’Ivoire, Indonesia, Morocco, Namibia, Pakistan, Paraguay, Senegal, Tanzania, and Yemen excluded; surveys had no question regarding current age of spouse. Gabon data unavailable at time of this analysis. See Appendix Table 7-6 for list of countries. |
|||||
married to men more than 10 years their senior, whereas 21 percent of women ages 35-39 have husbands who are that much older. The proportion of women ages 20-24 who are married dropped from 64 to 48 percent between 1979 and 1994, whereas the proportion of men ages 25-29 who are married declined only from 66 to 58 percent during that period.
More research is needed on the association between the spousal age gap and how marriage is experienced by the couple, especially in situations in which a young wife is married to a much older man. When gender roles are highly segregated and the vast majority of wives lack power relative to their husbands, it is not clear whether most women would choose a younger husband with whom they might have a slightly better bargaining position over an older man who was better off financially. In addition, when the age gap between a husband and a wife is large, there has been little attempt to analyze whether it is the early age at marriage that limits a woman’s ability to influence or share decision making with her spouse, whether it is the large age difference between the woman and her husband, or whether it is some other factor altogether. Indeed, one would think that when the age gap between spouses has remained constant or declined only minimally and the age of marriage of women has risen, the significance of the gap is likely
to have diminished. A 15-year-old woman marrying a 25-year-old man probably has a lesser role in household decision making than a 25-year-old woman marrying a 35-year-old man.
Polygyny
Polygyny is one of the distinctive features of marital regimes in sub-Saharan Africa, especially in Western Africa. Polygynous unions are typically characterized by a large age gap between spouses, with women marrying young and men delaying marriage until at least their 20s, when they are able to acquire bridewealth. More common in societies with patrilineal descent systems and in which traditional religion holds sway, the prevalence of polygyny is expected to decline with increasing urbanization, schooling, and exposure to the West (Timaeus and Reynar, 1998).
An analysis of trends in polygyny in sub-Saharan Africa from the mid-1970s through 1996 revealed little change in the proportion of married women in polygynous unions; among 11 countries with multiple surveys, only Ghana and Kenya exhibited large declines, although there is some indication that the practice was also waning in Côte d’Ivoire, Rwanda, and Uganda (Timaeus and Reynar, 1998).
In Table 7-13 we have updated this analysis. We have added 19 surveys conducted since 1997 to the original 39 (in 25 countries). Multiple surveys are now available for 20 countries. Declines are observed in Cameroon, Côte D’Ivoire, Ghana, Kenya, Malawi, Nigeria, Rwanda, and Togo. Aggregate analyses of all married women ages 15-49 may obscure changes that could be occurring among younger women.
Table 7-14 provides information on the prevalence of polygyny for married women ages 20-29. Note that because women are more likely to be part of a polygynous union as they age, to detect change over time, one should compare across surveys but not age groups. Of the 20 countries with multiple surveys, the incidence of polygyny has declined in about half: Benin, Cameroon, Ghana, Kenya, Madagascar (where it was already very low), Malawi, Mali (possibly), Nigeria, and Togo.
The DHS data indicate that, even with these declines, polygyny is still a prominent element of marriage in sub-Saharan Africa. The social linkages that marriage creates and the economic gain and prestige that polygynous alliances imply for extended families apparently far outweigh the costs to individual women (Blanc and Gage, 2000). However, the practice has evolved over time. Noncoresidential arrangements for wives have emerged, particularly among the wealthy in urban areas (Antoine and Nanitelamia, 1996; Locoh, 1994; Wittrup, 1990).
In addition, while polygyny was traditionally practiced by the relatively affluent, there is the emergence of what has been termed “the polygyny of
TABLE 7-13 Percentage of Currently Married Women in Polygynous Unions in Sub-Saharan Africa
|
Country |
WFS 1977-1982 |
DHS-I 1986-1990 |
DHS-II 1990-1993 |
DHS-III 1993-1996 |
DHS-III 1997-1999 |
DHS-IV 1998-2001 |
|
Benin |
34.6 |
|
|
49.6 |
|
46.3 |
|
Burkina Faso |
|
|
51.1 |
|
54.7 |
|
|
Burundi |
|
11.6 |
|
|||
|
Cameroon |
39.7 |
|
38.6 |
|
33.1 |
|
|
Central African Republic |
|
28.5 |
|
|||
|
Côte d’Ivoire |
41.4 |
|
|
36.6 |
35.0 |
|
|
Ghana |
34.4 |
32.6 |
|
27.7 |
|
22.7 |
|
Guinea |
|
49.6 |
|
53.7 |
||
|
Kenya |
29.5 |
23.4 |
|
19.5 |
16.3 |
|
|
Lesotho |
8.5 |
|
||||
|
Liberia |
|
38.0 |
|
|||
|
Madagascar |
|
|
3.5 |
|
4.0 |
|
|
Malawi |
|
32.2 |
|
17.2 |
||
|
Mali |
|
45.1 |
|
44.3 |
|
|
|
Namibia |
|
12.6 |
|
|||
|
Niger |
36.2 |
|
37.6 |
|
||
|
Nigeria |
43.1 |
|
40.9 |
|
35.7 |
|
|
Rwanda |
18.4a |
|
14.4 |
|
12.3 |
|
|
Senegal |
48.5 |
46.5 |
47.3 |
|
46.0 |
|
|
Sudan (Northern) |
16.8 |
20.2 |
|
|||
|
Tanzania |
|
27.5 |
28.8 |
|
||
|
Togo |
|
52.3 |
|
43.5 |
|
|
|
Uganda |
34.2 |
|
29.9 |
|
32.7 |
|
|
Zambia |
|
17.7 |
17.1 |
|
||
|
Zimbabwe |
|
16.6 |
|
18.6 |
|
15.5 |
|
aNot a WFS survey although it had a similar design and questionnaire. SOURCES: Timaeus and Reynar (1998) and Demographic and Health Surveys tabulations from 1986-2001. |
||||||
TABLE 7-14 Percentage of Currently Married Women Ages 20-29 in Polygynous Unions in Sub-Saharan Africa
|
County and Year of Survey |
Ages |
|
|
20-24 |
25-29 |
|
|
Benin 1996 |
39.0 |
46.2 |
|
Benin 2001 |
32.8 |
41.7 |
|
Burkina Faso 1992-1993 |
40.5 |
50.4 |
|
Burkina Faso 1998-1999 |
43.4 |
48.6 |
|
Cameroon 1991 |
31.6 |
36.1 |
|
Cameroon 1998 |
25.4 |
29.5 |
|
Côte d’Ivoire 1994 |
27.3 |
34.2 |
|
Côte d’Ivoire 1998-1999 |
27.0 |
27.5 |
|
Ghana 1988 |
25.5 |
28.5 |
|
Ghana 1993 |
18.9 |
21.7 |
|
Ghana 1998 |
13.2 |
15.8 |
|
Kenya 1989 |
17.8 |
17.7 |
|
Kenya 1993 |
12.6 |
15.2 |
|
Kenya 1998 |
9.2 |
15.0 |
|
Madagascar 1992 |
6.8 |
7.0 |
|
Madagascar 1997 |
4.2 |
4.2 |
|
Malawi 1992 |
13.0 |
22.1 |
|
Malawi 2000 |
11.3 |
18.1 |
|
Mali 1987 |
36.0 |
39.7 |
|
Mali 1995-1996 |
30.0 |
40.6 |
|
Niger 1992 |
26.1 |
36.0 |
|
Niger 1998 |
29.2 |
36.7 |
|
Nigeria 1990 |
33.7 |
35.8 |
|
Nigeria 1999 |
26.5 |
30.6 |
|
Rwanda 1992 |
8.4 |
9.8 |
|
Rwanda 2000 |
8.0 |
9.1 |
|
Senegal 1986 |
33.2 |
41.0 |
|
Senegal 1992-1993 |
33.1 |
42.6 |
|
Senegal 1997 |
35.0 |
42.5 |
|
Tanzania 1992 |
18.6 |
27.4 |
|
Tanzania 1996 |
20.1 |
27.3 |
|
Togo 1988 |
39.9 |
51.1 |
|
Togo 1998 |
28.6 |
37.8 |
|
Uganda 1988 |
31.8 |
32.4 |
|
Uganda 1995 |
23.2 |
32.0 |
|
Uganda 2000-2001 |
25.5 |
31.9 |
|
Zambia 1992 |
10.8 |
17.3 |
|
Zambia 1996 |
10.0 |
16.6 |
|
Zimbabwe 1988 |
11.7 |
14.0 |
|
Zimbabwe 1994 |
12.4 |
18.2 |
|
Zimbabwe 1999 |
14.8 |
15.2 |
|
SOURCE: Demographic and Health Surveys tabulations from 1987-2001. |
||
poverty” (Antoine and Nanitelamia, 1996), which refers to the situation in which a man who does not have the means to take on another wife marries a woman involved in a remunerative activity. In so doing, a relatively poor man can acquire the social prestige that comes with additional wives without having to assume the responsibility for her economic well-being.
Finally, new arrangements, referred to as having “outside wives” (Karanja, 1994; Mann, 1994), “away matches,” or “le deuxième bureau” (Clignet, 1987), serve as functional substitutes without the same degree of commitment that polygyny entails. These have been attributed in part to economic constraints that make it difficult for men to afford the bridewealth for more than one wife. Indeed, in Lesotho, men ascribe the emergence of the institution of bonyatsi (that is, extramarital relations of a more or less long-term nature) to the escalating costs of bridewealth payments (Speigel, 1991). Because polygyny appears to be thriving in these alternative forms, data on changes in its prevalence may not be reliable.
The changing nature of polygyny among some groups is not only a reflection of difficult economic circumstances that make it hard for men to support more than one wife (Solway, 1990), but also a manifestation of cultural persistence. There is even some evidence of a return to polygyny among intellectuals who practiced monogamy earlier in life but now reject it at later stages as “an external imposition not adapted to African realities” (Antoine and Nanitelamio, 1996; see also van der Vliet, 1991). In justifying a polygynous lifestyle, men tend to emphasize the sexual aspects of the practice with less consideration for the traditional economic obligations involved in maintaining several wives and numerous children (Ferraro, 1991; van der Vliet, 1991; Wittrup, 1990).
While there is a large literature on the distinctive features of polygyny and the characteristics of those who are in a polygynous union (see, for example, Bledsoe and Pison, 1994: Section IV), less is known about the experiences of young married women in polygynous unions. What is married life like for a young woman who becomes a junior wife to an older husband? How does she relate to the senior wife? Does the adolescent girl have any say in the decision to enter or remain in a polygynous union?
Spousal Choice
As discussed in Chapter 1, our conception of a successful transition to adulthood recognizes the value of increased agency as adolescence progresses. In the domain of marriage, this agency takes the form of participation in the choice of partner and the timing of the union. An emphasis on the involvement of the young person in the marriage process is consistent with an emerging international consensus. Article 16 of the UN Convention on the Elimination of All Forms of Discrimination Against Women includes
the right to choose a spouse and to enter marriage with “free and full consent.” In December 2003, Pakistan’s highest court legalized so called free-will marriages21; the ruling enables women 18 and older to marry without obtaining the consent of a parent or guardian.
One potential factor contributing to the reduction in early marriage among women is a movement away from arranged marriages (Hull, 2002; Malhotra and Tsui, 1996). Hull (2002:8) asserts for Indonesia that the increase in the age of marriage “has come about due to the shift of the locus of marriage decision making from parents to children,” which he attributes, in turn, to the expansion in educational attainment among young women. It is generally believed that the process of parental selection is simply less time-consuming than that of individual searching. Furthermore, when parents are involved in spouse selection, it is argued that daughters are married off early because of a concern with preserving their sexual purity. Indeed, one frequently cited reason for parental involvement in spouse selection is that, in allowing a daughter to explore potential partners for herself, she is more likely to initiate sex before marriage. Another motivation for a parent involved in mate selection to marry a daughter off early is that girls are thought to be compliant in the choice of spouse when they are young (UNICEF, 2001b).
While it stands to reason that there is an association between age of marriage and the spouse selection process, little research exists linking the two. Moreover, even if there is a link, a rise in the age of marriage does not necessarily imply that the practice of arranged marriage is being eliminated (Malhotra and Tsui, 1996). Correspondingly, the absence of a shift in age of marriage does not necessarily signify that there has been no change in the process of spouse selection. Malhotra (1991:566), one of the few researchers who has investigated spouse choice found that, in Java, “younger cohorts are having considerable input into marriage decisions without also marrying considerably later.” And in Sri Lanka, those who choose their own spouses marry earlier than those who have arranged marriages, a finding that the researchers note is “relatively unusual among Asian societies” (Malhotra and Tsui, 1996:488).
While there is an extensive literature on the age of marriage of women, fewer studies have investigated parental control over spouse choice and how it may be changing. In fact it is the rare demographic survey that even includes questions that would permit an investigation of the process of spouse selection and how it differs by gender. The lack of current data has led some researchers to assume that arranged marriages are still the norm in
some parts of the world. An article on marriage in Kenya written in 2003 cites William Goode’s seminal volume on the family, which was published over 30 years ago, to buttress the claim that “[m]arriages were, and continue to be, arranged by relatives and friends in almost every African society” (Luke and Munshi, 2003:6).
Several surveys from 20-30 years ago included questions on the respondent’s role in spouse selection. The 1979-1980 Asian Marriage Survey—conducted in Indonesia, Pakistan, the Philippines, and Thailand among married women ages 15-45 and a sample of their husbands—included a question about who chose the spouse, although only in Indonesia, Pakistan, and the Philippines were these data analyzed and only in the former two were there substantial proportions in some form of arranged marriages. There were four response categories: totally initiated and arranged by a parent, by a parent with the respondent’s approval, by the respondent with a parent’s approval, and totally initiated and arranged by the respondent (Domingo and King, 1992; Malhotra, 1991). In a longitudinal survey in the Kautara district of Sri Lanka in 1989 and 1992-1993, in addition to a question on who was the main decision-maker in spouse selection, there were more probing questions on parental involvement in the process, parental objection to the spouse (if the respondent did the choosing), and whether the respondent was consulted (if the parent did the selection) (Malhotra and Tsui, 1996).22
Why has there been relatively little interest in the spouse selection process among demographers in recent years? Perhaps because so much focus has been on the rise in age of marriage and its implications for the decline in fertility, a matter of critical importance to population researchers, other aspects of the nuptiality transition have been relatively neglected. Yet the part played by the potential bride and groom in choosing a spouse undoubtedly has consequences for conjugal relations, including gender roles in marriage and decision making between partners, especially decisions about the number, spacing, and upbringing of children. As Malhotra (1991:550) notes: “in cultures where marriages traditionally have been
arranged, the extent to which young people become independent of parents in choosing their life partners has implications for their obligations to the family, the financial and social support they can expect from parents, their postmarital residence, sexual activity and fertility behavior.”
The data that exist on the relative involvement of parents and young people in the selection of marriage partners suggest that in a number of societies in which arranged marriage was a common feature of the marriage process, there has been a movement in recent years toward self-choice. This decline in kin control or increase in a young woman’s involvement in mate selection has been documented with survey data in China (Feng and Quanhe, 1996; Whyte, 1990; Xiaohe and Whyte, 1990), Togo (Gage and Meekers, 1995), Indonesia (Malhotra, 1991), and India (Jejeebhoy and Halli, 2005), and asserted to be occurring throughout sub-Saharan Africa (Lesthaeghe, Kaufman, and Meekers, 1989; National Research Council, 1993:116-151) and parts of Asia (Choe, Westley, and Retherford, 2002). In Togo, the proportion of first marriages that were arranged declined from 37 percent in 1970 to 24 percent in the period 1980-1988, a trend that Gage and Meekers (1995) associate with increased education and urbanization. A survey in 1987 of nearly 600 women in Chengdu, China, the capital of Sichuan Province, revealed that arranged marriages, in which the couple often did not meet until the wedding day, declined from 69 percent of marriages between 1933 and 1948 to 1 percent in 1958-1965 to 0 percent in the 1980s. While the adoption of a new marriage law in 1950 outlawed arranged marriage, a “family revolution” was apparently beginning in urban areas in the several decades before the Communist takeover in 1949, due to greater exposure to the West (Whyte, 1990).
Bledsoe and Cohen (National Research Council, 1993:Chapter 3) argue that increasing wage labor in sub-Saharan Africa provides young men with a degree of independence from their family, giving them greater control over whom they marry. Banerjee (1999:8), in his discussion of contemporary marriage patterns, makes the same argument about India: “New opportunities for market employment altered the balance of power in the family and kinship system” and this “economic independence allowed adult children to acquire more power over spouse selection.” An ethnographic account of changing social norms with regard to marriage among the Orma of northeastern Kenya observed a shift in bargaining power in favor of young men and women; moreover, young women are now gaining support in both the civil and the Muslim courts against “forced” marriages (Ensminger and Knight, 1997).
Comparison of spouse selection patterns across cohorts in Indonesia, as noted above, reveals that both men and women—but particularly women, whose parents were traditionally more involved in spouse selection—are increasingly likely to choose their spouse. While family background and
education are significant determinants of spouse choice for women in Indonesia, only living away from the parental home before marriage is significant for men, evidence that status concerns are more important for daughters’ than sons’ marriages (Malhotra, 1991). Although cohort comparisons of the Asian Marriage Survey data in Pakistan have not been published, differentials among socioeconomic and residential groups suggest that, with increasing education and labor force participation of women prior to marriage, participation of daughters in the choice of husbands will rise (Domingo and King, 1992). The question is whether self-choice may increase even in the absence of changes in the economic role of women. As Malhotra (1991:559) observed for Indonesia, the increase in self-choice across cohorts is not simply a result of a transformation in the composition of the population; rather there are more “fundamental secular” changes at work. While she doesn’t specify what these changes are, increasing access to Western media, especially movies and magazines, undoubtedly plays a role in the movement toward self-choice.
The cross-cultural study of romantic love, described as a newly flourishing field in anthropology, is indirect evidence of the pervasive influence of Western ideas about romantic love that has emerged in recent years (Ahearn, 2001). Ahearn’s ethnographic study of a Nepalese village west of Kathmandu23 describes a shift away from arranged and capture marriages24 in the 1980s and 1990s and a movement toward love marriages (Box 7-2). Among men, approximately 20 percent of marriages between 1960 and 1982 in the village involved the son making his own choice, compared with over 60 percent of marriages between 1983 and 1998. Correspondingly, among women, about 10 percent of marriages in the earlier period involved the daughter selecting her spouse, compared with over 50 percent in the later period.25 Ahearn attributes this transformation to a dramatic increase in literacy during the last 20 years: 95 percent of married women born between 1937 and 1951 were illiterate, compared with 67 percent of those born between 1952 and 1962 and only 9 percent born after 1962. With this growth in formal schooling and literacy classes, the writing of love letters
|
BOX 7-2 “Life is an infinite circle … in the whole ‘world’ there must be few individuals who do not bow down to love. Sarita, I’m helpless, and I have to make friends of a notebook and pen in order to place this helplessness before you. Love is the sort of thing that anyone can feel…. Napoleon, who with bravery conquered the ‘world,’ united it, and took it forward, was astounded when he saw one particular widow. Certainly, history’s pages are colored with accounts of such individuals who love each other…. Love is the union of two souls. The ‘main’ meaning of loving is ‘life success.’ I’m offering you an invitation to love” (excerpt from a love letter written to Sarita from her eventual husband, Bir Bahadur, in spring 1992). As globalization proceeds, it brings many changes in terms of communication and culture. The spread of education and the availability of mass media and literature in remote places often create unanticipated cultural and social changes. In rural Nepal, literacy rates and formal education have increased, and magazines, books, and films from India and “the West” have become more accessible. Traditional courtship and marriage practices also appear to be changing. The interplay of these changes is evident in some areas of Nepal with the emergence of the courtship practice of writing love letters. In her ethnographic study of a rural village in Nepal, “Junigau,” Laura Ahearn’s (2001) findings indicate that the percentage of arranged marriages and capture marriages decreased significantly between 1960 and 1998, while the number of elopements rose sharply after 1983. Paralleling this trend, female literacy rates in Junigau increased sharply, from about 5 percent for women born before 1951, to 91 percent for those born after 1963 (2001). Ahearn argues that rising literacy rates coupled with increased access to magazines, radio, film, school texts, and other books have familiarized villagers with “new structures of feeling” about such concepts as nationalism, Hinduism, democracy, modernization, economic and educational success, romantic love, personal agency, and individual choice. According to Ahearn, not only did the increase in female literacy in Junigau in the 1990s make possible the emergence of new courtship practices and facilitated self-initiated marriages, but it also reinforced certain gender ideologies and undercut some avenues to social power, especially for women (2001). Ahearn’s research depicts how Junigau couples’ aspirations have shifted toward desires for companionate marriages and attitudes that women must consent to marriage. However, she maintains that coercion in marriage and existing gender hierarchies have not been eliminated, and that increased female literacy does not necessarily lead to more choices and better lives for men and women. A central message of Ahearn’s ethnography is that the social transformations taking place in Junigau involve changes in marriage practices facilitated by love letters and increased literacy, as well as changes in villagers’ conceptions of individual agency and personhood. |
and the practice of elopement increased markedly. The textbooks used in government schools and literacy classes as well as the film magazines that are now widely read appear to have exposed villagers to notions of romantic love and resulted in an increased sense of agency on the part of the younger generation.
Although mutual attraction clearly plays a more prominent role in spousal choice in many of the countries discussed above, for the most part data are lacking about whether a “dating culture”26 has replaced a system of arranged marriage. Whyte’s survey in Chengdu, China, is an exception; he did explore dating behavior, finding that the majority of women who married between 1977 and 1987 had only one romance, and that romance was with a future spouse prior to marriage (Whyte, 1990).
It would appear that the Western model of dating and total freedom of mate choice has yet to take hold in many developing countries. Indeed, to the extent that the young person is involved in the spouse selection process in countries in which arranged marriage was normative in the past, parents still play a role.27 In Indonesia, the marriage choice type showing the greatest increase is self-selection with parental approval (Malhotra, 1991). In Chengdu, China, while arranged marriages were no longer reported to exist in the late 1980s, parents were involved in spouse selection in over 40 percent of marriages (Whyte, 1990). In India, Banerjee (1999) does not believe that love marriages have replaced arranged marriages; rather, arranged marriage has been transformed from “an unconsented to a consented model.” A similar observation is made more recently for Indonesia by Hull (2002), for Taiwan by Thornton, Chang, and Lin (1994), and for Africa by Isiugo-Abanihe (1994) and Meekers (1993). This more nuanced categorization challenges simplistic notions of marriage systems as being either traditional—serving only the needs of the larger family—or modern, in which the conjugal bond leaves no room for parental involvement (Malhotra and Tsui, 1996).
In what way does a reduced role by the family in the spouse selection process affect the relationship between the bride and the groom? In countries in which arranged marriage used to be the norm, a move toward more individual choice is said to have had important implications for sexual behavior. Data from China, Korea, Malaysia, and Taiwan indicate that the
changing nature of partner selection beginning in the 1960s has been associated with an increase in premarital sex, a rise in coital frequency in the first years of marriage, and a corresponding decline in the first birth interval (Feng and Quanhe, 1996; Rindfuss and Morgan, 1983; Thornton et al., 1994). Indeed, Rindfuss and Morgan (1983:259-260) asserted some 20 years ago that “a very quiet sexual revolution has been occurring in Asia that may be more far reaching and profound than the very vocal sexual revolution that has been occurring in the West.” However, studies from Vietnam and Indonesia suggest that, when premarital sex is reported by women, it is more often sex with a future spouse rather than with a more casual partner (Hull, 2002; Mensch, Clark, and Anh, 2003).
Consanguineous Marriage
A marriage is generally designated as consanguineous if the couple shares one recent ancestor; generally the label is attached to marriages between second cousins or closer relatives (Bittles, 1994). Given that arranged marriages are said to be on the decline, one might expect a reduction in the proportion of young people who are in consanguineous unions, although the countries for which there is information on trends in consanguinity are not the same as those for which there is information on trends in arranged marriage. Surprisingly, according to the data available, the prevalence of consanguineous marriage appears to have changed little in recent years. A comprehensive analysis of survey data in the Middle East, Northern Africa, and Western Asia found that the proportion of first cousin marriages declined in only 3 of 18 countries, and then only slightly (Casterline and El-Zeini, 2003).28 One-fifth to one-half of all marriages in these populations is estimated to be consanguineous (Hussain and Bittles, 1999:449).
Sholkamy (2001) and Casterline and El-Zeini (2002) give several arguments as to why cousin marriage is still common in the Arab region. For the groom and his family, the financial burden is thought to be reduced when he marries a relative, since the bride and her family are presumed to make fewer demands for furniture and housing. For the bride, her treatment by the groom and his mother is thought to be better (Hussain and Bittles, 1999). Moreover, assets are consolidated when the wife marries in the family. In Southern Asia, where the burden of dowries is high (see discussion of dowry below), marriage to a relative is considered “a more eco-
nomically feasible choice” (Bittles, 1994:576). Perhaps the rationale provided by Casterline and El-Zeini that is most revealing of the day-to-day life of adolescents may also hold true in Southern Asia. They argue that a young person is more likely to form a romantic association with a cousin because opportunities to interact with nonrelatives of the opposite sex are rare.
Casterline and El-Zeini (2002:7) argue that, given the “compelling factors” favoring cousin marriage, “it is not surprising” that rates of consanguinity remain quite high. Alan Bittles, who has written more on this subject than any other researcher, agrees, observing that in the absence of legislation prohibiting the practice, the prevalence of marriages between relatives in those parts of the world in which it is common is unlikely to fall in the near future. He claims, however, that over the long term, a decline in family size should lead to a reduction in the pool of available relatives, as should the reduction in arranged marriages and the increase in age at marriage. Casterline and El-Zeini (2002) dispute this. They argue that, when fertility is high, competition for cousins is also high. With microsimulation, they show, in the demographic regimes they are considering—Egypt, Morocco, and Yemen—the availability of first cousins for marriage is affected more by declines in mortality than fertility.29
Because there is so little information about the nature of spouse relations, it is not known how marriages between relatives differ from marriages between those who are unrelated. There is an assertion that consanguineous unions are exploitative of women, because the family link is ostensibly much tighter than the conjugal bond when women marry kin (Hussain, 1999). However, it is not clear that the conjugal bond is any stronger in arranged marriages between nonrelatives. Furthermore, the claim that consanguineous relationships are particularly exploitative is entirely speculative and may be based on the fact that it is generally lower status women and those with less education who are more likely to marry relatives (Hussain and Bittles, 1998). One can as easily make an argument that consanguineous marriages are protective of women, since the wife is living among her own kin who presumably are more likely to be on the watch for abusive behavior from a spouse. Indeed, Dyson and Moore (1983), seeking to explain regional variations in demographic behavior in India in the 1970s, argued that, in consanguineous marriages, women have higher value to both their natal and their conjugal families, with a resulting increase in autonomy and quality of life and lower fertility and child mortality.
Financial Transfers: Bride-Price, Dowry, and Assets Brought to Marriage
In many developing countries, especially in Africa and Southern Asia, marriage has traditionally involved not only the selection of a mate by one’s family but also the transfer of gifts, cash, valuables, and consumer goods from the groom’s family to the bride’s or vice versa. When this transfer is from the bride’s family to the groom’s family, it is known as dowry or more precisely groom-price; when the transfer is from the groom’s family to the bride’s family, it is known as bridewealth or bride-price. The direction and amount of the transfer may affect the timing of marriage as well as the relationship between husband and wife, particularly in the early years of marriage, as well as, just as importantly given the nature of living arrangements, the relationship between the groom or bride and his or her spouse’s family.
The conventional explanation given for bride-price is that, in societies in which women do much of the agricultural work, this transfer, whether in cash or in kind, reimburses the bride’s family for the loss of her future labor (Amin and Cain, 1997; Boye et al., 1991). The explanation given for dowry is that it compensates men in societies in which women’s labor has little market value (Amin and Cain, 1997). Dowry has taken a somewhat different form in developing countries than it did in Western Europe historically, where it was considered a premortem inheritance for the bride (Billig, 1992). Whereas in Europe, the intended recipient of the dowry was the bride, in Southern Asia, the dowry is not given to the bride; rather, property and payments are transferred to the groom and his family. Billig (1992) and others thus argue that the correct expression for this transfer is not dowry, in the traditionally European sense, but groom-price.
By far, the more common form of exchange is from the groom’s family to the bride’s. Murdock’s Ethnographic Atlas indicates that, as of the early 1980s in approximately two-thirds of the 1,267 societies catalogued, bridewealth is normative, whereas dowry is prevalent in just 6 percent (cited in Bhat and Halli, 1999). However, the countries in which dowry is common have much larger populations. Moreover, the literature on dowry is more extensive, perhaps because the value of the transfer is much greater in dowry and therefore the impact on the parties involved that much more significant.
Bridewealth
In sub-Saharan Africa, where bride-price dominates, it traditionally took the form of gifts of food and drink (van de Walle and Meekers, 1994). For example, among the Kassem and Nankam of northern Ghana, kola nuts and guinea fowl were given by the boy to the girl’s family as part of the
courtship process to signal his intention to marry their daughter (Mensch et al., 1999). However, according to van de Walle and Meekers (1994:62), while ritual gifts of drinks and kola nuts are known to be common in Western Africa, “we know of no systematic ethnography of the custom.”
It would appear, from the little research that has been conducted, that this giving of gifts by the man to the family of the woman is becoming less customary in sub-Saharan Africa. “Education, urban living, and the importance of mutual consent in unions have all played roles,” as has the rise of “imported forms of civil or religious marriage (which clearly involve a ceremony)” (van de Walle and Meekers, 1994:57). Indeed, a recent study of the changing nature of adolescence among the Kassem and Nankam revealed that older adults felt that the traditional marriage process is now being bypassed, and they are much less involved in choosing a spouse for their offspring. Complained a 70-year-old man who was interviewed: “[In] our time, when you saw a girl and were interested in her, you sent kola nuts and tobacco to her father to declare your intention. But nowadays, you people do not do that; you’ve taken the white man’s ways” (cited in Mensch et al., 1999:105).
While this ritual giving of kola nuts and other foodstuffs by the groom to the bride’s family is becoming less common, there is some suggestion that it is being replaced by the transfer of cash and more expensive gifts (Cooper, 1995). According to researchers who have analyzed marriage laws in the countries of the Sahel, postindependence marriage codes in Burkina Faso, Mali, and Senegal do not abolish bride-price but regulate it, in part out of a concern that it has become so inflated as to make marriage prohibitive for the man (Boye et al., 1991). In Eastern and Southern Africa there was an escalation in the real value of bridewealth payments during the colonial and early independence years (1950s and 1960s), which is attributed to the rise in the value of women’s agricultural work with cash cropping (Mulder, 1995). An analysis of the pattern of bridewealth payments in Kenya, which is said to conform to other Eastern and Southern African populations, indicates a slight decline in payments in the 1970s and 1980s. It is ascribed to a reduction in women’s labor and reproductive value with increasing shortages of land and alternative investment opportunities, as well as a rise in premarital pregnancies. An analysis of bridewealth payments among the Ibo in Nigeria from 1970-1987 also indicates a decline in the value in real terms (Isiugo-Abanihe, 1994). However, the financial burden on the groom is said to have increased because of declines in income, a situation that is probably not unique to Nigeria. Not only has the nature of financial payments apparently shifted with the changing economy, but also young men are increasingly believed to shoulder the burden of bridewealth themselves (National Research Council, 1993:Chapter 3). Among the Orma, who reside in northeastern Kenya, the increase in bar-
gaining power of young people relative to their parents as a result of greater financial independence has led both to a decline in bridewealth and a reduction in the age difference between spouses. “Young women are more inclined to choose young men as marriage partners [rather than rich older men] and young men have less need of bridewealth to ensure a supply of marriage partners” (Ensminger and Knight, 1997:11-12).
In communities in which the cost of bridewealth has increased, various forms of nonmarital cohabitation, often without parental consent, have emerged (Meekers, 1994). Among the Iteseo of Uganda and Kenya, for example, Nagashima (1987) notes that there is a reversal in the order in which cohabitation and negotiation of the bridewealth occur. Formerly marriages were arranged and cohabitation occurred after the bridewealth was negotiated and the main part of it handed over to the bride’s family. Now the opposite situation generally prevails. Moreover, payments are often made in piecemeal over many years.
Much of the discussion of changes in the nature and amount of bridewealth is based on only a few studies. Nonetheless, it is important to emphasize that there is likely to be enormous variability in these practices both within ethnic groups and across the different parts of the subcontinent. Given the lack of more comprehensive data, it is not possible to assess whether the practice of bridewealth is becoming less prevalent throughout sub-Saharan Africa, nor whether it has become more of a burden with increasing monetization, nor whether there is any relationship between the cost of bride-price and the timing of marriage.
Increasingly, bride-price is drawing criticism as a practice that essentially commodifies women and gives the husband proprietary rights over his wife. In Africa there is an incipient movement to reform the practice. The Mifumi Domestic Violence and Bride-price Project, based in Uganda, successfully campaigned for the reform of bride-price in the Tororo district. In December 2001, the community voted to make bride-price a nonrefundable gift, so that if a woman wants to divorce her husband, she may do so without her family having to refund the bride-price. These efforts have continued with the first International Conference on Bride-price and Development in February 2004 at Makerere University in Kampala. The goal of the conference was to develop an action plan to reduce or remove the significance of bride-price as a hindrance to gender equality and development (see http://www.Mifumi.org).
Dowry
In contrast to sub-Saharan Africa, for which the literature on marriage transfers is somewhat dated and to a large extent limited to ethnographies,
there is a considerable body of recent studies of dowry in South Asia. A common theme underlies this research, namely, that dowry (or groom-price) has replaced bride-price in India and Bangladesh to the detriment of women.
Among demographers, a view has emerged that the increase in the prevalence and monetary value of dowry in India beginning in the second half of the twenthieth century is due to the relative availability of men and women at the appropriate ages of marriage. Because of declining infant and child mortality, and because women marry men who are considerably older, a “marriage squeeze” has emerged; in other words, there is now an excess supply of women of marriageable ages. In addition, as maternal mortality began to fall, there were fewer widowers available for women to marry. When there are too few men of marriageable age, families compete for the eligible men by paying higher dowries (Bhat and Halli, 1999; Billig, 1992; Caldwell, Reddy, and Caldwell, 1983; Deolalikar and Rao, 1998). Some have argued that the increase in dowry should not be attributed entirely to a marriage squeeze. According to Botticini and Siow (2003), growing consumerism and affluence have also contributed to dowry inflation. They suggest that the upper caste practice of hypergamous marriages, that is, women marrying more economically successful spouses, has influenced the larger society.
While India is the focus of research on dowry, the experience of other Southern Asian countries should also be considered. In rural Nepal, where declines in mortality have also created a deficit of eligible men of marriageable age, dowry has yet to emerge as a common practice, although it is increasingly prevalent in Kathmandu (Ahearn, 2001:89).30 Amin and Cain (1997:300) observe that Bangladesh is more patriarchal than South India and, in their analysis of data from two villages in the northern part of the country, note that one response to a marriage squeeze and a rise in dowry is
an increase in the level of village endogamy, since marriages within the village obviate the necessity of payments to the groom’s family.31
There is considerable discussion in the literature that the emergence of dowry or excessive dowry payments has undermined the status of women even in the face of increasing education. In India, even researchers refer to dowry as being “evil” and mention is frequently made of daughter-only families becoming destitute and young wives committing suicide and being beaten or burned because of dowry demands (Bhat and Halli, 1999; Suguna, 1998; Sureender, Kahn, and Radhakrishman, 1997).
Although marriages involving dowry are still pervasive in much of Southern Asia, some economists contend that the practice will disappear with increasing urbanization and modernization. Botticini and Siow (2003) assert that, when labor markets become more developed and sons no longer work in family businesses, residential arrangements will move from a virilocal (i.e., residence with the husband’s kin) to a neolocal pattern. When married sons move away, there is no reason, so the argument goes, for daughters to be given their share of the family estate at marriage. Instead parents can transfer wealth in the form of human capital investments and bequests to both their daughters and sons. Anderson (2003) argues that the reason dowry has persisted in India is because of caste. She claims that when status is determined by wealth rather than caste, dowry eventually disappears, as it did as Europe. Using a theoretical model of dowry payments, she maintains that in caste-based societies, such as India, increased heterogeneity in income within a caste “necessarily leads to increases in dowry payments,” because brides are willing to pay more to marry up (Anderson 2003:273). However, her argument does not take account of the situation in Bangladesh in which dowry is also rising but a formal caste structure does not exist.32
Other Financial Transfers
Not only is it important to explore the changing nature of formal transfers that take place prior to and during the early years of marriage and the impact they have on the nature of marriage, but it is also critical to understand whether contemporary marriage arrangements have changed elsewhere in the developing world. Quisumbing and Hallman (2005) note
that even in countries in which dowry and bride-price are common, they constitute only a small fraction of the physical assets and human capital that men and women bring to marriage. An examination of survey data from six developing countries—Bangladesh, Ethiopia, Mexico, Guatemala, the Philippines, and South Africa—reveals that: (1) in three of the six countries, there has been an equalization of human capital at marriage, measured as gaps in schooling attainment; in two of the six countries, there has been no change; and in one, Ethiopia, the gap has widened because increases in schooling, while occurring for both sexes, have favored men more than women; (2) there are no clear trends with regard to changes in landownership at marriage; and (3) in five of the six countries, the gap in husband-wife assets brought to marriage has either increased (Latin America) or remained unchanged (Bangladesh, the Philippines, and South Africa), and in Ethiopia it has decreased due to new land collectivization policies. They conclude that while a reduction in the gap in school attainment bodes well for improvement in the balance of power between spouses, the fact that control of assets remains in the hands of men may have implications for household welfare, given the critical role played by women in the well-being of offspring.
Living Arrangements After Marriage
One potential explanation for later age at marriage in the developing world is a change in the living arrangements of young adults from matrilocal and patrilocal residence to neolocal residence. Rather than establishing residence with the wife’s or husband’s natal family, newly married couples may set up independent households. The literature on household structure and poverty suggests that the establishment of independent households is a function of income; rising incomes are associated with increased demand for privacy and autonomy and smaller and less complex households (Lloyd, 1998). The desire for a separate residence might therefore lead the couple, especially the young man, to delay marriage. Of course one must also consider that the direction of causation could be reversed, that changing norms about age at marriage may bring about a change in household structure: postponement of marriage may result in greater accumulation of resources and increased demand for a household separate from parents.
Is there any evidence for changing living arrangements and increased economic independence among young people in developing countries? The literature on this subject is very thin. In her 1995 volume on household composition in Latin America, De Vos considered the living arrangements of young people. However, her analysis is based on World Fertility Survey data that are over 30 years old. Although she didn’t separate the married from the single nor did she explore trends, De Vos does provide data on the
percentage who no longer live with parents. She found that the majority of young adults ages 20-34 of both sexes had left parental households and set up separate residences (De Vos, 1995). In Chengdu, China, postmarital residence with the groom’s family declined from 45 percent for women married between 1933 and 1948 to 28 percent for women married from 1977 to 1987, according to the survey conducted in 1987. Correspondingly, the fraction of women living on their own with spouses increased from 39 to 51 percent during the same time period (Whyte, 1990). Presumably this pattern of increasing neolocal residence has continued as exposure to Western culture has grown (Whyte, 2003).
For several DHS countries information exists on living arrangements at two points in time. However, the data are restricted to surveys from DHS II and DHS III and thus can reveal only change that has taken place in the 1990s.33 There are 10 countries with two surveys at least six years apart in which individual data can be linked to household data. Table 7-15 indicates the percentage of married women ages 20-29 in these 10 countries living in nuclear households in the early 1990s and then 6-10 years later. To measure independence more precisely, we also computed the percentage who live in nuclear households and are household heads or spouses of heads. For this analysis we define a nuclear household to include a head, the spouse of the head, and children and nonrelatives, if any. The expectation is that most married women who live in nuclear households would be heads or spouses of heads. We assume that if a married woman lives in a nuclear household, she and her husband are more likely to be financially independent of parents and other family members than if they lived with them.
Of the 10 countries, only 4—Burkina Faso, Egypt, Nigeria, and Peru—indicate a substantial increase in the proportion of married women living in
nuclear households. Given the small number of countries and the short interval between surveys, it is not possible to come to any conclusions about the living arrangements of young married women in most developing countries or about the association between an increase in age at marriage and a change in household structure. Clearly, data are needed from more countries over a longer period before one can measure changes in household structure and observe whether a link exists between household composition and the timing of marriage.
POLICIES AND INTERVENTIONS TO DELAY MARRIAGE
Both women’s rights and reproductive health advocates assume that there are harmful consequences of early marriage for young women. Yet research has not established the causal links between early marriage and poor outcomes, e.g., reduced schooling, greater social isolation, uninformed sexual relations, increased poverty, etc. In the absence of study designs that control for confounding factors that are both a cause and consequence of early marriage, it is not possible to assess what the short and long term effects of child marriage are. Is it early marriage in and of itself that is problematic or is it the socioeconomic characteristics of women who marry early? Are the consequences of early marriage context dependent? That is, are women’s lives altered more by early marriage in countries where the status of women is higher or lower? As educational attainment and labor force participation of women rise within a country, do the consequences of early marriage increase as well as the selectivity of those who marry young? Note that, to the extent that early marriage has consequences for women, these consequences are likely to be a function of the fact that those who marry at a young age also bear children early. (An extensive discussion of the consequences of early childbearing is found in Chapter 8.)
Despite the absence of rigorous studies establishing the deleterious effects of early marriage, this issue has been of great concern to many who view marriage prior to age 18 as a human rights violation. Indeed, there is a growing attention to policies and programs designed to reduce early marriage.
Laws Regulating Marriage
While laws on age at marriage are increasingly being examined, no study has investigated the connection between changing laws and trends in age at marriage across countries. That laws are often inconsistent within countries may contribute to the complicated legal situation. A review of policies affecting marriage in seven English-speaking African countries indicates that in some countries, for example, Nigeria and Kenya, local and
TABLE 7-15 Percentage of Currently Married Women Ages 20-29 Living in Nuclear Householdsa and Percentage Who Live in Nuclear Households Who Are Either the Household Head or the Spouse of the Headb
|
Country |
Year of Survey |
Regionc |
% Nuclear Household |
|
|
20-24 |
25-29 |
|||
|
Colombia |
1990 |
SA |
61.0 |
69.2 |
|
Colombia |
2000 |
SA |
59.6 |
65.0 |
|
Peru |
1991 |
SA |
52.7 |
61.7 |
|
Peru |
2000 |
SA |
60.6 |
68.7 |
|
Tanzania |
1992 |
E/S Africa |
42.5 |
53.2 |
|
Tanzania |
2000 |
E/S Africa |
43.8 |
51.4 |
|
Burkina Faso |
1992-1993 |
W/M Africa |
51.4 |
50.9 |
|
Burkina Faso |
1999 |
W/M Africa |
58.0 |
58.9 |
|
Cameroon |
1991 |
W/M Africa |
49.9 |
48.4 |
|
Cameroon |
1997 |
W/M Africa |
49.4 |
47.2 |
|
Nigeria |
1990 |
W/M Africa |
61.6 |
62.2 |
|
Nigeria |
1999 |
W/M Africa |
70.7 |
71.4 |
|
Egypt |
1992 |
ME |
38.0 |
48.5 |
|
Egypt |
2000 |
ME |
46.3 |
54.6 |
|
Bangladesh |
1993-1994 |
SC/SE Asia |
47.8 |
59.0 |
|
Bangladesh |
1999-2000 |
SC/SE Asia |
41.4 |
52.1 |
|
India |
1992 |
SC/SE Asia |
20.7 |
32.5 |
|
India |
1998-2000 |
SC/SE Asia |
21.8 |
34.0 |
|
Indonesia |
1991 |
SC/SE Asia |
56.0 |
66.9 |
|
Indonesia |
1997 |
SC/SE Asia |
55.2 |
68.3 |
|
aNuclear household includes household head, spouse of head, children, adopted and foster children, and nonrelatives. bFor all countries except Burkina Faso, Egypt, and India, information from the household data was merged with the individual data; in Burkina Faso, Egypt, and India all necessary information was available in the household roster. |
||||
religious laws contradict national laws. In other countries, for example, Tanzania, penal codes contradict national laws (Center for Reproductive Law and Policy, 1997a). Reproductive rights advocates believe that laws specifying a minimum age at marriage are rarely enforced; rather, customary practice takes precedence over civil law (Boye et al., 1991). While most countries have laws specifying a minimum age at marriage, these are thought to be rarely enforced. Indeed, in some countries, the actual age at marriage is close to or even lower than the legal age (UNICEF, 2001b).
Table 7-16 gives the minimum age at marriage without parental consent for men and women in civil marriages (International Planned Parenthood Foundation and International Women’s Rights Action Watch, 2000). For 50 of the 81 countries, the minimum age is at least 18 for both sexes. In 32 countries the age specified is lower for women than for men, which according to the International Planned Parenthood Federation is based on ideas of women’s inferiority and implies that women need fewer years to prepare for marriage because their duties are confined to childbearing or domestic roles.
Have laws on age at marriage changed in recent years? For 55 countries data are available on the legal minimum age at marriage in 1990 and 2000 (Table 7-17). The legal age is now higher for women in 23 countries and for men in 20, which indicates a significant change in social norms regarding early marriage. Moreover, in 17 countries the legal age changed more for women than for men, signifying an attempt to equalize gender differences in age at marriage. Finally, in two countries, Malawi and Trinidad, where no law existed in 1990, there are now laws. Only in three countries has the legal age been lowered since 1990: in Yemen and Uruguay the age is now lower for both men and women, and in Ethiopia the age is lower for men.
Even if laws on age at marriage are not obeyed and little association exists between the legal minimum age at marriage and the percentage of the population that marries early, it is possible that the level of attention now given to early marriage by human rights advocates and a broad range of nongovernmental organizations (NGOs)—internationally and within countries—may have contributed to the increase in the age at marriage among women. Advocacy in opposition to child marriage and discussion at United Nations conferences has undoubtedly contributed to changes in legislation. (See Mensch, Singh, and Casterline, 2005, for a discussion of the association between the legal age at marriage and the prevalence of early marriage.)
Interventions to Raise the Age at Marriage
To the best of our knowledge, outside Asia, there are no known interventions designed explicitly to reduce early marriage in societies in which
substantial numbers of girls wed during their teenage years. In Bangladesh, India, and Nepal, where the legal age at marriage for women is 18, but large proportions of girls marry before then, there are now governmental and NGO efforts directed at lowering the incidence of teen marriage.
In China, the Marriage Laws of 1950 and 1980 specified minimum legal ages of marriage, 20 for males and 18 for females in 1950 and 22 for males and 20 for females in 1980 (Hannum and Liu, 2005). The “later-longer-fewer” family planning policy of 1970 and the one child policy of 1979, designed to reduce the pace of childbearing, also encouraged later age at marriage. However, scholars disagree as to whether these governmental edicts have led to the secular rise in age at marriage. Data from the first half of the twentieth century indicate that age of marriage rose prior to these decrees, leading Whyte and Parish (1984) to argue that urbanization and industrialization and not governmental intervention were behind the transformation. Wolf (1986:101) disagrees, arguing that the level of modernization in China was insufficient to bring about such a “sharp rise in age at marriage.” Trends in age at marriage since 1980 suggest that both the policies and the socioeconomic environment figured into couples’ decisions about when to wed during the last two decades of the century. The 1980 Marriage Law somewhat paradoxically “relaxed” the age restrictions on marriage. Marriage registration was no longer under the control of the family planning program, but instead was supervised by departments of civil affairs. As a result, age of marriage for women fell during the 1980s. However, since 1987 age at marriage began to rise again with “rapid economic development … and stronger implementation of the policy promoting late marriage” (Zeng, 2000:96).
In the Indian states of Andra Pradesh, Haryana, Karnataka, Madhya Pradesh, Punjab, Rajasthan, and Tamil Nadu, programs have been developed that provide a financial incentive to girls to postpone marriage until the age of 18 or later. In addition, scholarships and credit for schooling and income-generating activities are available for participating families. In three of the states, program eligibility is based on the fertility and contraceptive status of the girls’ parents. The Haryana program, known as Apni Beti Apna Dhan (Our Daughters Our Wealth), provides 3,000 rupees (approximately $70) to the family of the girl: a gift of 500 rupees within 15 days of the birth and a further investment of 2,500 rupees in a small savings scheme. If the girl remains unmarried at age 18, the gift is expected to be worth about 25,000 rupees. Families are eligible if they fall below the poverty line, if they are members of certain low castes, and if they have three or fewer children. While documentation of some of these programs exists, they have not yet been evaluated either in terms of short-term outcomes, for example, changing the sex ratio at birth, or in terms of longer term objectives, for
TABLE 7-16 Legal Minimum Age at Marriage Without Parental Consent: 2000 (81 countries)
|
Country |
Region |
Male |
Female |
|
Nicaragua |
Caribbean/Central America |
15 |
14 |
|
Panama |
Caribbean/Central America |
16 |
15 |
|
Barbados |
Caribbean/Central America |
18 |
18 |
|
Costa Rica |
Caribbean/Central America |
18 |
18 |
|
Cuba |
Caribbean/Central America |
18 |
18 |
|
Dominican Republic |
Caribbean/Central America |
18 |
18 |
|
Guatemala |
Caribbean/Central America |
18 |
18 |
|
Haiti |
Caribbean/Central America |
18 |
18 |
|
Jamaica |
Caribbean/Central America |
18 |
18 |
|
Trinidad & Tobago |
Caribbean/Central America |
18 |
18 |
|
El Salvador |
Caribbean/Central America |
21 |
21 |
|
Honduras |
Caribbean/Central America |
21 |
21 |
|
Ethiopia |
Eastern/Southern Africa |
18 |
15 |
|
Kenya |
Eastern/Southern Africa |
18 |
18 |
|
Madagascar |
Eastern/Southern Africa |
18 |
18 |
|
Malawi |
Eastern/Southern Africa |
18 |
18 |
|
Mauritius |
Eastern/Southern Africa |
18 |
18 |
|
Namibia |
Eastern/Southern Africa |
18 |
18 |
|
South Africa |
Eastern/Southern Africa |
18 |
18 |
|
United Republic of Tanzania |
Eastern/Southern Africa |
18 |
15 |
|
Zimbabwe |
Eastern/Southern Africa |
18 |
18 |
|
Burundi |
Eastern/Southern Africa |
21 |
18 |
|
Rwanda |
Eastern/Southern Africa |
21 |
21 |
|
Uganda |
Eastern/Southern Africa |
21 |
21 |
|
Zambia |
Eastern/Southern Africa |
21 |
21 |
|
Mongolia |
Eastern Asia |
18 |
18 |
|
Yemen |
Middle East |
15 |
15 |
|
Turkey |
Middle East |
17 |
15 |
|
Egypt |
Middle East |
18 |
16 |
|
Iraq |
Middle East |
18 |
18 |
|
Jordan |
Middle East |
18 |
17 |
|
Morocco |
Middle East |
18 |
15 |
|
Libyan Arab Jamahiriya |
Middle East |
20 |
20 |
|
Tunisia |
Middle East |
20 |
20 |
|
Algeria |
Middle East |
21 |
18 |
|
Bolivia |
South America |
16 |
14 |
|
Peru |
South America |
16 |
14 |
|
Venezuela |
South America |
16 |
16 |
|
Argentina |
South America |
18 |
16 |
|
Brazil |
South America |
18 |
16 |
|
Chile |
South America |
18 |
18 |
|
Country |
Region |
Male |
Female |
|
Colombia |
South America |
18 |
18 |
|
Ecuador |
South America |
18 |
18 |
|
Guyana |
South America |
18 |
18 |
|
Uruguay |
South America |
18 |
18 |
|
Paraguay |
South America |
20 |
20 |
|
Lao People’s Democratic Republic |
South-central/South-eastern Asia |
18 |
18 |
|
Pakistan |
South-central/South-eastern Asia |
18 |
18 |
|
Philippines |
South-central/South-eastern Asia |
18 |
18 |
|
Sri Lanka |
South-central/South-eastern Asia |
18 |
18 |
|
Indonesia |
South-central/South-eastern Asia |
19 |
16 |
|
Bhutan |
South-central/South-eastern Asia |
20 |
16 |
|
Cambodia |
South-central/South-eastern Asia |
20 |
18 |
|
Thailand |
South-central/South-eastern Asia |
20 |
20 |
|
Viet Nam |
South-central/South-eastern Asia |
20 |
18 |
|
Bangladesh |
South-central/South-eastern Asia |
21 |
18 |
|
India |
South-central/South-eastern Asia |
21 |
18 |
|
Nepal |
South-central/South-eastern Asia |
21 |
18 |
|
Myanmar |
South-central/South-eastern Asia |
none |
20 |
|
Georgia |
Former Soviet Asia |
16 |
16 |
|
Armenia |
Former Soviet Asia |
17 |
17 |
|
Azerbaijan |
Former Soviet Asia |
18 |
18 |
|
Kazakhstan |
Former Soviet Asia |
18 |
17 |
|
Kyrgyzstan (Kyrgyz Republic) |
Former Soviet Asia |
18 |
18 |
|
Tajikistan |
Former Soviet Asia |
18 |
18 |
|
Liberia |
Western/Middle Africa |
16 |
16 |
|
Cameroon |
Western/Middle Africa |
18 |
15 |
|
Central Africa Republic |
Western/Middle Africa |
18 |
18 |
|
Democratic Republic of the Congo |
Western/Middle Africa |
18 |
15 |
|
Gabon |
Western/Middle Africa |
18 |
15 |
|
Guinea |
Western/Middle Africa |
18 |
17 |
|
Guinea-Bissau |
Western/Middle Africa |
18 |
15 |
|
Nigeria |
Western/Middle Africa |
18 |
18 |
|
Burkina Faso |
Western/Middle Africa |
20 |
17 |
|
Senegal |
Western/Middle Africa |
20 |
16 |
|
Togo |
Western/Middle Africa |
20 |
17 |
|
Ghana |
Western/Middle Africa |
21 |
21 |
|
Mali |
Western/Middle Africa |
21 |
18 |
|
Sierra Leone |
Western/Middle Africa |
21 |
18 |
|
Chad |
Western/Middle Africa |
none |
14 |
|
Gambia |
Western/Middle Africa |
none |
none |
|
SOURCE: IPPF and IWRAW (2000). |
|||
TABLE 7-17 Legal Minimum Age at Marriage Without Parental Consent: 1990 and 2000 (55 countries)
|
Country |
Region |
2000 |
1990 |
||
|
Male |
Female |
Male |
Female |
||
|
Panama |
Caribbean/Central America |
16 |
15 |
14 |
12 |
|
Costa Rica |
Caribbean/Central America |
18 |
18 |
15 |
15 |
|
Nicaragua |
Caribbean/Central America |
15 |
14 |
15 |
14 |
|
Barbados |
Caribbean/Central America |
18 |
18 |
16 |
16 |
|
Dominican Republic |
Caribbean/Central America |
18 |
18 |
16 |
15 |
|
El Salvador |
Caribbean/Central America |
21 |
21 |
16 |
14 |
|
Guatemala |
Caribbean/Central America |
18 |
18 |
16 |
14 |
|
Jamaica |
Caribbean/Central America |
18 |
18 |
16 |
16 |
|
Cuba |
Caribbean/Central America |
18 |
18 |
18 |
18 |
|
Honduras |
Caribbean/Central America |
21 |
21 |
18 |
16 |
|
Mexico |
Caribbean/Central America |
18 |
18 |
18 |
18 |
|
Trinidad and Tobago |
Caribbean/Central America |
18 |
18 |
none |
none |
|
Zambia |
Eastern/Southern Africa |
21 |
21 |
16 |
16 |
|
Madagascar |
Eastern/Southern Africa |
18 |
18 |
17 |
14 |
|
Kenya |
Eastern/Southern Africa |
18 |
18 |
18 |
18 |
|
Mauritius |
Eastern/Southern Africa |
18 |
18 |
18 |
15 |
|
Rwanda |
Eastern/Southern Africa |
21 |
21 |
18 |
15 |
|
Uganda |
Eastern/Southern Africa |
21 |
21 |
18 |
16 |
|
United Republic of Tanzania |
Eastern/Southern Africa |
18 |
15 |
18 |
15 |
|
Ethiopia |
Eastern/Southern Africa |
18 |
15 |
20 |
15 |
|
Malawi |
Eastern/Southern Africa |
18 |
18 |
none |
none |
|
Mongolia |
Eastern Asia |
18 |
18 |
18 |
18 |
|
China |
Eastern Asia |
|
22 |
20 |
|
|
Turkey |
Middle East |
17 |
15 |
17 |
15 |
|
Egypt |
Middle East |
18 |
16 |
18 |
16 |
|
Iraq |
Middle East |
18 |
18 |
18 |
18 |
|
Yemen |
Middle East |
15 |
15 |
19 |
16 |
|
Libyan Arab Jamahiriya |
Middle East |
20 |
20 |
20 |
16 |
|
Tunisia |
Middle East |
20 |
20 |
20 |
17 |
|
Chile |
South America |
18 |
18 |
14 |
12 |
|
Ecuador |
South America |
18 |
18 |
14 |
12 |
|
Paraguay |
South America |
20 |
20 |
14 |
12 |
|
Venezuela |
South America |
16 |
16 |
14 |
12 |
|
Bolivia |
South America |
16 |
14 |
16 |
14 |
|
Peru |
South America |
16 |
14 |
16 |
14 |
|
Argentina |
South America |
18 |
16 |
18 |
16 |
|
Brazil |
South America |
18 |
16 |
18 |
16 |
|
Colombia |
South America |
18 |
18 |
18 |
18 |
|
Guyana |
South America |
18 |
18 |
18 |
18 |
|
Uruguay |
South America |
18 |
18 |
21 |
21 |
|
Sri Lanka |
South-central/South-eastern Asia |
18 |
18 |
16 |
12 |
|
Thailand |
South-central/South-eastern Asia |
20 |
20 |
17 |
17 |
|
Philippines |
South-central/South-eastern Asia |
18 |
18 |
18 |
18 |
|
Indonesia |
South-central/South-eastern Asia |
19 |
16 |
19 |
16 |
|
Viet Nam |
South-central/South-eastern Asia |
20 |
18 |
20 |
18 |
|
Liberia |
Western/Middle Africa |
16 |
16 |
16 |
16 |
|
Nigeria |
Western/Middle Africa |
18 |
18 |
16 |
16 |
|
Burkina Faso |
Western/Middle Africa |
20 |
17 |
18 |
15 |
|
Gabon |
Western/Middle Africa |
18 |
15 |
18 |
15 |
|
Guinea |
Western/Middle Africa |
18 |
17 |
18 |
17 |
|
Senegal |
Western/Middle Africa |
20 |
16 |
20 |
16 |
|
Togo |
Western/Middle Africa |
20 |
17 |
20 |
17 |
|
Ghana |
Western/Middle Africa |
21 |
21 |
21 |
21 |
|
Mali |
Western/Middle Africa |
21 |
18 |
21 |
18 |
|
Sierra Leone |
Western/Middle Africa |
21 |
18 |
21 |
18 |
|
SOURCE: IPPF and IWRAW (1990, 2000). |
|||||
example, delaying marriage (Greene, 1997; Mensch, Bruce, and Greene, 1998; Population Council, 1999).
In Aurangabad district in the Indian state of Maharashtra, an intensive life-skills program has been developed by the Institute for Health Management-Pachod to: (1) improve the social and health status of adolescent girls, (2) promote self-esteem, and (3) delay age at marriage. Unmarried adolescent girls ages 12-18 are enrolled in an intensive life-skills course taught by trained village women; the course meets for an hour each weekday evening for one year. To evaluate the intervention, annual data on age of marriage have been collected from 17 study and 18 control villages since 1997 (International Center for Research on Women and Institute of Health Management-Pachod, 2003). Although there is an indication that the percentage of girls marrying before age 18 has declined in the study villages, as with the other interventions, a rigorous evaluation has yet to be conducted.
In the Terai area of Nepal near the Indian border, a participatory approach to improving adolescent reproductive health has been developed by two U.S. NGOs, Engender-Health and International Center for Research on Women, in conjunction with Nepali partners (Mathur, Mehta, and Malhotra, 2004). The intervention, carried out over a 12-24 month period in one rural and one urban community, consisted of eight components: adolescent-friendly services, peer education and counseling, an information and education campaign, adult peer education, youth clubs, street theater on social norms, efforts to improve livelihood opportunities, and teacher training. The project used a quasi-experimental34 design, with the baseline survey conducted among 14-21-year-olds in 1999 and the end-line survey conducted among a different cross-section of 14-25-year-olds in 2003. One of the outcomes the intervention was designed to affect is age of marriage. Simple descriptive data indicate that in the urban site marriage among 14-21-year-olds declined by 53 percent at the study site and by 47 percent at the control site. In the rural area, there was virtually no change in the percentage married at the study site and an increase at the control site. Although the intervention was unusually comprehensive, it is difficult to draw conclusions about project impact from the statistical analysis that the researchers have conducted thus far as part of the evaluation (see Mathur, Mehta, and Malhotra, 2004, Appendix A). Given that a quasi-experimental design was used, appropriate multivariate models are needed to draw conclusions about the efficacy of the intervention in raising age at marriage.
In 1994 the government of Bangladesh initiated a scholarship scheme throughout the country for girls enrolled in grades 6 and 9, which was later extended to girls in grades 7 and 8. Provided the girl attends school 65 percent of the time and maintains a certain grade point average, her school is given a certain allotment and she is given a monthly stipend ranging from the equivalent of 1 to 2 U.S. dollars. Parents of the girls are required to sign an agreement guaranteeing that their daughters will not marry before the age of 18. While an assessment of the effect of this program on secondary school enrollment reveals that girls’ school attendance increased (Khandker, Pitts, and Fuwa, 2003), there has not been a rigorous analysis of the effect on age at marriage. However, data collected in villages prior to the program’s implementation and then again in 1995, 1996, and 2000 indicate, somewhat unexpectedly, little change in the percentage of adolescent girls who marry (Amin and Arends-Kuenning, 2001; Arends-Kuenning and Amin, 2000).
As noted above, we are unaware of any interventions in sub-Saharan Africa, where marriage during the teenage years is also widespread, to directly influence the timing of marriage. However, there are experimental programs designed to improve the status of adolescent girls that, if successful, are likely to delay marriage. The Milles Jeunes Filles project in Burkina Faso, a governmental effort begun in 1994 to educate adolescent girls in cultivation techniques, is a two-year residential program that enrolls 1,000 girls ages 14-18 per year. In addition to learning how to grow crops, girls are given training in literacy, reproductive health, dressmaking, and financial management. At the end of the two-year program, each participant is given a small sum of money to return to her home community and purchase supplies. While the program does not have an explicit goal to raise the age of marriage of girls, one of the desired outcomes is a delay in marriage and an increase in the ability of girls to select their own husbands (Saloucou, Brady, and Chong, forthcoming).
CONCLUSIONS AND RECOMMENDATIONS
Key Findings
Compared with previous generations, a smaller proportion of young women and men are married in most regions of the developing world. The regions that are clear exceptions to this trend are South America for men and women, and South-central and South-eastern Asia for men. Men still marry at older ages than women. While only one-third of men in the developing world are married by ages 20-24, nearly two-thirds of women are married
at this age. Moreover, in certain regions, most notably the Middle East, marriage is postponed until the 30s for a large fraction of men.
The decline in early marriage is quite widespread, lending support to the notion that global changes are affecting the transition to adulthood. Not only is the reduction in marriage occurring in a diversity of settings, but it is also occurring, in some regions, over a relatively wide age span, suggesting that policy shifts, such as increases in the legal age at marriage, social shifts, such as the expansion of education, or ideological shifts, such as a change in norms regarding very early marriage, may all contribute to but cannot fully explain the changes observed.
While women are less likely to be married during the teenage years than in the past, child marriage, defined as marriage prior to age 18, is still widespread and represents a major human rights violation. According to DHS data, nearly 40 percent of women in countries representing 60 percent of the population of the developing world marry before the age of 18; the proportion ranges from around 40-45 percent in South-central and South-eastern Asia, to approximately 35 percent in the Caribbean and Central America, to about 20-25 percent in South America and the Middle East, to about 15 percent in former Soviet Asia.
Large differentials by education, household wealth, and residence exist in the percentage of young women married by age 18 and young men married by age 20. Women and men with eight or more years of schooling, who live in urban areas and are in the top wealth category, are much less likely to marry early than their less well educated, rural, and poorer counterparts. While differentials by schooling level for women are large, the link between the transition out of school and into marriage is not that close in most countries. That is, there is a sizeable gap between the time when most young people exit school and when they marry. While the increase in educational attainment is associated with a substantial proportion of the decline in early marriage, there is still a considerable fraction of the decline that is not associated with the expansion in schooling.
The age gap between spouses appears to be narrowing, especially in sub-Saharan Africa and South-central and South-eastern Asia, the regions where it has been largest. That age differences are shrinking reflects the fact that the pace of increase in age of marriage is greater among women than men. While research is lacking on the effects of a large age gap on marital roles, there is reason to believe that marriages of young women and older men are less equitable.
There is some evidence of growing agency on the part of young women with regard to marriage. While there are few data sets to assess changes in the spouse selection process, in countries in which information is available and arranged marriage was a standard feature of the marriage process, there appears to be a movement in recent years toward greater involvement by young people in choosing a partner. There is a suggestion that this shift toward individual choice may have important implications for sexual behavior both before marriage and in the first years of marriage.
The economics of marriage appears to be changing. While there are insufficient data to assess whether the practices of bridewealth and dowry are becoming less prevalent in the societies in which they have been widespread, there is evidence of a rise in the value of dowry in Southern Asia and, if not an escalation in the value of bride-price in the last 10 or 20 years in sub-Saharan Africa, a possible increase in the burden on the groom, who is more likely to shoulder the responsibility of bridewealth himself rather than rely on his family.
The legal age of marriage for both men and women has risen in many countries in the last decade. Data on the minimum age at marriage without parental consent for men and women for civil marriages indicate that in 50 of 81 countries the minimum is at least 18 for both sexes; in 32 countries the age specified for women is lower than that for men. In 23 of 55 countries for which there are data both in 1990 and 2000, there has been an increase in the legal age of marriage for women in 23 countries and for men in 20.
Evaluations of interventions to raise the age of marriage of women are rare. While governmental and NGO efforts have emerged to encourage later age at marriage in a number of countries, these interventions need to be better documented and evaluated.
Policy Recommendations
The panel recommends that governments that have not already done so pass legislation prohibiting marriage before age 18. Article 16, No. 2 of the UN Convention on the Elimination of All Forms of Discrimination Against Women states that “The betrothal and the marriage of a child shall have no legal effect, and all necessary action, including legislation, shall be taken to specify a minimum age for marriage and to make the registration of marriages in an official registry compulsory.” In a number of countries, the legal age of marriage for women is still under 18. Al-
though the UN Convention on the Rights of the Child does not mention child marriage, it does define childhood as extending up to age 18. Therefore, a number of countries are in violation of UN conventions by permitting marriage before that age.
The panel recommends that where a substantial proportion of women marry before the legal age at marriage, governments should make an effort to educate parents and their daughters about the existing law. Information could be disseminated through billboards, radio, and television, as well as through the school curriculum.
The panel recommends that legislative bodies should establish, and courts should enforce, laws that grant men and women “the same right freely to choose a spouse and to enter marriage only with their free and full consent,” as specified in the UN Convention on the Elimination of All Forms of Discrimination Against Women. For women especially, this right is often not available.
The panel recommends that governments address the issue of excessive dowry and bridewealth payments, which have the effect of promoting too early marriage for women and of possibly delaying marriage for men beyond an age that is considered desirable. Public relations campaigns to reduce financial transactions at marriage may help both to dissuade families from marrying their daughters off too early and to enable men not to wait too long to marry; these efforts would have the added benefit of reducing very large age differences between spouses.
Finally, in countries in which substantial proportions of girls still marry before the age of 18, the panel encourages policies and programs promoting later age at marriage and evaluations to determine if these interventions are effective. A number of creative programs have been developed in India and Bangladesh to encourage families to delay the marriage of their daughters. However, to the best of our knowledge, few of these initiatives have been adequately assessed, and few such interventions have been implemented in sub-Saharan Africa, where early marriage is common. One model for reducing early marriage in Africa is that employed by Tostan, a Senegalese NGO working to eradicate female genital mutilation.35 Tostan’s approach is to conduct education programs, followed by public declarations whereby the community makes a collective promise not to perform female genital
|
35 |
See http://www.popcouncil.org/rhfp/tostan/tostan.html for a summary of the Tostan program. |
mutilation on their daughters. Such a model could also be employed to reduce early marriage.
Research Recommendations
Although demographers have documented shifts in age at marriage, many questions remain about the process of marriage and the factors underlying changes in the timing and conduct of marriage. The following questions, if answered, would go a long way in explaining the timing, process, and content of marriage in the developing world.
-
What factors encourage a delay in age of marriage of women? Changing norms, changing gender roles, changing economic circumstances, changing living arrangements, specifically increases in the prevalence of nuclear households?
-
What factors affect the age of marriage of men? How do men’s decisions about marital timing influence those of women and vice-versa?
-
Are rising expectations of young people with greater exposure to Western media leading to delays in age at marriage of both men and women?
-
What are the implications of a rise in the labor force participation of young women for the timing of marriage and for the terms and conditions of marriage?
-
What is it about schooling that affects the age of marriage for women? With regard to traditional gender roles, do textbooks and teachers reinforce or challenge the status quo?
-
What is the effect of changing laws on age at marriage and on the timing of marriage for women?
-
In regions in which a large fraction of women still marry early, for example, Southern Asia and Western Africa, are there any interventions that have had an impact on the prevalence of early marriage, even if that was not their original intent?
-
What is the effect of changing marriage markets on trends in age at marriage?
-
How have the nature and cost of financial transfers at marriage changed, and what implications do these changes have for relations between marital partners?
-
What fraction of young people have no say in the decision about the timing of marriage and the choice of spouse?
-
In societies in which arranged marriage is common, how does the practice vary by age at marriage?
-
What are the consequences of early marriage on spousal choice, decision making in marriage, and marital satisfaction and stability?
-
What is the association between marital status and HIV risk for both men and women?
-
What are the implications of changing age at marriage and greater autonomy of spousal choice on sexual behavior, both before and after marriage?
-
Does the age gap between spouses affect the conduct of marriage or the nature of spousal relations?
-
What are the consequences of late marriage for men? Are there any negative psychosocial or reproductive health effects of delaying marriage, particularly in societies in which interaction between unmarried men and women is limited?
-
What is the effect of high rates of HIV on the terms and conditions of marriage in sub-Saharan Africa?
-
How are living arrangements after marriage changing? Is there an increased nucleation of households? If so, how does that affect the experience of marriage for the newly married couple?
-
What is the effect of changing marriage patterns on intergenerational relations?
-
What are the differences between consensual marriage and formal marriage in terms of marital experience and the stability of marriage?
APPENDIX TABLE 7-1a Percentage of Women Ever Married, by Age and Time Period
|
Country |
Survey Year 1 |
Note |
Survey Year 2 |
Note |
Survey Interval |
|
Argentina |
1980 |
|
1991 |
11 |
|
|
Azerbaijan |
1989 |
1999 |
|
10 |
|
|
Bahrain |
1981 |
|
1991 |
10 |
|
|
Bangladesh |
1981 |
1991 |
10 |
||
|
Belize |
1980 |
1991 |
11 |
||
|
Benin |
1979 |
[a] |
1996 |
[b] |
17 |
|
Bolivia |
1988 |
1998 |
[c] |
10 |
|
|
Botswana |
1981 |
|
1991 |
10 |
|
|
Brazil |
1980 |
1996 |
[b] |
16 |
|
|
Burkina Faso |
1985 |
[f]* |
1999 |
[c] |
14 |
|
Burundi |
1979 |
|
1990 |
11 |
|
|
Cambodia |
1962 |
1998 |
|
36 |
|
|
Cameroon |
1987 |
[a]* |
1998 |
[c,f] |
11 |
|
Cape Verde |
1980 |
1990 |
10 |
||
|
Central African Republic |
1975 |
|
1994–1995 |
[c] |
19.5 |
|
Chad |
1964 |
[a] |
1996 |
[c] |
32 |
|
Chile |
1982 |
|
1992 |
|
10 |
|
China |
1987 |
[a] |
1999 |
12 |
|
|
Colombia |
1973 |
1993 |
20 |
||
|
Comoros |
1980 |
1996 |
[c] |
16 |
|
|
Côte d’Ivoire |
1978 |
|
1994 |
[c] |
16 |
|
Dominican Republic |
1981 |
1996 |
[c] |
15 |
|
|
Ecuador |
1974 |
1990 |
16 |
||
|
Egypt |
1986 |
|
1996 |
10 |
|
|
El Salvador |
1971 |
1992 |
|
21 |
|
|
Ethiopia |
1984 |
|
2000 |
[f] |
16 |
|
Gabon |
1961 |
[a] |
2000 |
[c] |
39 |
|
Gambia |
1983 |
1993 |
10 |
||
|
Guatemala |
1973 |
1990 |
[a] |
17 |
|
|
Guyana |
1980 |
1991 |
[a]* |
11 |
|
|
Haiti |
1989 |
[f] |
2000 |
[f] |
11 |
|
India |
1981 |
1992–1993 |
[a] |
11.5 |
|
|
Indonesia |
1980 |
|
1990 |
|
10 |
|
Iran |
1986 |
1996 |
10 |
||
|
Jordan |
1979 |
|
1994 |
15 |
|
|
Kazakhstan |
1989 |
1999 |
10 |
||
|
Kenya |
1969 |
1998 |
[c] |
29 |
|
|
Kyrgyzstan |
1989 |
1999 |
|
10 |
|
|
Malawi |
1987 |
2000 |
[f] |
13 |
|
|
Malaysia |
1980 |
|
1991 |
|
11 |
|
Ages |
||||||||
|
15 to 19 |
20 to 24 |
25 to 29 |
||||||
|
Survey 1 |
Survey 2 |
Annual Change |
Survey 1 |
Survey 2 |
Annual Change |
Survey 1 |
Survey 2 |
Annual Change |
|
n.a. |
12.4 |
|
48.1 |
45.2 |
−0.3 |
75.4 |
73.8 |
−0.1 |
|
9.4 |
12.8 |
0.3 |
51.3 |
49.0 |
−0.2 |
77.5 |
76.1 |
−0.1 |
|
14.9 |
6.7 |
−0.8 |
n.a. |
40.9 |
|
n.a. |
68.8 |
|
|
68.7 |
51.3 |
−1.7 |
94.9 |
89.5 |
−0.5 |
98.7 |
97.6 |
−0.1 |
|
9.1 |
7.9 |
−0.1 |
34.3 |
30.9 |
−0.3 |
54.2 |
48.2 |
−0.5 |
|
52.2 |
29.1 |
−1.4 |
90.1 |
79.5 |
−0.6 |
97.1 |
94.3 |
−0.2 |
|
11.1 |
12.2 |
0.1 |
52.6 |
53.4 |
0.1 |
79.5 |
80.5 |
0.1 |
|
7.3 |
5.4 |
−0.2 |
31.2 |
27.2 |
−0.4 |
53.1 |
48.0 |
−0.5 |
|
15.0 |
16.8 |
0.1 |
52.6 |
52.6 |
0.0 |
76.0 |
78.5 |
0.2 |
|
44.9 |
34.8 |
−0.7 |
90.1 |
90.3 |
0.0 |
96.4 |
97.9 |
0.1 |
|
19.2 |
7.0 |
−1.1 |
72.6 |
60.2 |
−1.1 |
89.9 |
86.5 |
−0.3 |
|
14.9 |
12.4 |
−0.1 |
68.4 |
60.6 |
−0.2 |
90.6 |
83.2 |
−0.2 |
|
38.5 |
35.8 |
−0.2 |
72.2 |
73.6 |
0.1 |
86.0 |
89.1 |
0.3 |
|
4.6 |
6.7 |
0.2 |
31.7 |
32.3 |
0.1 |
59.3 |
53.4 |
−0.6 |
|
46.8 |
42.3 |
−0.2 |
81.7 |
81.2 |
0.0 |
90.4 |
90.8 |
0.0 |
|
72.6 |
48.6 |
−0.8 |
97.6 |
92.2 |
−0.2 |
99.2 |
98.4 |
0.0 |
|
9.2 |
11.7 |
0.2 |
43.0 |
43.8 |
0.1 |
69.9 |
69.8 |
0.0 |
|
4.2 |
1.3 |
−0.2 |
60.1 |
45.9 |
−1.2 |
95.9 |
91.6 |
−0.4 |
|
13.5 |
18.2 |
0.2 |
48.8 |
51.8 |
0.1 |
70.9 |
71.3 |
0.0 |
|
31.0 |
11.5 |
−1.2 |
77.8 |
48.4 |
−1.8 |
94.5 |
76.9 |
−1.1 |
|
53.8 |
27.7 |
−1.6 |
82.9 |
69.6 |
−0.8 |
91.8 |
90.8 |
−0.1 |
|
20.7 |
28.9 |
0.5 |
56.7 |
66.1 |
0.6 |
77.7 |
86.1 |
0.6 |
|
19.5 |
18.0 |
−0.1 |
59.3 |
55.1 |
−0.3 |
78.7 |
76.3 |
−0.2 |
|
20.7 |
14.5 |
−0.6 |
60.6 |
56.1 |
−0.4 |
86.3 |
87.1 |
0.1 |
|
20.4 |
15.9 |
−0.2 |
56.3 |
49.9 |
−0.3 |
74.6 |
71.9 |
−0.1 |
|
60.9 |
30.0 |
−1.9 |
94.4 |
73.1 |
−1.3 |
98.6 |
90.4 |
−0.5 |
|
62.7 |
22.4 |
−1.0 |
87.0 |
61.3 |
−0.7 |
95.1 |
82.0 |
−0.3 |
|
55.2 |
38.8 |
−1.6 |
85.1 |
74.8 |
−1.0 |
94.9 |
90.9 |
−0.4 |
|
28.4 |
24.2 |
−0.2 |
67.2 |
66.8 |
0.0 |
82.9 |
85.2 |
0.1 |
|
11.8 |
6.9 |
−0.4 |
44.1 |
26.6 |
−1.6 |
66.1 |
45.4 |
−1.9 |
|
14.5 |
19.4 |
0.4 |
52.3 |
57.3 |
0.5 |
84.7 |
79.9 |
−0.4 |
|
44.1 |
39.9 |
−0.4 |
86.0 |
89.0 |
0.3 |
96.7 |
98.9 |
0.2 |
|
30.1 |
18.2 |
−1.2 |
77.7 |
64.3 |
−1.3 |
92.6 |
88.8 |
−0.4 |
|
34.2 |
17.9 |
−1.6 |
74.2 |
60.5 |
−1.4 |
90.6 |
85.2 |
−0.5 |
|
20.5 |
12.9 |
−0.5 |
64.4 |
48.2 |
−1.1 |
86.7 |
73.3 |
−0.9 |
|
8.9 |
7.4 |
−0.2 |
63.1 |
52.7 |
−1.0 |
86.8 |
80.5 |
−0.6 |
|
35.9 |
16.7 |
−0.7 |
81.4 |
65.1 |
−0.6 |
93.5 |
87.3 |
−0.2 |
|
10.9 |
11.5 |
0.1 |
70.7 |
65.9 |
−0.5 |
91.0 |
88.4 |
−0.3 |
|
43.6 |
36.8 |
−0.5 |
88.3 |
87.7 |
0.0 |
96.4 |
98.2 |
0.1 |
|
10.3 |
7.6 |
−0.2 |
48.7 |
39.8 |
−0.8 |
79.1 |
74.1 |
−0.4 |
|
Country |
Survey Year 1 |
Note |
Survey Year 2 |
Note |
Survey Interval |
|
Maldives |
1985 |
1995 |
10 |
||
|
Mali |
1976 |
1995–1996 |
[c] |
19.5 |
|
|
Mauritania |
1988 |
[a]* |
2000–2001 |
[f] |
12.5 |
|
Mauritius |
1972 |
1990 |
[f]* |
18 |
|
|
Mexico |
1980 |
1990 |
10 |
||
|
Morocco |
1982 |
|
1994 |
|
12 |
|
Mozambique |
1980 |
1997 |
[c] |
17 |
|
|
Myanmar |
1973 |
[a] |
1991 |
|
18 |
|
Namibia |
1960 |
1991 |
31 |
||
|
Nepal |
1981 |
|
1991 |
10 |
|
|
Nicaragua |
1971 |
1998 |
|
27 |
|
|
Niger |
1988 |
1998 |
[c] |
10 |
|
|
Occ. Palestinian Territory |
1967 |
[e]* |
1997 |
[e] |
30 |
|
Pakistan |
1981 |
|
1998 |
[d] |
17 |
|
Panama |
1980 |
1990 |
|
10 |
|
|
Paraguay |
1982 |
1992 |
10 |
||
|
Peru |
1981 |
1996 |
[c] |
15 |
|
|
Philippines |
1980 |
1995 |
15 |
||
|
Puerto Rico |
1980 |
1990 |
10 |
||
|
Rwanda |
1978 |
1996 |
[c]** |
18 |
|
|
Senegal |
1978 |
[c] |
1997 |
[c] |
19 |
|
South Africa |
1985 |
|
1996 |
11 |
|
|
Sudan |
1983 |
[a]*** |
1993 |
[a]* |
10 |
|
Tanzania |
1978 |
1996 |
[c] |
18 |
|
|
Thailand |
1980 |
1990 |
10 |
||
|
Trinidad & Tobago |
1980 |
1990 |
10 |
||
|
Tunisia |
1984 |
1994 |
10 |
||
|
Turkey |
1980 |
|
1990 |
10 |
|
|
Uganda |
1969 |
1995 |
[c] |
26 |
|
|
Uruguay |
1985 |
|
1996 |
|
11 |
|
Venezuela |
1974 |
1990 |
16 |
||
|
Zambia |
1980 |
1999 |
19 |
||
|
Zimbabwe |
1982 |
1999 |
[c] |
17 |
|
|
Unless otherwise noted, source of survey data is UN Statistics Division. [a] SOURCE: U.S. Bureau of the Census, International Database. [b] SOURCE: U.S. Bureau of the Census, International Database, National Demographic and Health Survey. [c] SOURCE: National Demographic and Health Survey. [d] UN Statistics Division—preliminary. [e] UN Statistics Division and U.S. Bureau of the Census, International Database. [f] SOURCE: Other or Unidentified. |
|||||
APPENDIX TABLE 7-1b Percentage Men Ever Married, by Age and Time Period
|
Country |
Survey Year 1 |
Note |
Survey Year 2 |
Note |
Survey Interval |
|
Argentina |
1980 |
|
1991 |
11 |
|
|
Azerbaijan |
1989 |
1999 |
|
10 |
|
|
Bahrain |
1981 |
|
1991 |
10 |
|
|
Bangladesh |
1981 |
1991 |
10 |
||
|
Belize |
1980 |
1991 |
11 |
||
|
Benin |
1979 |
[a] |
1996 |
[b] |
17 |
|
Bolivia |
1988 |
1998 |
[c] |
10 |
|
|
Botswana |
1981 |
|
1991 |
10 |
|
|
Brazil |
1980 |
1996 |
[b] |
16 |
|
|
Burkina Faso |
1985 |
[f]* |
1999 |
[c] |
14 |
|
Burundi |
1979 |
|
1990 |
11 |
|
|
Cambodia |
1962 |
1998 |
|
36 |
|
|
Cameroon |
1987 |
[a]* |
1998 |
[c,f] |
11 |
|
Cape Verde |
1980 |
1990 |
10 |
||
|
Central African Republic |
1975 |
|
1994–1995 |
[c] |
19.5 |
|
Chad |
1964 |
[a] |
1996 |
[c] |
32 |
|
Chile |
1982 |
|
1992 |
|
10 |
|
China |
1987 |
[a] |
1999 |
12 |
|
|
Colombia |
1973 |
1993 |
20 |
||
|
Comoros |
1980 |
1996 |
[c] |
16 |
|
|
Côte d’Ivoire |
1978 |
|
1994 |
[c] |
16 |
|
Dominican Republic |
1981 |
1996 |
[c] |
15 |
|
|
Ecuador |
1974 |
1990 |
16 |
||
|
Egypt |
1986 |
|
1996 |
10 |
|
|
El Salvador |
1971 |
1992 |
|
21 |
|
|
Ethiopia |
1984 |
|
2000 |
[f] |
16 |
|
Gabon |
1961 |
[a] |
2000 |
[c] |
39 |
|
Gambia |
1983 |
1993 |
10 |
||
|
Guatemala |
1973 |
1990 |
[a] |
17 |
|
|
Guyana |
1980 |
1991 |
[a]* |
11 |
|
|
Haiti |
1989 |
[f] |
2000 |
[f] |
11 |
|
India |
1981 |
1992–1993 |
[a] |
11.5 |
|
|
Indonesia |
1980 |
|
1990 |
|
10 |
|
Iran |
1986 |
1996 |
10 |
||
|
Jordan |
1979 |
|
1994 |
15 |
|
|
Kazakhstan |
1989 |
1999 |
10 |
||
|
Kenya |
1969 |
1998 |
[c] |
29 |
|
|
Kyrgyzstan |
1989 |
1999 |
|
10 |
|
|
Malawi |
1987 |
2000 |
[f] |
13 |
|
|
Malaysia |
1980 |
|
1991 |
|
11 |
|
Ages |
||||||||
|
15 to 19 |
20 to 24 |
25 to 29 |
||||||
|
Survey 1 |
Survey 2 |
Annual Change |
Survey 1 |
Survey 2 |
Annual Change |
Survey 1 |
Survey 2 |
Annual Change |
|
n.a. |
2.7 |
|
25.8 |
25.6 |
0.0 |
64.1 |
61.1 |
−0.3 |
|
1.3 |
2.5 |
0.1 |
21.8 |
16.8 |
−0.5 |
70.0 |
57.0 |
−1.3 |
|
1.9 |
0.5 |
−0.1 |
n.a. |
12.8 |
|
n.a. |
45.3 |
|
|
6.7 |
5.0 |
−0.2 |
40.3 |
31.6 |
−0.9 |
78.8 |
73.6 |
−0.5 |
|
1.7 |
1.4 |
0.0 |
20.2 |
18.1 |
−0.2 |
47.3 |
39.8 |
−0.7 |
|
5.3 |
n.a. |
|
33.8 |
27.3 |
−0.4 |
70.7 |
64.9 |
−0.3 |
|
2.9 |
5.2 |
0.2 |
34.2 |
33.6 |
−0.1 |
70.2 |
67.5 |
−0.3 |
|
0.9 |
2.3 |
0.1 |
6.5 |
9.0 |
0.2 |
30.6 |
29.1 |
−0.2 |
|
2.3 |
4.3 |
0.1 |
29.9 |
29.0 |
−0.1 |
67.3 |
65.0 |
−0.1 |
|
2.5 |
1.4 |
−0.1 |
23.6 |
22.1 |
−0.1 |
58.6 |
61.0 |
0.2 |
|
5.0 |
0.8 |
−0.4 |
45.1 |
26.7 |
−1.7 |
76.7 |
70.5 |
−0.6 |
|
2.0 |
3.0 |
0.0 |
34.2 |
41.5 |
0.2 |
79.5 |
78.5 |
0.0 |
|
3.4 |
4.2 |
0.1 |
22.6 |
28.0 |
0.5 |
56.7 |
58.2 |
0.1 |
|
0.8 |
1.1 |
0.0 |
15.9 |
14.7 |
−0.1 |
56.4 |
47.5 |
−0.9 |
|
13.4 |
8.1 |
−0.3 |
49.8 |
45.6 |
−0.2 |
74.5 |
76.6 |
0.1 |
|
10.1 |
5.9 |
−0.1 |
53.9 |
43.7 |
−0.3 |
83.0 |
75.2 |
−0.2 |
|
2.2 |
5.3 |
0.3 |
24.5 |
25.4 |
0.1 |
63.5 |
59.8 |
−0.4 |
|
1.4 |
1.2 |
0.0 |
39.0 |
24.9 |
−1.2 |
82.7 |
77.2 |
−0.5 |
|
3.0 |
5.4 |
0.1 |
24.7 |
30.6 |
0.3 |
58.0 |
58.9 |
0.0 |
|
1.6 |
3.1 |
0.1 |
19.9 |
15.0 |
−0.3 |
60.1 |
41.9 |
−1.1 |
|
3.1 |
2.0 |
−0.1 |
25.5 |
19.2 |
−0.4 |
55.8 |
49.4 |
−0.4 |
|
4.0 |
4.4 |
0.0 |
24.9 |
32.3 |
0.5 |
56.8 |
70.3 |
0.9 |
|
3.9 |
4.5 |
0.0 |
34.0 |
33.5 |
0.0 |
66.9 |
65.2 |
−0.1 |
|
10.4 |
2.1 |
−0.8 |
19.3 |
11.8 |
−0.7 |
56.0 |
49.2 |
−0.7 |
|
3.4 |
4.5 |
0.1 |
32.7 |
34.5 |
0.1 |
64.2 |
63.4 |
0.0 |
|
6.1 |
3.4 |
−0.2 |
47.4 |
23.7 |
−1.5 |
84.6 |
70.8 |
−0.9 |
|
7.2 |
4.0 |
−0.1 |
38.6 |
29.2 |
−0.2 |
65.3 |
60.9 |
−0.1 |
|
2.9 |
1.7 |
−0.1 |
15.9 |
12.4 |
−0.4 |
47.6 |
42.7 |
−0.5 |
|
8.0 |
7.8 |
0.1 |
45.3 |
45.9 |
0.0 |
75.1 |
78.4 |
0.2 |
|
1.5 |
0.9 |
−0.1 |
23.8 |
12.1 |
−1.1 |
59.0 |
33.9 |
−2.3 |
|
5.8 |
2.6 |
−0.3 |
28.4 |
29.8 |
0.1 |
68.7 |
48.1 |
−1.9 |
|
12.5 |
8.9 |
−0.3 |
43.9 |
51.1 |
0.6 |
78.5 |
84.8 |
0.5 |
|
3.6 |
2.4 |
−0.1 |
40.6 |
28.3 |
−1.2 |
80.5 |
71.0 |
−1.0 |
|
6.8 |
2.6 |
−0.4 |
41.4 |
27.4 |
−1.4 |
81.5 |
72.8 |
−0.9 |
|
1.4 |
1.5 |
0.0 |
25.7 |
16.2 |
−0.6 |
66.0 |
57.6 |
−0.6 |
|
1.5 |
1.4 |
0.0 |
35.2 |
25.9 |
−0.9 |
79.4 |
67.0 |
−1.2 |
|
3.7 |
0.7 |
−0.1 |
27.5 |
22.6 |
−0.2 |
67.6 |
64.9 |
−0.1 |
|
1.2 |
1.2 |
0.0 |
37.5 |
28.4 |
−0.9 |
86.2 |
76.7 |
−1.0 |
|
5.7 |
4.0 |
−0.1 |
46.5 |
41.8 |
−0.4 |
82.2 |
86.4 |
0.3 |
|
1.3 |
1.4 |
0.0 |
19.6 |
14.3 |
−0.5 |
60.1 |
51.0 |
−0.8 |
|
Country |
Survey Year 1 |
Note |
Survey Year 2 |
Note |
Survey Interval |
|
Maldives |
1985 |
1995 |
10 |
||
|
Mali |
1976 |
1995–1996 |
[c] |
19.5 |
|
|
Mauritania |
1988 |
[a]* |
2000–2001 |
[f] |
12.5 |
|
Mauritius |
1972 |
1990 |
[f]* |
18 |
|
|
Mexico |
1980 |
1990 |
10 |
||
|
Morocco |
1982 |
|
1994 |
|
12 |
|
Mozambique |
1980 |
1997 |
[c] |
17 |
|
|
Myanmar |
1973 |
[a] |
1991 |
|
18 |
|
Namibia |
1960 |
1991 |
31 |
||
|
Nepal |
1981 |
|
1991 |
10 |
|
|
Nicaragua |
1971 |
1998 |
|
27 |
|
|
Niger |
1988 |
1998 |
[c] |
10 |
|
|
Occ. Palestinian Territory |
1967 |
[e]* |
1997 |
[e] |
30 |
|
Pakistan |
1981 |
|
1998 |
[d] |
17 |
|
Panama |
1980 |
1990 |
|
10 |
|
|
Paraguay |
1982 |
1992 |
10 |
||
|
Peru |
1981 |
1996 |
[c] |
15 |
|
|
Philippines |
1980 |
1995 |
15 |
||
|
Puerto Rico |
1980 |
1990 |
10 |
||
|
Rwanda |
1978 |
1996 |
[c]** |
18 |
|
|
Senegal |
1978 |
[c] |
1997 |
[c] |
19 |
|
South Africa |
1985 |
|
1996 |
11 |
|
|
Sudan |
1983 |
[a]*** |
1993 |
[a]* |
10 |
|
Tanzania |
1978 |
1996 |
[c] |
18 |
|
|
Thailand |
1980 |
1990 |
10 |
||
|
Trinidad & Tobago |
1980 |
1990 |
10 |
||
|
Tunisia |
1984 |
1994 |
10 |
||
|
Turkey |
1980 |
|
1990 |
10 |
|
|
Uganda |
1969 |
1995 |
[c] |
26 |
|
|
Uruguay |
1985 |
|
1996 |
|
11 |
|
Venezuela |
1974 |
1990 |
16 |
||
|
Zambia |
1980 |
1999 |
19 |
||
|
Zimbabwe |
1982 |
1999 |
[c] |
17 |
|
|
Unless otherwise noted, source of survey data is UN Statistics Division. [a] SOURCE: U.S. Bureau of the Census, International Database. [b] SOURCE: U.S. Bureau of the Census, International Database, National Demographic and Health Survey. [c] SOURCE: National Demographic and Health Survey. [d] UN Statistics Division—preliminary. [e] UN Statistics Division and U.S. Bureau of the Census, International Database. [f] SOURCE: Other or Unidentified. |
|||||
APPENDIX TABLE 7-2 Percentage of Women Ever Married by Ages 18, 20, 25 by Age at Time of Survey in 51 DHS Countries
|
Country and Year of Survey |
Married by Age 18 |
Married by Age 20 |
Married by Age 25 |
|||||
|
20-24-Year-Olds |
30-34-Year-Olds |
40-44-Year-Olds |
20-24-Year-Olds |
30-34-Year-Olds |
40-44-Year-Olds |
30-34-Year-Olds |
40-44-Year-Olds |
|
|
Armenia, 2000 |
19.1 |
16.8 |
11.9 |
37.2 |
48.8 |
38.9 |
87.7 |
78.2 |
|
Bangladesh, 1999-2000 |
65.3 |
80.8 |
89.4 |
75.4 |
90.2 |
95.1 |
98.1 |
98.4 |
|
Benin, 1996 |
38.8 |
46.9 |
46.1 |
65.4 |
67.8 |
69.7 |
91.1 |
95.3 |
|
Bolivia, 1998 |
21.2 |
24.0 |
22.1 |
38.5 |
41.8 |
42.9 |
76.2 |
78.4 |
|
Brazil, 1996 |
23.7 |
23.3 |
21.0 |
38.8 |
40.8 |
39.3 |
75.1 |
76.8 |
|
Burkina Faso, 1998-1999 |
62.3 |
64.8 |
64.0 |
84.1 |
84.4 |
87.5 |
96.5 |
97.7 |
|
Cameroon, 1998 |
43.4 |
56.8 |
60.8 |
61.2 |
71.9 |
76.7 |
88.2 |
92.7 |
|
Central African Republic, 1994-1995 |
57.0 |
57.0 |
64.6 |
73.5 |
75.4 |
80.6 |
89.8 |
91.0 |
|
Chad, 1996-1997 |
71.4 |
71.1 |
77.9 |
86.3 |
84.9 |
86.9 |
97.8 |
97.0 |
|
Colombia, 2000 |
21.4 |
18.7 |
24.4 |
37.1 |
35.5 |
39.7 |
65.9 |
71.2 |
|
Comoros, 1996 |
29.7 |
47.4 |
54.5 |
39.8 |
61.8 |
69.0 |
80.2 |
90.1 |
|
Côte d’Ivoire, 1998-1999 |
33.2 |
46.1 |
49.7 |
49.5 |
64.4 |
66.1 |
82.8 |
88.9 |
|
Dominican Republic, 1996 |
37.6 |
36.6 |
42.4 |
53.4 |
53.0 |
58.0 |
81.8 |
81.5 |
|
Egypt, 2000 |
19.5 |
34.6 |
43.0 |
35.9 |
50.8 |
59.5 |
81.7 |
83.8 |
|
Ethiopia, 1999 |
49.1 |
74.0 |
79.4 |
64.7 |
85.2 |
91.4 |
94.9 |
98.6 |
|
Ghana, 1998-1999 |
35.5 |
41.8 |
40.7 |
56.4 |
62.3 |
65.0 |
88.5 |
88.0 |
|
Guatemala, 1998-1999 |
34.3 |
38.4 |
40.1 |
55.5 |
56.7 |
60.1 |
86.1 |
83.2 |
|
Guinea, 1999 |
64.5 |
69.7 |
68.5 |
78.8 |
81.1 |
82.3 |
94.5 |
96.6 |
|
Haiti, 2000 |
24.1 |
25.0 |
26.0 |
43.0 |
43.2 |
49.8 |
74.7 |
77.8 |
|
India, 1998-2000 |
46.2 |
59.8 |
63.1 |
65.6 |
77.4 |
80.8 |
93.7 |
95.8 |
|
Indonesia, 1997 |
29.6 |
42.2 |
49.1 |
47.0 |
60.1 |
67.2 |
84.6 |
89.2 |
|
Jordan, 1997 |
13.5 |
20.1 |
35.0 |
26.5 |
35.0 |
53.0 |
67.3 |
83.3 |
|
Kazakhstan, 1999 |
14.4 |
6.6 |
7.7 |
39.9 |
31.9 |
29.3 |
83.4 |
80.8 |
|
Kenya, 1998 |
24.6 |
37.2 |
48.0 |
46.1 |
55.7 |
66.1 |
82.5 |
90.4 |
|
Kyrgyz Republic, 1997 |
21.2 |
10.4 |
15.7 |
58.4 |
40.2 |
46.7 |
88.5 |
91.6 |
|
Madagascar, 1997 |
40.4 |
40.4 |
49.5 |
61.5 |
57.9 |
63.6 |
84.4 |
86.0 |
|
Malawi, 2000 |
46.9 |
53.9 |
55.7 |
72.9 |
75.8 |
77.0 |
94.7 |
93.7 |
|
Mali, 2001 |
65.4 |
68.4 |
66.0 |
80.9 |
80.2 |
80.4 |
93.8 |
95.0 |
|
Morocco, 1992 |
18.4 |
31.6 |
42.9 |
31.4 |
50.4 |
64.1 |
75.1 |
88.7 |
|
Mozambique, 1997 |
56.6 |
55.6 |
59.9 |
77.8 |
72.5 |
76.3 |
90.6 |
93.2 |
|
Namibia, 1992 |
11.5 |
14.7 |
14.1 |
20.1 |
24.7 |
28.2 |
50.4 |
53.3 |
|
Nepal, 2000-2001 |
56.1 |
65.5 |
69.6 |
74.5 |
82.3 |
84.2 |
94.9 |
96.3 |
|
Nicaragua, 1997-1998 |
50.3 |
46.6 |
49.4 |
65.6 |
65.6 |
67.4 |
87.4 |
90.3 |
|
Niger, 1998 |
76.6 |
86.4 |
89.1 |
85.1 |
91.4 |
95.5 |
97.9 |
99.6 |
|
Nigeria, 1999 |
39.6 |
52.0 |
56.1 |
52.7 |
64.9 |
70.3 |
86.3 |
91.9 |
|
Pakistan, 1990-1991 |
31.6 |
47.8 |
44.8 |
48.9 |
63.1 |
60.9 |
87.7 |
87.7 |
|
Paraguay, 1990 |
24.2 |
23.5 |
23.4 |
40.5 |
43.1 |
44.4 |
74.9 |
74.3 |
|
Peru, 2000 |
18.7 |
22.7 |
23.3 |
33.6 |
38.0 |
39.2 |
69.5 |
70.1 |
|
Philippines, 1998 |
14.6 |
18.0 |
20.2 |
27.5 |
34.2 |
36.8 |
68.3 |
71.7 |
|
Rwanda, 2000 |
19.5 |
19.7 |
21.5 |
41.6 |
40.0 |
45.0 |
82.0 |
87.0 |
|
Senegal, 1997 |
36.1 |
55.7 |
61.9 |
50.6 |
70.0 |
76.6 |
87.5 |
94.5 |
|
South Africa, 1997 |
7.9 |
14.2 |
15.1 |
14.2 |
26.9 |
30.3 |
51.5 |
59.9 |
|
Tanzania, 1999 |
39.3 |
44.9 |
61.2 |
61.8 |
68.2 |
78.9 |
88.8 |
92.7 |
|
Togo, 1998 |
30.5 |
40.6 |
40.4 |
48.4 |
62.8 |
61.0 |
89.0 |
89.2 |
|
Turkey, 1998 |
23.0 |
27.9 |
43.0 |
42.8 |
47.5 |
66.2 |
82.4 |
89.3 |
|
Uganda, 2000-2001 |
53.9 |
52.6 |
59.5 |
74.7 |
74.4 |
76.7 |
92.4 |
94.8 |
|
Uzbekistan, 1996 |
15.3 |
12.7 |
18.0 |
55.7 |
42.7 |
56.2 |
90.1 |
91.3 |
|
Vietnam, 1997 |
12.4 |
14.7 |
13.2 |
35.9 |
34.8 |
34.6 |
76.9 |
77.6 |
|
Yemen, 1991-1992 |
49.2 |
72.5 |
71.3 |
62.6 |
82.4 |
79.8 |
94.4 |
92.4 |
|
Zambia, 1996-1997 |
44.2 |
51.7 |
57.8 |
64.3 |
69.8 |
76.4 |
90.7 |
94.4 |
|
Zimbabwe, 1999 |
28.7 |
28.0 |
39.4 |
52.9 |
54.1 |
62.3 |
85.3 |
90.0 |
APPENDIX TABLE 7-3 Percentage of Men Ever Married by Ages 20, 25, and 30 by Age at Time of Survey in 32 DHS Countries
|
Country and Year of Survey |
Married by Age 20 |
Married by Age 25 |
Married by Age 30 |
||||
|
20-24-Year-Olds |
30-34-Year-Olds |
40-44-Year-Olds |
30-34-Year-Olds |
40-44-Year-Olds |
30-34-Year-Olds |
40-44-Year-Olds |
|
|
Armenia, 2000 |
5.0 |
5.2 |
3.5 |
52.3 |
62.3 |
85.7 |
86.6 |
|
Benin, 1996 |
14.3 |
20.6 |
21.5 |
59.5 |
58.4 |
85.2 |
84.8 |
|
Bolivia, 1998 |
18.1 |
20.4 |
19.2 |
61.1 |
61.8 |
82.5 |
79.1 |
|
Brazil, 1996 |
13.7 |
18.3 |
9.7 |
59.0 |
58.3 |
81.5 |
86.9 |
|
Burkina Faso, 1998-1999 |
9.3 |
9.6 |
11.5 |
48.1 |
46.8 |
82.9 |
76.6 |
|
Cameroon, 1998 |
15.2 |
13.1 |
11.4 |
49.2 |
52.4 |
73.3 |
80.5 |
|
Central African Republic, 1994-1995 |
28.5 |
28.9 |
28.4 |
62.7 |
57.5 |
84.9 |
74.7 |
|
Chad, 1996-1997 |
26.1 |
26.1 |
26.1 |
69.9 |
65.2 |
92.5 |
90.9 |
|
Comoros, 1996 |
8.7 |
14.3 |
13.0 |
44.2 |
48.1 |
74.0 |
72.2 |
|
Côte d’Ivoire, 1998-1999 |
9.9 |
11.0 |
18.2 |
39.5 |
54.1 |
72.3 |
74.8 |
|
Dominican Republic, 1996 |
18.6 |
18.9 |
12.1 |
56.3 |
54.9 |
80.0 |
77.1 |
|
Ethiopia, 1999 |
12.1 |
20.1 |
24.7 |
53.9 |
56.4 |
81.5 |
85.2 |
|
Gabon, 2000 |
21.5 |
22.9 |
24.4 |
57.6 |
68.3 |
79.4 |
85.1 |
|
Ghana, 1998-1999 |
12.1 |
18.4 |
13.3 |
51.3 |
48.7 |
80.0 |
77.4 |
|
Guinea, 1999 |
10.5 |
16.1 |
8.7 |
45.1 |
36.9 |
69.7 |
69.2 |
|
Haiti, 2000 |
15.8 |
14.9 |
26.5 |
44.8 |
52.4 |
64.2 |
78.1 |
|
Kazakhstan, 1999 |
9.5 |
7.9 |
6.1 |
61.8 |
67.9 |
80.6 |
92.1 |
|
Kenya, 1998 |
7.6 |
11.6 |
11.6 |
50.1 |
59.1 |
84.9 |
87.4 |
|
Malawi, 2000 |
14.8 |
23.3 |
26.7 |
69.1 |
72.6 |
94.1 |
93.5 |
|
Mali, 2001 |
9.7 |
11.0 |
4.4 |
47.1 |
33.3 |
78.1 |
68.8 |
|
Mozambique, 1997 |
30.8 |
29.7 |
27.8 |
72.7 |
78.5 |
90.6 |
90.7 |
|
Nicaragua, 1997-1998 |
38.7 |
32.1 |
29.1 |
71.6 |
71.9 |
89.6 |
88.1 |
|
Niger, 1998 |
21.0 |
26.0 |
33.7 |
64.8 |
73.8 |
89.6 |
90.6 |
|
Nigeria, 1999 |
10.8 |
16.7 |
19.5 |
45.8 |
50.9 |
76.7 |
74.8 |
|
Peru, 1996 |
14.7 |
17.3 |
14.8 |
56.3 |
50.2 |
74.8 |
79.1 |
|
Senegal, 1997 |
2.5 |
4.2 |
7.8 |
23.6 |
37.4 |
50.1 |
70.0 |
|
Tanzania, 1999 |
12.2 |
21.9 |
19.2 |
60.1 |
53.1 |
88.8 |
86.9 |
|
Togo, 1998 |
9.5 |
18.4 |
16.9 |
51.8 |
53.5 |
77.5 |
82.0 |
|
Turkey, 1998 |
27.5 |
12.8 |
25.8 |
63.1 |
72.2 |
92.6 |
94.5 |
|
Uganda, 2000-2001 |
21.5 |
25.2 |
26.9 |
70.4 |
72.3 |
92.5 |
91.9 |
|
Zambia, 1996-1997 |
11.3 |
15.7 |
20.3 |
61.8 |
57.1 |
86.4 |
86.7 |
|
Zimbabwe, 1999 |
7.6 |
14.0 |
14.1 |
58.2 |
59.7 |
88.1 |
87.8 |
APPENDIX TABLE 7-4 Percentage of Women Ages 20-24 Ever Married by Age 18, by Years of Schooling, Household Economic Status, and Rural-Urban Residence in DHS Countries
|
Country and Year of Survey |
Years of Schooling |
||
|
0-3 |
4-7 |
8+ |
|
|
Armenia, 2000 |
n.a. |
n.a. |
n.a. |
|
Bangladesh, 1999-2000 |
84.7 |
67.1 |
33.2 |
|
Benin, 1996 |
43.9 |
28.6 |
1.9 |
|
Bolivia, 1998 |
39.8 |
34.3 |
12.2 |
|
Brazil, 1996 |
41.3 |
30.5 |
12.9 |
|
Burkina Faso, 1998-1999 |
69.2 |
40.8 |
9.5 |
|
Cameroon, 1998 |
76.6 |
42.3 |
21.8 |
|
Central African Republic, 1994-1995 |
59.6 |
58.1 |
39.2 |
|
Chad, 1996-1997 |
74.6 |
56.8 |
30.8 |
|
Colombia, 2000 |
39.0 |
22.6 |
2.2 |
|
Comoros, 1996 |
37.6 |
29.1 |
15.1 |
|
Côte d’Ivoire, 1998-1999 |
42.0 |
33.3 |
6.5 |
|
Dominican Republic, 1996 |
74.7 |
61.1 |
22.3 |
|
Egypt, 2000 |
41.2 |
27.9 |
7.6 |
|
Ethiopia, 1999 |
53.7 |
42.9 |
15.5 |
|
Ghana, 1998-1999 |
45.3 |
37.3 |
29.2 |
|
Guatemala, 1998-1999 |
48.5 |
38.8 |
7.3 |
|
Guinea, 1999 |
71.2 |
50.8 |
20.6 |
|
Haiti, 2000 |
37.7 |
23.0 |
10.6 |
|
India, 1998-2000 |
n.a. |
n.a. |
n.a. |
|
Indonesia, 1997 |
50.2 |
43.0 |
12.5 |
|
Jordan, 1997 |
19.7 |
28.6 |
11.0 |
|
Kazakhstan, 1999 |
n.a. |
n.a. |
n.a. |
|
Kenya, 1998 |
52.0 |
39.2 |
14.4 |
|
Kyrgyz Republic, 1997 |
n.a. |
n.a. |
n.a. |
|
Household Economic Status |
||||
|
Low (bottom 40%) |
Middle (mid 40%) |
High (top 20%) |
Residence |
|
|
Rural |
Urban |
|||
|
28.7 |
15.5 |
10.7 |
30.8 |
12.1 |
|
n.a. |
n.a. |
n.a. |
69.9 |
48.2 |
|
51.0 |
37.5 |
17.3 |
46.1 |
27.8 |
|
35.7 |
18.3 |
10.4 |
35.1 |
16.8 |
|
29.9 |
21.9 |
15.9 |
30.1 |
22.2 |
|
72.0 |
68.6 |
38.6 |
69.9 |
32.0 |
|
59.8 |
39.8 |
27.8 |
51.3 |
30.2 |
|
59.4 |
59.2 |
48.5 |
59.2 |
54.2 |
|
73.2 |
72.6 |
64.8 |
73.6 |
64.7 |
|
34.8 |
14.5 |
13.4 |
33.7 |
18.4 |
|
39.8 |
32.1 |
10.8 |
33.0 |
22.5 |
|
47.3 |
35.2 |
14.7 |
43.0 |
23.5 |
|
58.5 |
31.2 |
18.4 |
50.3 |
31.6 |
|
n.a. |
n.a. |
n.a. |
26.1 |
11.4 |
|
59.8 |
50.3 |
31.8 |
53.2 |
31.8 |
|
41.0 |
39.7 |
20.3 |
41.6 |
25.3 |
|
49.6 |
33.5 |
11.6 |
43.9 |
24.7 |
|
81.2 |
65.0 |
40.3 |
75.3 |
46.2 |
|
32.5 |
27.0 |
10.3 |
30.7 |
17.8 |
|
n.a. |
n.a. |
n.a. |
54.0 |
25.9 |
|
n.a. |
n.a. |
n.a. |
38.4 |
13.2 |
|
n.a. |
n.a. |
n.a. |
15.3 |
13.1 |
|
15.3 |
13.8 |
13.0 |
16.7 |
12.4 |
|
30.3 |
26.4 |
14.7 |
26.2 |
20.7 |
|
23.7 |
20.2 |
17.7 |
22.3 |
18.6 |
|
Household Economic Status |
||||
|
Low (bottom 40%) |
Middle (mid 40%) |
High (top 20%) |
Residence |
|
|
Rural |
Urban |
|||
|
51.4 |
41.2 |
17.7 |
43.9 |
31.6 |
|
50.5 |
52.8 |
30.2 |
50.4 |
32.3 |
|
72.6 |
69.2 |
42.0 |
74.3 |
45.7 |
|
n.a. |
n.a. |
n.a. |
24.2 |
12.9 |
|
67.6 |
52.4 |
42.6 |
59.7 |
47.0 |
|
14.3 |
13.2 |
4.6 |
13.7 |
8.1 |
|
n.a. |
n.a. |
n.a. |
58.7 |
38.4 |
|
64.9 |
40.3 |
28.2 |
60.5 |
44.6 |
|
86.7 |
83.9 |
48.3 |
85.7 |
45.7 |
|
62.5 |
31.6 |
16.7 |
45.9 |
26.4 |
|
n.a. |
n.a. |
n.a. |
36.9 |
21.3 |
|
n.a. |
n.a. |
n.a. |
31.7 |
18.4 |
|
36.3 |
13.8 |
5.0 |
34.9 |
12.3 |
|
n.a. |
n.a. |
n.a. |
20.4 |
10.7 |
|
22.8 |
18.0 |
17.5 |
19.2 |
20.5 |
|
56.0 |
46.7 |
14.5 |
53.1 |
15.4 |
|
12.5 |
5.2 |
4.3 |
12.3 |
4.7 |
|
48.9 |
41.0 |
25.4 |
47.6 |
22.5 |
|
41.9 |
30.8 |
17.4 |
40.8 |
16.9 |
|
n.a. |
n.a. |
n.a. |
26.6 |
19.4 |
|
62.6 |
54.6 |
39.2 |
58.9 |
33.7 |
|
18.9 |
12.3 |
13.0 |
16.0 |
14.1 |
|
n.a. |
n.a. |
n.a. |
14.4 |
5.1 |
|
n.a. |
n.a. |
n.a. |
53.9 |
35.7 |
|
55.2 |
46.4 |
28.4 |
52.3 |
34.1 |
|
35.0 |
31.5 |
16.2 |
35.9 |
20.6 |
|
38 |
38 |
38 |
51 |
51 |
APPENDIX TABLE 7-5 Percentage of Men Ages 20-24 Ever Married by Age 20, by Years of Schooling, Household Eeconomic Status, and Rural-Urban Residence in DHS Countries
|
Household Economic Status |
||||
|
Low (bottom 40%) |
Middle (mid 40%) |
High (top 20%) |
Residence |
|
|
Rural |
Urban |
|||
|
5.2 |
4.2 |
6.1 |
5.2 |
4.9 |
|
21.6 |
14.9 |
4.6 |
22.2 |
5.3 |
|
27.7 |
20.6 |
6.4 |
26.5 |
15.8 |
|
18.5 |
11.3 |
9.7 |
11.2 |
14.3 |
|
12.7 |
8.8 |
6.7 |
11.2 |
4.7 |
|
24.3 |
13.0 |
8.5 |
20.1 |
7.7 |
|
37.3 |
24.5 |
19.3 |
39.5 |
19.0 |
|
33.7 |
25.7 |
18.0 |
30.2 |
18.1 |
|
9.4 |
8.3 |
8.5 |
3.9 |
15.7 |
|
16.5 |
9.6 |
2.6 |
14.3 |
5.0 |
|
22.4 |
17.0 |
11.1 |
19.4 |
18.0 |
|
20.7 |
10.2 |
2.0 |
13.9 |
2.3 |
|
n.a. |
n.a. |
n.a. |
31.0 |
19.4 |
|
12.8 |
15.0 |
2.9 |
16.8 |
4.9 |
|
15.4 |
13.7 |
1.1 |
15.3 |
4.7 |
|
15.1 |
20.8 |
8.1 |
22.8 |
8.2 |
|
4.1 |
15.2 |
7.0 |
7.5 |
11.0 |
|
10.5 |
8.3 |
3.8 |
7.7 |
7.5 |
|
19.0 |
16.4 |
6.2 |
17.2 |
5.0 |
|
15.3 |
8.0 |
7.0 |
11.2 |
7.7 |
|
58.4 |
26.5 |
6.1 |
34.1 |
22.3 |
|
47.2 |
34.1 |
32.6 |
43.5 |
35.3 |
|
18.6 |
32.0 |
9.9 |
26.9 |
7.4 |
|
19.9 |
8.8 |
3.4 |
14.4 |
3.3 |
|
25.4 |
15.3 |
3.5 |
23.2 |
11.7 |
|
4.1 |
3.0 |
0.4 |
4.7 |
0.8 |
|
16.4 |
12.4 |
7.6 |
14.0 |
7.8 |
|
11.8 |
12.8 |
1.6 |
14.0 |
3.9 |
|
36.9 |
21.3 |
10.0 |
31.1 |
25.3 |
|
23.9 |
22.9 |
14.4 |
22.4 |
18.1 |
|
14.0 |
15.6 |
2.3 |
13.6 |
8.6 |
|
9.7 |
9.2 |
2.3 |
10.7 |
3.8 |
|
31 |
31 |
31 |
32 |
32 |
APPENDIX TABLE 7-6 Percentage Distribution of Spouse/Partner Age Differences, Among Women Currently in First Marriage, by Age in 42 DHS Countries
|
Country and Year of Survey |
Spouse/Partner Age Difference |
|||||
|
0-5 Years |
6-10 Years |
11+ Years |
||||
|
25-29-Year-Olds |
45-49-Year-Olds |
25-29-Year-Olds |
45-49-Year-Olds |
25-29-Year-Olds |
45-49-Year-Olds |
|
|
Armenia, 2000 |
55.0 |
70.7 |
36.4 |
20.5 |
8.6 |
8.7 |
|
Bangladesh, 1999-2000 |
25.4 |
20.5 |
47.5 |
36.0 |
27.1 |
43.5 |
|
Benin, 2001 |
44.8 |
33.1 |
27.5 |
23.4 |
27.7 |
43.5 |
|
Bolivia, 1998 |
73.6 |
75.2 |
19.4 |
17.0 |
7.0 |
7.8 |
|
Brazil, 1996 |
65.7 |
70.8 |
24.1 |
18.9 |
10.2 |
10.3 |
|
Burkina Faso, 1998-1999 |
39.9 |
40.3 |
23.6 |
15.8 |
36.5 |
44.0 |
|
Cameroon, 1998 |
35.5 |
34.1 |
29.2 |
19.7 |
35.3 |
46.3 |
|
Central African Republic, 1994-1995 |
52.9 |
52.4 |
28.1 |
20.1 |
19.1 |
27.4 |
|
Chad, 1996-1997 |
33.7 |
25.3 |
33.7 |
22.4 |
32.6 |
52.2 |
|
Colombia, 2000 |
66.2 |
59.6 |
21.5 |
24.8 |
12.2 |
15.6 |
|
Comoros, 1996 |
33.3 |
22.5 |
30.6 |
29.2 |
36.0 |
48.3 |
|
Dominican Republic, 1996 |
54.6 |
54.4 |
28.0 |
30.3 |
17.4 |
15.3 |
|
Egypt, 2000 |
43.5 |
44.4 |
38.3 |
30.6 |
18.3 |
24.9 |
|
Ethiopia, 1999 |
41.8 |
25.0 |
35.6 |
39.2 |
22.6 |
35.9 |
|
Ghana, 1998-1999 |
50.7 |
36.9 |
28.5 |
29.6 |
20.8 |
33.6 |
|
Guatemala, 1998-1999 |
71.7 |
70.3 |
20.3 |
17.7 |
8.0 |
11.9 |
|
Guinea, 1999 |
13.4 |
15.6 |
30.0 |
26.1 |
56.6 |
58.3 |
|
Haiti, 2000 |
50.2 |
62.1 |
30.1 |
24.8 |
19.7 |
13.1 |
|
India, 1998-2000 |
53.8 |
52.6 |
35.2 |
30.2 |
10.9 |
17.2 |
|
Jordan, 1997 |
57.0 |
41.1 |
32.6 |
38.2 |
10.4 |
20.7 |
|
Kazakhstan, 1999 |
83.0 |
85.3 |
14.9 |
9.1 |
2.0 |
5.6 |
|
Kenya, 1998 |
47.4 |
47.9 |
35.0 |
28.8 |
17.6 |
23.3 |
|
Kyrgyz Republic, 1997 |
85.7 |
64.9 |
11.8 |
27.3 |
2.5 |
7.8 |
|
Madagascar, 1997 |
59.9 |
66.2 |
27.3 |
18.3 |
12.8 |
15.5 |
|
Malawi, 2000 |
61.6 |
61.3 |
28.5 |
27.0 |
9.9 |
11.7 |
|
Mali, 2001 |
20.5 |
21.7 |
37.1 |
30.2 |
42.3 |
48.0 |
|
Mozambique, 1997 |
53.4 |
50.4 |
26.2 |
21.3 |
20.3 |
28.2 |
|
Nepal, 2000-2001 |
71.9 |
58.3 |
21.8 |
25.9 |
6.3 |
15.8 |
|
Nicaragua, 1997-1998 |
66.8 |
62.8 |
19.9 |
22.3 |
13.4 |
14.9 |
|
Niger, 1998 |
30.4 |
30.3 |
37.3 |
32.4 |
32.3 |
37.3 |
|
Nigeria, 1999 |
27.3 |
26.7 |
38.2 |
26.6 |
34.5 |
46.7 |
|
Peru, 2000 |
67.5 |
66.5 |
23.0 |
22.4 |
9.5 |
11.1 |
|
Philippines, 1998 |
74.4 |
80.7 |
18.3 |
13.9 |
7.3 |
5.4 |
|
Rwanda, 2000 |
57.2 |
78.1 |
27.0 |
12.3 |
15.9 |
9.5 |
|
South Africa, 1998 |
59.5 |
69.4 |
25.8 |
18.6 |
14.7 |
12.0 |
|
Togo, 1998 |
46.4 |
35.4 |
29.3 |
23.3 |
24.2 |
41.3 |
|
Turkey, 1998 |
65.5 |
66.4 |
27.9 |
24.7 |
6.6 |
8.9 |
|
Uganda, 2000-2001 |
56.8 |
42.3 |
30.2 |
30.1 |
13.0 |
27.6 |
|
Uzbekistan, 1996 |
89.0 |
70.6 |
9.6 |
23.9 |
1.4 |
5.6 |
|
Vietnam, 1997 |
80.1 |
74.9 |
16.9 |
16.1 |
3.0 |
9.0 |
|
Zambia, 2001-2002 |
52.6 |
33.9 |
35.2 |
37.1 |
12.2 |
29.1 |
|
Zimbabwe, 1999 |
54.8 |
44.3 |
26.7 |
28.8 |
18.5 |
26.9 |


