
8
The Transition to Parenthood
INTRODUCTION
Becoming a parent for the first time is a major transition at any age, and it is especially so for an adolescent or young adult. While age is one important indicator of readiness for parenthood, other factors, such as family circumstances and social support systems, are also important and can influence young parents’ chances of success. Furthermore, in the context of rapid and persistent global changes discussed throughout this book—including rising rates of return to postprimary schooling, the pervasiveness of market-led economic change, advances in medical knowledge and practice, democratization and the rise of civil society, expansion of knowledge sharing networks, and the emergence and spread of new communicable diseases—the prerequisites for preparedness to be a parent are changing and the significance and consequences of early childbearing are assuming new meanings.
Our discussion suggests that success as a first-time parent in many of the contexts in which young people are growing up today is more likely to be ensured if other adult transitions occur prior to parenthood. This is because each of these other transitions to adult roles—to work, to citizenship, and to marriage—prepares the way for parenthood and contributes resources for success. While this sequencing does not ensure success and success can occur through a variety of transition pathways, many of the social and institutional supports for effective parenthood are built around this sequencing and therefore are particularly supportive of it. For example,
in most settings, schooling is often not an option for parents, particularly mothers, although in this area change is beginning to be seen.
The moment that young people become first-time parents, they become major actors in shaping the health and well-being of the next generation. There is a vast and growing literature on the determinants of success in early childhood. Not surprisingly, parental income, schooling, health knowledge, and the availability of community services have all been documented to be important to child survival and early childhood health and development in a diverse range of developing country settings (Bicego and Boerma, 1993; Cleland and van Ginneken, 1988; Hales et al., 1999; Mahy 2003; United Nations 1991; World Health Organization, 2000). The literature on rates of returns to schooling documents empirically the myriad social benefits that come from investing in schooling, particularly for girls, including smaller family size, better child health, and greater investments in schooling for the next generation. Because of the many global changes we have discussed, there is also increasing recognition that motherhood involves not only a caretaking role but also a role as an economic provider, as has always been the case for fatherhood (Bruce, Lloyd, and Leonard, 1995).
Social concerns about the implications of premature parenthood arise for several reasons. One is the potential health consequences for very young women of pregnancy and birth if their physiological development is incomplete. Other consequences may include premature exit from school, reduced earnings prospects, reduced chances of community participation and the acquisition of social capital, a heightened possibility of divorce or single parenthood, and a greater risk of living in poverty. These other consequences of early parenthood are likely to be greater for young women than young men; in most societies, women have the primary responsibility of child care and childrearing, and parenthood for them often coincides with a shrinking of opportunities and reduced scope for independent action.
We begin with an empirical overview of trends in the timing of first parenthood in developing countries, relying primarily on data from the Demographic and Health Surveys (DHS), which are unique in their careful and comparable measurement of women’s birth histories (see Appendix A for further discussion). While the data on young men are more limited, we explore age patterns of parenthood for both. We then go into more depth on early motherhood, presenting data on trends as well as a review of the literature on consequences. Next, we present data on the sequencing of parenthood with marriage, including trends in premarital childbearing as well as trends in the length of the first birth interval. After reviewing the limited evidence on the consequences of premarital childbearing, we explore some of the factors affecting the changing context of first-time parenthood, including the rise of formal schooling, the rise in paid employment among women, changes in health and health behaviors, in particular HIV,
and finally changes in access to and use of prenatal and delivery services, with particular implications for the service context surrounding first births. We draw on both qualitative and quantitative research material to describe the changing context of first parenthood. In our brief discussion of policies and programs affecting the transition to parenthood, we focus primarily on those that position young people for success as first-time parents.
THE TIMING OF THE TRANSITION TO PARENTHOOD
Gender Differences in Age Patterns of First Parenthood
As noted above, information on the timing of fatherhood is scarce, and it is difficult to obtain comparable indicators for men and women. Data on the age patterns of first parenthood are one of the few measures available
TABLE 8-1 Parenthood by Age and Sex (percentage)—Weighteda Regional Averages, DHS Countries
|
Region and Country |
Regional Population (male) |
Who Ever Fathered a Child, Among Men Ages: |
|||
|
15-19 |
20-24 |
25-29 |
30-34 |
||
|
Africa |
|||||
|
Eastern/Southern Africa |
49.3 |
1.7 |
24.0 |
65.4 |
86.6 |
|
Western/Middle Africa |
71.4 |
1.5 |
13.4 |
49.7 |
79.6 |
|
Asiab |
|||||
|
South-central/South-eastern Asia |
n.a. |
n.a. |
n.a. |
n.a. |
n.a. |
|
Former Soviet Asiac |
n.a. |
n.a. |
n.a. |
n.a. |
n.a. |
|
Latin America and Caribbean |
|||||
|
Caribbean/Central America |
13.7 |
1.7 |
26.8 |
56.8 |
79.0 |
|
South America |
60.3 |
3.0 |
23.1 |
53.7 |
77.9 |
|
Middle East |
|||||
|
Western Asia/Northern Africa |
n.a. |
n.a. |
n.a. |
n.a. |
n.a. |
|
TOTAL—All DHS |
56.2 |
2.1 |
20.8 |
55.7 |
81.0 |
|
aWeighting is based on United Nations population estimates for year 2000 (World Population Prospects: The 2000 Revision, POP/DB/WPP/Rev. 2000/3/F1. February 2001). bEastern Asia not included; no DHS available. cFormer Soviet Asia includes former Soviet Republics in South-central and Western Asia. |
|||||
for both. Table 8-1 shows that the proportion of men ages 15-19 who report that they have had a child is extremely low: 2-3 percent in the regions for which information is available. This is much lower than the proportion of adolescent women ages 15-19 who have done so (6-21 percent). Even at ages 20-24, young men are much less likely to have made the transition to fatherhood than young women: about 25 percent have done so in Latin America, compared with twice as many young women (50-60 percent). The differential is even larger in sub-Saharan Africa, where young women are three to five times as likely to have become a parent in their early 20s as young men. By their late 20s, however, 50-65 percent of men in Latin America and sub-Saharan Africa have become fathers, although this proportion is still lower than that among women of this age (74-89 percent). Gender differences in age patterns of parenthood reflect spousal age differences, discussed in Chapter 7.
|
Regional Population (female) |
Who Ever Had a Child, Among Women Ages: |
|||
|
15-19 |
20-24 |
25-29 |
30-34 |
|
|
91.7 |
18.4 |
69.9 |
89.1 |
95.1 |
|
75.2 |
21.1 |
64.4 |
85.8 |
93.6 |
|
86.0 |
15.2 |
59.8 |
84.7 |
92.7 |
|
68.4 |
5.6 |
55.1 |
86.1 |
93.9 |
|
21.0 |
17.3 |
60.5 |
82.4 |
91.2 |
|
74.1 |
13.9 |
49.8 |
74.7 |
87.5 |
|
54.9 |
6.8 |
43.5 |
74.1 |
88.4 |
|
77.8 |
15.2 |
59.2 |
83.6 |
92.3 |
|
NOTES: n.a. = not available. Regional groupings based on United Nations World Population Prospects: The 2002 Revision (United Nations, 2003b). SOURCES: Demographic and Health Surveys tabulations from 51 countries (females) and 26 countries (males). See Appendix Table 8-1 for data from each country. |
||||
Trends in the Distribution of Ages at First Motherhood
We compare the distribution of ages at first birth among women from three cohorts: those who were ages 40-44 at the time of the most recent DHS survey (born roughly in the 1950s), those who were ages 30-34 (born roughly in the 1960s), and those who were ages 20-24 (born roughly in the 1970s). In Table 8-2 we present the ages when 25 percent, 50 percent, and 75 percent of women had made the transition to motherhood, by region, using life table analysis.
The first thing to observe about the table is that, for the youngest cohort, a quarter of women remain childless until after age 24 in all regions. This substantial and worldwide pattern is apparent from the footnotes in
TABLE 8-2 Age of Transition to First Motherhood by Quartile—Weighted Region and Income Averages, DHS Countries
|
Region or Income Level |
25th Quartile |
||
|
20-24 |
30-34 |
40-44 |
|
|
Region |
|||
|
Africa |
|||
|
Eastern/Southern Africa |
17.9 |
17.2 |
17.0 |
|
Western/Middle Africa |
17.4 |
16.8 |
16.4 |
|
Asia |
|||
|
South-central/South-eastern Asiaa |
18.2 |
17.6 |
17.7 |
|
Former Soviet Asia |
19.9 |
20.2 |
20.0 |
|
Latin America and Caribbean |
|||
|
Caribbean/Central America |
18.4 |
18.1 |
18.2 |
|
South America |
19.0 |
19.2 |
19.4 |
|
Middle East |
|||
|
Western Asia/Northern Africaa |
20.1 |
18.8 |
18.5 |
|
Income Leveld |
|||
|
Low |
18.0 |
17.4 |
17.4 |
|
Lower Middle |
19.9 |
19.3 |
19.0 |
|
Upper Middle |
19.1 |
19.0 |
19.2 |
|
TOTAL—All DHS |
18.3 |
17.8 |
17.7 |
|
aQuartiles for SC/SE Asia and Middle East are computed from countries where the DHS only interviews ever married women. b20-24-year-olds from the following countries have not reached the 75th quartile for first births: Armenia, Kazakhstan, Ghana, Nigeria, Senegal, Comoros, South Africa, Bolivia, Brazil, Colombia, Paraguay, Peru, Dominican Republic, Haiti, Nicaragua, Indonesia, Pakistan, Philippines, Vietnam, Jordan, Morocco, Turkey, and Yemen. cIn Western Asia/Northern Africa, 20-24-year-old females in Jordan and Morocco have not reached the 50th quartile for first births. |
|||
the eighth column of Table 8-2. These footnotes indicate that for no region in the world has a 75th percentile in the age distribution of first birth been reached by the age of 24 for women born in the 1970s. Of course, in both subregions of Latin America and the Caribbean this was true of women born in the 1950s and 1960s as well. This can be seen in the last (tenth) column of the table, which shows that, in South America, at least a quarter of women ages 40-44 were childless until past age 26. This later pattern of childbearing is also apparent in the Middle East for older cohorts. In Africa and Asia, however, 75 percent of the oldest and the middle cohorts were mothers by age 23. If this pattern had remained unchanged, we would have been able to include data in the fifth column of the table for the youngest
|
50th Quartile |
75th Quartile |
||||
|
20-24 |
30-34 |
40-44 |
20-24 |
30-34 |
40-44 |
|
20.0 |
19.3 |
19.0 |
22.1 |
21.8 |
|
|
20.3 |
19.5 |
19.2 |
22.8 |
22.5 |
|
|
20.8 |
19.9 |
20.0 |
23.2 |
23.1 |
|
|
21.6 |
21.9 |
21.7 |
24.2 |
24.2 |
|
|
21.0 |
20.9 |
20.3 |
24.5 |
24.1 |
|
|
22.3 |
22.1 |
22.1 |
26.9 |
26.3 |
|
|
21.7 |
21.0 |
26.0 |
24.5 |
||
|
20.5 |
19.7 |
19.7 |
22.8 |
22.7 |
|
|
22.2 |
21.7 |
26.8 |
25.9 |
||
|
22.3 |
21.7 |
21.7 |
26.0 |
25.3 |
|
|
20.2 |
20.1 |
23.6 |
23.3 |
||
|
dWorld Bank income classifications. NOTES: In order to estimate an accurate exposure time, unmarried females in the household roster were identified and censored at their age at the time of the interview plus 0.5 years. For source of regional groupings and population data for weighted averages, see Table 8-1. Further detail can be found in Appendix A. SOURCES: Demographic and Health Surveys tabulations, see Appendix Table 8-2 for data from each country. |
|||||
cohort where footnotes are indicated; recent delays in the timing of parenthood in these two regions make such an estimate for the youngest cohort impossible.
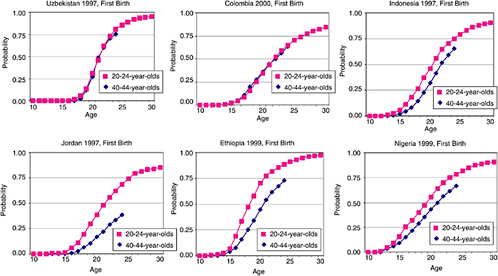
In former Soviet Asia, South America, Central America, and the Caribbean, there is very little change in the age patterns of first-time parenthood, as the table shows. For all three cohorts, a quarter of women in former Soviet Asia are mothers by age 20 and half by age 21.5; in South America, a quarter of women are mothers by age 19 and half by age 22. In the case of Central America and the Caribbean, the age pattern of first parenthood has stayed roughly the same for the past 10 years, with a quarter becoming mothers by age 18 and half by age 21; in the previous 10 years there was a one-year rise in the median age at first-time parenthood. Figure 8-1 depicts these regional trends with data from an illustrative country from each region. Uzbekistan and Colombia are the countries that best exemplify the regions in which there has been little change in the distribution of ages of first-time motherhood, particularly in recent years.
Table 8-2 shows that in South Asia and the Middle East, there has been an overall shift in the distribution of age at first birth toward an older pattern. The changes are particularly notable between the younger two cohorts in South Asia, where this increase has occurred in most countries. Exceptions are Nepal, where there has been a slight decline in the age of motherhood overall, and Vietnam, where things have been constant. In most countries in Southern Asia, the change has been moderate. In the youngest cohort, a quarter of women ages 20-24 became mothers by 18.2, up from 17.7 among women ages 40-44. Among the younger women in Southern Asia we examined, half were mothers by age 20.8, which is up from age 20 among those ages 40-44. We illustrate this modal pattern in Figure 8-1 with information on Indonesia.
In the Middle East, the increase in the age at first-time motherhood has been more substantial. In the oldest cohort, a quarter of women were mothers by age 18.5, and this milestone was reached by the youngest women at age 20.1. The most notable change in this region is that, for the youngest cohort, half of the women living in the countries of the Middle East for which there are data were childless at age 24. In Figure 8-1 we illustrate this dramatic shift with detailed data for Jordan.
In Eastern and Southern Africa, there has been an intercohort increase in the age by which a quarter of women have become mothers of about a year, from 17 to 17.9. There has also been an increase of about a year in the median age at first birth from 19 to 20. We illustrate the overall trend for this region in Figure 8-1 with data on Ethiopia. This is an accurate depiction of the experience of most of the people in this region, including those in the very populous country of Kenya (the data in Table 8-2 are weighted). Nevertheless, it is important to note that in most of the countries in this
region one observes very little intercohort change in the age at the transition to motherhood, specifically in Madagascar, Malawi, Mozambique, Namibia, Rwanda, South Africa, Uganda, and Zimbabwe.
The aggregate data from Western and Middle Africa in Table 8-2 show similar trends but mask even more diversity in the region than was observed for Eastern and Southern Africa. An increase in the age at first-time motherhood can be observed in several countries: Benin, Côte d’Ivoire, Ghana, Senegal, Togo, and Nigeria, which is depicted in Figure 8-1. We note, however that there are at least three other patterns in this region. In Burkina Faso, Cameroon, Guinea, and Niger, one observes no change in the age distribution of first-time motherhood. In the Central African Republic and Chad, there is a crossover in the age distribution across cohorts. For the youngest cohort, women exhibit a lower probability of motherhood at young ages, compared with their older counterparts. Finally, in Mali there is a decline in the average age at transition to motherhood.
We have adapted Winsborough’s (1978) definition of the duration of a transition specifically as the numbers of years separating the age at which a quarter of women become first-time mothers and the age at which three-quarters of women become first-time mothers (i.e., the age difference for the interquartile range). Using this approach, comparing women born in the 1950s with women born in the 1960s, the duration of the transition to parenthood has remained about the same for most regions but has widened slightly in Latin America and substantially in the Middle East (see Figure 8-2).1 The diversity across regions remains striking, however, with almost 8 years separating the first and the third quartiles in the Middle East and South America and only four years separating these two quartiles in the former Soviet Asia. Thus, in the Middle East and South America, there is much greater diversity among women in the timing of first motherhood than in other regions. These comparisons are not possible for the youngest cohort because, by this definition, the transition to motherhood for this cohort is still incomplete.
The duration of the earlier portion of the transition to motherhood as measured by the difference in ages between the first and second quartiles has remained remarkably stable over the past 20 years in sub-Saharan Africa, but there has been a small increase in Latin America and the Caribbean and Southern Asia (see Table 8-2). It is likely that the duration of the early part of the transition is also becoming longer in the Middle East as
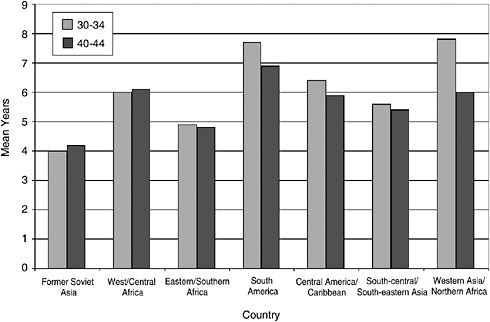
FIGURE 8-2 Changes in duration of transition to first motherhood: Difference in years between age at first quartile and third quartile of age distribution.
SOURCE: Demographic and Health Surveys.
well, but a full comparison is not possible because less than 50 percent of the youngest cohort has had their first child.
EARLY CHILDBEARING
Parenthood’s demanding and enduring obligations, its potential to limit human capital accumulation, and its far-reaching consequences have led scholars and policy makers to be concerned about “premature” transitions to parenthood (Luker, 1996; Nathanson, 1991). The term “adolescent parenthood” is often used to connote parenthood that takes place: (1) before young women are physiologically mature enough for safe motherhood; and (2) before an age when young people have typically acquired the full complement of skills, experience, and social network connections that will enable them to perform the role of parent well and to fulfill the other obligations of adulthood to the best of their ability.
Before commencing our discussion of early childbearing, we remind the reader that our conceptual framework defines adolescent parenthood in historically and geographically specific ways. The ideal approach would be to reflect in each specific context on how the distal and proximate settings
(Boxes B and C of Figure 2-1) shape the opportunities for young people to acquire the stocks of human and social capital that they need for successful adulthood (Box D of Figure 2-1). This conceptualization leads to a context-specific definition of premature parenthood as parenthood that occurs at an age prior to the age at which most young people in that setting typically complete the minimal level of human capital accumulation.
The need for comparative analyses, however, has led the panel to choose two cutoffs to define adolescent parenthood: parenthood before age 18—the age of adulthood as defined by the UN Convention on the Rights of the Child—and parenthood before age 16. The latter of these, for young women, may be a legitimate absolute indicator of premature parenthood, since it is possible that pregnancy and birth before this age are dangerous to the mother and to the child for reasons that are biological and do not vary by setting or culture.
Trends in Early Childbearing
Table 8-3 presents data by region on the percentage of young women who become mothers by age 16 and by age 18. We focus the comparison on the differences between women born in the 1950s (women ages 40-44 in the table), women born in the 1960s (women ages 30-34 in the table), and women born in the 1970s (women ages 20-24 in the table).
The first thing to observe from the table is that over 10 percent of young women still have their first child before the age of 16 in Western and Middle Africa. In other regions, levels of childbearing at this early age range from less than 1 percent in the former Soviet Asia to almost 9 percent in Eastern and Southern Africa and in South Asia. Furthermore, in Western and Middle Africa, the percentage among the youngest cohort still having their first child below age 18 is over 30 percent. Substantial percentages persist for women having a first birth before age 18 in most regions, with over 20 percent in Southern Asia, Central America and the Caribbean, and Eastern and Southern Africa and 16 percent in South America.
The next thing to notice is that the pace of decline in rates of first parenthood by age varies dramatically across regions but is more similar within regions regardless of whether age 16 or age 18 is chosen as the critical measure of early parenthood. Among regions in which the percentage having very early first births (whether by 16 or 18) was substantial among the oldest cohort—Western and Middle Africa, Eastern and Southern Africa, and Southern Asia—declines have been largest in absolute terms and among the largest in percentage terms. In the Middle East, the declines have been largest in percentage terms, having started from a much lower base. In South America, where rates of early motherhood for the older cohort were much lower in comparative terms, there has been an actual
TABLE 8-3 Percentage of Women Giving Birth by Age 16 and by Age 18—Weighted Regional and Income Averages, DHS Countries
|
Region or Income Level |
Birth by Age 16 |
Birth by Age 18 |
||||
|
20-24 |
30-34 |
40-44 |
20-24 |
30-34 |
40-44 |
|
|
Region |
||||||
|
Africa |
||||||
|
Eastern/Southern Africa |
8.5 |
13.3 |
16.0 |
26.9 |
34.3 |
38.4 |
|
Western/Middle Africa |
13.4 |
18.6 |
20.6 |
30.9 |
36.3 |
38.6 |
|
Asia |
||||||
|
South-central/South-eastern Asia |
9.3 |
12.0 |
13.8 |
24.2 |
31.1 |
32.1 |
|
Former Soviet Asia |
0.2 |
0.2 |
0.2 |
4.1 |
2.9 |
3.5 |
|
Latin America and Caribbean |
||||||
|
Caribbean/Central America |
6.8 |
8.2 |
8.7 |
21.7 |
23.2 |
24.0 |
|
South America |
4.3 |
3.7 |
3.4 |
16.3 |
14.4 |
12.3 |
|
Middle East |
||||||
|
Western Asia/Northern Africa |
3.1 |
5.5 |
6.5 |
11.2 |
18.1 |
20.8 |
|
Income Levela |
||||||
|
Low |
9.9 |
13.2 |
15.2 |
25.8 |
32.6 |
34.2 |
|
Lower Middle |
2.9 |
4.0 |
5.1 |
11.3 |
14.3 |
16.1 |
|
Upper Middle |
3.9 |
4.4 |
3.4 |
15.5 |
16.1 |
14.2 |
|
TOTAL—All DHS |
8.5 |
11.3 |
12.9 |
23.1 |
28.9 |
30.2 |
|
aWorld Bank income classifications. NOTE: For source of regional groupings and population data for weighted averages, see Table 8-1. Further detail can be found in Appendix A. SOURCE: Demographic and Health Surveys tabulations, see Appendix Table 8-6 for data from each country. |
||||||
increase in the percentage having a birth by age 18 from 12 to 16 percent. And in the former Soviet Asia, the percentage experiencing early parenthood remains extremely low (whether measured by age 16 or 18) with little further decline possible.
When the country data are aggregated by income level rather than region (bottom panel of Table 8-3), one sees that the percentage of women who became mothers by age 16 is nearly 3 times higher in low-income than in middle-income countries, but it has declined in the lower two income groups and increased in the high-middle-income group of countries (composed mostly of countries in Latin America), although remaining at a very low level. Similar patterns are apparent for the percentage of young women who become mothers by age 18. There has thus been some narrowing of the range of first parenthood experience across regions.
Table 8-4 provides information on educational and residential differentials in the percentage who become mothers by age 18 (the patterns are similar for the percentage becoming mothers by age 16 and therefore are not shown separately).2 We chose broad educational groupings so as to assure sufficient sample sizes in each category.3 Here we note that, in every region of the world, premature motherhood occurs much more often among young women who have low levels of schooling rather than higher levels of schooling and more often among rural women than urban women. For young women with less than four years of schooling, the percentage becoming a mother before age 18 currently ranges from 21 percent in the Middle East to 48 percent in Western and Central Africa.
In addition, Panel A of Table 8-4 gives some insight into how the changes we described in Table 8-3 have occurred differentially by educational background and residential status. With respect to differential trends by educational attainment, marked declines in the percentage who make the transition to motherhood by 18 are apparent in Western and Middle Africa, Eastern and Southern Africa and South Asia for all but the least educated group. In the Middle East, the overall decline occurred among the two less educated groups. In South America, the increase in the percentage who become mothers before age 18 occurred across all educational groups, while in Central America and the Caribbean the overall decline in the percentage who are mothers by age 18 masks an increase in
|
2 |
A small percentage of young women ages 20-24 are still attending school (see Table 3-1) and therefore their education is not yet complete. Because motherhood typically interrupts schooling, those having a birth prior to age 18 are able to accumulate fewer years of schooling. |
|
3 |
Nonetheless, we recognize that in some regions, certain educational groupings can become highly selective, with the degree of selectivity varying across cohorts. Thus these comparisons, while interesting, have to be interpreted with caution. |
this percentage among the lower two educational groups. The very different trends in early childbearing by school levels across regions underscores how the social context—even when measured as crudely as world region—modifies the effects of individual-level characteristics (such as schooling) on the transition to adulthood. In particular, not only is it likely that these crude schooling categories represent different things in different places but also that factors other than schooling are differentially important in different settings.
In Panel B of Table 8-4 we can see that for all regions of the developing world, whatever the direction of the overall change in the prevalence of early childbearing, the trends for women from both rural and urban areas were in a consistent direction. However, in regions experiencing declines, the absolute size of the declines were greater in urban than rural areas in sub-Saharan Africa and Southern Asia, leading to a widening gap between urban and rural areas in the prevalence of early parenthood in these regions. Early parenthood, however, remains a much more common phenomenon in rural areas. Urban-rural differentials in the percentage having a child before age 18 are particularly dramatic in Western and Middle Africa and in South-central and South-eastern Asia, where there are 14 percentage point differentials between rates of early childbearing in urban and rural areas. Unfortunately, we are not able to present differentials by household wealth, because household wealth is measured at the time of the survey and the births have occurred at various points in the past.
Consequences of Early Childbearing
Health Consequences of Early Childbearing
As previously discussed in Chapter 4, the evidence on the age pattern of maternal mortality is conflicting. While some evidence suggests that first parenthood below age 18 or 20 may carry more health risks than first parenthood at slightly older ages, other data suggest that the risks, if they exist at all, are more likely to be concentrated at younger ages (e.g., ages 15-16). Despite these uncertainties in the evidence, popular concern about childbearing below age 18 tends to focus on maternal health concerns (e.g., Save the Children, 2004; United Nations, 2004).
While more evidence is needed on whether adolescent mothers experience poorer outcomes than do older mothers, it is critical to note, particularly for health policy and programs, that maternal morbidity and mortality in the developing world for women at any age, including adolescents, are greatly influenced by poverty, poor nutrition, and limited access to medical services for problems of pregnancy and delivery. The data presented in Table 8-4 indicate that a higher percentage of rural and less well educated
TABLE 8-4 Percentage of Women Giving Birth by Age 18, by Years of Schooling, and Residence, DHS Countries
|
Panel A |
Ages 20-24 |
Ages 40-44 |
||||
|
Years of Schooling |
Years of Schooling |
|||||
|
0-3 |
4-7 |
8+ |
0-3 |
4-7 |
8+ |
|
|
Region |
||||||
|
Africa |
||||||
|
Eastern/Southern Africa |
39.5 |
32.0 |
11.3 |
42.5 |
37.8 |
17.3 |
|
Western/Middle Africa |
47.6 |
28.4 |
10.0 |
42.1 |
37.1 |
17.6 |
|
Asiaa |
||||||
|
South-central/South-eastern Asia |
34.2 |
24.4 |
7.1 |
34.3 |
31.0 |
13.8 |
|
Latin America and Caribbean |
||||||
|
Caribbean/Central America |
38.4 |
27.7 |
7.5 |
31.5 |
19.4 |
7.7 |
|
South America |
34.6 |
21.3 |
6.6 |
19.4 |
13.5 |
3.5 |
|
Middle Eastb |
||||||
|
Western Asia/Northern Africa |
20.9 |
11.3 |
2.1 |
28.9 |
19.6 |
2.6 |
|
Income Levelc |
||||||
|
Low |
39.9 |
27.7 |
8.9 |
40.2 |
36.0 |
16.5 |
|
Lower Middle |
26.6 |
17.5 |
3.8 |
24.9 |
18.7 |
4.7 |
|
Upper Middle |
32.9 |
21.4 |
7.8 |
22.3 |
14.7 |
4.1 |
|
Panel B |
Ages 20-24 |
Ages 40-44 |
||
|
Rural |
Urban |
Rural |
Urban |
|
|
Region |
||||
|
Africa |
||||
|
Eastern/Southern Africa |
29.7 |
20.9 |
39.0 |
33.7 |
|
Western/Middle Africa |
35.8 |
21.4 |
40.5 |
34.2 |
|
Asia |
||||
|
South-central/South-eastern Asia |
28.6 |
13.2 |
34.9 |
25.5 |
|
Former Soviet Asia |
4.7 |
3.6 |
4.1 |
2.6 |
|
Latin America and Caribbean |
||||
|
Caribbean/Central America |
28.7 |
16.4 |
29.2 |
19.5 |
|
South America |
23.8 |
14.2 |
15.8 |
11.2 |
|
Middle East |
||||
|
Western Asia/Northern Africa |
14.5 |
8.1 |
25.3 |
17.8 |
|
Income Levelc |
||||
|
Low |
30.1 |
15.3 |
36.5 |
27.6 |
|
Lower Middle |
16.5 |
8.4 |
20.5 |
13.0 |
|
Upper Middle |
20.7 |
13.7 |
16.5 |
13.4 |
|
aCountries from former Soviet Asia are excluded from this table because the majority of respondents have completed eight or more years of education. Also excluded are India and Pakistan because they lack the all women weight. bYemen excluded; it lacks the all women weight. cWorld Bank income classifications. NOTES: For source of regional groupings and population data for weighted averages, see Table 8-1. Further detail can be found in Appendix A. SOURCE: Demographic and Health Surveys tabulations, see Appendix Tables 8-4a and 8-4b for data from each country. |
||||
women give birth as children, and these are the women who are most likely to be poor. Young women in impoverished settings are likely to be less well nourished and to be still completing physical growth in the late teens; for adolescent mothers in these settings, these factors are linked to increased risk of obstructed labor and of such complications as obstetric fistula during delivery (Senderowitz, 1995).4
The research on adverse reproductive outcomes affecting the infant is more definitive. For example, analyses of longitudinal data for more than 20,000 live births in the early 1980s in urban areas of Mali and Burkina Faso reveal that pregnancies to women under age 18 were associated with lower birthweight and greater mortality, particularly during the second year of life (LeGrand and Mbacké, 1993). Retrospective analysis of clinical records from 15,207 women who gave birth in 1989 in an urban hospital in Mozambique also found significant differences in the birthweights of infants born to teenage mothers compared with older mothers and greater likelihood of obstetric complications (Bacci, et al., 1993). Analysis of over 8,000 life births between 1990 and 1992 in Matlab, Bangladesh, found a significantly higher rate of neonatal mortality among teenage mothers (Alam, 2000). The average infant mortality rate for infants born to mothers under 20 was 100 (per 1,000 live births) compared with rates of 72 and 74 among mothers ages 20-29 and 30-39, and 94 among mothers ages 40-49, based on 49 countries with DHS surveys (Alan Guttmacher Institute, 2002).
Yet even in the presence of such findings, some social scientists remain skeptical. Geronimus (1987) argues that the background factors controlled for in most analyses fail to account for unobserved heterogeneity. In particular, she argues that women who give birth at a young age are selected for certain social characteristics that predispose them to having poorer outcomes. While there may indeed be some intrinsic risk associated with young maternal age, the consensus seems to be that, holding other factors (such as poverty and nutritional status) constant, except for teens younger than age 15 or 16, “if young pregnant women have access to … programs and use them, their health and their chances of delivering a healthy baby improve to levels almost on a par with those of older women” (Senderowitz, 1995:19). A study of over 5,000 teenage mothers who delivered in 1994 in a Hong Kong hospital found that, even in the presence of preterm labor, which is more common among teenagers, neonatal outcomes are favorable if adequate antenatal care is available (Lao and Ho, 1997).
Social and Economic Consequences of Early Childbearing
McCauley and Salter (1995:16), in a population report entitled “Meeting the Needs of Young Adults” that focuses primarily on developing country adolescents, state: “For young women just beginning their adult lives, the risks of childbearing do not end with delivery. Compared with a woman who delays childbearing until her 20s, the woman who has her first child before age 20 is more likely to: obtain less education, have fewer job possibilities and lower income, be divorced or separated from her partner, and live in poverty.”
Implicit here is the suggestion that early childbearing causes negative outcomes. While this is certainly a plausible hypothesis, there is insufficient evidence to make this assertion. Not only is the research from the developing world on the social and economic impact of adolescent childbearing extremely thin, but, more importantly, the few studies that exist lack statistical rigor. In order to adequately assess the consequences of adolescent fertility, it is critical to address selection bias, namely that those who give birth as teens differ fundamentally from those who delay. Yet, to the best of our knowledge, no developing country study has effectively done this.
Mayra Buvinic, one of the few researchers to investigate the consequences of adolescent childbearing in the developing world, acknowledges that her studies in Barbados, Chile, Guatemala, and Mexico “were not able to separate clearly the differences due to individual factors and the event of childbearing itself” (Buvinic, 1998:202). For the most part, Buvinic and others (Alatorre and Atkin, 1998; Engle and Smidt, 1996; Russell-Brown, Engle, and Townsend, 1992) used retrospective data to compare adolescent mothers regardless of marital status to women who had their first birth at age 20 or older. While they did not investigate the effects of early childbearing on educational attainment, they did investigate economic consequences and consequences for marriage.
These researchers found that, on a variety of measures, those who gave birth during adolescence were in worse shape economically than those who delayed childbearing. In Mexico, where a sample of women who initiated childbearing between 1987 and 1989 in a major hospital in Mexico City were followed up four years after their first birth, mothers who gave birth before age 18 were six times more likely to live in poverty compared with women who gave birth for the first time at age 21 or later.
In Chile, using retrospective data from Santiago, a sample of women first interviewed in 1990 who had a child ages 5 to 9, were reinterviewed in 1991. For analysis purposes the sample was divided into poor and nonpoor women. Among the poor women, controlling for schooling but not for years in the labor force, those who gave birth at 19 or younger had signifi-
cantly lower wages than those who gave birth after age 20. The issue of the potential endogeneity of adolescent childbearing and wages was not addressed, however; in addition, the analysis failed to control for the fact that women who work in this setting are a selective group. Buvinic also noted that adolescent childbearing in Mexico and Guatemala (for which she analyzed retrospective data on 850 women collected in 1967, 1974, and 1988) was significantly associated with poverty status measured by an index of housing quality in the two countries and socioeconomic status in Mexico. Although economic status as a child was controlled, it is not clear whether economic status immediately prior to childbirth was accounted for.
It is interesting that in none of the four countries Buvinic studied did adolescent childbearing affect marital status. Those who gave birth early were as likely to marry in subsequent years, although in Chile (where this issue was explored) those who gave birth in their 20s were significantly more likely to be living with the father of the child five years after the birth.
Another study in Nigeria compares the life course of adult Yoruba women who had a birth in adolescence regardless of marital status with those who delayed childbearing into their 20s (Omololu, 1994). Compared with women who had their first child in their 20s, women who had their first birth during their adolescent years were more likely to have more children by the time of the survey, more likely to be second wives, and more likely to receive assistance from parents. The author argues that in many cases, partners and families of orientation were unsupportive, contributing to the higher levels of poverty among adolescent mothers compared with others. Social adjustment during pregnancy and in the first year of birth in southwest Nigeria was characterized by an end to schooling, difficult parental relations, and peer difficulties for the adolescent mother.
A prospective study in Forteleza, Brazil of young women experiencing early pregnancy compares those who sought prenatal care from a clinic with those who sought postabortion care. Preliminary findings suggest that while sociodemographic characteristics of the two groups were relatively similar, adolescents who continued the pregnancy were more likely than those who opted for abortion to have dropped out of school as a result of the pregnancy. Yet those who underwent induced abortion reported significantly lower levels of self-esteem, a difference attributed in part to the circumstances surrounding the unwanted pregnancy and abortion seeking in this setting, in which abortion is legally restricted. While these differences continued to be manifested at one and five years following the pregnancy, they had narrowed considerably by year five; about three-fifths of young women in both groups reported high self-esteem, and about one-third were still students (Bailey and Bruno, 2001).
While the findings from these studies are suggestive, they are, as noted above, far from definitive. In the absence of study designs that control for
confounding factors that are both a cause and consequence of early childbearing, it is not possible to assess the short-term and long-term effects of adolescent childbearing.
THE SEQUENCING OF PARENTHOOD WITH MARRIAGE
Although parenthood continues to occur largely within a socially recognized union (typically marriage) regardless of age, most literature about first parenthood focuses on premarital childbearing, with a particular focus on adolescents (a topic we will return to). However, given that marital childbearing remains the most typical pattern (Mensch, Bruce, and Greene, 1998), we start this discussion of sequencing of parenthood within marriage by considering the timing of first birth within marriage.
First to set the context, however, we explore trends in the proportion of births that occur after union formation or marriage (Table 8-5).5 For this analysis, we do not distinguish between premarital and postmarital conceptions, because we are interested in the social context in which the birth occurs, not the social context in which the conception occurs. Overall, among 20-24-year-olds, 91 percent of young women have their first birth after marriage. The decline has been very slight in the last 20 years. Patterns vary substantially by region, however, as do trends. For those countries in the Middle East and Asia, where data were collected only on married women, we have to assume that unmarried women have not given birth; thus any premarital births that are captured in the data are those reported by women who are currently married. The proportion of births that occur within marriage varies from a low of 70 percent in Eastern and Southern Africa and 74 percent in South America to highs of 97 percent in Southern Asia and close to 100 percent in the Middle East. There is also an inverse correlation between a country’s level of income and the proportion of births that occur within marriage.
Premarital births represent a rising proportion of births in Eastern and Southern Africa, South America, and in upper middle-income countries (Table 8-5). There was much greater homogeneity across regions 20 years ago than there is today in the proportion of births that occur within marriage. A discussion of trends in the percentage of young women having a birth premartially and the implications of out-of-wedlock motherhood fol-
|
5 |
As previously explained in Chapter 7, in data from the DHS, marriage is a self-defined state. Respondents are coded as married if they say so in response to questions on whether they are currently or ever married or are living with a man. Thus age at first marriage is typically age at first cohabitation with a partner or husband (Kishor, 2003). |
TABLE 8-5 Percentage of Births That Occur Within Marriage, of All Births, DHS Countries
|
Region or Income Level |
After Marriage |
Marital Births That Occur Within First 7 Months of Marriage |
||||
|
20-24 |
30-34 |
40-44 |
20-24 |
30-34 |
40-44 |
|
|
Region |
||||||
|
Africa |
||||||
|
Eastern/Southern Africa |
69.9 |
73.9 |
79.2 |
14.9 |
15.3 |
15.5 |
|
Western/Middle Africa |
81.9 |
83.9 |
84.0 |
15.8 |
15.3 |
16.9 |
|
Asia |
||||||
|
South-central/South-eastern Asia |
97.1 |
96.8 |
97.1 |
14.9 |
13.2 |
11.5 |
|
Former Soviet Asia |
97.1 |
96.4 |
96.6 |
5.0 |
5.8 |
5.6 |
|
Latin America and Caribbean |
||||||
|
Caribbean/Central America |
88.6 |
90.8 |
89.8 |
11.1 |
13.0 |
12.2 |
|
South America |
74.4 |
84.1 |
86.0 |
23.7 |
17.6 |
13.4 |
|
Middle East |
||||||
|
Western Asia/Northern Africa |
99.5 |
98.5 |
97.9 |
3.4 |
6.3 |
6.9 |
|
Income Levela |
||||||
|
Low |
93.3 |
93.5 |
94.2 |
14.5 |
13.4 |
12.5 |
|
Lower Middle |
88.8 |
90.9 |
91.8 |
12.1 |
12.3 |
10.5 |
|
Upper Middle |
72.4 |
81.3 |
83.7 |
19.8 |
15.1 |
11.6 |
|
TOTAL—All DHS |
90.7 |
92.0 |
92.9 |
14.8 |
13.4 |
12.2 |
|
aWorld Bank income classifications. NOTES: For source of regional groupings and population data for weighted averages, see Table 8-1. Further detail can be found in Appendix A. SOURCES: Demographic and Health Surveys tabulations, see Appendix Table 8-5 for data from each country. |
||||||
lows our discussion of trends in the first birth interval and the significance of the first marital birth.
Trends in the First Birth Interval
The first birth interval is demographic jargon for the duration of the period between union formation and the first birth. Among women who give birth after marriage, the shorter the first birth interval, the tighter the association between marriage and first birth. Among women for whom the timing of marriage coincides with the timing of sexual debut, the first birth interval cannot be shorter than the normal gestational period of a pregnancy—typically nine months. Among women who are sexually experienced at the time of marriage, the act of getting married may be associated with readiness for childbirth or may even be triggered by pregnancy. Either way, short first birth intervals also connote a strong association between marriage and parenthood.
Table 8-6 presents data on the median number of months from marriage to first birth for those who married before their first birth by cohort, by region, and by country income level. The table reveals that the length of time between marriage and motherhood is declining all over the world. This is true in every region except former Soviet Asia and it is true for countries of all income levels. As a result of these changes, the variation across regions in the median length of the first birth interval is narrowing. Among women ages 40-44, the median length of the first birth interval ranged across regions from 13 to 26 months. Among the youngest cohort, the range had narrowed from a low of 14 months in former Soviet Asia to a high of 21 months in Western and Middle Africa. It is notable that first birth intervals as short as 14 to 16 months are now apparent in Latin America and the Caribbean, the Middle East, and former Soviet Asia. Twenty years ago, such short intervals were prevalent only in the countries of former Soviet Asia. While DHS data are not available on China, a steady and even more rapid decline in the length of the first birth interval had been documented by Feng and Quanhe (1996) using China’s two per thousand Fertility and Birth Control Survey of 1988. They estimate that the first birth interval fell from an average of 22 months for the cohort marrying in 1970 to 16 months on average for the cohort marrying in 1986.
Young married women, then, are becoming mothers for the first time sooner after marriage or union formation than did women who are 20 years their senior. This shortening of the time between marriage and first birth is likely to be due to a combination of factors. First, the preference to begin family building soon after marriage clearly continues to be very strong, and this preference may have increased in strength in places in which women have begun to marry later. Indeed, marriages may be more likely now than
TABLE 8-6 Trends in Median Length of First Birth Interval Among Women Having Their First Birth After Marriage,a DHS Countries
|
Region or Income Level |
Median Birth Interval |
||
|
20-24 |
30-34 |
40-44 |
|
|
Region |
|||
|
Africa |
|||
|
Eastern/Southern Africa |
18.2 |
24.1 |
25.6 |
|
Western/Middle Africa |
21.2 |
22.4 |
24.6 |
|
Asia |
|||
|
South-central/South-eastern Asia |
19.3 |
20.2 |
22.9 |
|
Former Soviet Asia |
13.9 |
12.8 |
12.8 |
|
Latin America and Caribbean |
|||
|
Caribbean/Central America |
15.3 |
16.3 |
16.7 |
|
South America |
15.4 |
18.2 |
17.0 |
|
Middle East |
|||
|
Western Asia/Northern Africa |
15.8 |
17.5 |
21.8 |
|
Income Levelb |
|||
|
Low |
19.6 |
20.7 |
23.2 |
|
Lower Middle |
13.6 |
15.3 |
16.2 |
|
Upper Middle |
16.7 |
22.7 |
23.8 |
|
TOTAL—All DHS |
18.6 |
20.3 |
22.5 |
|
aThe birth interval is constructed from a life table and is restricted to all first births that occurred after marriage. Women who are married but have not yet given birth are censored at the date of their interview. bBased on World Bank income classifications. NOTES: For source of regional groupings and population data for weighted averages, see Table 8-1. Further detail can be found in Appendix A. SOURCES: Demographic and Health Surveys tabulations, see Appendix Table 8-6 for data from each country. |
|||
in the past to be timed to coincide with readiness for parenthood and to be with partners who have established a romantic relationship.6 Second, improvements in general health may have resulted in improved fecundity, especially in regions in which substantial proportions of women marry before age 16. Third, the proportion of women who are pregnant at the time of marriage may be on the rise in some settings. Finally, it is possible that, among women who were pregnant before they married, there is a
greater reluctance on the part of older women relative to younger women to report their marriage age accurately, thus differentially biasing estimates of the length of the first birth interval.
The extent to which first births that occur within marriage are the result of premarital conceptions can be approximated by looking at the proportion of first birth intervals that are less than 8 months in duration. The second panel of Table 8-5 shows an enormous range across regions in the prevalence of short birth intervals among the youngest women, from 24 percent in South America to 3 percent in the Middle East. The data also indicate a slight rise overall in the percentage of all first marital birth intervals that are shorter than 8 months, from 12 to 15 percent over the last 20 years. This rise is explained by the increase in the prevalence of short birth intervals in South America, from 13 to 24 percent over 20 years as well as the more modest but demographically significant rise in Southern Asia from 12 to 15 percent. The rise in Southern Asia is largely driven by the rise in India—which represents 59 percent of the population surveyed by the DHS in this region—from 16 to 20 percent. Data from China show an increase in the percent of marital births conceived premaritally from 1 to 5 percent from 1970 to 1988 (Feng and Quanhe, 1996).
An important implication of these findings is that many of the global changes that are affecting the timing of first marriage are also affecting the timing of first parenthood because of the very tight link between these two transitions. Despite evidence of premarital sexual activity and pregnancy, it is marriage or union formation that continues to define, for the most part, the timing of parenthood in the developing world. National survey data underscore a strong direct relationship between marriage and childbearing: as age of marriage rises, age at first parenthood also rises. Thus, much of the discussion in Chapter 7 of factors affecting the timing of first marriage become equally salient to a discussion of trends in the age at first birth. In particular, it was shown that there is not as tight an association between trends in age of marriage and trends in education as one might expect, given the extensive literature documenting the strong cross-sectional association between years of schooling and marriage age. For example, while enrollment rates and labor force participation rates have risen substantially in Latin America for young people in their late teens and early 20s, there has been little change in the age of marriage or first parenthood. Similar trends in other regions have been associated with delayed marriage and childbearing.
Significance of the First Marital Birth
In many settings, particularly in Asia and sub-Saharan Africa, women are expected to bear a child as soon as possible after marriage in order to
secure themselves in the marital home; infertility is deeply feared and results, for many women, in abandonment and mistreatment (Adepoju and Mbugua, 1997; Jejeebhoy, 2000). A study in rural Maharashtra, India, highlights the extent to which newly married young women face pressure to begin childbearing as soon as possible after marriage (Barua and Kurz, 2001). In this study, fertility within a year of marriage was a prime concern to young women and their husbands and mothers-in-law; any gynecological condition perceived to limit fertility prospects tended to receive prompt treatment. Mothers-in-law strongly objected to any delay, and young women themselves were motivated to have a child in the first year of marriage to satisfy social obligations and strengthen their own position in the marital family. This study was limited to brides between ages 15 and 19; we do not know whether older brides would face similar pressures.
In some contexts, a marriage does not receive full social recognition until the arrival of the first birth or until the first pregnancy is celebrated. Van Hollen (2003) describes the Seemantham ritual in Tamil Nadu, which is performed in preparation for a woman’s first delivery. This ceremony, which was traditionally a way to celebrate and legitimize the marital union, has been reinvented in a more modern guise, with the elaborate exchange of gifts and display of conspicuous consumption, representing a final phase of the economic exchanges associated with the marriage itself (Box 8-1).
Trends in Premarital Childbearing
Chapter 4 documents the worldwide decline in age at menarche and Chapter 7 describes the increase in the age at marriage or union formation. These two facts together mean that, on average, there has been a worldwide increase in the length of the period during which young people are exposed to the risk of having premarital sex. And Chapter 4 provides evidence that premarital sex prior to age 18 is increasing. But it is by no means a given that increasing levels of sex before marriage are leading to increases in premarital childbearing of the same magnitude. There are examples of populations in which a strong taboo against becoming a parent outside marriage persists even after norms forbidding sex outside marriage have weakened; the most notable examples are Japan (Retherford, Ogawa, and Matsukura, 2001) and several Central and Southern European countries (Kiernan, 1999).
Table 8-7 shows trends in the percentage of young women having their first birth before marriage across three cohorts for three ages marking phases of the transition to adulthood: age 18, age 20, and age 25. The overall level of premarital childbearing across all developing countries remains very low, with no more than 5 percent of women having a pre-
|
BOX 8-1 In Tamil Nadu, the Seemantham ceremony marks a woman’s passage into motherhood and celebrates her fertility. Seemantham is a ritual performed widely throughout Tamil Nadu by Hindus, Muslims, and Christians in preparation for a woman’s first delivery, and its primary functions are to satisfy the pregnant woman’s ācai (“desire, craving, passion”), bless her, and ensure a safe delivery and a healthy baby. In her ethnography of childbearing in Tamil Nadu, Cecilia Van Hollen (2003) examines how processes of modernization have impacted the use of different birthing technologies and transformed reproductive rituals. Contrary to assumptions that as childbirth becomes increasingly modernized women will rely less on traditional birth practices and rituals, Van Hollen found that in Tamil Nadu, the modernization of childbirth and the intensification of birth-related rituals like Seemantham are occurring simultaneously. The nature and form of this ritual are being transformed, however, as market-led growth, rising consumerism, and other appendages of globalization take hold. Seemantham has become much more elaborate and expensive, according to the women, scholars, and religious figures interviewed by Van Hollen. Food has always been a central feature of the ceremony, but the amount of food has multiplied and sweets have taken on a more important role. Expectant first-time mothers are now more likely to receive cash, gold, and consumer items, like household appliances, and in greater amounts. The husbands’ families often request certain gifts, unlike in the past when guests brought gifts they had chosen. There is an increasing emphasis on displaying food and gifts at the Seemantham, which was not true in the past. The reinvention of the Seemantham tradition is associated with the rising trend of conspicuous consumption that has occurred along with growing privatization and economic liberalization in Tamil Nadu and throughout Southern Asia. According to Van Hollen (2003:78), Seemantham has come to represent a “convergence of the desires for new consumer technologies and for the display of wealth through ritual,” a trend that parallels the intensification of dowry practices throughout India. She discusses how these changes create a double burden for the families of first-time mothers: “The growing economic burden of Seemantham (and other ritual gifts associated with the reproductive continuum) was compounded by the fact that the pregnant woman’s family in Tamil Nadu was also largely responsible for the medical expenses associated with childbirth. This was particularly true of the first delivery, since the pregnant woman almost always returned home for that delivery but not necessarily for consecutive deliveries” (p. 111). In spite of the increasing financial burden of Seemantham, young women and their families continue to perform the Seemantham because it is tradition, and not doing so could hurt a family’s prestige. Seemantham is also seen as a symbol of legitimacy of the marital union, a means to legitimize love marriages and resolve any familial conflict they incite. Van Hollen contends that as Seemantham is reinvented, it simultaneously increases social and economic burdens on families and reinforces the reverence for first-time mothers and their auspicious fertility. |
TABLE 8-7 Trends in Percentage of Women Having First Birth Before Marriage (by Ages 18, 20, 25)—Weighted Regional and Income Averages, DHS Countries
|
Region or Income level |
Premarital Birth by Age 18 |
Premarital Birth by Age 20 |
Premarital Birth by Age 25 |
|||||
|
20-24 |
30-34 |
40-44 |
20-24 |
30-34 |
40-44 |
30-34 |
40-44 |
|
|
Region |
||||||||
|
Africa |
||||||||
|
Eastern/Southern Africa |
8.0 |
8.9 |
7.3 |
14.5 |
14.8 |
11.5 |
21.0 |
16.4 |
|
Western/Middle Africa |
5.7 |
7.0 |
8.1 |
8.0 |
9.1 |
10.6 |
11.6 |
12.5 |
|
Asia |
||||||||
|
South-central/South-eastern Asia |
0.4 |
0.8 |
0.8 |
0.5 |
1.0 |
1.1 |
1.3 |
1.3 |
|
Former Soviet Asia |
0.3 |
0.3 |
0.1 |
0.8 |
0.9 |
0.9 |
2.5 |
2.8 |
|
Latin America and Caribbean |
||||||||
|
Caribbean/Central America |
2.8 |
2.3 |
4.0 |
4.2 |
4.2 |
5.7 |
6.8 |
8.3 |
|
South America |
4.1 |
3.3 |
3.0 |
8.1 |
6.3 |
5.8 |
11.1 |
9.9 |
|
Middle East |
||||||||
|
Western Asia/Northern Africa |
0.0 |
0.4 |
0.7 |
0.1 |
0.6 |
0.9 |
0.8 |
1.2 |
|
Income Levela |
||||||||
|
Low |
1.7 |
2.3 |
2.3 |
2.6 |
3.2 |
3.1 |
4.1 |
3.8 |
|
Lower Middle |
1.9 |
1.4 |
1.6 |
3.5 |
3.1 |
3.3 |
5.7 |
5.6 |
|
Upper Middle |
5.0 |
5.1 |
4.1 |
9.7 |
9.2 |
7.4 |
14.7 |
12.5 |
|
TOTAL—All DHS |
2.0 |
2.5 |
2.4 |
3.4 |
3.8 |
3.6 |
5.4 |
44.9 |
|
aWorld Bank income classifications. NOTES: For source of regional groupings and population data for weighted averages, see Table 8-1. Further detail can be found in Appendix A. SOURCES: Demographic and Health Surveys tabulations, see Appendix Table 8-7 for data from each country. |
||||||||
marital birth by the age of 25. However, these rates vary substantially across regions.
The proportion of all women ages 20-24 who had their first birth before marriage and before age 20 (including those who did so and who are still never-married) is a useful summary indicator of the prevalence of premarital childbearing. Comparison of younger and older women (women ages 20-24, 30-34, and 40-44) provides a measure of change in childbearing among unmarried adolescent women over the period of 20 years before the survey. Indeed, change in this indicator may have a great influence on perceptions of whether unmarried adolescent childbearing is prevalent or not.
Among all young women ages 20-24, a significant minority in most countries of sub-Saharan Africa and Latin America and the Caribbean become parents during their adolescent years, before entry into a union or marriage. This proportion is about 8-14 percent in sub-Saharan Africa and South America but lower in Central America and the Caribbean. The percentage giving birth prior to marriage has increased slightly in South America (from 6 percent among women ages 40-44 to 8 percent among women ages 20-24). The percentage giving birth prior to marriage and before age 20 has also increased in Eastern and Southern Africa (from 12 to 15 percent). At the same time, slight declines have occurred in the Caribbean (from 6 to 4 percent) and Western and Middle Africa (from 11 to 8 percent). However, none of these changes is large in absolute size.
Compared with low-income and lower middle-income countries, premarital childbearing in the upper middle-income group of countries is somewhat higher, and the level has increased slightly over the past two decades. In the late 1990s, about 10 percent of women had a child before marriage and before age 20 in the upper middle-income group of countries, compared with 3-4 percent in the other two income categories.
Figure 8-3 shows the range of prevalence of premarital childbearing among women born in the 1960s and 1970s and the extent to which there has been an increase among the young women in the sample. Most rates cluster well below 10 percent. Another group of countries, mainly countries in Eastern and Southern Africa, have rates in the 10 to 20 percent range. A few from the same region have rates of 30 percent or above. In most but not all countries, there have been increases in the last 10 years, but these increases have been very small.
Implications of Premarital Childbearing
Concerns about the consequences of premarital childbearing arise because the birth occurs outside the social support structure provided by marriage and therefore often without the support of the baby’s father and
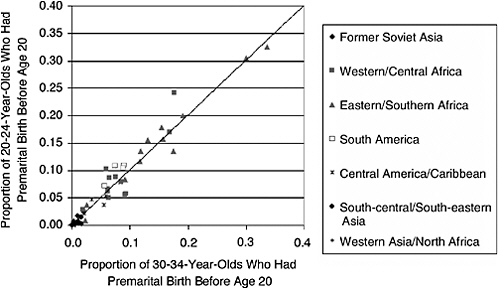
FIGURE 8-3 Change in percentage of young women having premarital birth by age 20.
SOURCE: Demographic and Health Surveys.
his family and sometimes without the support of the girl’s family as well. Never-married adolescent mothers are much more likely than married adolescent mothers to report that their recent birth was unplanned (i.e., unwanted or mistimed). In most countries, this difference is very large—often the proportion is twice as high among unmarried mothers, half or more of whom report that the birth was unplanned in 22 of the 27 countries in Singh’s (1998) review. Many are concerned about the situation of women who make the transition to motherhood both at a young age and before marriage. If being young and unmarried places mothers at risk, the reasoning goes, then young women with both characteristics are particularly likely to have an unsuccessful transition to adulthood. For developing countries, in societies in which the levels of premarital sexual activity are moderate and on the increase, but where taboos against nonmarital motherhood remain strong, becoming a mother as an unmarried woman constitutes a barrier to successful adulthood. Whether or not becoming a mother outside marriage is a barrier to adult success in these populations is therefore a question that merits investigation by researchers and, if it is found to be so, the attention of policy makers.
In some settings, however, particularly in sub-Saharan Africa, childbirth confers on teenagers the valued status of motherhood. Indeed, parenthood can be seen as an acceptable pathway to adult status in cases in which
marriage is either unlikely or delayed by lack of money or other resources (Nsamenang, 2002). Among the Turkana, a group that remains traditional and relatively untouched by the forces of modernization in Kenya, premarital childbearing is socially acceptable (Shell-Duncan and Wimmer, 1999). When a premarital birth occurs, the father typically pays a set fee to the mother’s family and custody of the child remains permanently with the mother’s family. If the young parents later decide to wed, the father must purchase custody of the child for an additional fee.
Van Driel (1996) notes with reference to Botswana that the stigma of premarital childbearing appears to be disappearing with the rise in its prevalence, compared with the old days, when “the child of an unmarried girl who was not betrothed would often be killed at birth or live a life full of humiliation and insults” (p. 58).
In other contexts, unmarried adolescent motherhood is viewed as very undesirable by parents and the community. In a study in Nigeria (Aina and Odebiyi, 2000) focus group discussions with community members revealed a lack of empathy with unmarried young mothers and a tendency to associate their status as unmarried mothers with such factors as unstable or broken homes, family poverty, uneducated parents, and rape or harassment. In Cameroon, while having a premarital birth may make marriages more likely in the short run, it significantly jeopardizes a single woman’s marriage chances in the long run (Calvès, 1999). In some communities, such as the Gusii of Kenya, single mothers continue to be socially and economically marginalized with respect to their kin groups. Despite the increasing prevalence of consensual unions and out-of-wedlock births among the Gusii, unwed mothers are still considered an embarrassment to the clan (Hakansson, 1994).
Stern (1995) shows that, in Mexico, early, unmarried parenthood takes on different meanings for young people from different sociocultural backgrounds. Among traditional rural settings, adolescents tend to have few life choices, and existing norms support adolescent motherhood as an accepted starting point for the formation of a family. The marginal urban sector is also characterized by relatively high levels of early, unmarried childbearing, but in this group, family support for adolescent motherhood is much more variable, and young women perceive pregnancy and motherhood as one means of escaping parental controls or family instability. Among lower class and lower middle-class urban families, in contrast, most parents and their adolescent children have high aspirations for increased education and livelihood options, and these are perceived as incompatible with early, unmarried parenthood; as a result, when they do occur, pregnancy and parenthood among adolescents are seen as an unexpected event limiting aspirations of upward social mobility, and efforts are made to postpone these transitions. Finally, young people from middle- and upper middle-
class families who have high educational aspirations and remain economically and socially dependent on their parents into their 20s tend to have greater skills in negotiation, are better able to exercise contraceptive and reproductive choices, and if pregnancy occurs, are more likely than other groups to have planned it.
A creative way to avoid the social consequences of early childbearing among young women who are motivated to continue their education is described by Johnson-Hanks (2002) in her ethnography of motherhood among young educated Beti women in Cameroon (see Box 8-2). By delaying the assumption of the socially recognized role of mother, transferring major child care responsibilities to grandparents and other kin and remaining in school, young women are able to continue their preparation for adulthood before taking on the social status of mother. Kaufman, de Wet, and Stadler (2000) report that in South Africa, where premarital childbearing is also common, parents are willing to support their daughter’s schooling even after childbirth, because young women who are educated tend to bring more bridewealth. As a result the second birth, and official parenthood, tends to be delayed until after marriage which does not take place until schooling is completed.
The establishment and social recognition of paternity are often problematic when birth occurs outside marriage. One reason is that paternal recognition can jeopardize further education and training for young men because it requires the payment of damages and the provision of financial support (Kaufman, de Wet and Stadler, 2000). In Osun state, Nigeria, the phenomenon of a supportive partner was found to be so rare in the case of a premarital birth that the original study design, to compare adolescent mothers with unsupportive partners with those having supportive ones, had to be abandoned, since only two such adolescents could be found (Aina and Odebiyi, 2000). In Cameroon, about a third of children born out of wedlock in the study area were not recognized by the biological father, with the consequence that financial support was not provided (Calvès, 2000).
FACTORS AFFECTING THE CHANGING CONTEXT OF FIRST PARENTHOOD
Many of the changes noted in earlier chapters are changing the context in which decisions about first-time parenthood are being made as well as the experience of it. In this section, we discuss the implications of some of these changes for transitions to parenthood. In particular, we focus on some of the possible implications for first parenthood of a rise in school enrollment rates during the teens and early 20s, a rise in young women’s participation in the labor force, changes in health and health behaviors, and changes in access to and use of prenatal and delivery services.
|
BOX 8-2 Jennifer Johnson-Hanks’ (2002) ethnography of motherhood among young, educated Beti women in Southern Cameroon explores the complex relationship between student and motherhood roles. Beti schoolgirls who become pregnant often face disrespect by others and feelings of shame. The stigma of schoolgirl pregnancy is not tied to negative perceptions of premarital sex, but to the characterization of pregnant schoolgirls as unprepared for motherhood, uneducated, and undisciplined. Many Beti women believe that a first birth should take place in the context of marriage, and marriage and first birth should follow getting an education and establishing one’s career. The shame associated with schoolgirl pregnancy comes in part from the expectation that these girls will drop out of school once their baby is born, cutting short their trajectory toward a successful life that includes a stable livelihood and household. However, Johnson-Hanks found that the majority of girls in secondary school who became pregnant stayed in school for at least a year after giving birth. In fact, she found no discernible correlation among the 184 Beti women she interviewed between early childbearing and age at marriage, first employment, or school leaving. Using the example of a young Beti woman named Marie, Johnson-Hanks illustrates the point that Beti women can effectively postpone socially recognized motherhood and continue their schooling after the first birth. Marie left school to give birth to her first child. At her father’s insistence and in order to avoid a “shameful entry into motherhood,” Marie went to live with the family of her child’s father and deliver her baby. After some time, Marie found living in her in-laws’ home intolerable and longed to go back to her own family and continue her studies. She returned to her father’s home, leaving her son with his father’s family, and subsequently relinquished her rights to claim him as her child. Marie returned to school and rarely saw or spoke of her child. Johnson-Hanks (2002:876) observes, “Her childbearing career will begin when she bears another child, with a man she intends to marry, at some later point in her educational and professional trajectory. She has been effectively relieved of any stigma from, or even connection to, her premarital birth, regularly referring to herself as an adolescent girl (ngon).” Since it is the status of being a mother that potentially disrupts a woman’s schooling among the Beti, a woman’s first birth doesn’t necessarily end her schooling career. “The locally perceived conflict between schooling and childbearing applies not to all births but only in situations in which the biological mother is socially recognized as a mother…. Schooling and childbearing are neither mutually exclusive nor strictly ordered; the one-time mother again becomes a girl when she dons the school uniform” (p. 874). First births are often distinct from subsequent births for Beti women. As Johnson-Hanks observed, “Beti women who have borne children are not necessarily mothers” in their eyes or the eyes of local society, nor have they made the transition to adulthood by giving birth—they can still be considered girls. |
Rise in School Enrollment Among Adolescents
Many empirical studies show a negative relationship between education and fertility and in particular between educational attainment and the timing of the first birth in developing countries (e.g., Choe, Thapa, and Achmad, 2001; Gupta and da Costa Leite, 1999; Gupta and Khan, 1995; Welti, 2002). Both outcomes stem from a common set of causes: declines in family size, a rise in parental schooling, and rising rates of return to higher levels of schooling and rapid urbanization. While some young mothers find ways to continue in school, childbearing or marriage often mark the end of schooling. Figure 8-4 shows the relationship between enrollment and fertility among young women ages 15-19 in developing regions. While on average fertility among young women is much lower in countries in which enrollment rates remain high, countries with similar enrollment rates show substantial variation in the percentage of 15-19-year-old women who have had a birth. This largely reflects a substantial variation across countries in levels of early fertility among the nonenrolled because, with a few exceptions, women still find it difficult to combine schooling and motherhood, even when allowed to return (see further discussion under the section on policies and programs).
With a rising percentage of young women attending school after the age of puberty, however, a growing percentage of them are exposed to pregnancy while attending school. Evidence presented in Chapter 4 established that adolescent girls who attend school are half as likely as their unmarried peers who are out of school to have ever had sex. Nonetheless, with more of them attending school during ages when they are risk of pregnancy, it is likely that an increasing percentage of births among young women will occur to those who became pregnant while attending school.
In Figure 8-5, we show a scatter plot of country-level data on the proportion of 15-19-year-olds currently enrolled in school and the proportion of those who had had a birth by age 18 who gave pregnancy as the reason for dropping out of school. The figure is based on data from the 28 DHS surveys conducted since 1995 that included questions on reasons for dropout.7 The figure shows that the greater the level of enrollment in a country, the more likely it is that young mothers in that country give pregnancy as a reason for school dropout. Obviously, if enrollment rates are very low at this age, relatively few young women will have attended school at a time when pregnancy was even a potential cause of dropout. This is clearly the case for countries with enrollment rates below 20 percent
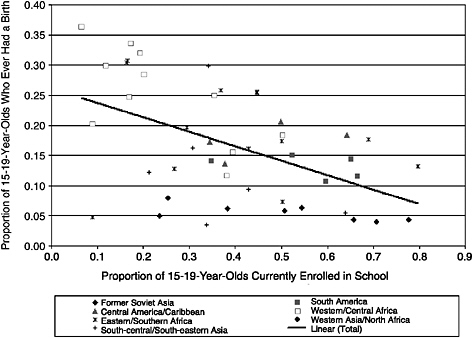
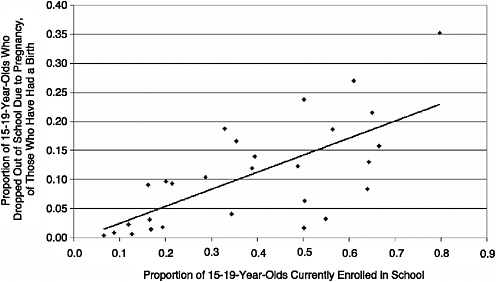
at this age. As enrollment rates rise, the chance that the timing of pregnancy and school dropout will coincide becomes much greater. Nonetheless, among countries with an enrollment rate of 50 percent or more for this age group, the relative importance of schoolgirl pregnancy varies widely across countries, suggesting that variations in the school context across countries may play a role in mediating reproductive behavior among adolescents.
Most literature on pregnancy in developing countries makes the implicit assumption that young women who report that they drop out of school because they are pregnant would have continued in school otherwise (e.g., Ferguson, 1988; Meekers and Ahmed, 1999; Meekers, Gage, and Zhan, 1995). Pregnancy may be an ex post explanation but not a cause. Indeed, rather than pregnancy causing dropout, the lack of social and economic opportunities for girls and young women and the noneconomic household work burdens they carry, coupled with the gender inequities of the school system, may result in unsatisfactory school experiences, poor academic performance, and acquiescence in or endorsement of early motherhood (Lloyd and Mensch, 1999). Moreover, for young women who become pregnant unintentionally, a nonsupportive school environment may contribute to their decision to proceed with the pregnancy rather than having an abortion in order to continue in school.8
Using life table analysis to assess the importance of pregnancy as a factor in school dropout in rural Kenya, Mensch et al. (2001) found that only 3 percent of dropouts by the age of 19 could be attributed to pregnancy, given the sequencing of events in the reporting of the young women’s retrospective schooling and fertility history. Of those young women who had ever attended school and become pregnant, however, the association between pregnancy and dropout was strong—all of those who had become pregnant had dropped out of school. Thus a rise in school enrollment increases the percentage of adolescents who are exposed to the risk of a pregnancy while attending school.
Furthermore, in countries in which enrollments are high and premarital childbearing is common, one would expect that school systems will increasingly find ways to accommodate girls who want to remain in school. For example, in South Africa, where enrollment and premarital fertility are high, young mothers are allowed to return to school. Although this policy was formalized in 1996, it was upheld by many school principals prior to that date. According to Kaufman, Maharaj, and Richter (1998), approximately 34 percent of girls younger than age 24 who had had a child during their teenage years were attending secondary school as far back as 1993.
As noted earlier, young mothers in Cameroon are also allowed to return to school (see Box 8-2). Indeed, in some settings, marriage may be a greater barrier to school attendance than parenthood, because of the increased time married women typically spend on noneconomic household work. Among young women who are able to continue in school as young mothers, however, it is often difficult to balance child care and school work and as a result school performance may suffer. In a case study of schoolgirl mothers in Burkina Faso, Gorgen, Laier, and Diesfeld (1993) describe the challenges faced by the very small minority of young women who were able to return to school after childbirth in terms of time demands and child care responsibilities.
Rise in Formal Sector Work Among Young Women
In Chapter 7, we review the literature on the implications of the rise in formal sector work among young women for marriage timing. While appropriate data are limited and causal interpretations are difficult, there is some evidence suggesting that opportunities for labor market work, in particular work in the formal sector, contribute to marriage delays. By extension, given the tight link between the timing of marriage or union formation and parenthood, we can conclude that the rise in modern sector work may also contribute to delays in the timing of first birth.
We know very little about the extent to which new mothers are able to combine labor market work with new motherhood and, if so, how they manage both. It is clearly much easier to accommodate motherhood and work at home or in rural settings in which mothers can work in the fields and tend their children at the same time. The physical separation of the home and the workplace that often arises with work in the formal sector, most relevant in urban areas, makes the roles of worker and mother less compatible and presents new challenges to young mothers. Box 8-3 outlines the implications of this for urban wives who work in the modern sector in Malaysia and who have to give up their jobs and depend on their husbands after childbirth because of the lack of available child care. While traditional mothers were able to combine work and new motherhood, this is no longer possible for modern mothers in urban Malaysia. Wolf (1992) tells a similar story about factory workers in Indonesia who are forced to leave the factory, not at the time of marriage but at the time of first birth, due to the lack of child care options.
Among women who do continue factory work after marriage, there is some evidence that this is made possible largely through the support of other female family members. Cameron et al. (1998) undertook an investigation of child care arrangements among young women who returned to factory work after the birth of a child despite the 7 day per week, 12 hour
|
BOX 8-3 In the Malaysian state of Sarawak, unprecedented rates of urbanization and the increasing penetration of the market economy into rural areas have increased the need and demand for cash in most villages. Since there are limited cash-earning opportunities in rural villages, most households rely on remittances from members who have migrated to cities to work. The expansion of Sarawak’s urban middle class after the economic boom of the 1980s and 1990s led to greater employment opportunities in the personal service sector, which increased the demand for rural female migrants’ labor. The majority of female migrants in Sarawak reside in the capital city of Kuching, arriving as single women between the ages of 15 and 34. Sim’s (2001) ethnographic study of rural Bidayuh women who migrated to Kuching examines how these women experience motherhood in their new urban environment, how household gender relations change, and how their experiences differ from those of their kin back in the village. The Bidayuh, a minority ethnic group, represent the second largest group of rural migrants in Sarawak. The majority of Bidayuh women Sim interviewed migrated to Kuching with the motivation to become modern and independent, earn money, and undergo a “transformation from rural daughters into urban wage workers” (Sim, 2001:156). Upon marrying and having their first child in Kuching, however, most of these women withdrew from the labor force, staying at home to raise their children. “People say that women without a permanent job should marry and look after her own children…. Even if she has a decent job, she should stop if her husband earns a big salary because it is better to look after her own children. My sister in the village carries her child to the fields when she works. How can a child grow this way?” (Alison, a Bidayuh housewife; Sim, 2001:151-152). This quote illustrates urban women’s attitudes about modern motherhood and the disparity between rural and urban Bidayuh women’s approach to combining work and motherhood. There are significant structural factors that contribute to this disparity: affordable child care is almost nonexistent for low-paid working women in Kuching, whereas rural women can rely on kin to help with child care and incorporate child care into their daily work routine. Therefore, becoming a modern mother for an urban Bidayuh woman means leaving her job to become a housewife, an outcome that Sim (2001) argues derives from economic pragmatism rather than the adoption of Western ideals about motherhood. In addition, rural-to-urban migration is changing the family form for Bidayuh women and men. In the village, the well-being of a family is considered a collective effort, since individual contributions are generally nonmonetary and hard to distinguish. This contrasts with family life in the city, in which men take on the new identity of breadwinner as they become the primary wage earners and the nonwage-earning members (including their wives) become their dependents. Since becoming a mother effectively marks the end, at least for a number of years, of urban Bidayuh women’s wage-earning opportunities in the city (although many women report wanting to return to work after their children are grown), these women become dependent on their husbands after having a child, more so than their sisters and mothers still living in the village. |
per day work schedule in Bangladeshi garment factories. The most common arrangement was for the child to be cared for by the maternal grandmother or by another female relative.
Changes in Health and Health Behaviors
Various changes in health and health behaviors have implications for the transition to first-time parenthood, sometimes improving health prospects for mothers and their children and sometimes worsening them. On one hand, prospects are improved by increased prenatal care and hospital births and by mothers being better nourished. On the other hand, they are worsened by increased prevalence of HIV/AIDS (particularly in sub-Saharan Africa), increased smoking by mothers (U.S. Surgeon General, 2001) and by the inverse association between breastfeeding and increased schooling (Grummer-Strawn, 1996).
The implications of these trends for new mothers remain relatively unexplored but in many cases are likely to become increasingly important. For example, there has been no particular attention to the question of how living in a context in which HIV/AIDS is prevalent or where there is access to antiretroviral therapy affects reproductive decision-making related to the timing of first-time parenthood. Nonetheless, there is evidence from focus group discussions with both single and married men and women in Zimbabwe that some are opting to have children earlier than otherwise in order to have them before they contract the disease or while they are still healthy enough to take care of them (Grieser et al., 2001). A qualitative study in urban Zambia found that women would be concerned if they found out that they were HIV positive while pregnant because pregnancy could “bring out” the disease and accelerate the deterioration of their health. Most men and women interviewed felt that women should not continue childbearing if they test positive for HIV and should instead use contraception to prevent pregnancy (Rutenberg, Biddlecom, and Kaona, 2000).
A recent review of the literature on HIV/AIDS and fertility by the United Nations (2002b) found that seropositive status discourages continuing reproduction because of concerns about the detrimental effects of pregnancy on HIV-positive women’s health, mother-to-child transmission of HIV, and the welfare of children born to a HIV-positive parent. This is more problematic for those who have never had children, given the high social and cultural premium on childbearing. One of the many reasons why the development of an efficacious microbicide as an HIV/AIDS prevention measure is so critical is because a microbicide that is not spermicidal would allow women who wanted to get pregnant to do so without risking infection (Harrison, Rosenburg, and Bowcut, 2003; Population Council and Family Health International, 2001).
Changes in Access to and Use of Prenatal and Delivery Services
Young women who are giving birth to their first child face special risks because the probability of poor outcomes is higher for first births. Furthermore younger mothers face special risks at delivery, because they are likely to be less well educated, come from a rural area, live in a poorer household, and be less well nourished. Very young parenthood also carries heightened risks for physiological reasons. Adequate monitoring and care during pregnancy and at delivery can compensate to some extent for these factors, reducing the probability of poor outcomes (World Health Organization, 1992). Over the past decades, due in large part to concerted efforts by international agencies and country governments, awareness of the benefits of antenatal care, medical attendance at delivery (and in particular emergency obstetric care), and postpartum care have greatly increased and programmatic action has to some extent also improved (Family Care International, 1997).
Survey data show that the proportion of women who make at least one prenatal care visit is moderately high: the World Health Organization (WHO) estimates (circa 1996) that 65 percent of pregnant women obtain some prenatal care in the developing world on average (World Health Organization, 1997). Although these estimates are for women of all ages, they probably reflect the situation of adolescent mothers, given that DHS data show little variation by age in the use of antenatal care or attendance at delivery. There is some regional variation in access to antenatal care: the proportion obtaining some care is much higher, for example, in Eastern Asia (80 percent, including China) and Latin America and the Caribbean (73 percent), but is lower (50-60 percent) in South-central Asia and in Western, Middle, and Northern Africa. Nevertheless, in some of the poorest countries, this proportion is even lower (e.g., 29 percent in Ethiopia and 37 percent in Chad for adolescent women, based on DHS surveys). A limitation of this statistic is that, although it is an indicator of pregnant women obtaining some basic care during pregnancy, it does not suggest whether the care started early in pregnancy or whether the frequency of visits was sufficient to match women’s level of risk (World Health Organization, 1997).
The proportion who are attended at delivery by a trained medical professional (nurse, midwife, or doctor) is somewhat lower: 40 percent deliver in a health facility, but 53 percent are attended by a skilled professional (the difference is those who deliver at home but have a medical professional present). In some regions, the gap between antenatal care and attendance at delivery is much greater: for example, in Eastern, Middle, and Western Africa and in South-central Asia, an estimated 34-42 percent are attended by a medical professional at delivery. Estimates of the trend in the
proportion who are attended by a professional at delivery show some small gains from 1985 to 1996: from 48 to 53 percent in the developing world as a whole; 49 to 53 percent in Asia; 34 to 42 percent in Africa; and 64 to 75 percent in Latin America and the Caribbean (World Health Organization, 1997).
POLICIES AND PROGRAMS
Given the changing context of parenthood, policies and programs of particular interest for promoting successful transitions to first-time parenthood include those that (1) help young people have the option of delaying the first birth until they have completed their education and training, (2) allow new mothers whose schooling, training, or work were disrupted by pregnancy to return to school if they wish, and (3) support first-time parents in the adoption of family planning to allow proper spacing of a second birth. Evaluations of the impact of various programs in sexual and reproductive health designed for young people are fully reviewed in Chapter 4. We are not aware of evaluations in other policy domains with implications for first-time parents. Indeed, to our knowledge very few such programs specifically targeted to newly married couples or first-time parents are currently in operation. Even in a country like China, where marriage and family planning policy has impacted on the lives of all young people in the country for several generations, there has been no deliberate attempt by the government to influence the spacing of the first birth (Feng and Quanhe, 1996).
About 10 years ago, school policies as they related to pregnant students were reviewed for sub-Saharan Africa (National Research Council, 1993b). At that time, most policies required expulsion from school at the time of pregnancy, with some countries allowing for reentry under certain conditions after birth. We were able to update that review and add some data from South America (see Box 8-4). It would appear that the diversity of policies has increased with a growing number of countries allowing for more liberal reentry policies and some even allowing pregnant girls to remain in school during their pregnancy (e.g., Burkina Faso, Cameroon, Chile, Peru). An increasing number of countries allows for a return to school after some period of maternity leave. The extent to which these policies are actually implemented has not been documented, and the effects of such policies have not been evaluated. However, policies are more likely to follow changes in behavior than to lead those changes.
A recent review of programs addressed to married adolescents in developing countries found that most of the relatively few available were addressed to engaged or newly married women or couples but not to first-time parents (Graft, Haberland, and Goldberg, 2003). The Population Council’s
|
BOX 8-4
|
|
first-time parents’ project in Gujurat and West Bengal is fairly unusual in its focus on young married women at the time of first birth. The intervention is currently under way and will be evaluated using a quasi-experimental design. It provides information and services to young married women, their husbands, and their families in two communities using both home visits and group membership activities that take place during pregnancy and during the postpartum period.
CONCLUSIONS AND RECOMMENDATIONS
Key Findings
Our review of the literature and our data analysis lead to the following conclusions:
While parenthood remains nearly universal in all societies, the timing and context in which young women experience this transition remain highly variable across the developing world. In every society, young men become parents at later ages than young women, allowing them more time to invest and prepare for their responsibilities as parents.
In many parts of the developing world, rates of early childbearing remain substantial. The percentage of young people giving birth before age 18—the internationally recognized age of adulthood as defined by the UN Convention on the Rights of the Child—remains in excess of 30 percent in Western and Middle Africa and in excess of 20 percent in South-central and Southeastern Asia, Eastern and Southern Africa, and Central America and the Carribean. In some countries of these regions, over 10 percent have had a birth before the age of 16.
While the percentage of young women having a birth before the age of 16 or 18 is declining almost everywhere, rates of decline vary substantially. The highest rates of decline have occurred in the Middle East, starting from a very low base, and declines have also been substantial in sub-Saharan Africa and Southern Asia. In South America, where rates have been comparatively low, there has been some increase in early childbearing in recent years. The prevalence of early childbearing is highest among poor countries and, within countries, among rural residents and the least educated.
In some regions, most young women make the transition to motherhood quite quickly after a certain age, while in other regions, ages of first motherhood are spread out over a much longer period. In the Middle East and South America, the range of ages across which women have their first birth,
which was already almost the widest, is getting wider, while in other regions it is remaining about the same.
In all regions, at least a quarter of women remain childless until age 24, and in some regions until several years beyond age 24. In Africa and Asia, this occurred for the first time among the youngest cohort, born in the 1970s. In the Middle East, 50 percent of women are still childless at age 24.
The overwhelming majority of births occur within marriage. Among those who give birth after marriage, the length of time between marriage and motherhood is declining everywhere.
Patterns of premarital childbearing vary substantially across regions. In most regions, less than 5 percent of all women have had a child before marriage and before age 20. However, reported rates in sub-Saharan Africa exceed 10 percent in 11 countries and in many South American countries range from 5 to 10 percent. The implications of premarital childbearing for the parents vary substantially across societies.
Some countries have seen recent small increases in rates of premarital childbearing. As a result the percentage of births occurring to young women that are premarital has been rising, and these increases have been most notable in Eastern and Southern Africa and South America.
Gaps in research on first-time parenthood include all aspects of fatherhood, the determinants of and impacts of early parenthood, the implications of recent global changes on transitions to first-time parenthood, and the consequences of early parenthood. Basic research is needed on the timing of fatherhood and on the attitudes of young men regarding pregnancy and fatherhood. Although there is plentiful evidence that early childbearing is correlated with negative outcomes, rigorous research confirming a causal role for age at birth in producing these outcomes does not exist. Major global changes, such as rises in enrollment rates during late adolescence, rising rates of labor force participation among young women, and rising HIV/AIDS prevalence among young women in Africa are likely to have important implications for the transition to parenthood, but little is currently known about their implications.
Policy Recommendations
Systematic evaluations of policies and programs directed at the transition to first parenthood are almost nonexistent. The research findings sum-
marized in this chapter, however, have some implications for policy and programs.
Prenatal and delivery services should reach out to and give attention to the special needs of first-time parents. First-time parents require information and education about pregnancy, delivery, breastfeeding, nutrition, and healthy baby care as well as contraception and fatherhood. Other family members who are involved in supporting first-time parents, particularly new mothers, may also benefit from participating in programs designed to support, prepare, and train new parents. In areas with high HIV prevalence, new parents also need to know about the risks of mother-to-child transmission of HIV, means of reducing this risk, and the importance of voluntary counseling and testing for HIV and other sexually transmitted infections.
Family planning programs should reach out to newly married individuals and couples and assist them in planning their first births so that they are well timed. Family planning programs are often not well designed to meet the needs of the newly married, particularly newly married young women. Young people who are recently married or had their first birth immediately after marriage need assistance in thinking about family-building strategies and taking control of the timing of their pregnancies.
Schools should remove any barriers preventing young parents from returning to school. Complementary programs that can assist young mothers with child care are needed to help adolescent women who have had a child and been forced to interrupt their education to return to school and complete it.
In settings in which girls still become parents as children, there is a need to evaluate the effectiveness of interventions designed to increase awareness in the general community (and among young women and men themselves) of the advantages for later success as an adult of delaying the age of first parenthood. Interventions could take the form of public education campaigns through the media, for example.
There is a need to evaluate the effectiveness of family life education programs and life-skills programs in schools that include discussions of the responsibilities of parenthood, the knowledge and skills required for successful parenthood, and the importance of planning and good timing in the curriculum. It is important to assess whether the addition of these topics could contribute to greater success in transitions to first parenthood.
Research Recommendations
Many of the questions listed below cannot be answered without new data collection or in-depth studies. The panel’s recommendations on new research strategies are discussed in Chapter 9. Our focus on transitions, their interrelationships, and their determinants and consequences lead us to see the following research questions as particularly compelling.
-
How is the context of premarital childbearing changing, and what implications do these changes have for the likelihood of a successful transition?
-
What are the determinants of early parenthood, including individual, family, and community characteristics and policies?
-
What are the fertility desires of newly married couples, and how are they formed? Of young unmarried women?
-
What are the distinguishing features of first-time parenthood as an adolescent, and as a young adolescent?
-
What are the short-term and long-term consequences of starting parenthood at an early age and of starting parenthood with an unwanted child—for individuals, families, and communities?
-
How are changes in the timing of first-time parenthood affecting transitions into and out of school and work and, in turn, how are changes in schooling and work transitions affecting the timing of marriage and parenthood?
-
What are the differences between young men and women in their experiences with the transition to parenthood, and how are they changing? What are young men’s attitudes and expectations with respect to parenthood, and how are they shared?
-
What are the implications of HIV/AIDS for the timing and context of first-time parenthood?
APPENDIX TABLES 8-1 TO 8-7 FOLLOW
APPENDIX TABLE 8-1 Parenthood by Age and Sex, DHS Countries (Percentage)
|
Country and Year of Survey |
Ever Had a Child |
|||||||
|
Males |
Females |
|||||||
|
15-19 |
20-24 |
25-29 |
30-34 |
15-19 |
20-24 |
25-29 |
30-34 |
|
|
Armenia, 2000 |
|
4.4 |
44.3 |
81.7 |
91.1 |
|||
|
Bangladesh, 1999-2000 |
29.8 |
72.7 |
91.4 |
96.7 |
||||
|
Benin, 2001 |
1.4 |
18.3 |
60.6 |
87.1 |
15.4 |
66.4 |
90.3 |
96.2 |
|
Bolivia, 1998 |
2.9 |
29.4 |
62.0 |
83.8 |
11.5 |
54.6 |
82.3 |
92.1 |
|
Brazil, 1996 |
3.1 |
22.6 |
52.6 |
77.7 |
14.3 |
49.2 |
73.8 |
87.8 |
|
Burkina Faso, 1998-1999 |
0.7 |
14.9 |
53.2 |
87.7 |
20.2 |
84.0 |
95.7 |
98.2 |
|
Cameroon, 1998 |
2.6 |
21.6 |
50.4 |
77.8 |
25.0 |
68.0 |
90.5 |
95.1 |
|
Central African Republic, 1994-1995 |
4.7 |
38.4 |
71.2 |
89.9 |
28.4 |
77.2 |
88.6 |
93.3 |
|
Chad, 1996-1997 |
2.9 |
26.8 |
66.0 |
89.5 |
29.8 |
84.6 |
95.6 |
97.3 |
|
Colombia, 2000 |
|
15.1 |
51.5 |
76.9 |
85.3 |
|||
|
Comoros, 1996 |
0.5 |
9.4 |
32.3 |
67.5 |
7.3 |
40.8 |
70.1 |
85.2 |
|
Côte d’Ivoire, 1998-1999 |
3.3 |
26.6 |
44.0 |
81.9 |
24.7 |
71.2 |
88.3 |
94.1 |
|
Dominican Republic, 1996 |
1.3 |
21.0 |
54.4 |
79.7 |
18.3 |
58.4 |
80.6 |
90.9 |
|
Egypt, 2000 |
|
5.8 |
43.3 |
77.2 |
90.2 |
|||
|
Ethiopia, 1999 |
0.3 |
14.5 |
59.2 |
79.7 |
12.8 |
61.9 |
85.4 |
95.5 |
|
Ghana, 1998-1999 |
0.6 |
13.5 |
45.2 |
79.7 |
11.7 |
60.8 |
82.4 |
93.9 |
|
Guatemala, 1998-1999 |
17.3 |
67.3 |
88.3 |
93.5 |
|
|||
|
Guinea, 1999 |
1.8 |
16.2 |
52.1 |
73.0 |
32.0 |
77.2 |
92.6 |
96.3 |
|
Haiti, 2000 |
0.8 |
20.5 |
47.3 |
74.2 |
13.6 |
49.5 |
74.7 |
87.3 |
|
India, 1998-2000 |
|
16.4 |
64.2 |
87.8 |
93.9 |
|||
|
Indonesia, 1997 |
9.4 |
53.3 |
79.6 |
90.7 |
||||
|
Jordan, 1997 |
4.0 |
30.8 |
61.4 |
76.5 |
||||
|
Kazakhstan, 1999 |
4.4 |
46.3 |
81.2 |
91.0 |
||||
|
Kenya, 1998 |
1.1 |
18.0 |
56.5 |
86.8 |
17.3 |
69.2 |
92.6 |
97.3 |
|
Kyrgyz Republic, 1997 |
|
6.3 |
65.5 |
90.0 |
94.5 |
|||
|
Madagascar, 1997 |
30.7 |
76.6 |
87.9 |
91.9 |
||||
|
Malawi, 2000 |
3.0 |
32.9 |
82.0 |
95.2 |
25.4 |
83.3 |
96.0 |
97.0 |
|
Mali, 1995-1996 |
0.2 |
18.9 |
61.5 |
80.2 |
33.6 |
84.9 |
93.6 |
96.6 |
|
Morocco, 1992 |
|
4.9 |
33.9 |
57.0 |
79.7 |
|||
|
Mozambique, 1997 |
3.1 |
42.3 |
71.7 |
89.2 |
30.4 |
78.9 |
93.2 |
96.1 |
|
Namibia, 1992 |
|
17.7 |
63.3 |
81.4 |
92.8 |
|||
|
Nepal, 2000-2001 |
16.2 |
70.5 |
91.7 |
95.5 |
||||
|
Nicaragua, 1997-1998 |
3.9 |
46.0 |
76.3 |
85.8 |
22.1 |
66.8 |
84.8 |
92.9 |
|
Niger, 1998 |
0.8 |
23.0 |
70.6 |
88.1 |
36.3 |
82.4 |
94.6 |
97.0 |
|
Nigeria, 1999 |
1.8 |
11.9 |
45.5 |
77.0 |
18.4 |
55.7 |
81.6 |
91.3 |
|
Pakistan, 1990-1991 |
|
12.2 |
45.7 |
77.0 |
90.8 |
|||
|
Paraguay, 1990 |
14.1 |
56.4 |
80.3 |
91.8 |
||||
|
Peru, 2000 |
2.0 |
24.0 |
57.9 |
77.5 |
10.7 |
48.0 |
72.9 |
87.0 |
|
Philippines, 1998 |
|
5.5 |
38.5 |
70.2 |
84.5 |
|||
|
Rwanda, 2000 |
4.8 |
54.9 |
86.2 |
94.6 |
||||
|
Senegal, 1997 |
18.2 |
58.2 |
81.7 |
94.9 |
||||
|
South Africa, 1998 |
13.2 |
58.3 |
81.6 |
93.2 |
||||
|
Tanzania, 1999 |
19.7 |
78.4 |
92.0 |
94.4 |
||||
|
Togo, 1998 |
1.5 |
15.1 |
53.9 |
76.6 |
15.5 |
59.1 |
88.2 |
96.1 |
|
Turkey, 1998 |
|
7.9 |
46.1 |
77.2 |
89.8 |
|||
|
Uganda, 2000-2001 |
5.2 |
40.2 |
82.0 |
95.5 |
25.6 |
84.4 |
95.6 |
96.5 |
|
Uzbekistan, 1996 |
6.2 |
59.6 |
88.7 |
95.8 |
|
|||
|
Vietnam, 1997 |
|
3.5 |
43.9 |
74.9 |
86.6 |
|||
|
Yemen, 1991-1992 |
10.9 |
56.0 |
83.9 |
94.4 |
||||
|
Zambia, 1996-1997 |
1.3 |
31.9 |
72.9 |
88.0 |
23.9 |
78.8 |
91.9 |
96.2 |
|
Zimbabwe, 1999 |
0.3 |
16.8 |
61.2 |
90.4 |
16.2 |
69.3 |
92.3 |
94.8 |
|
Number of Countries: |
26 |
26 |
26 |
26 |
51 |
51 |
51 |
51 |
APPENDIX TABLE 8-2 Age of Transition to First Motherhood by Quartile, DHS Countries
|
Country and Year of Survey |
25th Quartile |
||
|
20-24 |
30-34 |
40-44 |
|
|
Armenia, 2000 |
19.9 |
19.6 |
20.2 |
|
Bangladesh, 1999-2000 |
16.4 |
16.1 |
15.5 |
|
Benin, 2001 |
18.1 |
17.2 |
17.3 |
|
Bolivia, 1998 |
18.8 |
18.8 |
19.3 |
|
Brazil, 1996 |
19.0 |
19.3 |
19.6 |
|
Burkina Faso, 1998-1999 |
17.5 |
17.5 |
17.3 |
|
Cameroon, 1998 |
17.3 |
16.8 |
16.9 |
|
Central African Republic, 1994-1995 |
17.0 |
16.8 |
16.4 |
|
Chad, 1996-1997 |
16.4 |
16.2 |
15.8 |
|
Colombia, 2000 |
18.8 |
19.4 |
19.0 |
|
Comoros, 1996 |
19.4 |
17.4 |
17.5 |
|
Côte d’Ivoire, 1998-1999 |
17.0 |
16.3 |
16.5 |
|
Dominican Republic, 1996 |
18.3 |
18.3 |
18.1 |
|
Egypt, 2000 |
20.2 |
18.7 |
18.5 |
|
Ethiopia, 1999 |
18.1 |
16.5 |
16.5 |
|
Ghana, 1998-1999 |
18.3 |
17.8 |
17.7 |
|
Guatemala, 1998-1999 |
18.0 |
17.7 |
17.9 |
|
Guinea, 1999 |
16.1 |
16.1 |
16.0 |
|
Haiti, 2000 |
19.3 |
19.1 |
19.1 |
|
India, 1998-2000 |
17.7 |
17.3 |
17.3 |
|
Indonesia, 1997 |
19.3 |
18.1 |
17.9 |
|
Jordan, 1997 |
21.5 |
20.2 |
18.6 |
|
Kazakhstan, 1999 |
20.2 |
20.4 |
20.5 |
|
Kenya, 1998 |
18.2 |
17.4 |
16.7 |
|
Kyrgyz Republic, 1997 |
19.3 |
20.3 |
20.0 |
|
Madagascar, 1997 |
17.3 |
17.3 |
16.7 |
|
50th Quartile |
75th Quartile |
||||
|
20-24 |
30-34 |
40-44 |
20-24 |
30-34 |
40-44 |
|
22.8 |
21.3 |
22.3 |
|
24.0 |
26.0 |
|
18.8 |
18.0 |
17.2 |
22.7 |
20.6 |
19.8 |
|
20.3 |
19.6 |
19.8 |
23.3 |
22.7 |
22.6 |
|
21.6 |
21.4 |
21.6 |
|
24.8 |
25.0 |
|
22.4 |
22.1 |
22.3 |
26.8 |
26.4 |
|
|
19.1 |
19.2 |
19.2 |
20.9 |
21.1 |
21.3 |
|
19.4 |
18.8 |
18.9 |
23.9 |
21.1 |
22.2 |
|
18.9 |
19.3 |
18.8 |
21.8 |
22.3 |
22.9 |
|
18.3 |
18.3 |
18.1 |
20.4 |
21.3 |
22.0 |
|
22.1 |
22.4 |
21.8 |
|
27.7 |
26.3 |
|
23.8 |
20.9 |
20.0 |
26.3 |
24.4 |
|
|
19.4 |
19.1 |
18.6 |
22.8 |
22.4 |
21.8 |
|
21.2 |
21.3 |
20.8 |
|
25.2 |
25.3 |
|
23.2 |
21.6 |
21.3 |
24.9 |
25.6 |
25.3 |
|
20.7 |
18.5 |
18.3 |
24.6 |
21.3 |
20.7 |
|
21.0 |
20.0 |
19.9 |
|
23.2 |
22.7 |
|
20.4 |
20.3 |
19.8 |
23.1 |
22.9 |
23.2 |
|
18.2 |
18.3 |
18.5 |
21.3 |
21.0 |
21.8 |
|
22.1 |
22.3 |
21.2 |
|
27.0 |
25.4 |
|
20.2 |
19.4 |
19.6 |
23.6 |
22.4 |
22.4 |
|
21.8 |
20.7 |
20.5 |
|
24.6 |
24.0 |
|
|
24.0 |
21.3 |
31.9 |
25.2 |
|
|
22.3 |
22.1 |
22.5 |
24.9 |
25.3 |
|
|
20.3 |
19.4 |
18.8 |
22.8 |
22.2 |
21.3 |
|
20.8 |
21.8 |
21.6 |
23.0 |
24.2 |
23.8 |
|
19.3 |
19.9 |
18.8 |
22.0 |
23.8 |
23.3 |
|
Country and Year of Survey |
25th Quartile |
||
|
20-24 |
30-34 |
40-44 |
|
|
Malawi, 2000 |
17.6 |
16.9 |
16.9 |
|
Mali, 2001 |
16.5 |
16.3 |
16.8 |
|
Morocco, 1992 |
20.9 |
19.4 |
18.4 |
|
Mozambique, 1997 |
16.6 |
16.7 |
16.0 |
|
Namibia, 1992 |
18.6 |
18.3 |
18.7 |
|
Nepal, 2000-2001 |
17.7 |
18.0 |
18.1 |
|
Nicaragua, 2001 |
17.7 |
17.3 |
17.3 |
|
Niger, 1998 |
16.4 |
15.9 |
15.9 |
|
Nigeria, 1999 |
17.5 |
16.8 |
16.0 |
|
Pakistan, 1990-1991 |
19.3 |
18.0 |
18.3 |
|
Paraguay, 1990 |
18.9 |
19.1 |
19.2 |
|
Peru, 2000 |
19.3 |
19.0 |
18.8 |
|
Philippines, 1998 |
20.7 |
20.1 |
19.8 |
|
Rwanda, 2000 |
19.5 |
19.8 |
19.9 |
|
Senegal, 1997 |
17.8 |
17.1 |
17.0 |
|
South Africa, 1998 |
18.4 |
18.0 |
18.7 |
|
Tanzania, 1999 |
17.8 |
17.3 |
16.3 |
|
Togo, 1998 |
18.5 |
17.8 |
17.6 |
|
Turkey, 1998 |
19.8 |
19.1 |
18.4 |
|
Uganda, 2000-2001 |
16.8 |
16.5 |
16.5 |
|
Uzbekistan, 1996 |
19.9 |
20.1 |
19.8 |
|
Vietnam, 1997 |
20.5 |
20.6 |
21.7 |
|
Yemen, 1991-1992 |
19.0 |
17.2 |
18.4 |
|
Zambia, 2001-2002 |
17.3 |
17.2 |
16.8 |
|
Zimbabwe, 1999 |
18.3 |
18.2 |
17.7 |
|
50th Quartile |
75th Quartile |
||||
|
20-24 |
30-34 |
40-44 |
20-24 |
30-34 |
40-44 |
|
19.3 |
18.8 |
18.9 |
21.0 |
20.9 |
21.3 |
|
18.4 |
18.4 |
19.2 |
20.8 |
21.2 |
22.0 |
|
|
22.2 |
20.9 |
|
28.5 |
24.2 |
|
18.7 |
19.1 |
18.5 |
21.3 |
21.8 |
23.2 |
|
20.8 |
20.4 |
21.0 |
23.9 |
24.2 |
24.3 |
|
19.2 |
19.7 |
19.9 |
21.0 |
21.8 |
22.4 |
|
20.2 |
19.5 |
19.4 |
|
22.8 |
22.4 |
|
18.2 |
17.3 |
17.8 |
20.7 |
19.8 |
20.6 |
|
21.2 |
20.1 |
19.4 |
|
24.0 |
23.0 |
|
22.9 |
20.8 |
21.7 |
24.5 |
25.3 |
|
|
21.7 |
21.7 |
21.6 |
25.8 |
25.8 |
|
|
22.6 |
21.8 |
21.7 |
26.7 |
26.2 |
|
|
24.1 |
23.3 |
22.8 |
28.1 |
27.8 |
|
|
21.7 |
22.2 |
22.0 |
24.6 |
24.8 |
24.5 |
|
20.9 |
19.4 |
19.7 |
|
22.8 |
22.4 |
|
21.0 |
20.2 |
20.9 |
23.8 |
24.3 |
|
|
19.4 |
19.1 |
17.8 |
21.5 |
21.1 |
20.3 |
|
21.0 |
19.8 |
20.1 |
24.8 |
22.8 |
22.8 |
|
22.9 |
21.8 |
20.4 |
|
25.5 |
23.3 |
|
18.3 |
18.5 |
18.7 |
20.4 |
20.5 |
21.2 |
|
21.2 |
21.8 |
21.3 |
23.9 |
23.8 |
23.3 |
|
22.9 |
22.8 |
23.1 |
|
26.3 |
26.8 |
|
23.8 |
19.8 |
22.2 |
23.3 |
26.6 |
|
|
19.0 |
18.8 |
18.3 |
21.5 |
21.1 |
20.3 |
|
20.2 |
20.2 |
19.8 |
23.0 |
23.1 |
21.9 |
APPENDIX TABLE 8-3 Percentage of Women Giving Birth by Age 16 and by Age 18, DHS Countries
|
Country and Year of Survey |
Birth by 16 |
Birth by 18 |
||||
|
20-24 |
30-34 |
40-44 |
20-24 |
30-34 |
40-44 |
|
|
Armenia, 2000 |
0.4 |
0.1 |
0.2 |
8.0 |
3.7 |
3.3 |
|
Bangladesh, 1999-2000 |
19.5 |
23.6 |
33.6 |
43.7 |
50.4 |
58.5 |
|
Benin, 2001 |
7.7 |
14.0 |
13.2 |
23.8 |
33.3 |
32.8 |
|
Bolivia, 1998 |
3.7 |
4.3 |
4.5 |
16.0 |
16.8 |
14.2 |
|
Brazil, 1996 |
4.3 |
3.5 |
2.8 |
16.0 |
14.4 |
10.8 |
|
Burkina Faso, 1998-1999 |
9.7 |
11.3 |
12.5 |
33.1 |
32.4 |
34.6 |
|
Cameroon, 1998 |
12.7 |
14.4 |
16.4 |
33.2 |
41.2 |
39.5 |
|
Central African Republic, 1994-1995 |
13.1 |
14.9 |
20.4 |
37.7 |
35.9 |
40.6 |
|
Chad, 1996-1997 |
19.7 |
21.8 |
27.4 |
45.4 |
45.5 |
48.0 |
|
Colombia, 2000 |
4.8 |
3.6 |
4.2 |
18.9 |
12.7 |
14.9 |
|
Comoros, 1996 |
5.4 |
15.0 |
16.9 |
17.0 |
29.5 |
31.5 |
|
Côte d’Ivoire, 1998-1999 |
13.3 |
20.2 |
21.3 |
35.0 |
40.6 |
42.6 |
|
Dominican Republic, 1996 |
6.5 |
8.0 |
9.0 |
21.6 |
21.9 |
24.0 |
|
Egypt, 2000 |
2.7 |
5.4 |
7.2 |
9.5 |
19.3 |
21.4 |
|
Ethiopia, 1999 |
7.3 |
17.6 |
17.4 |
24.2 |
43.1 |
46.0 |
|
Ghana, 1998-1999 |
4.7 |
9.7 |
9.5 |
19.9 |
26.5 |
28.3 |
|
Guatemala, 1998-1999 |
8.1 |
9.1 |
8.1 |
23.8 |
27.3 |
25.6 |
|
Guinea, 1999 |
22.9 |
22.5 |
24.4 |
47.3 |
45.5 |
44.8 |
|
Haiti, 2000 |
3.9 |
5.2 |
6.2 |
15.2 |
14.3 |
16.3 |
|
India, 1998-2000 |
10.7 |
13.4 |
14.0 |
27.6 |
35.1 |
35.3 |
|
Indonesia, 1997 |
3.9 |
8.8 |
10.7 |
14.0 |
23.1 |
25.7 |
|
Jordan, 1997 |
0.4 |
1.1 |
5.2 |
6.0 |
9.2 |
18.9 |
|
Kazakhstan, 1999 |
0.6 |
0.4 |
0.1 |
5.9 |
3.4 |
1.6 |
|
Kenya, 1998 |
8.8 |
12.4 |
18.6 |
23.2 |
32.5 |
38.5 |
|
Kyrgyz Republic, 1997 |
0.0 |
0.0 |
0.0 |
4.2 |
2.3 |
2.5 |
|
Madagascar, 1997 |
13.5 |
14.2 |
16.0 |
32.2 |
31.6 |
40.1 |
|
Malawi, 2000 |
8.7 |
14.7 |
17.0 |
30.3 |
38.5 |
39.6 |
|
Mali, 2001 |
19.0 |
21.3 |
17.1 |
45.0 |
45.5 |
36.8 |
|
Morocco, 1992 |
1.5 |
4.3 |
8.3 |
7.3 |
13.8 |
20.4 |
|
Mozambique, 1997 |
17.0 |
20.1 |
23.0 |
43.2 |
36.6 |
44.8 |
|
Namibia, 1992 |
4.6 |
9.0 |
7.1 |
17.8 |
22.3 |
20.0 |
|
Nepal, 2000-2001 |
4.3 |
3.5 |
5.0 |
26.0 |
23.8 |
23.7 |
|
Nicaragua, 2001 |
9.6 |
11.5 |
14.0 |
28.1 |
30.8 |
33.2 |
|
Niger, 1998 |
19.1 |
26.0 |
25.5 |
46.5 |
58.8 |
51.9 |
|
Nigeria, 1999 |
14.1 |
20.8 |
24.4 |
27.7 |
33.6 |
39.0 |
|
Pakistan, 1990-1991 |
7.7 |
9.4 |
11.7 |
17.1 |
24.4 |
21.9 |
|
Paraguay, 1990 |
3.7 |
4.1 |
3.5 |
16.0 |
16.2 |
14.2 |
|
Peru, 2000 |
3.6 |
4.6 |
5.6 |
14.2 |
16.0 |
16.4 |
|
Philippines, 1998 |
1.5 |
2.1 |
2.5 |
7.1 |
9.1 |
10.6 |
|
Rwanda, 2000 |
2.2 |
1.8 |
2.9 |
9.2 |
9.7 |
10.4 |
|
Senegal, 1997 |
9.7 |
13.1 |
13.8 |
25.8 |
34.7 |
33.4 |
|
South Africa, 1998 |
4.7 |
7.8 |
5.7 |
20.3 |
24.6 |
18.3 |
|
Tanzania, 1999 |
6.7 |
11.9 |
21.5 |
26.5 |
34.8 |
51.1 |
|
Togo, 1998 |
7.6 |
12.1 |
10.3 |
18.9 |
28.0 |
28.1 |
|
Turkey, 1998 |
2.2 |
4.2 |
3.6 |
11.0 |
14.8 |
20.0 |
|
Uganda, 2000-2001 |
14.1 |
18.2 |
20.0 |
41.9 |
43.0 |
42.2 |
|
Uzbekistan, 1996 |
0.0 |
0.1 |
0.3 |
2.6 |
2.6 |
4.7 |
|
Vietnam, 1997 |
0.3 |
0.7 |
0.7 |
4.1 |
4.4 |
3.8 |
|
Yemen, 1991-1992 |
11.3 |
13.2 |
10.8 |
27.0 |
35.3 |
22.7 |
|
Zambia, 2001-2002 |
8.9 |
10.4 |
16.5 |
34.6 |
37.4 |
44.9 |
|
Zimbabwe, 1999 |
6.0 |
7.4 |
12.0 |
19.1 |
23.3 |
28.3 |
APPENDIX TABLE 8-4a Percentage of Women Giving Birth by Age 18, by Years of Schooling, DHS Countries
|
Country and Year of Survey |
20-24 |
40-44 |
||||
|
0-3 |
0-4 |
8+ |
0-3 |
0-4 |
8+ |
|
|
Bangladesh, 1999-2000 |
61.7 |
44.4 |
14.6 |
62.7 |
56.9 |
33.6 |
|
Benin, 2001 |
29.5 |
11.2 |
2.4 |
35.1 |
23.3 |
18.2 |
|
Bolivia, 1998 |
31.4 |
26.2 |
8.7 |
17.9 |
20.7 |
6.5 |
|
Brazil, 1996 |
34.4 |
19.8 |
7.4 |
17.5 |
11.8 |
2.7 |
|
Burkina Faso, 1998-1999 |
36.1 |
24.5 |
10.0 |
35.1 |
31.0 |
7.7 |
|
Cameroon, 1998 |
53.0 |
36.8 |
17.2 |
41.8 |
41.0 |
28.8 |
|
Central African Republic, 1994-1995 |
39.4 |
38.5 |
26.7 |
40.0 |
50.2 |
27.9 |
|
Chad, 1996-1997 |
48.2 |
30.0 |
16.6 |
47.6 |
56.3 |
51.6 |
|
Colombia, 2000 |
36.3 |
19.1 |
2.5 |
21.7 |
12.4 |
3.9 |
|
Comoros, 1996 |
24.0 |
16.4 |
4.3 |
33.2 |
22.2 |
0.0 |
|
Côte d’Ivoire, 1998-1999 |
38.8 |
41.6 |
13.3 |
40.3 |
55.7 |
30.9 |
|
Dominican Republic, 1996 |
50.3 |
38.4 |
10.3 |
36.0 |
29.1 |
9.9 |
|
Egypt, 2000 |
24.4 |
12.2 |
2.1 |
29.5 |
20.6 |
2.6 |
|
Ethiopia, 1999 |
26.1 |
24.2 |
8.4 |
46.8 |
43.8 |
8.8 |
|
Ghana, 1998-1999 |
29.9 |
19.0 |
14.5 |
30.0 |
37.3 |
23.0 |
|
Guatemala, 1998-1999 |
35.8 |
22.4 |
6.1 |
31.0 |
13.3 |
9.2 |
|
Guinea, 1999 |
51.6 |
43.1 |
14.2 |
46.3 |
41.1 |
28.9 |
|
Haiti, 2000 |
22.4 |
18.3 |
5.4 |
20.4 |
7.9 |
1.4 |
|
Indonesia, 1997 |
30.2 |
20.4 |
4.6 |
30.5 |
29.7 |
9.3 |
|
Jordan, 1997 |
9.2 |
14.5 |
4.7 |
25.1 |
28.5 |
9.7 |
|
Kenya, 1998 |
46.8 |
37.2 |
13.8 |
46.8 |
43.1 |
15.2 |
|
Madagascar, 1997 |
42.9 |
27.8 |
11.3 |
48.0 |
34.5 |
11.9 |
|
Malawi, 2000 |
40.2 |
31.8 |
12.8 |
44.0 |
36.6 |
18.8 |
|
Mali, 2001 |
50.0 |
27.6 |
10.9 |
38.0 |
36.6 |
15.0 |
|
Morocco, 1992 |
10.6 |
4.4 |
0.8 |
21.6 |
23.4 |
2.0 |
|
Mozambique, 1997 |
46.5 |
39.6 |
13.5 |
46.9 |
28.6 |
25.0 |
|
Namibia, 1992 |
35.6 |
20.7 |
9.8 |
24.9 |
18.6 |
10.3 |
|
Nepal, 2000-2001 |
31.4 |
26.3 |
9.1 |
24.3 |
22.2 |
3.5 |
|
Nicaragua, 2001 |
52.9 |
38.8 |
10.1 |
44.4 |
37.5 |
11.5 |
|
Niger, 1998 |
51.1 |
35.3 |
11.1 |
52.8 |
40.3 |
10.1 |
|
Nigeria, 1999 |
54.9 |
28.0 |
7.5 |
45.4 |
33.9 |
12.8 |
|
Paraguay, 1990 |
34.8 |
16.5 |
10.0 |
22.8 |
13.5 |
0.9 |
|
Peru, 2000 |
34.3 |
33.3 |
6.9 |
27.4 |
23.7 |
7.8 |
|
Philippines, 1998 |
23.1 |
17.5 |
3.8 |
21.7 |
15.9 |
5.4 |
|
Rwanda, 2000 |
12.1 |
8.0 |
6.8 |
12.9 |
6.1 |
2.3 |
|
Senegal, 1997 |
33.5 |
15.8 |
4.4 |
35.3 |
34.4 |
9.0 |
|
South Africa, 1998 |
41.0 |
38.3 |
16.8 |
26.2 |
23.8 |
11.9 |
|
Tanzania, 1999 |
40.4 |
23.7 |
2.8 |
52.8 |
51.1 |
26.7 |
|
Togo, 1998 |
25.7 |
12.5 |
0.6 |
31.3 |
21.6 |
10.9 |
|
Turkey, 1998 |
23.1 |
13.5 |
2.4 |
32.1 |
16.0 |
2.2 |
|
Uganda, 2000-2001 |
52.9 |
46.8 |
14.0 |
42.6 |
44.1 |
34.9 |
|
Vietnam, 1997 |
7.1 |
5.1 |
2.5 |
8.6 |
5.2 |
0.9 |
|
Zambia, 2001-2002 |
46.2 |
40.4 |
19.0 |
48.7 |
48.1 |
31.2 |
|
Zimbabwe, 1999 |
50.0 |
35.7 |
11.0 |
38.5 |
24.9 |
15.9 |
APPENDIX TABLE 8-4b Percentage of Women Giving Birth by Age 18, by Residence, DHS Countries
|
Country and Year of Survey |
20-24 |
40-44 |
||
|
Rural |
Urban |
Rural |
Urban |
|
|
Armenia, 2000 |
14.2 |
4.4 |
4.5 |
2.6 |
|
Bangladesh, 1999-2000 |
47.4 |
29.9 |
59.1 |
56.2 |
|
Benin, 2001 |
30.1 |
15.0 |
32.9 |
32.6 |
|
Bolivia, 1998 |
30.2 |
11.5 |
17.9 |
12.4 |
|
Brazil, 1996 |
21.8 |
14.7 |
12.9 |
10.4 |
|
Burkina Faso, 1998-1999 |
36.6 |
19.0 |
35.0 |
32.5 |
|
Cameroon, 1998 |
41.3 |
19.9 |
38.7 |
41.2 |
|
Central African Republic, 1994-1995 |
38.6 |
36.7 |
35.6 |
48.1 |
|
Chad, 1996-1997 |
46.4 |
42.2 |
48.6 |
46.3 |
|
Colombia, 2000 |
30.0 |
16.3 |
22.9 |
12.5 |
|
Comoros, 1996 |
18.8 |
13.2 |
28.3 |
40.7 |
|
Côte d’Ivoire, 1998-1999 |
43.7 |
26.4 |
42.9 |
42.1 |
|
Dominican Republic, 1996 |
30.0 |
17.7 |
30.6 |
20.9 |
|
Egypt, 2000 |
12.7 |
5.6 |
28.6 |
14.1 |
|
Ethiopia, 1999 |
25.9 |
17.2 |
46.8 |
41.1 |
|
Ghana, 1998-1999 |
22.9 |
14.9 |
29.6 |
25.4 |
|
Guatemala, 1998-1999 |
31.6 |
16.0 |
30.8 |
19.3 |
|
Guinea, 1999 |
55.7 |
33.0 |
46.4 |
40.4 |
|
Haiti, 2000 |
18.1 |
12.4 |
19.2 |
12.6 |
|
India, 1998-2000 |
32.8 |
14.2 |
39.2 |
26.1 |
|
Indonesia, 1997 |
18.9 |
4.8 |
29.0 |
18.7 |
|
Jordan, 1997 |
6.8 |
5.9 |
22.9 |
18.3 |
|
Kazakhstan, 1999 |
5.7 |
6.2 |
1.0 |
2.1 |
|
Kenya, 1998 |
25.1 |
18.7 |
41.0 |
23.4 |
|
Kyrgyz Republic, 1997 |
3.7 |
5.4 |
2.9 |
1.7 |
|
Madagascar, 1997 |
36.0 |
22.3 |
45.2 |
29.4 |
|
Malawi, 2000 |
32.3 |
21.8 |
40.4 |
33.8 |
|
Mali, 2001 |
51.4 |
31.1 |
36.8 |
37.1 |
|
Morocco, 1992 |
10.0 |
4.7 |
20.2 |
20.7 |
|
Mozambique, 1997 |
44.2 |
40.1 |
47.4 |
31.7 |
|
Namibia, 1992 |
17.5 |
18.2 |
18.0 |
24.1 |
|
Nepal, 2000-2001 |
26.8 |
20.7 |
23.4 |
26.3 |
|
Nicaragua, 2001 |
38.4 |
22.2 |
40.5 |
29.5 |
|
Niger, 1998 |
52.1 |
27.4 |
53.7 |
44.2 |
|
Country and Year of Survey |
20-24 |
40-44 |
||
|
Rural |
Urban |
Rural |
Urban |
|
|
Nigeria, 1999 |
31.7 |
19.4 |
42.3 |
31.9 |
|
Pakistan, 1990-1991 |
20.2 |
11.2 |
21.8 |
22.1 |
|
Paraguay, 1990 |
20.6 |
12.5 |
18.2 |
10.8 |
|
Peru, 2000 |
26.2 |
9.4 |
22.3 |
14.0 |
|
Philippines, 1998 |
9.4 |
5.5 |
12.7 |
8.9 |
|
Rwanda, 2000 |
7.9 |
13.8 |
11.1 |
5.1 |
|
Senegal, 1997 |
34.5 |
15.3 |
36.0 |
30.0 |
|
South Africa, 1998 |
24.8 |
17.0 |
16.8 |
19.1 |
|
Tanzania, 1999 |
29.4 |
20.4 |
49.2 |
56.7 |
|
Togo, 1998 |
25.9 |
9.6 |
30.5 |
23.5 |
|
Turkey, 1998 |
15.1 |
9.0 |
25.6 |
17.2 |
|
Uganda, 2000-2001 |
45.0 |
29.5 |
43.2 |
34.5 |
|
Uzbekistan, 1996 |
3.1 |
1.8 |
6.0 |
3.1 |
|
Vietnam, 1997 |
4.6 |
2.2 |
4.4 |
1.9 |
|
Yemen, 1991-1992 |
29.1 |
21.1 |
21.0 |
29.6 |
|
Zambia, 2001-2002 |
39.9 |
27.3 |
44.9 |
44.8 |
|
Zimbabwe, 1999 |
26.2 |
12.8 |
29.2 |
26.1 |
APPENDIX TABLE 8-5 Percentage of Births That Occur Within Marriage, of All Births, DHS Countries
|
Country and Year of Survey |
Within Marriage |
Within 7 Months of Marriage |
||||
|
20-24 |
30-34 |
40-44 |
20-24 |
30-34 |
40-44 |
|
|
Armenia, 2000 |
99.4 |
98.2 |
98.7 |
0.8 |
2.4 |
1.4 |
|
Bangladesh, 1999-2000 |
98.7 |
96.7 |
97.5 |
5.7 |
7.7 |
5.8 |
|
Benin, 2001 |
86.0 |
85.5 |
85.6 |
24.0 |
28.2 |
22.4 |
|
Bolivia, 1998 |
70.7 |
79.7 |
79.7 |
21.4 |
19.3 |
16.7 |
|
Brazil, 1996 |
76.5 |
87.1 |
88.6 |
25.1 |
18.0 |
12.7 |
|
Burkina Faso, 1998-1999 |
85.6 |
85.4 |
85.7 |
21.6 |
21.6 |
24.9 |
|
Cameroon, 1998 |
68.9 |
74.5 |
79.5 |
14.0 |
9.6 |
14.8 |
|
Central African Republic, 1994-1995 |
82.3 |
88.2 |
92.5 |
8.4 |
10.0 |
10.1 |
|
Chad, 1996-1997 |
95.7 |
96.4 |
98.1 |
6.9 |
7.2 |
8.5 |
|
Colombia, 2000 |
68.2 |
77.5 |
82.1 |
21.4 |
14.8 |
11.6 |
|
Comoros, 1996 |
95.7 |
96.1 |
93.1 |
12.4 |
12.9 |
13.8 |
|
Côte d’Ivoire, 1998-1999 |
59.1 |
66.2 |
72.3 |
19.5 |
17.0 |
16.4 |
|
Dominican Republic, 1996 |
94.2 |
95.6 |
95.2 |
6.9 |
9.0 |
7.1 |
|
Egypt, 2000 |
99.9 |
99.3 |
99.1 |
2.4 |
8.1 |
10.1 |
|
Ethiopia, 1999 |
96.2 |
95.1 |
95.8 |
5.8 |
9.4 |
9.6 |
|
Ghana, 1998-1999 |
84.1 |
88.0 |
90.3 |
11.7 |
22.5 |
21.3 |
|
Guatemala, 1998-1999 |
86.3 |
86.7 |
85.3 |
14.8 |
18.8 |
16.0 |
|
Guinea, 1999 |
87.6 |
89.2 |
90.4 |
19.1 |
17.2 |
19.8 |
|
Haiti, 2000 |
85.1 |
91.6 |
89.2 |
11.2 |
11.7 |
13.5 |
|
India, 1998-2000 |
96.1 |
96.3 |
96.6 |
20.3 |
17.9 |
15.5 |
|
Indonesia, 1997 |
99.0 |
97.3 |
96.9 |
8.5 |
7.7 |
7.4 |
|
Jordan, 1997 |
100.0 |
99.6 |
99.3 |
0.1 |
1.0 |
1.3 |
|
Kazakhstan, 1999 |
93.9 |
94.1 |
94.3 |
12.8 |
14.2 |
10.6 |
|
Kenya, 1998 |
58.5 |
66.8 |
74.2 |
18.7 |
19.6 |
19.5 |
|
Kyrgyz Republic, 1997 |
98.2 |
97.2 |
98.7 |
3.5 |
2.8 |
3.1 |
|
Madagascar, 1997 |
71.5 |
77.6 |
77.7 |
22.9 |
20.5 |
18.7 |
|
Malawi, 2000 |
85.7 |
86.5 |
93.2 |
14.2 |
13.1 |
14.1 |
|
Mali, 2001 |
84.4 |
88.2 |
90.8 |
13.2 |
13.9 |
14.7 |
|
Morocco, 1992 |
99.7 |
98.2 |
98.0 |
0.9 |
3.1 |
4.0 |
|
Mozambique, 1997 |
77.1 |
79.2 |
78.8 |
20.2 |
21.1 |
30.2 |
|
Namibia, 1992 |
26.2 |
42.0 |
49.8 |
16.7 |
18.2 |
11.4 |
|
Nepal, 2000-2001 |
99.0 |
98.9 |
98.9 |
3.1 |
2.9 |
3.9 |
|
Nicaragua, 2001 |
91.2 |
91.4 |
92.7 |
9.1 |
8.5 |
9.5 |
|
Niger, 1998 |
94.2 |
96.6 |
95.3 |
9.3 |
11.6 |
9.2 |
|
Nigeria, 1999 |
83.6 |
83.7 |
81.0 |
16.6 |
14.2 |
17.0 |
|
Pakistan, 1990-1991 |
100.0 |
100.0 |
100.0 |
3.0 |
1.6 |
3.0 |
|
Paraguay, 1990 |
73.8 |
80.8 |
81.5 |
15.0 |
11.5 |
10.3 |
|
Peru, 2000 |
71.9 |
77.7 |
78.6 |
21.0 |
19.9 |
20.0 |
|
Philippines, 1998 |
93.2 |
93.6 |
94.9 |
17.1 |
14.7 |
9.0 |
|
Rwanda, 2000 |
89.2 |
92.0 |
95.7 |
4.9 |
6.1 |
6.9 |
|
Senegal, 1997 |
77.8 |
86.4 |
91.6 |
14.8 |
13.2 |
13.2 |
|
South Africa, 1998 |
19.6 |
37.3 |
47.8 |
22.4 |
17.6 |
17.2 |
|
Tanzania, 1999 |
73.4 |
73.3 |
85.0 |
12.8 |
16.5 |
15.1 |
|
Togo, 1998 |
81.7 |
82.0 |
82.9 |
20.3 |
20.3 |
18.5 |
|
Turkey, 1998 |
99.2 |
97.5 |
96.2 |
4.1 |
5.8 |
4.8 |
|
Uganda, 2000-2001 |
79.3 |
74.5 |
80.5 |
13.3 |
14.0 |
13.6 |
|
Uzbekistan, 1996 |
98.5 |
97.3 |
97.3 |
1.4 |
2.0 |
3.7 |
|
Vietnam, 1997 |
99.4 |
98.2 |
98.3 |
5.6 |
3.8 |
3.6 |
|
Yemen, 1991-1992 |
98.4 |
98.6 |
99.0 |
10.7 |
7.8 |
8.5 |
|
Zambia, 2001-2002 |
71.0 |
76.2 |
81.9 |
16.9 |
13.4 |
11.4 |
|
Zimbabwe, 1999 |
76.5 |
79.1 |
78.3 |
20.2 |
19.2 |
17.5 |
APPENDIX TABLE 8-6 Trends in Median Length of First Birth Interval Among Women Having Their Birth After Marriage, DHS Countries
|
Country and Year of Survey |
Median Birth Interval |
||
|
20-24 |
30-34 |
40-44 |
|
|
Armenia, 2000 |
12 |
12 |
12 |
|
Bangladesh, 1999-2000 |
24 |
30 |
32 |
|
Benin, 2001 |
15 |
13 |
14 |
|
Bolivia, 1998 |
14 |
16 |
19 |
|
Brazil, 1996 |
16 |
19 |
17 |
|
Burkina Faso, 1998-1999 |
20 |
20 |
22 |
|
Cameroon, 1998 |
23 |
30 |
36 |
|
Central African Republic, 1994-1995 |
20 |
20 |
20 |
|
Chad, 1996-1997 |
20 |
22 |
21 |
|
Colombia, 2000 |
14 |
17 |
16 |
|
Comoros, 1996 |
17 |
21 |
22 |
|
Côte d’Ivoire, 1998-1999 |
20 |
25 |
25 |
|
Dominican Republic, 1996 |
17 |
17 |
18 |
|
Egypt, 2000 |
13 |
15 |
17 |
|
Ethiopia, 1999 |
24 |
25 |
26 |
|
Ghana, 1998-1999 |
21 |
18 |
17 |
|
Guatemala, 1998-1999 |
12 |
15 |
17 |
|
Guinea, 1999 |
17 |
21 |
21 |
|
Haiti, 2000 |
17 |
17 |
16 |
|
India, 1998-2000 |
20 |
20 |
23 |
|
Indonesia, 1997 |
16 |
17 |
20 |
|
Jordan, 1997 |
14 |
13 |
14 |
|
Kazakhstan, 1999 |
13 |
11 |
11 |
|
Kenya, 1998 |
15 |
20 |
19 |
|
Kyrgyz Republic, 1997 |
12 |
12 |
12 |
|
Madagascar, 1997 |
17 |
20 |
19 |
|
Malawi, 2000 |
14 |
15 |
15 |
|
Mali, 2001 |
21 |
21 |
23 |
|
Morocco, 1992 |
17 |
20 |
22 |
|
Mozambique, 1997 |
20 |
24 |
22 |
|
Namibia, 1992 |
21 |
30 |
30 |
|
Nepal, 2000-2001 |
23 |
27 |
34 |
|
Nicaragua, 2001 |
17 |
17 |
15 |
|
Niger, 1998 |
25 |
24 |
29 |
|
Country and Year of Survey |
Median Birth Interval |
||
|
20-24 |
30-34 |
40-44 |
|
|
Nigeria, 1999 |
22 |
23 |
26 |
|
Pakistan, 1990-1991 |
21 |
22 |
24 |
|
Paraguay, 1990 |
15 |
18 |
21 |
|
Peru, 2000 |
14 |
16 |
17 |
|
Philippines, 1998 |
12 |
13 |
13 |
|
Rwanda, 2000 |
13 |
14 |
15 |
|
Senegal, 1997 |
19 |
22 |
23 |
|
South Africa, 1998 |
20 |
47 |
57 |
|
Tanzania, 1999 |
16 |
16 |
14 |
|
Togo, 1998 |
17 |
18 |
17 |
|
Turkey, 1998 |
16 |
15 |
18 |
|
Uganda, 2000-2001 |
16 |
20 |
21 |
|
Uzbekistan, 1996 |
15 |
14 |
14 |
|
Vietnam, 1997 |
14 |
15 |
18 |
|
Yemen, 1991-1992 |
25 |
33 |
56 |
|
Zambia, 2001-2002 |
15 |
16 |
17 |
|
Zimbabwe, 1999 |
12 |
14 |
17 |
APPENDIX TABLE 8-7 Trends in Percentage of Women Having First Birth Before Marriage (by ages 18, 20, 25), DHS Countries
|
Country and Year of Survey |
Premarital Birth by Age 18 |
||
|
20-24 |
30-34 |
40-44 |
|
|
Armenia, 2000 |
0.2 |
0.1 |
0.1 |
|
Bangladesh, 1999-2000 |
0.3 |
1.5 |
1.4 |
|
Benin, 2001 |
2.9 |
4.8 |
3.5 |
|
Bolivia, 1998 |
5.8 |
4.5 |
3.9 |
|
Brazil, 1996 |
3.5 |
3.0 |
2.8 |
|
Burkina Faso, 1998-1999 |
6.4 |
6.8 |
8.2 |
|
Cameroon, 1998 |
10.5 |
10.0 |
10.5 |
|
Central African Republic, 1994-1995 |
5.7 |
4.2 |
2.3 |
|
Chad, 1996-1997 |
1.4 |
1.8 |
1.2 |
|
Colombia, 2000 |
6.3 |
3.1 |
2.9 |
|
Comoros, 1996 |
0.5 |
1.1 |
2.3 |
|
Côte d’Ivoire, 1998-1999 |
16.9 |
14.1 |
12.1 |
|
Dominican Republic, 1996 |
1.3 |
1.3 |
1.1 |
|
Egypt, 2000 |
0.0 |
0.0 |
0.2 |
|
Ethiopia, 1999 |
0.5 |
2.0 |
2.1 |
|
Ghana, 1998-1999 |
4.0 |
4.2 |
3.3 |
|
Guatemala, 1998-1999 |
3.9 |
2.9 |
6.9 |
|
Guinea, 1999 |
5.4 |
5.3 |
5.8 |
|
Haiti, 2000 |
2.7 |
1.6 |
3.5 |
|
India, 1998-2000 |
0.5 |
0.9 |
0.8 |
|
Indonesia, 1997 |
0.2 |
1.0 |
1.6 |
|
Jordan, 1997 |
0.0 |
0.1 |
0.2 |
|
Kazakhstan, 1999 |
0.8 |
0.2 |
0.3 |
|
Kenya, 1998 |
11.0 |
11.0 |
8.7 |
|
Kyrgyz Republic, 1997 |
0.4 |
0.3 |
0.1 |
|
Madagascar, 1997 |
9.7 |
8.6 |
9.5 |
|
Malawi, 2000 |
4.7 |
7.1 |
3.5 |
|
Mali, 2001 |
7.1 |
5.8 |
2.9 |
|
Morocco, 1992 |
0.1 |
0.4 |
0.7 |
|
Premarital Birth by Age 20 |
Premarital Birth by Age 25 |
|||
|
20-24 |
30-34 |
40-44 |
30-34 |
40-44 |
|
0.2 |
0.3 |
0.2 |
1.3 |
0.9 |
|
0.3 |
1.6 |
1.6 |
1.6 |
1.6 |
|
5.0 |
6.3 |
6.5 |
9.1 |
9.7 |
|
10.8 |
8.9 |
8.3 |
15.6 |
15.2 |
|
7.2 |
5.5 |
4.9 |
9.0 |
8.0 |
|
7.9 |
8.5 |
9.5 |
10.0 |
10.8 |
|
17.0 |
16.8 |
15.6 |
21.3 |
18.6 |
|
10.3 |
5.9 |
3.0 |
8.8 |
5.0 |
|
2.4 |
2.1 |
1.2 |
2.6 |
1.7 |
|
10.8 |
7.2 |
6.8 |
14.2 |
12.6 |
|
1.0 |
1.1 |
3.3 |
1.7 |
3.3 |
|
24.2 |
17.6 |
19.4 |
27.0 |
22.9 |
|
2.2 |
2.0 |
2.2 |
2.8 |
3.6 |
|
0.0 |
0.0 |
0.3 |
0.0 |
0.3 |
|
0.9 |
2.4 |
2.2 |
2.6 |
2.3 |
|
6.2 |
6.2 |
4.6 |
8.5 |
6.9 |
|
5.3 |
5.8 |
9.4 |
10.6 |
13.0 |
|
6.7 |
6.2 |
7.1 |
8.4 |
8.4 |
|
4.8 |
3.4 |
5.2 |
5.3 |
8.2 |
|
0.6 |
1.0 |
0.9 |
1.2 |
1.1 |
|
0.2 |
1.5 |
2.0 |
2.0 |
2.2 |
|
0.0 |
0.2 |
0.5 |
0.3 |
0.5 |
|
1.7 |
1.0 |
2.1 |
3.5 |
4.4 |
|
20.0 |
19.1 |
14.9 |
28.3 |
20.8 |
|
0.8 |
0.3 |
0.1 |
1.6 |
0.8 |
|
15.5 |
13.0 |
13.5 |
17.3 |
16.7 |
|
8.4 |
9.1 |
4.6 |
11.7 |
5.5 |
|
8.8 |
7.5 |
4.3 |
9.3 |
5.7 |
|
0.1 |
0.5 |
1.2 |
0.8 |
1.3 |
|
Country and Year of Survey |
Premarital Birth by Age 18 |
||
|
20-24 |
30-34 |
40-44 |
|
|
Mozambique, 1997 |
9.0 |
6.2 |
9.1 |
|
Namibia, 1992 |
12.6 |
14.3 |
12.1 |
|
Nepal, 2000-2001 |
0.2 |
0.3 |
0.1 |
|
Nicaragua, 2001 |
2.8 |
3.9 |
2.5 |
|
Niger, 1998 |
1.8 |
1.6 |
2.0 |
|
Nigeria, 1999 |
4.5 |
7.7 |
10.7 |
|
Pakistan, 1990-1991 |
0.0 |
0.0 |
0.0 |
|
Paraguay, 1990 |
4.8 |
5.6 |
4.3 |
|
Peru, 2000 |
3.7 |
4.4 |
3.9 |
|
Philippines, 1998 |
0.6 |
0.5 |
0.7 |
|
Rwanda, 2000 |
1.6 |
1.5 |
0.6 |
|
Senegal, 1997 |
5.1 |
3.5 |
2.0 |
|
South Africa, 1998 |
17.3 |
18.4 |
12.7 |
|
Tanzania, 1999 |
7.0 |
9.0 |
7.2 |
|
Togo, 1998 |
3.2 |
6.1 |
5.8 |
|
Turkey, 1998 |
0.1 |
1.0 |
1.4 |
|
Uganda, 2000-2001 |
9.4 |
12.2 |
9.6 |
|
Uzbekistan, 1996 |
0.1 |
0.4 |
0.0 |
|
Vietnam, 1997 |
0.2 |
0.4 |
0.2 |
|
Yemen, 1991-1992 |
0.0 |
0.0 |
0.0 |
|
Zambia, 2001-2002 |
10.7 |
10.8 |
9.8 |
|
Zimbabwe, 1999 |
5.8 |
8.1 |
7.1 |
|
Premarital Birth by Age 20 |
Premarital Birth by Age 25 |
|||
|
20-24 |
30-34 |
40-44 |
30-34 |
40-44 |
|
13.5 |
11.9 |
12.2 |
15.7 |
13.9 |
|
30.4 |
30.0 |
22.7 |
46.4 |
41.1 |
|
0.2 |
0.4 |
0.2 |
0.6 |
0.4 |
|
3.7 |
5.5 |
3.5 |
6.8 |
5.2 |
|
2.9 |
1.9 |
2.1 |
2.2 |
2.2 |
|
5.8 |
9.3 |
13.2 |
10.9 |
15.0 |
|
0.0 |
0.0 |
0.0 |
0.0 |
0.0 |
|
10.5 |
8.8 |
7.8 |
14.4 |
13.5 |
|
7.8 |
8.4 |
8.7 |
14.4 |
14.7 |
|
1.5 |
1.6 |
1.5 |
3.4 |
2.9 |
|
3.8 |
2.5 |
1.0 |
6.3 |
2.6 |
|
8.6 |
6.5 |
3.6 |
9.9 |
5.4 |
|
32.5 |
33.7 |
24.6 |
51.7 |
43.1 |
|
15.7 |
15.7 |
9.5 |
20.0 |
11.3 |
|
5.7 |
9.1 |
8.7 |
12.8 |
12.5 |
|
0.1 |
1.6 |
1.7 |
2.0 |
2.6 |
|
13.6 |
17.5 |
13.5 |
22.3 |
15.8 |
|
0.4 |
1.0 |
0.5 |
2.3 |
2.6 |
|
0.2 |
0.5 |
0.6 |
1.3 |
1.4 |
|
0.0 |
0.0 |
0.0 |
0.0 |
0.0 |
|
17.8 |
15.4 |
13.7 |
20.5 |
16.6 |
|
11.7 |
11.7 |
12.8 |
17.0 |
18.0 |


