4
Rethinking the Global Radiative Forcing Concept
The current global mean top-of-the-atmosphere (TOA) radiative forcing concept with adjusted stratospheric temperatures has both strengths and limitations. The concept has been used extensively in the climate research literature over the past decades and has also become a standard tool for policy analysis endorsed by the Intergovernmental Panel on Climate Change (IPCC). The concept should be retained as a standard metric in future climate research and policy. However, it also has significant limitations that have been revealed by recent research on forcing agents that are not conventionally considered and by regional studies. Also, it diagnoses only one measure of climate change (equilibrium response of global mean surface temperature). The committee believes that these limitations can be addressed through the introduction of additional forcing metrics. Table 4-1 gives a list of these metrics and summarizes their strengths and limitations. Detailed discussion of each is presented below.
THE CURRENT CONCEPT
Global-annual mean adjusted radiative forcing at the top of the atmosphere is, in general, a reliable metric relating the effects of various climate perturbations to global mean surface temperature change as computed in general circulation models (GCMs). The associated climate sensitivity parameter λ varies by only about 25 percent within a particular GCM1 for a
TABLE 4-1 Metrics for Climate Forcing
|
Climate Forcing Metric |
Strengths |
Limitations |
|
IPCC TAR adjusted tropopause or TOA global average radiative forcing with adjustment of stratospheric temperatures |
|
|
|
Radiative forcing calculated with fixed sea surface temperature (SST; Hansen et al., 2002) or fixed surface temperatures (Shine et al., 2003) and adjusted atmospheric temperatures (in both troposphere and stratosphere) |
|
|
|
Global mean radiative forcing at the surface |
|
|
wide range of changes in well-mixed greenhouse gases, solar irradiance, surface albedo, and nonabsorbing aerosols (IPCC, 2001). By assuming a constant climate sensitivity parameter, forcing can be translated directly into a temperature response. Because calculating radiative forcing is straightforward, many factors that may influence radiative forcing can be investigated in climate models, simpler versions of those models, and chemical transport models. For example, the effects of different estimates of past forcings can be compared to each other. Likewise, comparisons can be made of multiple possible future forcing scenarios. Furthermore, the radia-
tive forcing concept facilitates comparison of forcing calculations between climate models and with benchmark line-by-line radiative transfer calculations.
Radiative forcing is thus one of the more highly quantified methods of determining how the climate system is forced. In addition, observational records are available for surface temperature (space-based monitoring, in situ monitoring, and proxy data) and the radiation balance at the top of the atmosphere. These data provide an important observational constraint on estimates of radiative forcing and temperature response. Furthermore, numerous model and observation-based estimates of radiative forcing have been reported in the scientific literature over the past decades, providing an important historical reference for future calculations.
The radiative forcing concept has also been used effectively in policy applications. The concept is already entrained in the policy dialogue, particularly through the emphasis given it in the IPCC reports. Policy analysts have input radiative forcing into simple climate models, which are used to examine a wide range of scenarios of past, present, and future climate. Comparison between these simple models and the more complex fully coupled models also helps in interpreting causal mechanisms in the fully coupled models (e.g., Murphy, 1995; Raper et al., 2001).
Although the traditional TOA radiative forcing concept remains very useful, it is limited in several ways. It is inadequate to describe fully the radiative effects of several anthropogenic influences including
-
absorbing aerosols, which lead to a positive radiative forcing of the troposphere with little net radiative effect at the top of the atmosphere;
-
effects of aerosols on cloud properties (including cloud fraction, cloud microphysical parameters, and precipitation efficiency), which may modify the hydrological cycle without significant radiative impacts;
-
perturbations of ozone in the upper troposphere and lower stratosphere, which challenge the manner in which the stratospheric temperature adjustment is done; and
-
surface modification due to deforestation, urbanization, and agricultural practices and surface biogeochemical effects.
Land surface modification of heat fluxes and aerosol-induced changes to the precipitation efficiency modify not only the radiative fluxes but also the dynamical (turbulent heat flux) and thermodynamical fluxes (evaporation). These modifications to the climate system fall under the broader umbrella of climate forcings, which include radiative and nonradiative fluxes. Broadening the concept of radiative forcing in this way allows consideration of climate variables that may have more direct societal impacts, such as changes in precipitation. Indeed, the traditional radiative forcing
concept is inappropriate to predict the sign or the magnitude of the global mean precipitation changes due to both scattering and absorbing aerosols, which affect precipitation differently in summer and winter.
Another limitation of the traditional radiative forcing concept is that it does not adequately characterize the regional response. Regional radiative forcings from atmospheric aerosols, tropospheric ozone, or land-use and land-cover changes can be much larger than global mean values. A regionally concentrated forcing may lead to climate responses in the region, in another region via teleconnections, or globally—or may even have no climate response.
Yet another limitation of the concept is that the assumption of a constant, linear relationship between changes in global mean surface temperature and global mean TOA radiative forcing does not always hold. This linear relationship breaks down for absorbing aerosols, which may have small TOA forcing, but disproportionately larger surface forcing due to absorption of solar radiation (Lohmann and Feichter, 2001; Ramanathan et al., 2001a). This motivated the introduction of the concept of efficacies of different forcing agents (Joshi et al., 2003; Hansen and Nazarenko, 2004). “Efficacy” is defined as the ratio of the climate sensitivity parameter λi for a given forcing agent to λ for a doubling of carbon dioxide (CO2) ![]() . The efficacy E is then used to define an effective forcing fe = f E. Table 4-2 summarizes the forcings, responses, efficacies, and effective forcings of different forcing agents from several models. Efficacies greater than 1, such as for black carbon impacts on snow and ice albedo, correspond to a larger effective forcing than that of 2 × CO2 (Table 4-2). On the other hand, scattering sulfate aerosols are less efficient than greenhouse gases in changing the surface temperature for a given forcing.
. The efficacy E is then used to define an effective forcing fe = f E. Table 4-2 summarizes the forcings, responses, efficacies, and effective forcings of different forcing agents from several models. Efficacies greater than 1, such as for black carbon impacts on snow and ice albedo, correspond to a larger effective forcing than that of 2 × CO2 (Table 4-2). On the other hand, scattering sulfate aerosols are less efficient than greenhouse gases in changing the surface temperature for a given forcing.
Overall, after weighing the strengths and limitations of the traditional radiative forcing concept, the committee finds that its strengths warrant continued use in scientific investigations, climate change assessments, and policy applications. The concept is relatively easy to use, particularly in enabling efficient comparisons between different forcing agents, forcing scenarios, and climate models. Further, it has clear applications within the climate policy community. Nonetheless, the limitations call for broadening the concept to account for nonradiative forcing, spatial and temporal heterogeneity of forcing, and nonlinearities. This chapter presents specific approaches to address these limitations.
GLOBAL MEAN RADIATIVE FORCING WITH ADJUSTED TROPOSPHERIC TEMPERATURES
Hansen et al. (2002) introduced the concept of fixed sea surface tem-
TABLE 4-2 Efficacies and Effective Forcing Calculated for a Variety of Forcings in Several Climate Models
|
Experiment |
Forcing at the Tropopause f (W m-2) |
Equilibrium Response at the Surface ΔT (K) |
Efficacy E |
Effective Forcing fe (W m-2) |
Reference |
|
CO2 (based on three GCMs) |
1 |
0.38-1.12 |
1 |
0.38-1.12 |
Joshi et al. (2003) |
|
Changes in snow and ice albedo due to black carbon (two scenarios) |
0.16-0.17 |
0.2-0.24 |
1.97-2.22 |
0.32-0.38 |
Hansen and Nazarenko (2004) |
|
Solar increase based on three GCMs |
1 |
0.31-1.07 |
0.82-1.01 |
0.82-1.01 |
Joshi et al. (2003) |
|
Solar increase |
4.2-3.7 |
2.1-2.85 |
0.52-0.8 |
2.2-3.0 |
Gregory et al. (2004) |
|
Tropospheric ozone |
1 |
0.24-0.94 |
0.71-0.88 |
0.71-0.88 |
Joshi et al. (2003) |
|
Tropospheric ozone |
0.49 |
0.28 |
0.73 |
0.49 |
Mickley et al. (2004) |
|
Sulfate aerosols, direct effect |
−0.34 |
−0.24 |
0.83 |
−0.28 |
E. Roeckner (personal communication, May 2004) |
|
Sulfate aerosols, first indirect effect |
−0.89 |
−0.78 |
1.01 |
−0.90 |
E. Roeckner (personal communication, May 2004) |
|
Well-mixed greenhouse gases from 1860 to 1990 |
2.12 |
1.82 |
1 |
2.12 |
Feichter et al. (2004) |
|
All aerosol effects (direct and indirect on water clouds) |
−1.4 |
−0.87 |
0.72 |
−1.01 |
Feichter et al. (2004), Lohmann and Feichter (2001) |
|
Greenhouse gases + direct sulfate aerosol forcing (1900-present) based on four GCMs |
— |
0.5-0.7 |
0.56-0.75 |
— |
Boer et al. (2000) |
|
All aerosol effects and greenhouse gases |
0.7 |
0.57 |
0.94 |
0.66 |
Feichter et al. (2004), Lohmann and Feichter (2001) |
perature (SST) forcing, which is the change in TOA radiative forcing computed in a global model with fixed sea surface temperatures but letting land and atmospheric temperatures relax to the new equilibrium. This relaxation is relatively rapid (on the order of years); hence the calculation in a GCM is computationally expedient. One resolves in this manner the short-term components of the climate response, such as hydrological perturbations associated with changes in lapse rate. Of particular interest, this approach allows calculation of a meaningful radiative forcing from the indirect or semidirect aerosol effects. Hansen et al. (2002) show that there is good agreement between the stratospheric adjusted radiative forcing and the fixed SST forcing for a range of climate forcing factors (e.g., 2 × CO2, stratospheric aerosols) and that for changes in ozone, more reasonable forcings result from the fixed SST simulations.
Shine et al. (2003) extended the fixed SST approach to what they call “adjusted troposphere and stratosphere forcing.” Shine et al. not only fix sea surface temperatures, but also fix land surface temperatures because temperatures over land and ocean are related. Therefore, it is more consistent to fix surface temperatures globally. Using a global climate model they show that the adjusted troposphere and stratosphere radiative forcing is consistent with the stratospheric adjusted forcing for more uniform forcings such as doubling CO2 and solar constant changes. They also show that for forcings due to absorbing aerosols, their newly defined forcing is more meaningful than the stratospheric adjusted forcing, in that the climate sensitivity parameter is largely independent of how the absorbing aerosols are vertically distributed, unlike the standard stratospheric adjusted approach.
These two studies are important contributions to the debate on radiative forcing, but the approach is subject to most of the limitations associated with the traditional radiative forcing calculation. Also, forcings calculated in this manner are not as easy to compute as conventional radiative forcings, nor are they as comparable among different GCMs because of differences in model dynamics and hydrology.
GLOBAL MEAN RADIATIVE FORCING AT THE SURFACE
The TOA radiative forcing might not be directly related to surface temperature if a forcing agent changes the vertical distribution of heating in the atmosphere. Well-known examples of such cases are the direct radiative forcing of black carbon (BC) and other absorbing aerosols and the changes in latent and sensible heat fluxes due to land-use modifications. For example, BC causes an increase in atmospheric heating, accompanied by a decrease in solar heating of the surface. For average cloudiness, Indian Ocean Experiment (INDOEX) data reveal that the TOA direct forcing when BC is present can be close to zero, while the surface forcing can be on
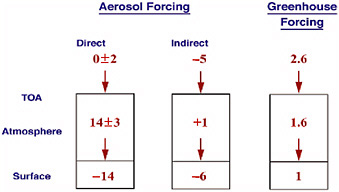
the order of −10 to −15 W m−2 and the atmospheric forcing on the order of +10 to +15 W m−2 (see Box 4-1). For such aerosols, the TOA forcing is an ineffective, if not erroneous, metric for the impact of aerosol forcing on the surface temperature.
One way to address this limitation of the traditional radiative forcing concept is to calculate the global mean radiative forcing at the surface along with that at the top of the atmosphere. Considering the surface radiative forcing may enable quantification of the effects of aerosols on the surface
energy balance. Together with the TOA radiative forcing, surface radiative forcing also may provide information about the extent to which forcings affect the atmospheric lapse rate, with implications for precipitation and mixing. The net radiative forcing of the atmosphere could be deduced from the difference between TOA and surface forcing. Like the other metrics discussed above, global mean radiative forcing at the surface would not allow characterization of the regional structure of forcing.
Reporting surface radiative forcing along with that at the TOA is im-
portant not just for absorbing aerosols but also for the gaseous species. Traditionally, the notion has been that it is enough to give the tropopause forcing for the well-mixed gases in order to obtain an estimate of the surface temperature response. However, to assess climate response beyond surface temperature change (e.g., changes in precipitation, latent heat release from surface, or in the surface heat and moisture balance), it becomes necessary to understand the surface radiative forcing for all forcings. Further, to understand the difference in the zonal-mean hydrologic response between different forcings, it is necessary to look at the surface terms (e.g., Chen and Ramaswamy, 1996).
REGIONAL RADIATIVE FORCING
Forcings with significant spatial variability can have regional magnitudes much greater than their global averages. Aerosols, and to a lesser extent tropospheric ozone, have shorter lifetimes than the well-mixed greenhouse gases, and therefore their concentrations are higher in source regions and downwind (e.g., Charlson et al., 1991; Kiehl and Briegleb, 1993; Mickley et al., 1999). Forcing due to land-use and land-cover changes also has significant spatial heterogeneity, leading to spatial variability in the associated climate response. The traditional global mean radiative forcing provides no information about this regional structure, so many researchers have begun to present estimates of radiative forcing on a regional scale as derived from models or observational campaigns.
A large number of modeling studies have been carried out to characterize the spatial variability in aerosol forcing due to direct, indirect, and semidirect effects (IPCC, 2001). Regional effects of aerosol forcing are large; regional mean values of anthropogenic aerosol radiative forcing can be factors of 5 to 10 higher than the global mean values of 0.5 to 1.5 W m−2 (IPCC, 2001). Comparisons with satellite radiation budget data can be used to constrain model results. For example, the calculations of Haywood et al. (1999) showed that the clear-sky outgoing flux at the TOA over oceans yields excellent agreement with Earth Radiation Budget Experiment (ERBE) observations when aerosol species are considered. This is a useful test of the chemical transport model (CTM)-derived concentrations of aerosols and assumptions about their sizes, at least in terms of their collective reflective ability. More recent computations from the National Center for Atmospheric Research and Geophysical Fluid Dynamics Laboratory models bear this out with updated CTM simulations. Soden and Ramaswamy (1998) inferred the existence of spatial aerosol effects in satellite datasets. Observations over source regions and downwind show very large forcings (see Box 4-1). High regional concentrations of scattering aerosols can completely offset the positive forcing due to increases in
greenhouse gases. This offset could even be significant on the global scale (e.g., Anderson et al., 2003a).
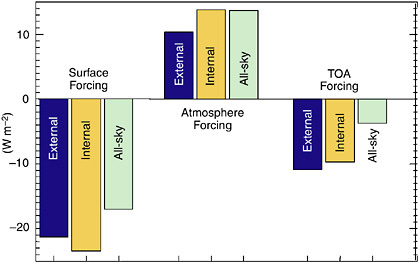
The degree of spatial heterogeneity can be seen by considering the aerosol optical depth for a number of aerosol species as shown by model results in Figure 4-1. The large optical depths off of the Sahara are due to mineral dust, while the large optical depths in South America and Africa are related to biomass burning. Large aerosol optical depths due to sulfur emissions occur in Northern Hemisphere industrial regions. These optical depths can be used in conjunction with assumptions about aerosol radiative properties to calculate the direct forcing. Results are shown in Figure 4-2 for TOA, surface, and atmospheric radiative forcings. Note the significant difference between the TOA forcing and the effect at the surface due to the absorptive properties of the aerosols. Regional forcing values at the surface can be as large as −20 to −30 W m−2.
The consequences of regional radiative forcing on the climate system for a region, for other regions, and globally must be better understood. Because global forcings can also have regionally specific responses, it is difficult to attribute regional climate changes to a particular regional or global forcing. A further complication is that regional diabatic heating results in nonlinear long-distance communication of convergence and divergence fields, often referred to as teleconnections. For example, Chase et al. (2000a) found that regional land-use change can cause significant climate effects in other regions through teleconnections, even with a near-zero change in global averaged radiative flux. Chen and Ramaswamy (1996) and Ramaswamy and Chen (1997) showed that significant responses in precipitation patterns can arise in the presence of a near-zero global change in radiative forcing. Regional radiative forcing may provide a better measure of regional climate response than global radiative forcing, but further work is needed to quantify the links of regional radiative forcing to regional and global climate response.
REGIONAL NONRADIATIVE FORCING
Some forcings affect the climate system in nonradiative ways, in particular by modifying the hydrological cycle or vegetation dynamics. These nonradiative forcings generally have radiative impacts, but describing them only in terms of this radiative impact does not convey fully their influence on climate variables of societal relevance. For example, aerosol-induced changes in precipitation may have a small net effect on TOA radiative forcing, but could have significant impacts on the amount of rainfall a region receives, with consequences for agriculture, flood control, and municipal water supply. Furthermore, quantifying nonradiative forcings in
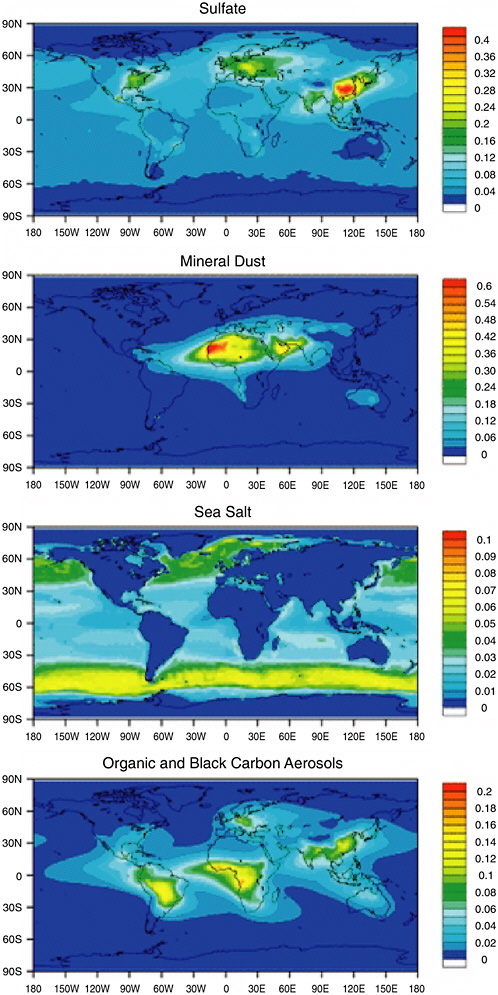
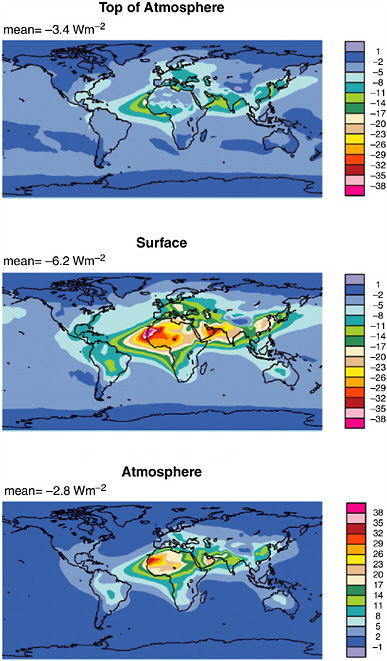
FIGURE 4-2 Annual mean simulated clear-sky radiative forcing in watts per square meter at the top of the atmosphere (net), surface (net), and in the atmosphere calculated from the aerosol optical depths shown in Figure 4.1. SOURCE: Adapted from Collins et al. (2002).
terms of their ultimate radiative effects (i.e., change in TOA or surface radiative fluxes) is not always straightforward.
Aerosols not only affect the radiative balance at the top of the atmosphere but also exert a forcing on the hydrological cycle (e.g., Ramanathan et al., 2001a). An increase in aerosols of similar hygroscopicity leads to an increase in cloud droplet number concentration that reduces the precipitation efficiency for warm clouds. Thus, these clouds will produce fewer drizzle-size drops (second indirect effect). On the other hand, if some of the anthropogenic aerosols act as ice nuclei, supercooled clouds could be converted into ice clouds by the glaciation indirect effect (Lohmann, 2002), resulting in more efficient precipitation formation. Smaller cloud droplets could also exhibit a thermodynamic forcing by protracting freezing in deep convective clouds. These clouds then glaciate in higher levels, which could result in either more or less vigorous precipitation formation depending on the background aerosol levels and atmospheric stability (Khain et al., 2004). Rosenfeld (2000) refers to these kinds of aerosol forcings as thermodynamic forcing because the spatial patterns of diabatic heating are changed.
Several nonradiative forcings involve the biological components of the climate system. They can be categorized into three types:
-
Biophysical forcing involves changes in the fluxes of trace gases and heat between vegetation, soils, and the atmosphere. For example, in the presence of increased CO2, plants open their stoma less and are therefore more water efficient (e.g., Sellers et al., 1997). Thus, increased CO2 impacts the hydrological cycle, in addition to its well-known direct radiative impacts.
-
Biogeochemical forcing involves changes in vegetation biomass and soils. For example, increased nitrogen deposition caused by greater anthropogenic emissions of ammonia (NH3), nitric oxide (NO), and nitrogen dioxide (NO2) is a biogeochemical forcing of the climate system (Holland et al., 2004). This deposition has altered the functioning of soil, terrestrial vegetation, and aquatic ecosystems worldwide. Galloway et al. (2004) document that human activities increasingly dominate the nitrogen budget at the global scale and that fixed forms of nitrogen are accumulating in most environmental reservoirs. In addition to impacts on ecosystem functioning, which are important in themselves, this forcing modifies physical components of the climate system, such as surface albedo and sensible and latent heat.
-
Biogeographic forcing involves alterations in plant species composition. Such changes can occur slowly in response to changes in the weather over time, or suddenly due to fires or other disturbances. For example, greater shrub growth in the high latitudes of the Northern Hemisphere has been observed (McFadden et al., 2001), which could alter the spatial distri-
-
bution of drifting snow and subsequent melt pattern and timing (Liston et $al., 2002).
These forcings are not yet well understood and are the subject of active research (Cox et al, 2000; Betts, 2001; Friedlingstein et al., 2001). They will likely be associated with multiple types of climate responses and are not expected to be additive to the traditionally defined forcings. Complex interactions among these forcings make it difficult to determine their net climate effects (Eastman et al., 2001b; Narisma et al., 2003; Raddatz, 2003). Eastman et al. (2001b), for example, found that with doubled CO2 the grasslands of the central United States were more water efficient on an individual stoma level (biophysical forcing), but grew more biomass (biogeochemical forcing). The net effect was cooler daytime temperatures during the growing season.
There are no widely accepted metrics for quantifying regional nonradiative forcing. Indeed, because nonradiative forcings affect multiple climate variables, there is no single metric that can be applied to characterize all nonradiative forcings (Marland et al., 2003; Kabat et al., 2004). Nonradiative forcings generally have significant regional variation, making it important that any new metrics be able to characterize the regional structure in forcing and climate response—whether the response occurs in the region, in a distant region through teleconnections, or globally. As is the case for regional radiative forcing, further work is needed to quantify links between regional nonradiative forcing and climate response. Another consideration in devising metrics for nonradiative forcings is enabling direct comparison with radiative forcings, computed in units of watts per square meter. However, not all nonradiative forcings are easily quantified in these units.
A metric that could prove useful for quantifying impacts on the hydrological cycle is changes in surface sensible and latent turbulent heat fluxes. For example, Pielke et al. (2002) proposed the surface regional climate change potential (RCCP), which is calculated by summing and weighting globally the absolute values of changes in the surface sensible and latent turbulent heat fluxes. In their study, land-use change from the natural to the current global landscape produced a global average RCCP of 0.7 W m−2 when teleconnection effects were not included, and 8.9-9.5 W m−2 when teleconnections were included. Such a scaling of the land surface forcing provides a metric that can be expressed in the same units as radiative forcing. Extending this concept to the global water cycle, Pielke and Chase (2003) quantified landscape forcing in terms of precipitation and moisture flux changes. They found globally averaged differences between the current and the natural landscape of 1.2 mm day−1 for precipitation and 0.6 mm day−1 for moisture flux. However, such metrics do not provide a
complete measure of the integrated effect on the climate system due to the regional concentration of changes in diabatic forcing. Others have considered using more comprehensive model output to quantify the impact of human disturbance to the climate system (Claussen et al., 2002).
OCEAN HEAT CONTENT
The ocean is the largest heat reservoir in the climate system (Levitus et al., 2000, 2001). Thus, the change in ocean heat storage with time can be used to calculate the net radiative imbalance of the Earth (Ellis et al., 1978; Piexoto and Oort, 1992). In essence, the ocean heat content provides a metric for the integral in time of the TOA radiative forcing. Furthermore, it offers a valuable constraint on the performance of climate models (Barnett et al., 2001). It is not yet standard practice to use ocean heat content observations, which are available for the past 50 years, to validate forced climate simulations. This is in part because there are several open research questions regarding the accuracy with which ocean heat content can be calculated and applied.
It is not clear, for example, that the observation systems have sufficient frequency and spatial coverage to accurately determine the radiative imbalance on an annual basis (on the order of 0.1 W m−2) so as to independently confirm the calculation of radiative imbalance from the changes in ocean heat storage. Another issue is whether the spatial and temporal sampling of the ocean heat content accurately captures the regions and depths at which heat changes are occurring. In particular there could be significant heat storage changes deeper in the ocean that are inadequately monitored by the existing ocean network.
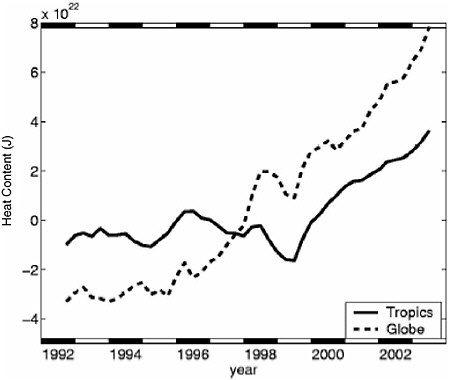
Several estimates of the trend in ocean heat content have been made using the ARGO network of ocean floats, satellite observations of ocean altimetry (Levitus et al., 2000, 2001; Willis et al., 2003), and climate models (Barnett et al., 2001; Crowley et al., 2003). Not all of these studies express the ocean heat content changes in terms of average radiative forcing, although it is straightforward to do so. Pielke (2003) found that for the period 1955-1995 the imbalance was about 0.3 W m−2, with half between the surface and 300 m, and the rest between 300 m and 3 km. He also found large temporal variations in the imbalance with a negative imbalance, for example, in the early 1980s. Willis et al. (2004) used satellite altimetric height combined with about 900,000 in situ ocean temperature profiles to produce global estimates of upper-ocean (upper 750 m) heat content on interannual timescales from mid-1993 to 2002 (see Figure 4-3). Willis et al. calculated a 0.86 ± 0.12 W m−2 warming rate averaged over this period, but with large interannual variability. As seen in Figure 4-3, the ocean warming occurred in the later years of the record with little change in globally averaged ocean heat content prior to 1997.