
4
CANCER
Cancer is a group of diseases characterized by uncontrolled growth and spread of abnormal cells (ACS 2003g; WHO 2003). Cancer can affect almost any tissue of the body. Known causes include external factors (such as chemicals, radiation, and infectious agents) and internal factors (such as mutations, hormones, and immune conditions). Such factors may act together or in sequence to initiate or promote carcinogenesis (ACS 2003g). In adults, a latent period of 10 years or more may elapse between exposure or mutation and the detection of cancer.
Cancer is the second-leading cause of death in the United States, exceeded only by heart disease. Among the member states of the World Health Organization (WHO), cancer is the third-leading cause of death, after heart disease and infectious or parasitic diseases (WHO 2003). In the United States in 2000, lung cancer was the leading cause of cancer deaths among both men and women, followed by prostatic cancer in men and breast cancer in women (Jemal et al. 2003). Each year, cancer leads to 12% of deaths worldwide, equivalent to about 6 million deaths (WHO 2003). Among men, lung and stomach cancers are the most common worldwide; among women, breast and cervical cancers are the most common (WHO 2003).
This chapter summarizes the results of epidemiologic studies of cancer outcomes related to exposure to fuels and combustion products. The committee considered the findings of those investigations as a means of determining what types of cancers Gulf War veterans might be at increased risk for as a consequence of exposure to fuels in the course of using military equipment, to tent heater fumes, and to smoke from oil-well fires. Because only a dozen years have passed since the Gulf War, studies of the Gulf War veterans themselves for cancer outcomes, which are characterized by considerable latent periods, would not yet be expected to be informative. Chapter 3 presented a general introduction on fuels and combustion products and a summary of toxicologic information on them. Appendix D contains tables that describe studies of populations exposed to relevant agents; many of the studies are referred to repeatedly in this chapter because their findings are related to several cancers of the specific anatomic sites and tissues reviewed.
In this chapter, the section on each type of cancer contains pertinent findings from cohort studies and then from case-control studies, first for fuels and then for combustion products, followed by the committee’s conclusions regarding the relationship between cancer of the specific type and exposure to fuels or combustion products. The tables included at the end of this chapter contain results from the primary studies on which the committee bases its conclusions.
Those tables are presented in reverse chronological order by each type of study design. The committee reviewed over 500 epidemiologic studies on cancer related to exposure to fuels and combustion products and selected studies that met its inclusion criteria for more thorough evaluation. Briefly, the studies had to appear in peer-reviewed publications, identify exposure relevant to the committee’s charge, and identify a specific health outcome (for example, the study must specify a type of cancer as opposed to considering all cancers together). Chapter 2 discusses the committee’s inclusion criteria in more detail.
This chapter reviews epidemiologic studies of cancer in adults, which would be pertinent to the occurrence of cancer in Gulf War veterans themselves; studies of childhood cancer are reviewed in Chapter 7, on reproductive and developmental effects, because the committee was concerned with such outcomes in the offspring of Gulf War veterans as a possible result of parental exposure. Epidemiologic studies assessing gender-specific cancers (for example, female breast cancer and prostate cancer) are included in the committee’s review. Seven percent of the 697,000 US military personnel sent to the Persian Gulf were women.
For the combustion products of crude oil and petroleum-derived fuels, the epidemiologic data complement the vast amount of toxicologic information on poly cyclic aromatic hydrocarbons (PAHs) (particularly benzo[a]pyrene), other combustion products, and soot. There are numerous studies of occupational cohorts heavily exposed to PAHs (for example, from coal tar and asphalt), usually in combination with other products of combusted petroleum-derived fuels (for example, exhausts from various sources and metals) and soot. The conclusions from that large, complex body of information have been addressed by several expert bodies, including the International Agency for Research on Cancer (IARC 1985), which (IARC 1984a, 1984b) have been virtually unanimous in judging that PAHs and soot are most probably human carcinogens, particularly for skin after dermal exposure.
Urban firefighter studies were not included in the committee’s review. The committee agreed that urban fire fighters are likely exposed to a number of compounds that are not found in combustion products produced from oil-well fires, tent heaters, and vehicles (for example, plastics, asbestos, and PCBs). It would not be possible for the committee to distinguish between health effects in urban firefighters attributable to those compounds versus combustion products as were experienced in the Gulf War. Therefore, the committee made a decision not to include urban firefighter studies in this report.
Cancer sites or types are addressed in this chapter largely according to the ninth revision of the International Classification of Disease (ICD-9).1 That approach is taken in an effort to organize the multitude of site-specific evidence presented in the chapter. In many cases, the findings by various investigators do not follow the strict categorization of the ICD-9.
CANCERS OF THE ORAL CAVITY AND OROPHARYNX
The cancers reviewed in this section include those of the oral cavity, that is, the lips, the lining of the lips and cheeks, the teeth, the gums, the tongue, the floor and roof of the mouth, and the area behind the wisdom teeth) (ICD-9 140–145); and the oropharynx and hypopharynx, the parts of the throat just behind the mouth (ICD-9 146 and 148, respectively). With cancers of the
nasopharynx (ICD-9 147) and of the nasal cavity and paranasal sinuses (ICD-9 160)—the next section is on cancers of the nasal cavity and nasopharynx—these cancers were formerly denoted “head and neck cancers”. Recently, some cancer epidemiologists (for example, Berrino et al. 2003; Boffetta et al. 2003) have chosen to consider the hypopharynx with the larynx (ICD-9 161), which it is next to, when assessing risks at that site associated with occupational exposure. In discussing the epidemiologic literature on cancer of the oral, nasal, and upper respiratory tissues, the committee has decided to specify exactly which sites individual researchers were reporting on. The committee has opted to draw conclusions related to the separate tissues that would be exposed during inhalation: along the oral pathway, along the nasal pathway, and their juncture near the larynx.
As for all head and neck cancers, the most important risk factor for cancers of the oral cavity and oropharynx is tobacco use, particularly cigarette-smoking (ACS 2003b, 2003c, 2003d). Additional risk factors for this site are alcohol consumption, vitamin A deficiency, exposure to ultraviolet radiation (sunlight), and increasing age. Some genetic factors, a weakened immune system, chronic irritation, and infection with human papillomavirus also may contribute to the occurrence of oral cancers.
In 2000, there were 10.6 new cases of cancer of the oral cavity and oropharynx per 100,000 people (15.9 among men and 6.2 among women) and 2.7 deaths per 100,000 (4.1 among men and 1.6 among women) in the United States (Ries et al. 2004).
Fuels
Table 4.1 presents the most relevant findings reviewed by the committee in drawing its conclusion on the possibility of an association between exposure to fuels and cancers of the oral cavity and oropharynx.
Cohort Studies
With the assistance of industrial hygienists and others familiar with a uranium-processing facility in Fernald, Ohio, Ritz (1999) conducted a secondary exposure assessment by using available data on the exposure of 4,128 male workers to kerosene (and to cutting fluids and trichloroethylene). The potential confounding effects of smoking were assessed by examining whether smoking habits were related to chemical exposure in a subset of 20% of the workers on whom smoking information was available in recent personnel files. There was no clear pattern of smoking behavior and exposure, so differences in smoking habits among exposure groups probably did not explain study results. Compared with the US population, the risk of death from oropharyngeal cancers (ICD-8 140–149) in the entire cohort was not notably increased (standardized mortality ratio [SMR] 1.05, 95% confidence interval [CI] 0.48–1.99). Among workers exposed to kerosene, the risks of oropharyngeal cancers derived with conditional logistic regression adjusted for pay status, time of hire, and cumulative radiation dose increased with exposure, but were imprecise (low kerosene exposure relative risk [RR] 1.85, 95% CI 0.37–9.36; moderate kerosene exposure RR 2.87, 95% CI 0.43–19.2; no workers had been categorized with heavy kerosene exposure).
Lagorio et al. (1994) tracked the mortality experience of 2,308 men through 1992; the men had been managers of Italian service stations in 1980. The effort complemented a detailed assessment of exposure at service stations in which 111 attendants were monitored in 1992 (Lagorio et al. 1993). Observation of only a single death from oropharyngeal cancer (ICD-9 140–
149) (SMR 0.38, 90% CI 0.02–1.79) during the follow-up period rendered this study uninformative.
Jarvholm et al. (1997) investigated cancer morbidity in a cohort of 4,128 male Swedish workers found by reviewing personnel files of 26 different refineries, distribution companies, lubrication-oil manufacturing industries, tank-cleaning companies, and companies that handled fuel. Exposure was determined from job titles combined with a retrospective review of air monitoring of work areas and personal exposure. The cohort was linked to the Swedish cancer and mortality registers. When the full array of oropharyngeal cancers were grouped (ICD-9 140–149), only six cases were identified in the cohort, so the somewhat increased risk estimates could not be distinguished from no effect, even for the subgroup of distribution workers with long duration and latency (standardized incidence ratio [SIR] 2.5, 95% CI 0.44–7.9).
Case-Control Studies
Zheng et al. (1996) conducted a case-control study to investigate the risk of salivary gland cancer (ICD-9 142) among residents of urban Shanghai. Cases were ascertained from 1988 and 1990. A total of 44 cases and 414 controls (frequency matched by sex and age) were interviewed to determine use of specific cooking fuels. Self-reported use of kerosene was associated with the risk of salivary gland cancer in models adjusted for sex, age, and income (odds ratio [OR] 3.5, 95% CI 1.6–7.4). Similar associations were found in multivariate models that included other possible risk factors but were not adjusted for smoking, which had not been found to be associated with salivary gland cancer.
A large population-based case-control study relying on several cancer registries was conducted in New Jersey, Los Angeles, Atlanta, and Santa Clara and San Mateo Counties, California, in January 1984–April 1985 (Huebner et al. 1992). Data were obtained on 1,114 cases (762 men and 352 women) of histologically confirmed primary oral and pharyngeal cancers (ICD-9 141, 143–146, 148, 149) diagnosed in January 1984–April 1985. The results for men working in selected industries were imprecise with some suggestion of an increased risk in petroleum-industry workers (OR 1.79, 95% CI 0.75–4.25). Employment history was obtained through interviews, and exposure was determined by job category. Smoking did not have an effect on the results.
Combustion Products
Table 4.2 presents the most relevant findings reviewed by the committee in drawing its conclusion on the possibility of an association between exposure to combustion products and cancers of the oral cavity and oropharynx.
Case-Control Studies
Gustavsson et al. (1998) identified incident cancers of the oral cavity (ICD-9 141, 143–145) or of the oropharynx or hypopharynx (ICD-9 146, 148) diagnosed in Sweden in 1988–1991. A total of 545 cases in men were identified by monitoring weekly medical reports and verified with the regional cancer registry; 641 controls were matched to the cases by region and age. Each case and control was interviewed by a trained interviewer according to a standardized protocol. Work histories were reviewed by industrial hygienists blinded to case status to estimate occupational exposure to 17 agents, including PAHs in a job-exposure matrix (JEM) approach. After adjustment for region, age, alcohol consumption, and smoking, high PAH exposure was
associated with both cancer at all sites (RR 1.48, 95% CI 1.09–2.01) and pharyngeal cancer (RR 1.52, 95% CI 0.94–2.45). No dose-response relationship, however, was evident in the case of PAH exposure.
Pintos et al. (1998) conducted a study in Sao Paulo, Curitiba, and Loiania, Brazil, to examine the risk of oral cancer (ICD-9 140–145) or pharyngeal cancer (ICD-9 146–149) in relation to the use of wood stoves. The researchers identified 784 incident cases of cancer of the pharynx and mouth from local hospitals and selected two controls for each case from among other hospital inpatients (patients with other cancers or mental disorders were excluded), matching them to cases on age, sex, and trimester of hospital admission. Exposure to products of wood stoves was ascertained with a single yes-no question. After adjustment for lifetime cumulative tobacco use (pack-years), alcohol consumption (kilograms of ethanol), sociodemographic variables, diet, and history of employment in specific industries, the reported use of wood stoves was associated with an increased risk of cancer of the mouth (OR 2.73, 95% CI 1.76–4.24) and pharynx (OR 3.82, 95% CI 1.96–7.42).
The Shanghai case-control study of salivary gland cancer (ICD-9 142) (Zheng et al. 1996) found self-reported use of kerosene for cooking was associated with risk of salivary gland cancer in models adjusted for sex, age, and income (OR 3.5, 95% CI 1.6–7.4). The increases in risk associated with use of coal, gas, and wood for cooking were not as precise.
Dietz et al. (1995) identified incident cancers of the oral cavity (ICD-9 141–145), oropharynx (ICD-9 146), or hypopharynx (ICD-9 148) in Heidelberg, Germany, and evaluated the effects of using fossil-fuel stoves for heating and cooking. Cases were ascertained in 1989–1992 from all patients seeking treatment at the Otorhinolaryngology Department at the University of Heidelberg within 3 years after first diagnosis. They identified 100 and 105 cases of oral cavity and pharyngeal cancer, respectively. Controls were recruited from the same medical center and general outpatient department and matched to cases on sex, age, and size of place of residence. All subjects were interviewed to ascertain risk-factor information, including alcohol consumption (grams/day), smoking (tobacco-years), and use of fossil-fuel stoves and cookers (coal, briquette, coke, peat, gas, and oil). After adjustment for tobacco and alcohol, use of fossil-fuel single stove heating units for more than 40 years vs 0–20 years was associated with pharyngeal cancer (OR 3.3, 95% CI 1.43–7.55). Fossil-fuel stove use for cooking in kitchen units also increased risk (OR 2.5, 95% CI 1.03–6.30) for more than 40 years of stove use (compared with 0–20 years). The OR for oral cavity cancer (ICD-9 141–145), adjusted for tobacco and alcohol, was 2.4 (95% CI 1.26–4.40) for more than 40 years (compared with 0–20 years) of exposure to fossil-fuel heating units. For exposure to kitchen cooking units, the OR for oral cavity cancer, adjusted for tobacco and alcohol, was 1.6 (95% CI 0.90–2.97) for more than 40 years of stove use (compared with 0–20 years).
Pukkala (1994) examined cancer incidence in Finland in 1971–1985 in 2,369 men and 809 women employed in various occupations. Occupation was ascertained by linking cancer-registry data with occupational and social-class data from the 1970 Finnish Population Census. SIRs were calculated from sex, age, site, and calendar-year-specific rates in the general Finnish population and were adjusted for social class. Risks of various cancers among men employed in transport and communications (lip cancer SIR 0.91, 95% CI 0.73–1.12; tongue cancer SIR 1.17, 95% CI 0.74–1.76; oral cavity cancer SIR 1.17, 95% CI 0.71–1.81; pharyngeal cancer SIR 0.97, 95% CI 0.66–1.39) were not found to be increased; there was a small increase in motor vehicle drivers (tongue cancer SIR 1.56, 95% CI 0.94–2.44), but the 95% CI contained the null.
In the study by Huebner et al. (1992) of fuel exposures described above, the relationship between job categories potentially involving exposure to combustion products and primary cancers of the oral cavity and pharyngeal region were also assessed. The effect estimates derived for boiler or furnace and heavy-equipment operators (OR 1.50, 95% CI 0.68–3.34), heavy-equipment operators only (OR 1.25, 95% CI 0.78–2.01), motor-vehicle operators (OR 1.01, 95% CI 0.75–1.35), railroad transport workers (OR 1.00, 95% CI 0.30–3.35), mechanics or repairers (OR 0.86, 95% CI 0.66–1.12), and firefighters (OR 0.65, 95% CI 0.23–1.85) were imprecise and suggested no increases for these jobs. Similarly, the results for men working in selected industries were imprecise; no increased risk was observed for transportation workers (OR 1.07, 95% 0.74–1.56) and trucking or warehousing workers (OR 0.86, 95% CI 0.56–1.31). Among women, point estimates exceeded 1 for oral or pharyngeal cancer in association with employment as a motor-vehicle operator, but results were imprecise because of the small numbers (OR for motor-vehicle operator 2.80, 95% CI 0.61–12.9).
Incident oral and pharyngeal cancer was assessed in Shanghai, China (Zheng et al. 1992). A total of 204 cases 20–75 years old were ascertained in 1988–1990 and matched to 414 controls on age and sex. Exposure to potential risk factors was ascertained by interview. The prevalence of men using kerosene stoves among cases was reported to be 27.0% compared with 14.1% of controls (p≤0.01), but no difference was reported for women.
Merletti et al. (1991) conducted a population-based case-control study in Turin, Italy. From July 1982 to December 1984, 103 incident male cases of oral cavity or oropharyngeal cancer were identified. The questionnaire included a detailed occupational history. That information was reviewed by industrial hygienists and physicians experienced in occupational medicine, who determined the probability and intensity of exposure to 16 agents, including PAHs. After adjustment for age, education, geographic region of birth, tobacco-smoking, and alcohol consumption, probable or definite exposure to PAHs was not associated with cancer risk (OR 0.6; study authors stated that confidence interval included 1).
Patient records were abstracted for a case-control study at the Roswell Park Memorial Institute in Buffalo, New York (Decoufle and Stanislawczyk 1977; Viadana et al. 1976). All persons referred to the Institute in 1956–1965 were asked to report their lifetime occupational history and job activities. Their risk of cancer of the buccal cavity and pharynx was compared with that of noncancer controls according to jobs they had ever held or had held for 5 years or more. Data were analyzed and stratified by age at diagnosis (with the cut point at 60 years), and the results were adjusted for smoking. Compared with the risk in clerical workers, no increased risk of cancer of the buccal cavity and pharynx was reported for bus, taxicab, and truck drivers; deliverymen and routemen; locomotive engineers and firemen; mechanics and repairmen; or mine operatives and laborers.
Conclusion
The three cohort mortality studies that assessed the relationship between cancer of the oral cavity and oropharynx and fuels (Jarvholm et al. 1997; Lagorio et al. 1994; Ritz 1999) had limited statistical power and therefore were mostly uninformative. The case-control studies failed to report any consistent relationships between occupational or other self-reported potential exposures to fuels and cancer of the oral cavity and oropharynx (Huebner et al. 1992; Zheng et al. 1996).
The committee concludes, from its assessment of the epidemiologic literature, that there is inadequate/insufficient evidence to determine whether an association exists between exposure to fuels and cancers of the oral cavity and oropharynx.
All available studies of exposure to combustion products and cancer of the oral cavity and oropharynx were of the case-control design, and all were adjusted for cigarette-smoking and other confounders. Results of several studies suggest an association between cancers of the oral cavity and oropharynx and exposure to combustion products. Pintos et al. (1998) demonstrated an association between wood-stove use and cancers of the upper aerodigestive tract, and there were supportive findings from Dietz et al. (1995) that were based on exposure from fossil-fuel stove use in Germany, from Gustavsson et al. (1998) on PAH exposure in Sweden, and from Zheng et al. (1992, 1996) on kerosene-stove use in China.
The committee concludes, from its assessment of the epidemiologic literature, that there is limited/suggestive evidence of an association between exposure to combustion products and cancers of the oral cavity and oropharynx.
CANCERS OF THE NASAL CAVITY AND NASOPHARYNX
Cancers of the nasopharynx (ICD-9 147) or of the nasal cavity and paranasal sinuses (ICD-9 160), which previously have been grouped with oral cancers as “head and neck cancers” were considered as a separate group by the committee. The tissues of the nasal cavity and nasopharynx are subject to exposures that may be somewhat different from those of the tissues of the oral cavity. Nasopharyngeal carcinoma (NPC) is the most frequent malignant tumor of the nasopharynx.
As for other cancers of the head and neck, the most important risk factor for cancers of the nasal cavity and nasopharynx is smoking (ACS 2003b, 2003c, 2003d). Others include diets high in salt-cured fish and meats and infection with the Epstein-Barr virus. Cancers of the nasal cavities and sinuses have been found to be associated with occupational exposures, such as to dusts from wood, textiles, leather, and metals; glues; formaldehyde; solvents used in furniture and shoe production; mustard gas; isopropyl alcohol; and radium.
In 2000, there were 1.4 new cases of cancers of the nasal cavity and nasopharynx per 100,000 in the US (1.9 among men and 0.9 among women) and 0.4 deaths per 100,000 (0.5 among men and 0.2 among women) (Ries et al. 2004). NPC is rare in most parts of the world, with incidences generally less than 1 per 100,000 persons per year (Muir et al. 1987). The highest incidence is observed among southern Chinese (30–50 per 100,000 person-years); it might be attributable to the consumption of salted fish and preserved foods early in life. Several studies of NPC focused on Chinese populations because of the large number of available cases.
Fuels
Table 4.3 presents the most relevant findings reviewed by the committee in drawing its conclusion on the possibility of an association between exposure to fuels and cancers of the nasal cavity and nasopharynx.
Case-Control Studies
Increased risk of nasopharyngeal cancer posed by 20 occupational exposures was assessed in a case-control study (Armstrong et al. 2000). During a 2-year period, 530 subjects with histologically confirmed NPC were identified from four hospitals in Malaysia and 282 cases underwent interviews that included occupational history and work exposure. Each case was matched by sex and age to a general population control without a history of cancer of the head, neck, or respiratory system. Exposure to motor fuel or oil, assigned according to type of job, was associated with a greater risk of NPC in a crude analysis (OR 1.79, 95% CI 1.16–2.82). However, after adjustment for smoking, passive smoke exposure, and diet, the association was largely reduced, and the CI suggested no effect (OR 1.33, 95% CI 0.81–2.20). A case-control study conducted by Teschke (1997) had only four cases, and no increased risk of sinonasal cancer was observed.
Combustion Products
Table 4.4 presents the most relevant findings reviewed by the committee in drawing its conclusion on the possibility of an association between exposure to combustion products and cancers of the nasal cavity and nasopharynx.
Case-Control Studies
A case-control study of NPC was conducted in rural Zangwu County in the middle 1980s (Zheng et al. 1994). Beginning in 1986, 88 cases of NPC were recruited with 176 controls matched on neighborhood, sex, and age. Subjects were interviewed to determine their use of wood fuels in the year before diagnosis. Use of wood fuels was associated with an increased risk of NPC in unadjusted models (OR 3.7, p=0.02), models adjusted for a sociodemographic confounder score (OR 6.4, p=0.003), and models adjusted for the confounder score, childhood consumption of salted fish, and consumption of herbal tea in the year before diagnosis (OR 5.4, 95% CI 1.5–19.8). There was some evidence that the risk of NPC was increased by household factors that can affect fume concentrations; specifically, the observed wood-fuel association increased in households with lower ventilation (for example, households that had no windows or no windows in the kitchen).
A hospital-based case-control study was conducted in Guangzhou City, China, in March 1983-August 1985 (Yu et al. 1990). Because Chinese living in the area have a high risk of NPC because of dietary factors, the researchers evaluated diet in detail and controlled for its influence in their analyses. There were 306 histologically confirmed incident cases of cancer of the nasal cavity and nasopharynx in subjects who were all less than 50 years old, and 306 controls were selected from the index cases’ neighborhoods of residence and matched on age, sex, and neighborhood. Exposure was based on self-reporting of occupation and exposure to specific risk factors. Subjects were interviewed in a standardized fashion that included inquiries about lifetime occupational history; exposure to dust, smoke, and chemical fumes; use of specific cooking fuels; and exposure to smoke from incense or mosquito coils. When associations were found for a self-reported occupational exposure, an occupational-medicine specialist reviewed the occupational information (job title and activity in job and industry) blindly to determine exposure status independently of case status. Exposure to smoke in a job held for at least 6 months (ever vs never) was found to be associated with an increased risk of NPC (RR adjusted for dietary risk factors in childhood based on self-reported exposure ever 2.4; 1–9 years of
exposure 1.6; 10 years or more of exposure 7.6). No confidence intervals were reported, but the authors stated that the results for “ever” exposed or exposed for 10 years or more had a “2-sided p value for the adjusted RR of less than 0.05”. Those results were attenuated when exposure was based on the specialist’s assessment (RR with 1–9 years of exposure 1.6, 95% 1.1–2.5; RR with 10 years or more of exposure 2.7, 95% CI 1.4–5.5). There was no association with domestic exposure to cooking fire, burning incense, or antimosquito coils.
Two case-control studies that collected occupational and environmental risk-factor information for NPC were conducted in Malaysia and included subjects of Chinese origin. The first was a hospital-based study (Armstrong and Armstrong 1983) of 117 histologically confirmed cases diagnosed in 1973–1980 and treated at the only radiotherapy center for NPC in Malaysia. In addition, the researchers interviewed 200 population controls (matched on neighborhood, sex, and ethnicity) to determine risk-factor information, including exposure to smoke and dust in the workplace. Exposure to both smoke and dust was associated with an increased risk of NPC among Chinese participants (RR for smoke exposure 6.0, p=0.006; RR for dust exposure 4.0, p<0.001). There was some evidence of an increased risk for Malays and Indians associated with smoke exposure, but the number of exposed cases was too small (four) to reach any conclusions. Smoke exposure was generated from the burning of wood, paper, grass, and oil and tar from in such occupations as rubber-tapping (wood-smoke exposure) and street-hawking. Some of the jobs seemed to involve more than one type of exposure; from the description of the analyses, the estimates do not seem to have been adjusted for multiple exposure or for risk factors other than age and sex.
The same researchers conducted a second case-control study on histologically confirmed cases of squamous-cell NPC which is described above (Armstrong et al. 2000). There were 119 prevalent cases (diagnosed before 1990) and 163 incident cases (diagnosed in 1990–1992). Exposures to inhalants were coded in a JEM approach by one of the authors blinded to case-control status. Cases and controls did not differ with respect to exposure amount or to median number of hours exposed to engine exhaust after adjustment for smoking and diet. No increased risk of NPC was associated with exposure to engine exhaust.
In addition to those largely Asian studies of wood-burning and other cooking fuels, the committee considered a large pooled reanalysis of cancers of nasal cavities and paranasal sinuses (ICD-9 160). Leclerc et al. (1997) assembled data from 12 previous studies in seven countries that included occupational-exposure information—the same set of 12 studies as reviewed in Demers et al. (1995) and in Luce et al. (2002). The dates of cancer diagnosis spanned 1968–1990. The inclusion criteria for the selected studies were histologic confirmation of cases; age, sex, and smoking information available on both cases and controls; and occupational histories of cases and controls obtained by interviews or questionnaires given to subjects or survivors (proxies). In 10 of the 12 studies, there were a total of 680 male cases of sinonasal cancer (330 squamous-cell carcinomas, 169 adenocarcinomas, 156 cases of other histologic types, and 25 cases of unknown histology) and 250 female cases of sinonasal cancer (102 squamous-cell carcinomas, 26 adenocarcinomas, 104 cases of other histologic types, and 18 cases of unknown histology). For the pooled analysis, subjects’ self-reported occupational information was recoded with the one-or two-digit International Standard Classification of Occupations. The researchers state that they controlled only for study and age category because they found that “introduction of cigarette smoking into the models, in addition to age and study, had no appreciable effect” on the risk of squamous-cell carcinoma. Among men, employment as a motor-vehicle driver was associated with an increased risk of adenocarcinoma (OR adjusted for study and age 2.50, 95% CI 1.03–
6.10) but not of squamous-cell carcinoma (OR 1.13, 95% CI 0.78–1.63). Duration of exposure did not change the point estimates for squamous-cell carcinoma, and only shorter exposure duration was linked to the increased risk of adenocarcinomas (OR<10 years 3.29, no CI; OR ≥10 years 0.80, no CI given). Also among men, employment as a cook was associated with an increased risk of squamous-cell carcinoma only in the shorter-duration group (OR adjusted 1.99, 95% CI 1.04–3.83; OR<10 years 2.72; OR≥10 years 1.25). Among women, however, employment as a cook was associated with a suggestion of a decreased risk of squamous-cell carcinoma (based on only three exposed cases; OR ever employed vs never employed 0.51, 95% CI 0.15–1.77; OR<10 years 0.27; OR≥10 years 0.69).
A population-based case-control study of incident nasal cavity and sinus cancer was conducted in British Columbia, Canada (Teschke et al. 1997). There were 48 cases identified in 1990–1992, and 159 population controls were frequency matched to cases on sex and age. Exposure was ascertained in interviews that included occupational history and items on individual exposures. Occupation-disease associations were estimated in models adjusted for age, sex, and tobacco use. There was no association with any particular occupation.
The incidence of pharyngeal, sinonasal, and oropharyngeal or hypopharyngeal cancer was assessed in a population-based case-control study from the Washington state cancer registry (Vaughan 1989). There were 231 cases aged 20–74 years diagnosed in 1979–1983 (sinonasal cancer) or 1980–1983 (pharyngeal cancer) and 552 population controls frequency matched to cases on age and sex (also de facto matched on telephone prefix because they were recruited with random-digit dialing). Histories for all jobs held at least 6 months were taken in interviews with subjects or their proxies. People were classified into 31 industrial and 59 occupational groups, and duration of employment was calculated on the basis of the start and end dates of employment. Models for oropharyngeal, hypopharyngeal, or sinonasal cancer were adjusted for age, sex, tobacco use, and alcohol consumption. Models for NPC were adjusted for age, sex, and race. Employment as a motor vehicle operator or other transportation worker was not associated with sinonasal cancer or pharyngeal cancer.
Conclusion
Little information is available on exposure to fuels and cancers of the nasal cavity and nasopharynx. The two studies reviewed by the committee did not report convincingly positive findings (Armstrong et al. 2000; Teschke et al. 1997).
The committee concludes, from its assessment of the epidemiologic literature, that there is inadequate/insufficient evidence to determine whether an association exists between exposure to fuels and cancers of the nasal cavity and nasopharynx.
Overall, the results of studies of the relationship between combustion products and cancers of the nasal cavity and nasopharynx are inconsistent, and indirect methods were used to assess exposure. However, positive associations were reported by studies conducted in China (Yu et al. 1990; Zheng et al. 1994) between combustion products (particularly wood smoke) and cancer of the nasopharynx. Those findings are supported by the work of Leclerc et al. (1997) and Armstrong and Armstrong (1983). The committee believes that the evidence is strong enough to suggest an association between combustion products and cancers of the nasal cavity and nasopharynx.
The committee concludes, from its assessment of the epidemiologic literature, that there is limited/suggestive evidence of an association between exposure to combustion products and cancers of the nasal cavity and nasopharynx.
ESOPHAGEAL CANCER
This review focuses on esophageal cancer (ICD-9 150). Risk factors for that cancer are increasing age, sex, ethnicity, dietary habits, chronic reflux esophagitis, alcohol and tobacco use, and work exposure (ACS 2004q, 2004w).
In the United States in 2000, there were 4.7 new cases of esophageal cancer per 100,000 people (7.9 among men and 2.1 among women) and 4.4 deaths per 100,000 (7.7 among men and 1.8 among women) (Ries et al. 2004).
Fuels
Table 4.5 presents the most relevant findings reviewed by the committee in drawing its conclusion on the possibility of an association between exposure to fuels and esophageal cancer.
Cohort Studies
A cohort of 3,814 male uranium-processing workers in Ohio in 1951–1989 was used to assess the potential relationship between esophageal and stomach cancers and kerosene exposure (Ritz 1999). Kerosene exposure based on a detailed industrial hygiene assessment (light or medium exposure) was associated with an increased risk of esophageal and stomach cancers; those cancers were analyzed together. Light kerosene exposure for 2 years or more with a 15-year lag before disease onset was associated with an RR of 3.46 (95% CI 1.22–9.80); medium kerosene exposure of the same duration and lag were also associated with an increased risk of esophageal and stomach cancer (RR 7.71, 95% CI 2.04–29.1).
Mortality was assessed in a cohort of 15,032 men with 5 years or more of work in 1964–1973 at Imperial Oil Limited refinery in Canada (Hanis et al. 1979). No specific industrial-hygiene assessment was available. There was an additional 11-year update that included 34,597 workers, including those hired in 1964–1983 (Lewis et al. 2000b; Schnatter et al. 1992). In followup through 1973, potential daily exposure to petroleum was associated with a greater risk of combined esophageal and stomach cancers (RR 3.25, p<0.05); the increase was greater with increasing years of employment (Hanis et al. 1979). However, the risk was not consistently observed in later followup studies of the cohort (Lewis et al. 2000b; Schnatter et al. 1992).
In a nationwide survey of gasoline-station attendants in Italy, the SMR for esophageal cancer was 2.34 (90% CI 0.80–5.35) (Lagorio et al. 1994). In small stations, where there were higher sales per employee, the risk of esophageal cancer was greater (SMR 3.42, 90% CI 1.17–7.82). Workers in small stations with higher sales of super-premium gasoline may have experienced higher exposure.
Combustion Products
Table 4.6 presents the most relevant findings reviewed by the committee in drawing its conclusion on the possibility of an association between exposure to combustion products and esophageal cancer.
Cohort Studies
Mortality and cancer incidence were determined in a retrospective cohort study conducted in Stockholm in relation to diesel exhaust and asbestos exposure in bus-garage workers (Gustavsson et al. 1990). Although the primary focus of the work was lung-cancer incidence, esophageal-cancer incidence was also included. An increase was observed in the incidence of esophageal cancer in bus-garage workers compared with a local reference population, but the CI included the null (SMR 3.27, 95% CI 0.89–8.37).
The incidence of esophageal cancer among occupational groups in Sweden as recorded in the 1960 census was evaluated (Chow et al. 1995). SIRs were not increased for “transportation and communication” as a major industrial or occupational category. Of the reported occupations that might involve exposure to exhausts, only locomotive and traffic workers showed any increase in risk (SIR 1.1; p>0.05). The database did not permit adjustment for possible confounders.
Case-Control Studies
In a case-control study of 99 cases of confirmed esophageal cancer and age-matched population controls, no associations were reported between esophageal cancer and exposure to a number of combustion products, including nitrogen oxides (NOx), gasoline emissions, carbon monoxide, PAHs from any source, and mononuclear aromatic hydrocarbons (Parent et al. 2000b). Increases in the risk of esophageal cancer were reported in association with exposures to benzo[a]pyrene, PAHs specifically derived from coal, and PAHs specifically derived from petroleum, but the CIs all included the null. Exposure information was obtained with detailed questionnaires that were analyzed by chemists and industrial hygienists.
The relationship between PAH exposure and squamous-cell carcinoma of the esophagus was determined in a case-control study conducted in Sweden (Gustavsson et al. 1998). Participants were administered a questionnaire to determine exposure information, and work histories were reviewed and coded by an occupational hygienist. Occupational exposure to PAHs was associated with an increased risk of esophageal cancer. Estimated RR attributable to low PAH exposure was 2.01 (95% CI 1.16–3.48), and the RR of high PAH exposure was 1.87 (95% CI 1.11–3.16).
Another occupational case-control study evaluated the relationship between exposure to several types of engine exhausts and combustion products and esophageal cancer (Siemiatycki et al. 1988). Increased risk of esophageal cancer was associated with exposure to wood combustion products (OR 2.3, 90% CI 1.2–4.5) on the basis of only eight cases, but no increased risk was associated with exposure to gasoline exhaust, diesel exhaust, jet-fuel exhaust, propane exhaust, or products of combustion of propane, natural gas, liquid fuel, coal, or coke.
Conclusion
Studies of an association between fuel exposure and esophageal cancer are few, and their results are inconsistent. Two of the studies (Hanis et al. 1979; Ritz 1999) analyzed esophageal and stomach cancer together, so the committee cannot determine which cancer type may have been associated with exposure. Despite the larger number of studies of combustion products and esophageal cancer, no consistent association was observed.
The committee concludes, from its assessment of the epidemiologic literature, that there is inadequate/insufficient evidence to determine whether an association exists between exposure to fuels or combustion products and esophageal cancer.
STOMACH CANCER
This review focuses on gastric cancer (commonly known as stomach cancer) (ICD-9 151). Risk factors for stomach cancers are increasing age, sex, ethnicity, family history, dietary habits, and tobacco and alcohol use (ACS 2004q, 2004w). Heliobacter pylori infection is also a known cause of stomach cancer.
In 2000, there were 8.0 new cases of stomach cancer per 100,000 people (11.6 among men and 5.3 among women) and 4.6 deaths per 100,000 (6.4 among men and 3.2 among women) in the United States (Ries et al. 2004).
Fuels
Table 4.7 presents the most relevant findings reviewed by the committee in drawing its conclusion on the possibility of an association between exposure to fuels and stomach cancer.
Cohort Studies
Two cohort studies assessed the risk of combined esophageal and stomach cancer posed by exposure to fuels (Hanis et al. 1979; Ritz 1999). The results are presented in the previous section on esophageal cancer. No increased risk of stomach cancer was found in a nationwide survey of gasoline-station attendants in Italy (Lagorio et al. 1994). Amoco Oil Company employees in 1970–1980 who worked in operations were at increased risk for stomach cancer, with an SMR of 2.06 (Nelson et al. 1987), but those working in administration (and presumably were not exposed to petroleum products) had an SMR of 1.80.
Case-Control Studies
A case-control study of 3,726 cases of cancer in men in 19 Montreal hospitals was conducted to determine whether there was an association exists between exposure to fuels and various cancers, including stomach cancer (Siemiatycki et al. 1987a). Exposure was assessed with an industrial-hygiene assessment of exposure based on occupational history. The authors presented 90% confidence intervals and reported borderline increased risks for participants with automotive-gasoline exposure (OR 1.5, 90% CI 1.2–1.9). The risk of stomach cancer also was increased after exposure to kerosene (OR 1.7, 90% CI 1.2–2.3).
Combustion Products
Table 4.8 presents the most relevant findings reviewed by the committee in drawing its conclusion on the possibility of an association between exposure to combustion products and stomach cancer.
Cohort Studies
Several epidemiologic studies examined rates of stomach cancer in defined populations compared with the general population. Occupational information on persons with stomach cancer as reported to the Shanghai Cancer Registry in 1980–1984 was assessed (Kneller et al. 1990). Increased SIRs were reported for fuel suppliers (p value not given), petroleum-refinery workers (p<0.05), and boiler firemen (p<0.01).
A similar approach was taken to evaluating the incidence of stomach cancer that was linked to occupation as reported in the 1960 Swedish census (Chow et al. 1994). There were 16,872 men diagnosed with stomach cancer in 1961–1979, but no increased risk was observed for “transportation and communication workers” as a major industrial or occupational category. Among machine and engine maintenance workers, crane operators were found to have an increased risk of stomach cancer (SIR 1.5, p<0.01). The database did not permit adjustment for potential confounders.
Case-Control Studies
Wu-Williams et al. (1990b) reported on a case-control study of 137 men with stomach cancer as reported to the Los Angeles County cancer registry. Exposure was determined by interviewing participants (or in some cases, surrogates) about occupational history using a structured questionnaire. No relationship was found between exposure to “smoke/exhaust” and stomach cancer.
A case-control study in Italy examined the relationship between occupational exposures and stomach cancer (Cocco et al. 1994). Men with histologically confirmed stomach cancer were interviewed to determine their occupational history. Controls were randomly selected from community and local health-unit registers of the resident population and matched on sex and age. A relative risk of 1.0 for stomach cancer was reported for men in several job categories in which exposure to combustion products might have occurred (for example, mechanics, repairmen, and railroad workers), but the CIs included the null. A small increase in risk was reported in men occupationally exposed to NOx (OR 1.4, 95% CI 1.0–2.1).
An occupational case-control study evaluated the relationship between exposure to several types of engine exhausts and combustion products and stomach cancer on the basis of an industrial-hygiene assessment of occupational history (Siemiatycki et al. 1988). No increased risk was associated with exposure to gasoline exhaust, diesel exhaust, jet-fuel exhaust, propane exhaust, or products of combustion of propane, natural gas, liquid fuel, coal, or coke.
A case-control study was conducted to assess the relationship between heating and cooking fuel-related exposures and stomach cancer in a coal-mining region of Pennsylvania (Weinberg et al. 1985). Cases were identified from death certificates, and followup interviews were conducted with next of kin to determine exposures. Increases in stomach-cancer risk were reported for coal cooking and heating, but the CIs included the null. No increased risks were found for gas cooking and heating. The results were not adjusted for smoking.
Occupational history was obtained by interviewing patients admitted to Roswell Park Memorial Institute in Buffalo, New York (Viadana et al. 1976). Nonneoplastic controls were selected from the same hospital and matched for age and smoking status. An association between the occupations of bus, taxicab, or truck driver and stomach cancer was reported (RR 1.6, p>0.05).
Conclusion
No consistent association between fuels or combustion products and stomach cancer was observed in the studies reviewed by the committee. Two of the studies of fuel exposure (Hanis et al. 1979; Ritz 1999) analyzed esophageal and stomach cancers together, so the committee cannot determine which cancer type may have been associated with exposure. For combustion-product exposure, two studies reported an increased risk of stomach cancer; however, the method used to assess exposure was limited and there was no adjustment for confounders.
The committee concludes, from its assessment of the epidemiologic literature, that there is inadequate/insufficient evidence to determine whether an association exists between exposure to fuels or combustion products and stomach cancer.
COLON CANCER
This review focuses on cancer of the colon (ICD-9 153). Risk factors for this cancer are family history, increasing age, ethnicity, dietary habits, weight and inactivity, and tobacco and alcohol use (ACS 2004p).
In 2000, there were 38.5 new cases of colon cancer per 100,000 people (43.5 among men and 34.8 among women) and 17.6 deaths per 100,000 (21.1 among men and 15.2 among women) in the United States (Ries et al. 2004).
Fuels
Table 4.9 presents the most relevant findings reviewed by the committee in drawing its conclusion on the possibility of and association between exposure to fuels and colon cancer.
Cohort Studies
In a cohort of 3,814 uranium-processing workers, kerosene exposure was associated with a greater risk of death from large intestine cancer, but the CIs included the null (Ritz 1999). Kerosene exposure was assessed with a detailed industrial hygiene survey.
A cohort of 10,763 workers employed at an Amoco Corporation oil refinery in 1970–1980 was retrospectively studied (Nelson et al. 1985, 1987). Exposure was classified by an industrial hygienist on the basis of job type and “rough exposure categories”. Increased SMRs were found for jobs associated with exposure to light aromatic hydrocarbons for all digestive tract cancers (SMR 1.39). Occasional exposure to heavy oils was also associated with increased SMRs for digestive tract cancers (SMR 1.79). No specific digestive-cancer sites were included in the analysis. On the basis of data from the National Cancer Institute, the age-adjusted incidences of gastrointestinal cancers indicate that men are much more likely to be diagnosed with colorectal cancer than esophageal and stomach cancers (Ries et al. 2003). Therefore, it is likely that the increase in digestive tract cancers in the Amoco Corporation oil-refinery workers is due to colorectal cancer.
A cohort of workers at Imperial Oil Limited in Canada was evaluated for cancer outcomes, including colorectal cancer (Hanis et al. 1979; Lewis et al. 2000b; Schnatter et al. 1993). Moderate exposure (defined as less than daily contact with petroleum or its products) and daily exposure were not associated with a greater risk of cancers of the intestines and rectum (the
result of the analysis of these cancers was presented together) (Hanis et al. 1979). In a subcohort of 6,672 male marketing and distribution workers who probably were exposed to finished products (gasoline and diesel fuel), the risk of large intestinal cancer was increased (SMR 1.50, 95% CI 0.97–2.21) (Schnatter et al. 1993); employment for 30 years or more (with a 10-year latency) was associated with a greater risk of large intestine cancer than shorter employment (SMR 2.33, p<0.05). In another subcohort of 25,292 Imperial Oil Limited workers, an increased risk of large intestine cancer was found, but the CIs included the null (Lewis et al. 2003).
Case-Control Studies
A population-based case-control study conducted in Sweden assessed the potential for an association between occupational exposure and colon cancer (Gerhardsson de Verdier et al. 1992). Exposure to specific substances was assessed by self-report; although an association was noted with fuels or with work in automotive repair or gasoline stations, the CI included the null (OR 1.8, 95% CI 0.6–5.2).
In a case-control study in Montreal, exposures to multiple fuels were examined with industrial-hygienist review of occupational history, and exposure intensity and probability were estimated (Siemiatycki et al. 1987a). The ORs were not increased (as judged with 90% CIs) for automotive gasoline, aviation gasoline, kerosene, jet fuel, or diesel fuel.
In a case-control study of occupational exposure and colorectal cancer that used a subset of the National Cancer Survey database and the National Occupational Hazard Survey, the probability of exposure to specific substances was assigned with a JEM based on occupational history (Spiegelman and Wegman 1985). A medium-high cumulative-exposure probability score, which summed the products of probability of exposure in each job and duration of exposure, was associated with a greater risk of colorectal cancer (OR 1.53, p=0.01) and colon cancer alone (OR 1.61; p=0.02) among men exposed to fuel oil. Among women exposed to fuel oil, there was no clear increase in risk of colorectal cancer (OR 1.24, p=0.21).
Combustion Products
Table 4.10 presents the most relevant findings reviewed by the committee in drawing its conclusion on the possibility of and association between exposure to combustion products and colon cancer.
Case-Control Studies
(Goldberg et al. 2001) conducted a case-control study of 497 Canadian men with colon cancer and two sets of controls, one population-based and the other a cancer case-control group. Exposure was based on a review of occupational history and expert opinion. Increasing risks were related to a number of occupational exposures, among them diesel-engine emissions (adjusted OR 1.6, 95% CI 1.0–2.5 for those with “substantial” exposure, and adjusted OR 1.2, 95% CI 0.8–1.8 for those with “nonsubstantial” exposure). There was no evidence of increasing risk with duration of exposure.
In the study in Sweden, the potential association between occupational exposure to combustion products and colon cancer was assessed (Gerhardsson de Verdier et al. 1992). Small increases in risk of colon cancer were associated with exposure to combustion gases from coal, coke, wood, and soot and with railway work, but the 95% CIs included the null. Exposure to tar and asphalt did not increase the risk of colon cancer.
An occupational case-control study evaluated the relationship between exposure to several types of engine exhausts and combustion products, based on an industrial-hygiene assessment of occupational history, and colon cancer (Siemiatycki et al. 1988). Exposure to diesel exhaust led to an increased risk of colon cancer (OR 1.3, 90% CI 1.1–1.6). Exposure to jet-fuel exhaust and products of wood combustion also led to increases in colon-cancer risk, but the 90% CI included the null. No increased risk was reported in association with exposure to gasoline exhaust, propane exhaust, or products of combustion of propane, natural gas, liquid fuel, coal, or coke.
Conclusion
No consistent association was observed in the studies of fuels and colon cancer reviewed by the committee. Three of the studies analyzed colon cancer and rectal cancer together (Hanis et al. 1979; Nelson et al. 1987; Ritz 1999), so the committee could not determine whether exposure to fuels may have been associated with a specific type of cancer. Although the three studies of exposure to combustion products and colon cancer reported positive associations (Gerhardsson de Verdier et al. 1992; Goldberg et al. 2001; Siemiatycki et al. 1988), the committee believes that the evidence of an association is inadequate because of the small number of studies available.
The committee concludes, from its assessment of the epidemiologic literature, that there is inadequate/insufficient evidence to determine whether an association exists between exposure to fuels or combustion products and colon cancer.
RECTAL CANCER
This review focuses on cancers of the rectum, rectosigmoid junction, and anus (ICD-9 154). Risk factors for those cancers are family history, increasing age, ethnicity, dietary habits, weight and inactivity, and tobacco and alcohol use (ACS 2004p).
In 2000, there were 14.6 new cases of rectal cancer per 100,000 people in the US (19.0 among men and 11.1 among women), and 3.0 deaths per 100,000 (4.0 among men and 2.3 among women) (Ries et al. 2004).
Fuels
Table 4.11 presents the most relevant findings reviewed by the committee in drawing its conclusion on the possibility of an association between exposure to fuels and rectal cancer.
Cohort Studies
As described in the colon-cancer section, a cohort of 10,763 workers at an Amoco Corporation oil refinery employed in 1970–1980 was retrospectively studied (Nelson et al. 1985, 1987). No specific digestive-tract cancer sites were included in analysis. Increased SMRs were found for jobs associated with light aromatic hydrocarbon exposure and occasional exposure to heavy oils. For the reasons described above, it is likely that most of the digestive-tract cancers were colorectal cancers.
In a cohort of workers at Imperial Oil Limited in Canada, increased risk of colorectal cancer was assessed (Hanis et al. 1979; Lewis et al. 2000b; Schnatter et al. 1993). Colon and
rectal cancers were analyzed together, and the results are summarized in the colon-cancer section above. No increased risk of colorectal cancer was found in the workers. In another followup study, no increased risk of cancer of the rectum and rectosigmoid junction was found in the cohort (Lewis et al. 2003). However, cancer of the rectum was increased in the marine-operating subgroup employed for 35 years or more (SMR 2.75, 95% CI 1.19–5.41) (Lewis et al. 2000b). Exposure to fuels in this subgroup most likely occurred during loading and unloading operations.
Case-Control Studies
A hospital-based case-control study conducted in Sweden assessed the potential association between occupational exposure and rectal cancer (Gerhardsson de Verdier et al. 1992). Exposure to specific substances was assessed by self-reporting, and no association was noted between fuels and rectal cancer. There was a suggestion of an increased risk in automotive-repair or gas-station workers (OR 1.5, 95% CI 0.4–5.6), but the effect estimates were imprecise.
In a case-control study in Montreal, exposure to multiple fuels was examined with an industrial-hygiene review of occupational history, and exposure intensity and probability were estimated (Siemiatycki et al. 1987a). An increased risk of rectal cancer was reported for exposure to automotive gasoline, aviation gasoline, jet fuel, diesel fuel, and heating oil, but the 90% CIs included the null. No increased risk of rectal cancer was found in association with kerosene.
In a case-control study of occupational exposure and colorectal cancer that used a subset of the National Cancer Survey database and the National Occupational Hazard Survey, a medium-high cumulative exposure probability score was associated with a greater risk of colorectal cancer (OR 1.53, p=0.01) among men exposed to fuel oil (Spiegelman and Wegman 1985). Among women exposed to fuel oil, there was no clear increase in risk of colorectal cancer (OR 1.24, p=0.21). There was no evidence of an exposure-response relationship.
Combustion Products
Table 4.12 presents the most relevant findings reviewed by the committee in drawing its conclusion on the possibility of an association between exposure to combustion products and rectal cancer.
Case-Control Studies
No evidence of increased rectal cancer risk posed by occupational exposure to soot, wood, and coal combustion products was reported in a population-based case-control study of 257 Canadians (Dumas et al. 2000).
In the study in Sweden, the potential association between occupational exposure to combustion products and rectal cancer was assessed (Gerhardsson de Verdier et al. 1992). Exposure was self-reported. Associations were found between rectal cancer and exposure to combustion gases from coal, coke, and wood (OR 2.1, 95% CI 1.0–4.6), soot (OR 2.7, 95% CI 1.2–5.7), and tar and asphalt (OR 1.0, 95% CI 0.3–2.8).
A case-control study conducted in Montreal did not report an increased risk of rectal or rectosigmoid cancer in people exposed to diesel exhaust, jet-fuel exhaust, propane exhaust, or products of combustion from natural gas, liquid fuel, coal, or coke (Siemiatycki et al. 1988). A JEM classification of exposure was used. There was a slight increase in rectal cancer in people
exposed to gasoline exhaust (OR 1.2, 90% CI 1.0–1.5), particularly in a subgroup exposed at high concentrations for more than 10 years (OR 1.6, 90% CI 1.1–2.3).
Conclusion
Although some studies reported positive associations between fuels or combustion products and rectal cancer, the results were not consistent, and the number of studies was small. The positive studies failed to include at least one high-quality study supported by an adequate exposure assessment.
The committee concludes, from its assessment of the epidemiologic literature, that there is inadequate/insufficient evidence to determine whether an association exists between exposure to fuels or combustion products and rectal cancer.
LIVER CANCER
This review focuses on hepatic cancer (more commonly referred to as liver cancer) (ICD-9 155) (ACS 2003f). Known risk factors include infection with hepatitis B and hepatitis C viruses; cirrhosis caused by alcohol abuse, hepatitis B and hepatitis C, and excess iron in the liver (from hemochromatosis); aflatoxin; vinyl chloride; thorium dioxide; tobacco use; anabolic steroids; and arsenic.
In 2000, there were 5.3 new cases of liver cancer per 100,000 people (8.1 among men and 3.0 among women) and 4.7 deaths per 100,000 (6.8 among men and 2.9 among women) in the United States (Ries et al. 2004).
Fuels
Table 4.13 presents the most relevant findings reviewed by the committee in drawing its conclusion on the possibility of an association between exposure to fuels and hepatic cancer.
Case-Control Studies
A case-control study reported on cases of primary liver cancer that occurred in New Jersey in 1975–1980 (Stemhagen et al. 1983). A questionnaire was used to determine occupational history and other factors, such as lifetime residence, medical history, smoking habits, and alcohol consumption. Of many occupations and industries that were examined in the study, the authors report results only for agricultural occupations (the primary purpose of the study) and for occupations and industries for which the relative risks were greater than 2.0 or for which the relative risks were greater than 1.0 and the CIs did not include the null. A total of 11 occupation and industries were in the latter category, including one that is possibly relevant to the Gulf War fuel exposures—gasoline service stations (RR 2.88, 95% CI 1.20–6.88).
Combustion Products
Table 4.14 presents the most relevant findings reviewed by the committee in drawing its conclusion on the possibility of an association between exposure to combustion products and hepatic cancer.
Case-Control Study
The study by Stemhagen et al. included two occupations that are possibly relevant to the Gulf War combustion exposures—road-building (RR 2.60, 95% CI 0.83–8.19) and bus lines (RR 2.80, 95% CI 0.93–8.40) (Stemhagen et al. 1983). Employment at gasoline service stations (RR 2.88, 95% CI 1.20–6.88) probably involved exposure to a mixture of fuel and combustion products.
Conclusion
Only one relevant study that evaluated exposure to fuels or combustion products and hepatic cancer was identified (Stemhagen et al. 1983). Although associations were noted for some occupations, there were few cases with relevant exposure, and the study did not consider all pertinent risk factors.
The committee concludes, from its assessment of the epidemiologic literature, that there is inadequate/insufficient evidence to determine whether an association exists between exposure to fuels or combustion products and hepatic cancer.
PANCREATIC CANCER
This review focuses on pancreatic cancer (ICD-9 157), for which tobacco use stands out as the most import risk factor among increasing age, ethnicity, sex, dietary habits, alcohol use, family history, and some occupational exposures (ACS 2004m, 2004p, 2004q). In addition, diabetes and pancreatitis are risk factors for pancreatic cancer.
In 2000, there were 10.9 new cases of pancreatic cancer per 100,000 people (12.8 among men and 9.4 among women) and 10.6 deaths per 100,000 (12.2 among men and 9.3 among women) in the United States (Ries et al. 2004).
Fuels
Table 4.15 presents the most relevant findings reviewed by the committee in drawing its conclusion on the possibility of an association between exposure to fuels and pancreatic cancer.
Cohort Studies
In a cohort of 3,814 uranium-processing workers, the relationship between kerosene exposure and pancreatic cancer was imprecise (Ritz 1999). For example, moderate exposure to kerosene for more than 5 years with a 15-year lag yielded an RR of 2.78 (95% CI 0.51–15.2). Kerosene exposure was based on a detailed industrial-hygiene assessment.
No increased risk of pancreatic cancer was found in a cohort of petroleum-refinery workers at Imperial Oil Limited in Canada (Lewis et al. 2003, 2000b; Schnatter et al. 1993), but only a small number of cases were noted. No specific industrial-hygiene assessment was available.
Combustion Products
Table 4.16 presents the most relevant findings reviewed by the committee in drawing its conclusion on the possibility of an association between exposure to combustion products and pancreatic cancer.
Case-Control Studies
Alguacil et al. (2000) conducted a case-control study in Spain to assess the relationship between occupational exposure and pancreatic cancer. A JEM was used to determine exposures to chemicals on the basis of jobs reported in the occupational history. There were few cases of exposure to combustion products, and the relationships reported were imprecise.
A population-based case-control study in Finland examined the relationship between a number of occupational exposures and pancreatic cancer (Kauppinen et al. 1995). Exposure analysis included a JEM. No association was found with exposure to engine exhaust (OR 0.89, 95% CI 0.51–1.53). An increased risk of pancreatic cancer was reported in association with exposure to PAHs, but the CI included the null (OR 1.33, 95% CI 0.69–2.57).
The association between occupational exposure and pancreatic cancers was evaluated in a case-control study in France (Pietri et al. 1990). Overall, transportation workers did not show an increased risk of pancreatic cancer (RR 0.87, 95% CI 0.42–1.77, on the basis of 13 exposed cases).
A case-control study in Montreal reported that exposure to coal combustion products was associated with an increased risk of pancreatic cancer (OR 2.3, 90% CI 1.4–4.0) (Siemiatycki et al. 1988). A JEM classification of exposure was used. The same study did not find increased risk of pancreatic cancer associated with exposures to gasoline exhaust, diesel exhaust, jet fuel exhaust, propane exhaust, or products of combustion of propane, natural gas, liquid fuel, wood, or coke.
Conclusion
Information on the risk of pancreatic cancer posed by fuel exposure is limited. One study reported an association between kerosene exposure and pancreatic cancer (Ritz 1999), but the results were imprecise. One of the four reviewed studies of combustion-product exposure and pancreatic cancer reported a positive finding (Siemiatycki et al. 1988). It found an association between exposure to coal combustion products and increased risk of pancreatic cancer, but it did not find a link between nine other types of combustion products and pancreatic cancer.
The committee concludes, from its assessment of the epidemiologic literature, that there is inadequate/insufficient evidence to determine whether an association exists between exposure to fuels or combustion products and pancreatic cancer.
LARYNGEAL CANCER
This section addresses cancer of the larynx (ICD 161). The most important risk factor for this cancer is tobacco use, particularly cigarette-smoking (ACS 2003a). Additional risk factors include alcohol consumption (which has a synergistic effect with tobacco), dietary habits, vitamin deficiency, exposure to ultraviolet (UV) radiation (sunlight), increasing age, a weak
immune system, genetic factors, and some occupational exposures, such as to dusts from wood, textiles, and leather; glues; formaldehyde; solvents used in furniture and shoe production; mustard gas; isopropyl alcohol; and radium.
In 2000, there were 4.0 new cases of laryngeal cancer per 100,000 people in the US (7.2 among men and 1.4 among women), and 1.4 deaths per 100,000 (2.6 among men and 0.5 among women) (Ries et al. 2004).
Fuels
Table 4.17 presents the most relevant findings reviewed by the committee in drawing its conclusion on the possibility of an association between exposure to fuels and laryngeal cancer.
Cohort Study
Lagorio et al. (1994) tracked the mortality experience of 2,308 men who had been managers of Italian service stations in 1980–1992. Laryngeal cancer was not associated with employment at the service stations (on the basis of three cases). Managers at all stations had an OR of 1.05 (90% CI 0.29–2.72); the OR for managers at small stations was 1.53 (90% CI 0.42–3.96).
Case-Control Studies
De Stefani et al. (1998) conducted a case-control study in Montevideo, Uruguay in 1993–1995. They enrolled 112 incident, histologically confirmed laryngeal-cancer cases in males and 509 controls (from among all other cancer cases, excluding those in sites proximal to the larynx or related to tobacco or alcohol consumption). Exposure was based on self-reported occupational history and exposure, and risks were adjusted for age, smoking, alcohol consumption, residence, education, and income. Cases with self-reported exposure to gasoline who worked as gasoline fillers had increased RRs, but the CIs included the null. There is a suggestion of a dose-response relationship with increased years of exposure to gasoline.
Wortley et al. (1992) conducted a population-based case-control study in western Washington from September 1983 to February 1987 and enrolled 235 incident cases of laryngeal cancer identified from a population-based Surveillance, Epidemiology, and End Results (SEER) registry. They matched 547 population controls to cases by sex and age with random-digit dialing. Subjects were interviewed with a questionnaire that included items on job titles, description of tasks, and nature of industry for each job held 6 months or longer. Job title and industry were coded according to 1980 US census codes. Some 505 individual occupations were collapsed into 62 categories. Job titles were categorized according to duration of exposure: less than 10 years vs 10 years or longer. Furthermore, industrial hygienists created a JEM for some chemical categories, such as diesel fumes, but not for combustion-product exposure. Risks were not found to be increased in vehicle mechanics (OR 1.2, 95% CI 0.6–2.1) or for garage- and gas-station-related work (OR 0.8, 95% CI 0.4–1.8). All results were adjusted for age, education, smoking, and alcohol.
Ahrens et al. (1991) conducted a case-control study to investigate the relationship between occupational factors and laryngeal cancer. A hospital in Bremen, Germany, was the source of 55 men newly diagnosed with histologically confirmed primary laryngeal cancer and 30 more who had been diagnosed during the previous 2 years. Each case was matched to a male patient from the same hospital without a history of cancer or other smoking-related diseases by
age. Standardized interviews were conducted and included occupational history with an exposure checklist and questions on smoking and drinking behavior. Broad industrial and occupational categories related to transportation showed moderately increased risks. Increased ORs were associated with self-reported exposure to diesel oil (OR 1.7, 95% CI 0.8–3.5) and gasoline (OR 2.8, 95% CI 1.0–7.7). Self-reported exposure to gasoline was most frequent in mechanics and drivers; diesel-oil exposure was most prevalent among those employed in shipping and in drivers and train operators.
Brown et al. (1988) enrolled 183 histologically confirmed incident cases of squamous-cell carcinoma of the larynx from 56 Texas hospitals in 1975–1980 and obtained 250 population controls (ascertained from death records, driver’s license files, and Health Care Financing Administration [HCFA] records) that were matched to cases on age, vital status, ethnicity, and county of residence. Subjects working in petroleum refining or chemical manufacturing had an adjusted RR of 0.93 (95% CI 0.59–1.46). For subjects with self-reported exposure to diesel and gasoline fumes, they calculated an adjusted RR of 1.50 (95% CI 1.00–2.26). However, it is not apparent from the description in the article whether diesel and gasoline fumes were the uncombusted and combusted form of those agents.
Combustion Products
Table 4.18 presents the most relevant findings reviewed by the committee in drawing its conclusion on the possibility of an association between exposure to combustion products and laryngeal cancer.
Case-Control Studies
A large IARC study assessed 1,010 male cases of laryngeal or hypopharyngeal cancer and 2,176 male population controls identified and interviewed at six European centers in 1980–1983 (for example, Berrino et al. 2003; Boffetta et al. 2003). Exposure in a specific industry or job was defined as working for at least 1 year since 1945 (Boffetta et al. 2003). Results were controlled for study area, age, smoking, and alcohol consumption. Employment in the railway-transport industry was associated with an increased risk of laryngeal cancer overall (OR 1.52, 95% CI 0.97–2.39) and showed a trend with duration of employment (p=0.02). Other transportation-related occupations with the potential for exhaust exposure (motor-vehicle mechanics, other mechanics, railway vehicle loaders, lorry drivers, local and long-distance lorry drivers, and other motor-vehicle drivers) were also associated with increased risks, but the CIs were wide and included the null value. PAHs were among 16 industrial agents for which duration, intensity, and likelihood of exposure were estimated with a JEM (Berrino et al. 2003). For the 695 cases 55 years old or older, the adjusted risk associated with PAH exposure was essentially unity (95% CI 0.7–1.3); for the younger 315 cases, the adjusted OR for PAH exposure for those who had been exposed 20 years or more was 1.1 (95% CI 0.5–2.4).
In a hospital-based case-control study of incident laryngeal cancer in Istanbul, Turkey, 940 cases were identified in 1979–1984, and 1,519 other patients with diagnoses not thought to share risk factors with laryngeal cancer were selected as controls (Elci et al. 2003). Cases and controls were interviewed on admission to the hospital with a questionnaire that included occupational history. After adjustment for age, smoking, and alcohol consumption, Elci et al. (2001) found that drivers had increased risks of laryngeal cancer (OR 1.7, 95% CI 1.1–2.4), but mechanics did not (OR 0.8, 95% CI 0.5–1.3). Elci et al. (2003) described the results of applying a
JEM to work histories to estimate specific exposures. The adjusted risks of laryngeal cancer were positively associated with ever having been exposed to diesel exhaust (OR 1.5, 95% CI 1.3–1.9), to gasoline exhaust (OR 1.6, 95% CI 1.3–2.0), or to PAHs (OR 1.3, 95% CI 1.1–1.6), and these associations were similar and generally positive for all the specific sites (supraglottic, glottic, and others). The risk of laryngeal cancer was similar for all three intensity and probability levels of exposure.
In the previously described case-control study of laryngeal cancer in Montevideo, Uruguay (De Stefani et al. 1998) truck drivers had an increased risk of cancer in the glottic area (OR 2.7, 95% CI 0.7–10.7) but not the supraglottic area (OR 0.6, 95% CI 0.1–2.9). When stratified by subsite, self-reported exposure to diesel or gasoline exhaust was positively associated with glottic cancer (diesel exhaust OR 1.9, 95% CI 0.6–5.8; gasoline exhaust OR 1.8, 95% CI 0.6–5.7) but not supraglottic cancer (diesel exhaust OR 0.7, 95% CI 0.2–1.9; gasoline exhaust OR 0.8, 95% CI 0.3–2.1). The authors speculated that the glottic area is potentially more affected by smaller particles, such as those found in exhaust, than the supraglottic area.
Gustavsson et al. (1998) identified incident cancers of the oral cavity (ICD-9 141, 143–145) or the oropharynx or hypopharynx (ICD-9 146, 148) diagnosed in Sweden in 1988–1991. In models adjusted for region, age, alcohol consumption, and smoking, high PAH exposures (categorized on the basis of an industrial-hygiene assessment of the participant’s occupational history) were associated with laryngeal cancer (RR 1.47, 95% CI 0.96–2.24).
Pintos et al. (1998) conducted a case-control study in Sao Paulo, Curitiba, and Loiania, Brazil, that examined the risk of laryngeal cancer in relation to the use of stoves. Reported use of wood stoves was associated with an increased risk of laryngeal cancer (OR adjusted for tobacco and alcohol consumption 2.34, 95% CI 1.17–4.67). In men, the OR was 2.03 (95% CI 1.12–3.67); in women, 16.24 (95% CI 2.66–99.1). Relatively few women were included in the study.
Goldberg et al. (1997) conducted a hospital-based case-control study in France that assessed the risk of laryngeal and hypopharyngeal cancer associated with occupation. The study included 528 male cases and 305 male controls with various other types of cancer. Interviews were conducted to obtain information on occupational history, demographic characteristics, alcohol consumption, and tobacco use. After adjustment only for age, alcohol use, and smoking, an increase in laryngeal-cancer and hypopharyngeal-cancer risk was reported for transportation-equipment operators (OR 1.5, 95% CI 1.0–2.5). When education was included in the adjustments, there was still an increase in risk, but the CI included the null (OR 1.4, 95% CI 0.9–2.3). With full adjustment, small increases in laryngeal-cancer and hypopharyngeal-cancer risk were reported for motor-vehicle mechanics (OR 1.2, 95% CI 0.5–2.5) and for workers employed in railway transportation (OR 1.4, 95% CI 0.6–3.1) and road transportation (OR 1.0, 95% CI 0.4–2.1), but all the CIs included the null.
Pollan and Lopez-Abente (1995) identified 50 incident laryngeal-cancer cases in Madrid in 1982–1985 and recruited 46 population controls matched on age, sex, and residential area and 45 hospital controls (excluding patients with alcohol- or tobacco-related diseases) matched on age, sex, and admission date. Exposure was based on self-reported job history and occupational codes; the researchers collected detailed data on year of hire and termination, occupational activity, and unit. Employment as a transport driver was associated with an increased risk of laryngeal cancer, but this result was based on only eight cases (OR adjusted for age, tobacco use, and alcohol use 2.71, 95% CI 0.85–8.64) and thus imprecise.
Muscat and Wynder (1995) reported on 235 white men with primary laryngeal cancer age-matched to 205 hospital controls with a variety of non-tobacco-related diseases. Although
there was an association between laryngeal cancer and self-reported exposure to diesel exhaust, an independent review and coding of occupations and industries potentially exposed to diesel exhaust found no association with diesel-exhaust-exposed jobs.
Researchers at the University of Heidelberg, Germany, conducted a hospital-based case-control study with 164 male incident laryngeal-cancer cases ascertained in February–June 1988 and November 1988–May 1989 (Dietz et al. 1995; Maier and Tisch 1997). They recruited 656 male controls from the same outpatient clinic (excluding those with evidence of cancer) matched to cases on age and residential area. Exposure was based on occupation and exposure to environmental factors such as heating or cooking with fossil-fuel stoves. After adjustment for alcohol consumption and tobacco use, heating and cooking with fossil-fuel stoves were associated with laryngeal cancer (OR for heating with fossil-fuel stoves over 40 years 2.11, 95% CI 1.43–3.12; OR for cooking with fossil fuel stoves over 20 years 1.47, 95% CI 0.92–2.33; and OR for heating with coal, briquettes, or coke 1.52, 95% CI 0.94–2.47). ORs and 95% CIs were calculated by the committee with standard methods from the observed numbers presented in the original paper.
Wortley et al. (1992) conducted a population-based case-control study in western Washington. On the basis of on occupational titles, some jobs with the potential for diesel-exhaust exposure were associated with a small increased risk of laryngeal cancer but all estimates were imprecise: motor-vehicle operator (OR ever employed 1.3, 95% CI 0.8–2.1; OR less than 10 years 1.6; OR at least 10 years 0.8); work in motor-vehicle transportation (OR ever employed 1.3, 95% CI 0.6–2.8; OR less than 10 years 1.1; OR at least 10 years 0.8); cook (OR 1.3, 95% CI 0.4–4.1); and firefighter (OR 0.5, 95% CI 0.0–2.9). All those results were adjusted for age, education, smoking, and alcohol.
In the previously described case-control study investigating the relationship between laryngeal cancer and occupational factors conducted by Ahrens et al. (1991) in Bremen, Germany, a modest increase in risk was observed in subjects employed in the transport and communication industry (OR 1.3, 95% CI 0.64–2.59) and subjects employed as transportation and store workers (OR 1.83, 95% CI 0.94–3.56). Self-reported exposure to fumes and smoke was not associated with an increase in risk (OR 0.7, 95% CI 0.3–1.4).
In the case-control study of incident squamous cell carcinoma conducted by Brown et al. (1988) in Texas, self-reporting ever having been employed in transportation or as a driver was associated with an increase in risk of laryngeal cancer, but the CIs were wide and included the null (OR transportation 1.42, 95% CI 0.86–2.36; OR driver 1.69, 95% CI 0.75–3.83).
An early case-control study by Decoufle and Stanislawczyk (1977) was the result of abstracting the records of about 14,000 white cancer patients at the Roswell Park Memorial Institute in Buffalo, New York. Occupational histories routinely constituted a section of the medical charts. Patients with laryngeal cancer were compared with noncancer controls with respect to jobs ever held or held for 5 years or more. Analyses were stratified by age at diagnosis (with the cutpoint at 60 years), and the results for this type of cancer were adjusted for smoking. Of several exhaust-associated occupations, drivers most consistently showed increased RRs of about 1.5, adjusted for smoking, but the CIs were wide.
Conclusion
Overall, the results regarding exposure to fuels and laryngeal cancer are inconsistent. Two studies reviewed by the committee reported a modest increase in the risk of laryngeal cancer associated with exposure to fuels; however, the exposures in both studies were self-
reported (Ahrens et al. 1991; Brown et al. 1988). Wortley et al. (1992) used a JEM and reported an increased risk of laryngeal cancer in vehicle mechanics that was imprecise but no increase in garage and gasoline-station workers.
The committee concludes, from its assessment of the epidemiologic literature, that there is inadequate/insufficient evidence to determine whether an association exists between exposure to fuels and laryngeal cancer.
A number of studies evaluated the potential link between exposure to combustion products and laryngeal cancer. Several studies reported positive findings, including Maier and Tisch (1997) and Dietz et al. (1995) regarding exposure to the emissions of fossil-fuel stoves and Pintos et al. (1998) regarding exposure to wood-stove emissions. There was supportive evidence from Gustavsson et al. (1998) and Elci et al. (2003). Several studies reported small increases in laryngeal-cancer risk for some exposures: Boffetta et al. (2003), De Stefani et al. (1998), Goldberg et al. (1997), Muscat and Wynder (1995), Pollan and Lopez-Abente (1995), Wortley et al. (1992), Ahrens et al. (1991) and Brown et al. (1988); however, the overall results are inconsistent.
The committee concludes, from its assessment of the epidemiologic literature, that there is limited/suggestive evidence for an association between combustion products and laryngeal cancer.
LUNG CANCER
Lung cancer (ICD-9 162) is the leading cause of cancer death of both men and women (ACS 2004s); its incidence is higher in men than in women. The major risk factor for lung cancer is tobacco-smoking. Smoking is believed to be responsible for about 80% of lung-cancer cases. Other risk factors are exposure to environmental tobacco smoke, ionizing radiation (including radon gas), arsenic, PAHs (particularly benzo[a]pyrene), asbestos, chromium, and silica; tuberculosis and some forms of pneumonia that leave scars in the lungs; family history; and some aspects of diet.
Lung cancer is classified into two main types based on the appearance of the cells (ACS 2004n). Small cell lung cancer (SCLC), also called oat cell cancer, accounts for 20% of all cancers and is almost exclusively associated with smoking. It originates primarily in the bronchi or central portion of the lungs, though it can spread rapidly throughout the body. The second type of lung cancer, non-small cell lung cancer, makes up the remaining 80% and is divided into 3 subtypes: squamous cell carcinoma, 25–30% of all lung cancers; adenocarcinoma, 40%; and large-cell undifferentiated carcinoma, 10–15%. Squamous cell carcinoma is also associated with smoking and is found centrally within the lungs. Adenocarcinoma appears in the outer regions of the lungs, and large-cell undifferentiated carcinoma can be found anywhere and can metastasize quickly.
In 2000, there were 62.3 new cases of lung cancer per 100,000 people (79.8 among men and 49.8 among women) and 56.1 deaths per 100,000 (76.9 among men and 41.2 among women), in the United States (Ries et al. 2004).
Fuels
Table 4.19 presents the most relevant findings reviewed by the committee in drawing its conclusion on the possibility of an association between exposure to fuels and lung cancer.
In a hospital-based case-control study conducted in Montreal in which exposures to multiple fuels were examined with an industrial-hygiene review of occupational history, exposure to kerosene was associated with an increased risk of squamous-cell lung cancer (OR 1.4, 90% CI 1.0–1.9) and adenocarcinoma of the lung (OR 1.5, 90% CI 1.0–2.3) (Siemiatycki et al. 1987a); exposure to heating oil, an increased risk of oat-cell lung cancer (OR 1.7, 90% CI 1.0–2.7); exposure to crude oil, an increased risk of squamous-cell lung cancer (OR 2.8, 90% CI 1.0–7.6); and exposure to diesel fuel, an increased risk of nonadenocarcinoma lung cancer (OR 1.6, 90% CI 1.1–2.4) with indications of an exposure-response relationship. In multivariate analyses, those risks were also increased.
Mortality was assessed in workers at an Imperial Oil Limited refinery in Canada (Hanis et al. 1979; Lewis et al. 2000b; Schnatter et al. 1993). In followup through 1973 of a subcohort with daily exposure to petroleum products, there was an increase in lung cancer (RR 1.89) and a greater increase with increasing years of employment (Hanis et al. 1979). However, there was a greater rate of lung cancer in office workers with no occupational exposure to petroleum products. The study did not control for smoking, and it is possible that the office workers smoked at a higher rate than the refinery workers.
A retrospective cohort study assessed mortality in 7,119 workers at a petroleum refinery in Beaumont, Texas, who worked at least 1 year in 1945–1978 (Raabe et al. 1998). The refinery produced a variety of fuels, including gasoline and jet fuel, and feedstocks for the petrochemical industry. The study did not control for smoking. No association between refinery employment and lung cancer was observed except for an increased SMR in maintenance-craft workers (SMR 1.20, 95% CI 0.99–1.45). A followup of the Beaumont cohort that extended enrollment and vital-status followup to December 31, 1996, found no association between refinery employment and lung cancer (Wong et al. 2001). A nested case-control study was conducted to assess the relationship between lung cancer and employment in the Beaumont, Texas refinery (Rosamilia et al. 1999). There were 112 cases of lung-cancer death that were matched to controls (n=490) by birth date and race. The analysis compared each job category (an indication of the likelihood of fuel exposure) and included some individual information on smoking. No increased risk of lung cancer was found in connection with any specific job category.
Combustion Products
Table 4.20 presents the most relevant findings reviewed by the committee in drawing its conclusion on the possibility of an association between exposure to combustion products and lung cancer. Figures 4.1, 4.2, and 4.3 present results of some of the studies on exhaust-exposed workers, indoor air pollution, and ambient air pollution, respectively. Results were sorted in descending order of relative risk, except for studies in which there are multiple results, which are contiguous entries.
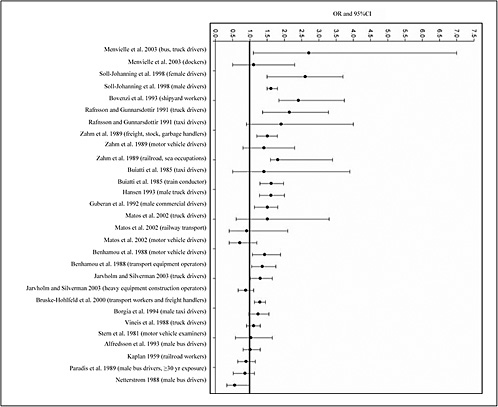
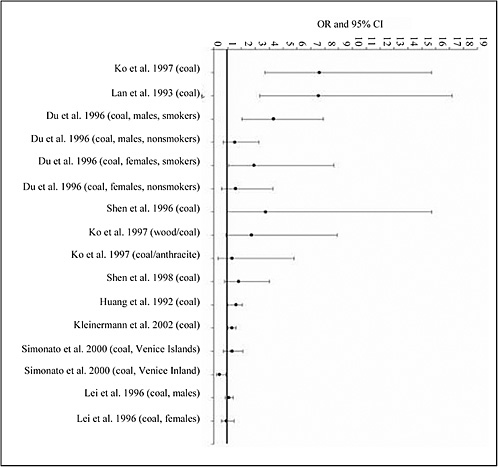
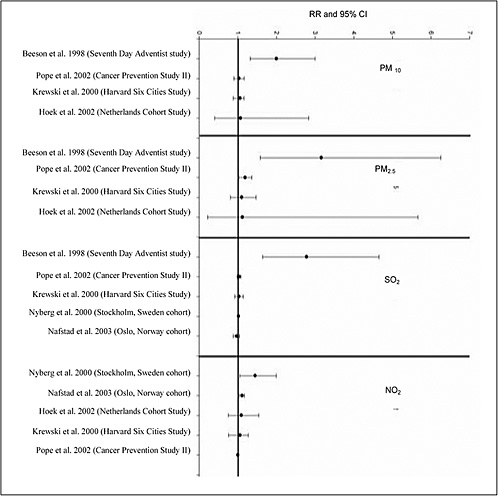
FIGURE 4.3 Lung cancer and ambient air pollution from combustion of fuels
Ambient Air-Pollution Studies
Five cohort studies have investigated the association between ambient air pollution and lung cancer: the Harvard Six Cities study (Krewski et al. 2000), the American Cancer Society (ACS) CPS-II Study (Pope et al. 1995, 2002), the California Seventh-Day Adventist Study (Abbey et al. 1999; Beeson et al. 1998), a Dutch study of diet and health (Hoek et al. 2002), and a cardiovascular cohort study in Norway (Nafstad et al. 2003). All except the Norwegian study used fixed-site air-pollution monitors to estimate exposure to ambient air pollution. In the Harvard Six Cities and ACS studies, subjects were assigned at the time of entry into the studies
average annual exposure in their city of residence. In the Seventh-Day Adventist study, geostatistical interpolation of annual fixed-site monitor data was assigned to the address of each subject. In the Dutch study, a complicated exposure-assessment algorithm based on regional and local pollution and accounting for land use was used to estimate annual exposure of each subject. In the Norwegian study, dispersion models coupled with emission data were used to estimate annual sulfur dioxide (SO2) and NOx at each subject’s residence.
Table 4.20 shows that in the Harvard Six Cities study and in the Dutch study, RRs of lung cancer were increased with exposure to fine particulate matter (PM) although the CIs included the null. In the Harvard Six Cities study, the RR associated with an increase in PM2.5 of 18.5 µg/m3 was 1.17 (95% CI 0.67–2.04). In the Dutch study, the RRs associated with an increase in air pollution from the 5th to the 95th percentile were 1.1 (95% CI 0.4–2.6) for black smoke (a measure of PM2.5 and elemental carbon) and 1.3 (95% CI 0.4–3.7) for nitrogen dioxide (NO2). In the ACS study, the RR associated with a 10 µg/m3 increase in fine PM was 1.14 (95% CI 1.04–1.23). In the Seventh-Day Adventist Study, RRs increased with increasing exposure: with an increase in PM10 of 24.8 µg/m3, men had an RR of 3.36 (95% CI 1.57–7.19), and women an RR of 1.33 (95% CI 0.60–2.96); with an increase in SO2 of 3.72 ppb, men had an RR of 1.99 (95% CI 1.24–3.20), and women an RR of 3.01 (95% CI 1.88–4.84); and with an increase in NO2 of 19.78 ppb, men had an RR of 1.82 (95% CI 0.93–3.57), and women an RR of 2.81 (95% CI 1.15–6.89). Finally, an association with NOx (a marker of traffic-related combustion products) was found in the Norwegian study: for an increase in NOx of 10 µg/m3, the adjusted hazard ratio was 1.08 (95% CI 1.02–1.15). No associations were found with exposure to SO2.
A number of case-control studies of the association between lung cancer and air pollution have been published. After adjusting for age, smoking, and occupation, Vena (1982) found a 26% increase in risk in persons living for at least 50 years in areas of Erie County, New York, that had high concentrations of total suspended particles (TSP). In a mortality case-control study in Krakow, Poland, an association was found among men living in areas with high concentrations of SO2 and TSP (OR 1.46, 95% CI 1.06–1.99), but no excess risks were found among women (OR for medium or high concentrations 1.17) (Jedrychowski et al. 1990). A study in Trieste, Italy, found lung cancer to be associated with high estimated concentrations of deposited of particles (OR for over 0.298 g/m2 per day compared with less than 0.175 g/m2 per day 1.4, 95% CI 1.1–1.8) (Barbone et al. 1995; Biggeri et al. 1996). Lung-cancer risk was also associated with living near an incinerator in the city (OR 2.6, 95% CI 1.3–5.1). (Alarie et al. 1972; Xu et al. 1996a) found that in northeastern China ORs in men increased with perceived smokiness in the outdoor environment (OR for “somewhat smoky” 1.5, 95% CI 1.2–2.0; OR for “smoky” 2.3, 95% CI 1.7–2.9). Similar results were found in women. In a small study among women living in Athens, Katsouyanni et al. (1991) investigated the association between lung cancer and ambient concentrations of soot. They did not find an association among nonsmoking women (smoking-adjusted, comparing highest quartile with lowest quartile OR 0.7), but found a strong association among women who smoked for long durations (30 years of smoking, comparing highest quartile with lowest quartile OR of 2.23). Nyberg et al. (2000) conducted a case-control study of lung cancer and traffic-related pollution in Stockholm, Sweden, and estimated traffic-related concentrations of NO2 and heating-related concentrations of SO2, using patterns of traffic density and dispersion models. After adjusting for smoking, occupation, exposure to radon, and other risk factors, they found little evidence of an association when they used exposures to NO2 averaged over a 30-year period. A trend in risk was observed with a 20-
year lagged metric for exposure (NO2 over 29 µg/m3 OR 1.4, 95% CI 1.1–2.0; SO2 over 129 µg/m3 OR 1.2, 95% CI 0.9–1.7). There was no evidence of an interaction with smoking status.
Some studies were methodologically less rigorous. Yang (1999) conducted a death-certificate case-control study in Taiwan and found an association between lung cancer and a petrochemical air-pollution index defined by the proportion of employees working in the petrochemical industry in each municipality. In a study of occupational and environmental exposures, Jockel et al. (1992) did not find an association with air pollution. Theirs was a small study, and the exposure assessments were not well described; no associations were found with estimated concentrations of SO2. In an ecologic study in Rome, Italy, Michelozzi et al. (1998) did not find an association with distance from incinerators and oil refineries.
Occupational Exposure to Engine Exhaust
This review includes findings from occupational studies in which subjects were considered to be probably exposed to exhaust emissions from internal-combustion engines. The studies have been organized according to whether job titles were used to infer such exposures (that is, no specific estimates of exposure to exhaust-related pollutants were provided) or exposure to exhausts, diesel fumes, or PAHs was estimated with generally accepted principles of occupational epidemiology (that is, use of JEMs, detailed assessment of exposure by experts, and actual measurement of exposures). For studies that used job titles, the assumption regarding exposure was based on general industrial-hygiene information about job types, not necessarily on details of subjects’ occupations. Consequently, one would expect misclassification of exposure to weaken RR estimates.
General Exposure to Exhaust
Three incidence and two mortality cohort studies of bus drivers yielded no strong indication of an association of exposure to exhaust with lung cancer (Alfredsson et al. 1993; Netterstrom 1988; Paradis et al. 1989; Soll-Johanning et al. 2003). An increased relative risk was found in a study of commercial drivers (truck, taxi, and bus drivers) in Geneva (RR 1.61, 95% CI 1.29–1.98) (Guberan et al. 1992), a study of truck drivers in Denmark (RR 1.60, 95% CI 1.28–1.98) (Hansen 1993), a study of truck drivers in Sweden (RR 1.29, 95% CI 0.99–1.65) (Jarvholm and Silverman 2003), and a study of truck drivers in Iceland (RR 2.14, 95% CI 1.37–3.18) (Rafnsson and Gunaarsdottir 1991). There was little evidence that risk increased with duration of employment in the few studies in which the risk was reported.
Almost all the case-control studies showed an increased risk of lung cancer among professional drivers (Bruske-Hohlfeld et al. 1999, 2000; Buiatti et al. 1985; Hansen et al. 1998; Hayes et al. 1989; Menvielle et al. 2003; Muscat et al. 1998; Steenland et al. 1990; Swanson et al. 1993; Zahm et al. 1989). RRs were found to increase with duration of employment in a Danish study (Hansen et al. 1998); a US study of teamster-union drivers (especially diesel- and gasoline-truck drivers) (Steenland et al. 1990); a study in Detroit, Michigan (Swanson et al. 1993); a study in New Caledonia (Menvielle et al. 2003); and a pooled analysis of three American case-control studies (Hayes et al. 1989). No clear-cut trends for professional drivers were found in a German study (Bruske-Hohlfeld et al. 1999, 2000) and in a Swedish study (Damber and Larsson 1985, 1987). Other professions that probably entail exposure to engine exhaust were found to be associated with increased risks of lung cancer, including dock work
(Jockel et al. 1998; Menvielle et al. 2003), transportation-equipment management (Menvielle et al. 2003), and shipyard work (Bovenzi et al. 1993; Hayes et al. 1989; Zahm et al. 1989).
Estimated Exposure to Compounds in Exhaust Fumes
The Dutch dietary cohort study (van Loon et al. 1997), from which exposure to ambient air pollution was estimated, was also used to estimate the incidence of occupational exposure to PAHs. Adjustment only for age showed that the RR of lung cancer increased by tertile of exposure. However, adjustment for age, smoking, and other occupational exposures led to risks that declined with increasing exposure. It is possible that the latter analysis, in which other occupational agents were included, was overmatched. An analysis adjusting for all potential confounding factors, excluding the occupational ones, was not conducted. A large census cohort study in Sweden that used a JEM to assign probability and intensity of exposure to diesel emissions on the basis of job titles collected in the 1960 and 1970 censuses showed that risks of lung cancer increased with the magnitude and probability of exposure among men but not among women (Boffetta et al. 2001). A study from the Kaiser Permanente Medical Care Program in California showed a 61% excess of lung cancer among bus-garage mechanics and showed that RRs increased by an index of cumulative diesel exhaust (Van Den Eeden and Friedman 1993).
Male firefighters in Philadelphia did not appear to be at increased risk for death from lung cancer when a surrogate index of exposure to diesel exhaust was used, although the power of the study was likely to be low because of small numbers of cases and a surrogate index of exposure (Baris et al. 2001). In a cohort of US railroad workers, younger diesel-exposed workers were found to be at higher risk, presumably because the younger workers had the greatest duration of exposure (Garshick et al. 1987, 1988; Larkin et al. 2000). Potash miners in Germany were at higher RR for death, but the 95% CIs included the null (Saverin et al. 1999). Risk was found to increase with cumulative exposure to diesel among a cohort of bus garage mechanics in Stockholm (Gustavsson et al. 1990). In the ACS CPS II study, it was reported that risk increased with duration of self-reported exposure to diesel exhaust (Boffetta et al. 1988); a limitation of this analysis is the use of self-reported exposure.
Risk estimates associated with exposure to specific components of exhaust have come out of a number of studies. Increased lung-cancer risk with cumulative exposure to diesel exhaust and to PAHs from occupational sources was found in a previously cited case-control study in Germany (Bruske-Hohlfeld et al. 2000) and in a study in Stockholm (Gustavsson et al. 2000). However, exposure to diesel exhaust from occupational sources was not found to increase the risk of lung cancer in a US hospital-based case-control study (Boffetta et al. 1990) and exposure to PAHs was not found to increase the risk in occupational studies in Buenos Aires (Matos et al. 2000), Montreal (Nadon et al. 1995), and Sweden (Emmelin et al. 1993).
Many studies have assessed the association of indoor air quality related to types of heating or cooking fuels, such as coal, with lung cancer. Studies of exposure to heating or cooking fuels included a number from China (Alarie et al. 1972; Dai et al. 1996; Du et al. 1996; He et al. 1991; Huang et al. 1992; Kleinerman et al. 2002; Lan et al. 1993; Lei et al. 1996; Liu et al. 1993; Metayer et al. 2002; Shen et al. 1996; Wu-Williams et al. 1990a, 1993; Xu et al. 1989, 1996a; Zhong et al. 1999), Hong Kong (Koo et al. 1983) and Taiwan (Chen et al. 1990; Ko et al. 1997), many of which showed such associations. Only one cohort study investigated the effects of indoor air pollution on the risk of developing lung cancer (Lan et al. 2002). That population-based interview study included more than 31,000 farmers living in Xuanwei, China, who were followed from 1976 to 1992. The analysis was based on subjects whose parents used unvented firepits and smoky coal throughout their lives. It showed that changing to stoves that had
chimneys decreased the risk of lung cancer (RR<0.6) and that the reduction occurred more than 10 years after the change.
Gulf War Veteran Study
A study assessing respiratory cancer in Gulf War Veterans was identified and reviewed by the committee (Smith et al. 2002). The study population consisted of 405,142 regular active-duty US military personnel who were in the gulf region during the Kuwaiti oil-well fires. Hospitalization records were examined from Department of Defense military treatment facilities from August 1, 1991 until hospitalization, separation from active-duty service, or July 31, 1999. Modeling was used to estimate troop exposure to oil-well fire smoke. The risk of malignant neoplasms of the respiratory and intrathoracic organs was modestly increased in the exposed group, but the CI included the null (adjusted RR 1.10, 95% CI 0.56–2.17). The relatively short observation period (8 years) is a limitation of this study for assessing cancer risk.
Conclusion
Results of studies of fuel exposure and lung-cancer risk are inconsistent. Siemiatycki et al. reported an association between kerosene and crude-oil exposure and squamous-cell lung cancer, between diesel-fuel exposure and nonadenocarcinoma, and between heating-oil exposure and oat-cell lung cancer (Siemiatycki et al. 1987a). Two cohort studies (Imperial Oil and Texas cohorts) did not find an association in workers most likely to have been exposed to fuels.
The committee concludes, from its assessment of the epidemiologic literature, that there is inadequate/insufficient evidence to determine whether an association exists between exposure to fuels and lung cancer.
There was evidence of associations between exposure to ambient air pollution, engine exhausts, and heating sources (coal) and lung cancer. Cohort and case-control studies showed consistently that risks increased with increasing ambient air pollution. There was evidence from both cohort and case-control studies that increasing exposure to engine exhausts and to its components (such as PAHs) increased the risk of lung cancer. As supporting evidence, the case-control studies of heating with coal showed increasing risks of developing lung cancer, and the risks were independent of active smoking and exposure to environmental tobacco smoke. The one cohort study showed that reduction in combustion products from smoky coal, by use of stoves that had chimneys, decreased the risk of lung cancer. Experimental evidence has shown that many compounds present in combustion products of oils in Chinese-style cooking are carcinogenic and some mutagenic. There is additional evidence that kerosene and soot are genotoxic in in vivo and in vitro models and that diesel exhaust is mutagenic. Toxicologic studies found that rats and mice exposed to coal and wood smoke had an increased incidence of lung cancer.
The committee concludes, from its assessment of the epidemiologic literature, that there is sufficient evidence of an association between exposure to combustion products and lung cancer.
MALIGNANT MELANOMA OF THE SKIN
Skin cancer is the most common type of cancer (ACS 2004u). There are two forms of skin cancer: melanoma (ICD-9 172) and nonmelanoma (basal-cell and squamous-cell carcinomas) (ICD-9 173). The major risk factor for both types of skin cancer is exposure to the sun and other sources of UV radiation. Family history, fair skin, moles, male sex, the inherited disease xeroderma pigmentosum, and immune suppression also play a role in the development of melanoma skin cancers. Melanoma is a much less common form of skin cancer than basal-cell or squamous-cell carcinoma, but is much more serious, usually being fatal if not treated in its early stages (ACS 2004u).
In 2000, malignant melanoma accounted for 17.7 new cases per 100,000 people (22.5 among men and 14.4 among women) and 2.7 deaths per 100,000 (3.8 among men and 1.8 among women) in the United States (Ries et al. 2004).
Most of the studies identified by the committee as meeting its criteria for assessing a potential association between exposure to fuels or their combustion products and skin cancer focused on melanoma. Mortality studies are likely to focus on melanoma, because it is unusual to die of other forms of skin cancer. Several studies of ocular melanoma or uveal melanoma (ICD-8 191) were identified; these are considered separately from cutaneous melanoma because they are classified as malignant neoplasms of nervous tissue. Mortality and morbidity studies of cutaneous melanoma are presented below; information gathered on malignant nonmelanoma skin cancer is summarized in the next section.
Fuels
Table 4.21 presents the most relevant findings considered by the committee in drawing its conclusion on the possibility of an association between exposure to fuels and melanoma skin cancer.
Cohort Studies
In the large Amoco cohort of oil refinery workers, Nelson et al. (1987) found the risk of skin-cancer death among white men increased (SMR 2.01, 95% CI 1.00–3.60), even though the usual “healthy-worker effect” of reduced overall mortality and cancer mortality was seen. The study combined both melanoma and nonmelanoma skin cancer in its definition of skin cancer; however, because death was the end point, virtually all the skin-cancer cases were probably melanoma. When latent period was considered, the mortality was greatest among those with less than 15 years since first exposure (SMR 5.24, p<0.05). The work histories of the people in the cohort were reviewed by industrial hygienists and classified for specific exposures (Nelson et al. 1985). There were 11 skin cancers, and the excess appeared to be concentrated among the maintenance workers (SMR 3.78, p<0.05). Routine exposure to refinery processes was also associated with skin-cancer mortality (SMR 2.68, p<0.05). The failure to adjust for possible confounders (particularly sun exposure) reduces confidence in the finding.
Jarvholm et al. (1997) investigated the incidence of melanoma and nonmelanoma skin cancer separately in a cohort of Swedish refinery workers. A minor increase in the risk of melanoma (SIR 1.1, 90% CI 0.49–2.0) was based on seven exposed cases, who had all received their diagnoses within 20 years of their first exposure.
Mortality has been assessed periodically among workers of Imperial Oil Limited of Canada (Hanis et al. 1979; Lewis et al. 2000b; Schnatter et al. 1992). In comparison with the Canadian general population, the estimated risk of death from melanoma in 1964–1994 among men working in all sectors of the industry was somewhat increased (SMR 1.32, 95% CI 0.83–2.00). Risks had diminished from the previous followup period (1964–1983) for upstream operations and for the marketing and distribution segment (Schnatter et al. 1992). Only two additional cases were observed among marketing and distribution workers in the 11 years of followup through 1994, so SMR was reduced from 2.56 (95% CI 0.94–5.57) to 1.59 (95% CI 0.69–3.14). The occurrence of only a single new case among exploration, drilling, production, or pipeline (upstream) workers reduced the risk considerably from 6.00 (95% CI 2.19–13.06) to 2.82 (95% CI 1.13–5.81). The increased risk of melanoma among the upstream subcohort may be related to exposure to crude oil, but it also coincides with the greater potential for sun exposure of these workers, who spend a considerable amount of time outdoors.
From the Imperial Oil cohort followup through 1994, Lewis et al. (2003) defined an “inception cohort” of younger workers with exposure experience only under more recent occupational-hygiene standards; the cohort consisted of those hired in 1964–1993. In these younger men, the estimated risk of melanoma (SIR 1.25, 95% CI 0.82–1.83) was effectively equivalent to the estimated mortality among the men in the full cohort; it must be noted that the incident cases include many (if not all) of the instances of melanoma deaths in the first analysis. The contrast between mortality among the (few) older female workers and incidence among the newly hired women, however, was considerable, although the CIs overlap slightly. The women’s estimated risk of melanoma (SIR 1.46, 95% CI 0.83–2.37) was similar to both findings for men. The Imperial Oil findings present a fairly coherent picture of an association of exposure to petroleum and derived fuels with melanoma, except that there is no suggestion of a dose-response relationship by duration of employment or intensity of exposure to fuel-related hydrocarbons. Additional uncertainty arises from the lack of control for possible confounders, especially exposure to sunlight.
Case-Control Studies
In an analysis of the data from the multicancer case-control study conducted in Montreal that specifically addressed association between work in various occupations and melanoma, Fritschi and Siemiatycki (1996a) found no association with any industry, occupation, or industrial-hygiene-determined substance related to petroleum. Those substances included C1-C4 alkanes, C5-C17 alkanes, C18+ alkanes, and leaded gasoline with 10, 22, 18, and six exposed cases, respectively. The study has the advantages of addressing incident cases, having full exposure histories interpreted by industrial hygienists, and incorporating information on many potential confounding variables, but the researchers note the study’s limited power to exclude definitively the possibility of an association with any particular exposure.
Combustion Products
Table 4.22 presents the most relevant findings considered by the committee in drawing its conclusion on the possibility of an association between exposure to combustion products and melanoma skin cancer.
Cohort Studies
Boffetta et al. (1988) analyzed the mortality experience of the prospective cohort established by the ACS in 1982 from the perspective of occupational exposure to diesel exhaust. The sample was defined as men found in followup who had been 40–79 years old at enrollment and had provided usable information on both smoking and exposure to diesel exhaust (and extensive other information gathered in the self-administered questionnaire). Although only 2 years of followup had accumulated, 7,499 deaths had occurred in the sample of 369,943 people (the above data constraints and loss to followup reduced the original sample by about 25%). When adjusted for age, smoking, and other occupational exposures, an imprecise estimate of risk of melanoma death of those exposed to diesel exhaust was increased (RR 1.67, p>0.05).
Pion et al. (1995) conducted a nested case-control study on the data generated on the ACS cohort at the time of its 6-year followup. The set of 2,780 melanoma cases was made up (in unspecified proportions) of men and women of all ages who had already been so diagnosed at the time of enrollment or were newly diagnosed during the followup period. Three controls without melanoma—matched by sex, age, race, and area of residence—were drawn from the cohort for each case. Although their accuracy might still be questioned, self-reports of exposure would not be expected to be subject to recall bias in a (strictly) prospective study. Several exposures of interest to the committee were addressed (coal tar, pitch, or asphalt; diesel engine exhaust; and gasoline exhaust), but none had an OR exceeding unity. Occupations were analyzed separately by sex. The risk of melanoma was less than 1 for truck drivers (OR 0.72, 95% CI 0.40–1.30); the most marked increase for a male occupation was for (generic) firefighters (OR 2.29, 95% CI 0.85–6.16). No adjustments were made by using information on possible confounders, whose availability is one of the primary merits of the ACS prospective cohort. The commingling of cross-sectional and prospective designs in this analysis raises the possibility that exposure occurred after the cancer event for the subset of original prevalent cases; no mention was made of screening the exposures to account for this temporal issue.
From the Swedish Cancer Environmental Registry updated to include 1970 census results and cancers diagnosed in 1971–1989, Boffetta et al. (2001) partitioned the cohort of men and women who were actively employed according to both the 1960 and 1970 censuses into sets with and without occupational exposure to diesel exhaust. Individual exposure to diesel emissions was assessed with a matrix of probabilities and intensities expected for each job title. Having found a high concordance between the occupations reported on the two censuses, the researchers opted to encode diesel exposure from the occupation specified on the 1960 census. Melanoma was not among the cancer sites for which there was any suggestion of an increased risk for either men or women who had held a job in 1960 with any likelihood of exposure to diesel emissions. Roughly half the male cases in the sample would intersect with those in the case-control study below, which was based on melanomas diagnosed in Sweden from 1961 to 1979 (Linet et al. 1995).
Case-Control Studies
In a case-control study of patients at Roswell Park Memorial Institute in 1956–1965, the occupational histories of about 14,000 white cancer cases were compared with those of noncancer patients (Decoufle and Stanislawczyk 1977; Viadana et al. 1976). For all the several exhaust-associated occupations of interest, the estimates of association with melanoma were increased, some of them markedly (for example, locomotive engineers and firemen and excavating, grading, and road-machinery operators). Because no more than four men with melanoma had held any of those occupations and only three who had held only clerical positions
were available for comparison, all the associated confidence intervals included unity, and no adjustment for possible confounders was attempted.
Siemiatycki et al. (1988) addressed the 121 interviewed melanoma cases in the Montreal multicancer case-control study in seeking associations with various exhaust and combustion-product exposures. They reported that melanoma was associated (p<0.05) with propane exhaust (OR 3.3, 90% CI 1.2–9.0) and there were suggestive increases with jet-fuel exhaust (OR 1.8, 90% CI 0.5–6.4) and liquid-fuel combustion (OR 1.8, 90% CI 0.9–3.4). In a more recent publication on this dataset, Fritschi and Siemiatycki (1996a) found no compelling association between any combustion-products exposure and melanoma. For an exposure to be analyzed (with adjustment for age, education, and ethnicity), there had to be at least four exposed cases. Estimates hovering about unity were reported for gasoline-engine emissions, PAHs from petroleum, and carbon monoxide. An appendix listed several additional combustion-products-related exposures for which the lower 95% confidence limit of the estimate of association with melanoma did not exceed 0.9: the air-transport, motor-transport, and railway-transport industries, with six, eight, and five exposed cases, respectively; the occupations of mechanic or motor-transport worker, with five and 10 exposed cases, respectively; and diesel-engine emissions, liquid-fuel combustion products, PAHs from any source, and pyrolysis fumes not classified elsewhere, with 10, six, 57, and 11 exposed cases, respectively. There was no explanation of why the number of interviewed melanoma cases considered had decreased by 18 (15%); only inconsequential perturbations resulted in the statistics for the exposures common to the two publications (assuming that “petrol engine emissions” equates to “gasoline exhaust”).
Nelemans et al. (1993) compared 140 melanoma cases with 181 controls who had other malignancies, all gathered from a cancer registry in the mideastern part of the Netherlands. After adjustment for age, sex, education, pigmentation factors, and exposure to sunlight, those who had ever worked in the “transport and communications” industry had a greater risk of melanoma than those who had not (OR 1.70, 95% CI 0.84–3.46); the difference was intensified by contrasting this group with those who had never worked in any of 10 hypothetically high-risk industries (OR 1.92, 95% CI 0.84–4.35). For the transportation and communications workers, tar products, cutting oils or coolants, and lubricating oils were among the exposures that were self-reported more frequently than by other workers, but no formal analysis was presented, and there was no attempt at a JEM approach to evaluating exposure. This elementary study provides some weak support for the possibility that exposure to combustion products is associated with the occurrence of cutaneous melanoma.
Using the Swedish Cancer Environment Registry database, Linet et al. (1995) identified 3,850 men diagnosed with melanoma in 1961–1979 who had been listed as occupationally active in the 1960 census; this sample would be expected to coincide with the male portion of the set of 5,003 melanoma cases studied in somewhat less detail by Vagero et al. (1990). The global categories for the “transport and communications” industry or occupation showed no indication of a relationship between melanoma and employment that might involve exposure to vehicle exhaust. Occupational subcategories in this sector, however, did show some increases; the risk for “traffic administration” was 1.6 (p<0.05, adjusted for age and region), and the risk for the more specific classification “traffic enforcement or railroad work” even more pronounced (SIR 3.1, p<0.01).
Conclusion
Data from studies of the large Amoco (Nelson et al. 1985, 1987) and Imperial Oil (Hanis et al. 1979) cohorts suggest an increased risk of death from melanoma with exposure to petroleum-derived materials (such as heavy oils and crude oil), and the smaller study (Jarvholm et al. 1997) is not inconsistent with such an association (Lewis et al. 2000b). In all the fuel cohort studies, the peak of melanoma risk occurred with latency (Jarvholm et al. 1997; Nelson et al. 1987) or duration (Lewis et al. 2000b) of around 15 years, rather than showing a dose-response relationship. The studies, however, did not adjust for sun exposure, a major risk factor for melanoma, and the workers—particularly the exploration, drilling, and pipeline workers—may have received considerable sun exposure while performing their jobs. But the one case-control study with fairly reliable exposure analysis (Fritschi and Siemiatycki 1996a) did not support such a conclusion.
The studies addressing exposure to combustion products also failed to adjust for exposure to sunlight. The Montreal case-control study, which had the best exposure assessment, and the record-linkage study of Linet et al. (1995) found isolated effects of specific exposures (propane exhaust and being a traffic administrator, respectively) that were not among the major ones considered by the present committee in evaluating possible effects of combustion products.
The committee concludes, from its assessment of the epidemiologic literature, that there is inadequate/insufficient evidence to determine whether an association exists between exposure to fuels or combustion products and cutaneous malignant melanoma.
NON-MELANOMA SKIN CANCERS
Nonmelanoma skin cancers (basal-cell and squamous-cell carcinomas) (ICD-9 173) are common but rarely fatal. As for cutaneous malignant melanoma, the main risk factor for nonmelanoma skin cancers is exposure to the sun and other sources of UV radiation. Other risk factors for nonmelanoma skin cancer are sex, family history, some specific inherited conditions (for example, basal-cell nevus syndrome and xeroderma pigmentosum), radiation treatment, exposure to some chemicals (such as arsenic, industrial tar, coal, paraffin, and oils), chronic or severe skin problems (such as burns), a weakened immune system, viral infection, and smoking (ACS 2004u).
Fuels
Table 4.23 presents the most relevant findings reviewed by the committee in drawing its conclusion on the possibility of an association between exposure to fuels and nonmelanoma skin cancers.
Cohort Studies
Jarvholm et al. (1997) investigated cancer incidence in a cohort of workers assembled from the personnel records of 26 companies in the Swedish petroleum industry. The study generated a somewhat stronger, yet still weak, estimate of an association of exposure to fuels with nonmelanoma skin cancers (SIR 1.3, 90% CI 0.61–2.4) than it had with melanoma.
Retrieval from the cancer registry generated an identical number (seven) of melanoma and nonmelanoma skin cancers; this suggests that records were incomplete.
Case-Control Studies
Kubasiewicz and Starzynski (1989) described the methods used to identify and interview men who had incident cases of skin cancer from 1982 through 1988 in the registry for Lodz, Poland, and age-matched sets of population and hospital controls. With selection for “all skin lesions suspected to have a neoplastic origin”, they reported that the 374 interviewed cases (of the 520 identified cases born after 1900) had 278 basal-cell carcinomas, 70 “carcinomas planoepitheliale”, 13 cases of Bowen’s disease (carcinoma in situ, precancerous), and 13 cases of Arning’s carcinoid (superficial basal-cell carcinoma). In an analysis that focused on occupational exposure to PAHs, Kubasiewicz et al. (1991) reported on a final set of 376 cases and their 752 population and 752 hospital controls. Full work histories were gathered, but the exposures analyzed consisted of self-reports on each of 17 possible agents, three of which would fit in our fuels classification: petroleum, petrol, and gasoline. The distinction between petrol and gasoline was not stated, but the results for gasoline exposure were said to be too sparse to analyze. Minor increases in crude risks of skin cancer were reported for both petroleum and petrol (ORs 1.17 and 1.30, respectively). The definition of skin cancer used in the study clearly excluded melanoma, but it did encompass some skin lesions that do not coincide with the malignant classification the present committee intended to address.
Using the Alberta (Canada) Cancer Registry, Gallagher et al. (1996) identified all men with squamous-cell carcinoma and basal-cell carcinoma who were 20–79 years old when diagnosed in 1983–1984. All 225 subjects with a first primary squamous-cell carcinoma were eligible. For first primary basal-cell carcinoma, only one-fourth of the cases with the lesion on the head or neck were retained, but all subjects with such a tumor elsewhere were kept; the total was 314 eligible cases of basal-cell carcinoma. During home interviews, 180 men with squamous-cell carcinoma and 226 men with basal-cell carcinoma completed a questionnaire that included a complete work history and a list of specific exposures of interest. Of 573 age-matched controls with no history of skin cancer drawn from men in the Alberta Health Care Insurance Plan (which includes everyone resident in the province for more than 3 months), 406 men completed the same questionnaire. The sets of squamous-cell carcinoma and basal-cell carcinoma cases were compared with the controls separately. With adjustment for age, skin pigmentation (for example, fair skin), ethnicity, and exposure to sunlight, but not smoking, the risk of squamous-cell carcinoma after exposure to petroleum products (specified to be gasoline and oil) was increased (OR 1.3, 95% CI 1.0–2.0), but not the risk of basal-cell carcinoma (OR 0.9, 95% CI 0.6–1.3). Although the response rates were low and the exposure data came only from self-reports, the results of the study suggest a potential relationship between exposure to petroleum-derived fuels and squamous-cell carcinoma.
Combustion Products
Table 4.24 presents the most relevant findings reviewed by the committee in drawing its conclusion on the possibility of an association between exposure to combustion products and nonmelanoma skin cancers.
Case-Control Studies
Hannukesela-Svahn et al. (1999) analyzed basal-cell carcinomas and other nonmelanoma skin cancers assembled in the Finnish Cancer Registry over 4 decades by linking to subjects’ stated occupations in the 1970 census. For “transportation and communication” (a nonspecific, self-reported occupation code at a single time), the estimated risk of basal-cell carcinoma among men was 1.0 (95% CI 1.0–1.1), which suggests that the risk was not increased. There were only about 15% as many cases of the other types of nonmelanoma skin cancers (predominantly squamous-cell carcinomas) as there were cases of basal-cell carcinoma, so the confidence intervals associated with the estimated risks were wider; the estimated risk in men was slightly below unity, that in women somewhat above.
As discussed above in connection with exposures to fuels, Kubasiewicz et al. (1991) presented an analysis of occupational exposure of 376 skin-cancer subjects (primarily with basal-cell carcinoma) and their 752 population and 752 hospital controls to PAHs. Full work histories had been gathered, but exposure to PAHs was determined on the basis of self-reported exposure to each of 17 possible sources of PAHs. The cases were compared independently (apparently without adjustment beyond matching on age) with both the population and hospital controls, and the results were virtually identical (the statistics related to the population controls are reported here). There was a slight increase in risk in those who had ever been exposed to any of the sources of PAHs (OR 1.15, 95% CI 0.90–1.51; 95% CI calculated with standard methods from the observed and expected numbers presented in the original paper), but there was no indication of a dose-response relationship with duration of exposure.
In the case-control study of squamous-cell carcinoma and basal-cell carcinoma from the Alberta Cancer Registry, Gallagher et al. (1996) presented the results related to several potentially PAH-containing exposures (determined by self-report) in addition to the fuel-related exposure reported above. After adjustment for age, pigmentation, ethnicity, and exposure to sunlight, but not smoking, the risk of squamous-cell carcinoma after exposure to diesel fumes was increased (OR 1.7, 95% CI 1.1–2.5). For basal-cell carcinoma, only a modestly increased PAH-related risk was seen after exposure to diesel fumes (OR 1.1, 95% CI 0.8–1.6).
Conclusion
The committee recognizes that PAHs (present in soot and numerous similar complex mixtures, mostly originating from combustion processes) have long been accepted to be skin carcinogens in animals and humans (ATSDR 1995; IARC 1985). IARC limited the scope of its consideration to chimney soot, so the subjects of the studies on which its conclusions were based were all chimney sweeps. Similarly, the epidemiologic bases of the Agency for Toxic Substances and Disease Registry (ATSDR) conclusions were shale-oil workers and chimney sweeps. As explained in Chapter 2, in planning its approach to its task, the committee considered those types of exposure as too dissimilar to the exposure scenarios in the Persian Gulf to base its conclusions on combustion products and nonmelanoma skin cancers on the conclusions of IARC and ATSDR.
Dermal application of individual PAHs to animals has been shown to lead to skin tumors in a number of studies. Mechanistic studies have demonstrated that some PAHs are genotoxic and can act as initiators, promoters, and complete carcinogens. Despite strong evidence that PAHs are carcinogenic in animal models and that they are genotoxic, the committee used
toxicologic information only in a supportive role; that is, it did not base its conclusions solely on toxicologic information.
Of the available epidemiologic studies that met the committee’s criteria, the Gallagher et al. (1996) study appears to be the most reliable and well conducted. It reported one borderline association between fuel exposure and squamous-cell carcinoma and several somewhat stronger associations between self-reported exposure to PAH-containing agents and squamous-cell carcinoma. For the more common type of nonmelanoma skin cancer (basal cell carcinoma), however, the findings with both types of exposure were largely negative. The committee concluded that without inclusion of epidemiologic studies regarding occupations that it had determined were dissimilar to exposures experienced during the Gulf War, a consistent and convincing picture of increased risk of nonmelanoma skin cancer did not emerge.
The committee concludes, from its assessment of the epidemiologic literature, that there is inadequate/insufficient evidence to determine whether an association exists between exposure to fuels and non-melanoma skin cancers.
FEMALE BREAST CANCER
Breast cancer (ICD-9 174) is about 100 times more common among women than men (ACS 2003e). There are a number of known or suspected risk factors for breast cancer in women; some major ones are aging, genetics, family history, years of ovulation, parity, and use of hormone-replacement therapy after menopause.
In 2000, there were 135.1 new cases of breast cancer per 100,000 women in the US and 26.7 deaths per 100,000 (Ries et al. 2004).
Fuels
Table 4.25 presents the most relevant findings reviewed by the committee in drawing its conclusion on the possibility of an association between exposure to fuels and breast cancer in women.
Cohort Studies
The risk of breast cancer in women was assessed in two cohorts of workers at petroleum companies (Divine et al. 1999b; Lewis et al. 2000b, 2003). Exposure was assessed in the Texaco cohort by using work histories in company records (Divine et al. 1999b), and no increased risk of breast cancer in women was found (SMR 0.71, 95% CI 0.40–1.18). In the Canadian Imperial Oil cohort, exposure was assessed in the same way (Lewis et al. 2000b, 2003), and neither breast cancer mortality nor incidence was markedly increased (SMR 1.08, 95% CI 0.66–1.67; SIR 1.02, 95% CI 0.80–1.28, respectively).
Lagorio et al. (1994) tracked the mortality experience of 357 women who had been managers of Italian service stations in 1980–1992. The effort complemented a detailed assessment of exposure at service stations by monitoring 111 attendants in 1992 (Lagorio et al. 1993). The OR for female breast-cancer risk was 1.04 (90% CI 0.18–3.28) on the basis of two cases.
Combustion Products
Table 4.26 presents the most relevant findings reviewed by the committee in drawing its conclusion on the possibility of an association between exposure to combustion products and breast cancer in women.
Case-Control Studies
Petralia et al. (1999) conducted a case-control study of 301 women who had premenopausal breast cancer and 316 controls from western New York state. JEMs were used to determine occupational exposure to PAHs and benzene, and the researchers endeavored to separate their individual roles. In comparison with women exposed to neither PAHs nor benene, the adjusted risk of breast cancer among women exposed only to PAHs (six cases) was neutral (RR 1.01, 95% CI 0.55–3.45), whereas the equivalent result for the 24 cases exposed only to benzene was 1.70 (95% CI 1.17–2.92). Smaller numbers of subjects in subcategories made separating the agent-specific contributions to estrogen-receptor-positive or -negative types of breast cancer more ambiguous.
Lewis-Michl et al. (1996) conducted a case-control study of the relationship between breast cancer and residence near industry or traffic on Long Island, New York. Among the women who had premenopausal breast cancer (93 in Nassau County and 70 in Suffolk County), the crude risks gave no indication of a relationship with those factors. In the larger group of 627 postmenopausal cases, crude ORs for high traffic density were not impressively increased among Nassau county subjects and did not exceed unity among women in Suffolk County; these results were essentially unchanged by adjustment for proximity to industry. The relevance to Gulf War exposures of the metric—distance from potential sources of vehicular combustion products—is limited by the ecologic nature of the exposure assessment.
Conclusion
No increased risk of breast cancer was found in a cohort of female petroleum workers (Divine et al. 1999b), and only a modest increase was found in another cohort of female petroleum workers (Lewis et al. 2003) and a cohort of female service-station workers in Italy (Lagorio et al. 1994). The two studies of breast cancer and exposure to combustion products evaluated by the committee (Lewis-Michl et al. 1996, Petralia et al. 1999) had essentially negative results.
The committee concludes, from its assessment of the epidemiologic literature, that there is inadequate/insufficient evidence to determine whether an association exists between exposure to fuels or combustion products and breast cancer in women.
MALE BREAST CANCER
Breast cancer occurs in men (ICD-9 175), although only rarely. Breast cancer accounts for about 0.22% of cancer deaths among men (ACS 2004t). Risk factors include aging, family history, radiation exposure, liver disease, estrogen treatment, physical inactivity, obesity, and the congenital condition Klinefelter syndrome.
In 2000, there were 1.3 new cases of breast cancer per 100,000 men and 0.4 deaths per 100,000 in the United States (Ries et al. 2004).
Fuels
Table 4.27 presents the findings reviewed by the committee in drawing its conclusion on the possibility of an association between exposure to fuels and breast cancer in men.
Case-Control Study
A population-based study of male breast cancer was conducted by using the Danish cancer registry (Hansen 2000). Exposure to gasoline vapors and PAHs (combined) was estimated from trade codes; blue-collar workers who had at least 3 months of employment in service stations, vehicle maintenance, the wholesale gasoline trade, or car-repair shops were classified as exposed. Exposure defined in that way was associated with a greater risk of breast cancer (OR 2.2, 95% CI 1.4–3.6), when birth year and socioeconomic status were controlled for. When a 10-year exposure lag was considered, the risk of breast cancer remained increased (OR 2.5, 95% CI 1.3–4.5). Men younger than 40 years old at the time of first employment had an OR of 3.7, which increased to 5.4 (95% CI 2.4–11.9) for a lag time of 10 years. The study did not control for smoking.
Combustion Products
Table 4.28 presents the most relevant findings reviewed by the committee in drawing its conclusion on the possibility of an association between exposure to combustion products and breast cancer in men.
Case-Control Studies
There are few case-control studies of the relationship between male breast cancer and exposure to combustion products or occupations with combustion-product exposure. As discussed in the previous section on fuel exposure, Hansen (2000) explored the relationship between male breast cancer and occupational exposure to gasoline and vehicle combustion products, including PAHs. Because the exposures were combined in the analysis, it is not possible to determine whether the increased risk of male breast cancer was due to fuel or combustion-product exposure.
Cocco et al. (1998) conducted a case-control study of male breast cancer and occupational exposure. They assessed occupational exposure to PAHs, high temperature, electromagnetic fields, herbicides, pesticides, and organic solvents by applying JEMs based on US census occupation and industry codes. The OR for the association between exposure to PAHs and male breast cancer was not increased. Taxicab drivers and subjects working in the motor-vehicle and equipment industry were at increased risk for male breast cancer.
Conclusion
Hansen (2000) reported positive findings regarding exposure to fuels and combustion products and male breast cancer; but the method used to assess exposure in that study is limited. Cocco et al. (1998) used a JEM and did not find an association between PAH exposure and male breast cancer.
The committee concludes, from its assessment of the epidemiologic literature, that there is inadequate/insufficient evidence to determine whether an association exists between exposure to fuels or combustion products and male breast cancer.
FEMALE GENITAL CANCERS (CERVICAL, ENDOMETRIAL, UTERINE, AND OVARIAN)
Cervical cancer (ICD-9 180) has a number of risk factors, the most important of which is human papillomavirus infection. Other important factors are smoking, immune deficiency, and poor nutrition. Oral contraceptives, multiple pregnancies, maternal diethylstilbestrol use, family history, and socioeconomic status may also contribute to risk (ACS 2004b).
Endometrial cancer (ICD-9 182), which occurs in the inner lining of the uterus, is the most common female reproductive system cancer. A major risk factor in endometrial cancer is exposure to estrogen, which may occur because of early menarche or late menopause (both can lead to longer span of menstruation), infertility, nulliparity, obesity, use of tamoxifen or estrogen-replacement therapy, and some ovarian diseases. Other risk factors are diabetes, diet, age, family history, breast or ovarian cancer, hereditary nonpolyposis colorectal cancer syndrome, and pelvic radiation therapy (ACS 2004c).
Ovarian cancer (ICD-9 183) leads to more deaths than any other cancer of the female reproductive system. Risk factors include age, reproductive history, fertility drugs, estrogen or hormone-replacement therapy, family history, and history of breast cancer. Mutations in the BRCA1 and BRCA2 genes may also increase risk of ovarian cancer (ACS 2004i).
In 2000, there were 32.0 new cases of cervical, uterine, and endometrial cancer per 100,000 women and 6.9 deaths per 100,000 in the US (Ries et al. 2004), and there were 16.3 new cases of ovarian cancer per 100,000 and 8.9 deaths per 100,000 in the US (Ries et al. 2004).
Fuels
Table 4.29 presents the most relevant findings reviewed by the committee in drawing its conclusion on the possibility of an association between exposure to fuels and cervical, endometrial, uterine, and ovarian cancers.
Cohort Studies
Exposure to fuels did not lead to increased risk of cervical cancer or of uterine cancer in either the Texaco or Imperial Oil cohort of petroleum workers (Divine et al. 1999b; Lewis et al. 2003). There was no notable increase in the risk of cancer of the ovary, fallopian tube, or broad ligaments among the women in the Imperial Oil cohort (SMR 1.74, 95% CI 0.70–3.58) (Lewis et al. 2003), but no information on ovarian cancer was available on female workers in the Texaco cohort (Divine et al. 1999b).
A Finnish study used a record-linkage approach to explore the relationship between occupational exposures and ovarian cancer (Vasama-Neuvonen et al. 1999). Gasoline exposure, derived with a JEM based on job titles, was found not to be associated with ovarian cancer.
Combustion Products
Table 4.30 presents the most relevant findings reviewed by the committee in drawing its conclusion on the possibility of an association between exposure to combustion products and cervical, endometrial, uterine, and ovarian cancers.
Case-Control Studies
A study explored the relationship between burning wood in the kitchen and the risk of cervical neoplasia in women in Honduras (Velema et al. 2002). Although the risk of grade III cervical intraepithelial neoplasia (CIN) showed a trend with increasing duration of exposure to wood smoke (p=0.022), women with low or intermediate exposure (up to 25 years) had lower estimated risks than the reference group of women, who said they had never used wood in the kitchen.
Finnish women born in 1906–1945 and active according to the 1970 census were linked to the national cancer registry for 1971–1995. The Finnish JEM applied to the census job titles was used to define exposure to selected occupational agents. Even in the highest exposure categories, Weiderpass et al. (2001) did not find the risk of cervical cancer to be increased by exposure to exhaust from diesel engines (RR 1.7, 95% CI 0.4–6.8) or gasoline engines (RR 1.3, 95% CI 0.7–2.2) or by exposure to PAHs (RR 1.2, 95% CI 0.3–4.8). Weiderpass et al. (2001) found no increase in risk of endometrial cancer associated with any of those three agents. Vasama-Neuvonen et al. (1999) reported on the results of this record-linkage study for ovarian cancer. Risk was not found to be increased by overall exposure to gasoline-engine exhaust, diesel-engine exhaust, or PAHs; there were, however, suggestions of dose-response trends related to exposure to each type of engine exhaust.
Conclusion
Overall, the studies provide inadequate support for an association between exposure to fuels or combustion products and cervical, endometrial, uterine, or ovarian cancer (Divine et al. 1999b; Lewis et al. 2003; Vasama-Neuvonen et al. 1999; Velema et al. 2002; Weiderpass et al. 2001). The association between wood smoke and CIN observed in the study by Velema et al. should be explored further.
The committee concludes, from its assessment of the epidemiologic literature, that there is inadequate/insufficient evidence to determine whether an association exists between exposure to fuels or combustion products and cervical, endometrial, uterine, or ovarian cancer.
MALE GENITAL CANCERS (PROSTATIC OR TESTICULAR)
Factors that increase the risk of developing prostatic cancer (ICD-9 185) include increasing age, race, family history, diet, and physical inactivity (ACS 2004v). Testicular cancer (ICD-9 186) is an uncommon but highly treatable cancer. Known or suspected risk factors include cryptorchidism, family history, some occupational exposures, multiple atypical nevi, HIV infection, race and ethnicity, body size, and maternal hormone use during pregnancy (ACS 2004j).
In 2000, there were 176.9 new cases of prostatic cancer per 100,000 men and 30.6 deaths per 100,000 in the US (Ries et al. 2004), and there were 5.7 new cases of testicular cancer per 100,000 men and 0.2 death per 100,000 (Ries et al. 2004).
Fuels
Table 4.31 presents the most relevant findings reviewed by the committee in drawing its conclusion on the possibility of an association between exposure to fuels and prostatic cancer and the only results on testicular cancer.
Cohort Studies
In a cohort of uranium-processing workers, an industrial-hygiene survey was done to categorize exposure to kerosene (Ritz 1999). At the lowest kerosene exposure, there was no hint of an association with prostatic cancer mortality; while for the six cases with moderate kerosene exposure, the most extreme risk estimate occurred for more than 5 years of exposure and no lag (RR 3.69, 95% CI 0.91–15.0). No workers had the highest exposure to kerosene.
Risk of prostaticcancer was not increased in two cohorts of petroleum-company workers: the Canadian Imperial Oil cohort (Hanis et al. 1979) and the Texaco cohort (Divine et al. 1999b; Lewis et al. 2000b, 2003; Schnatter et al. 1993). Only Lewis et al. (2003) reported on testicular cancer, again with negative findings.
Case-Control Study
In a hospital-based case-control study conducted in Montreal, there was an association between diesel-fuel exposures, as assessed with a JEM based on occupational history, and prostatic cancer (OR 1.7, 90% CI 1.2–2.5) (Siemiatycki et al. 1987a). Modest increases were in association with kerosene, heating oil, and crude oil. No increased risk of prostatic cancer was observed after exposure to automotive gasoline, aviation gasoline, or jet fuel.
Combustion Products
Table 4.32 presents the most relevant findings reviewed by the committee in drawing its conclusion on the possibility of an association between exposure to combustion products and prostatic cancer.
Case-Control Studies
A case-control study in Germany assessed the relationship between occupational factors and prostatic cancer (Seidler et al. 1998). Two JEMs were used to estimate dose-years of exposure, the product of estimates of intensity, duration, and probability of exposure. One of the JEMs yielded estimates of exposure to exhaust fumes that resulted in an increased risk for more than 25 dose-years vs no exposure (OR 2.4, 95% CI 1.2–4.7) but a less pronounced risk for 25 dose-years or fewer (OR 1.2, 95% CI 0.8–1.9). A similar pattern was seen when the other matrix was used to estimate exposure to diesel fumes and fuel; for more than 25 dose-years, the risk was clearly increased (OR 3.7, 95% CI 1.4–9.8), but for 25 dose-years or fewer, the OR was only 1.1 (95% CI 0.7–1.8). For PAH exposure, results contrary to a dose-response relationship were seen: exposure for 25 dose-years or fewer led to an OR of 1.6 (95% CI 1.0–2.4), but for more than 25 dose-years, the OR was 1.4 (95% CI 0.4–4.7).
In another case-control study, the relationship between occupational risk factors and prostatic cancer was examined on the basis of job history obtained by interview (Krstev et al. 1998). An increased risk of prostatic cancer was reported in firefighters (OR 3.34, 95% CI 1.13–9.91) and railroad-transportation workers (OR 1.66, 95% CI 1.13–2.44). A dose-response trend was observed in the railroad-transportation workers; those working in railroad transportation for fewer than 5 years had an OR of 1.47, for 5–19 years an OR of 1.43, and for 20 years or more an OR of 6.47. No increased risk was associated with other transportation or trucking workers.
Aronson et al. (1996) conducted a population-based case-control study of occupational risk factors in a study that included 449 prostatic cancer cases and over 2,000 controls. A JEM was applied to occupational histories to categorize various exposures as “substantial” or “nonsubstantial” for comparison with nonexposed subjects. Nonsubstantial exposure to diesel-engine emissions or to PAHs from coal was associated with increased risks of prostatic cancer; substantial exposure to the agents was associated with less pronounced risks. Substantial exposure to combustion products of liquid fuel or to PAHs from any source was associated with higher estimated risks than nonsubstantial exposure, but still not markedly increased.
A population-based case-control study in Montreal evaluated exposure to combustion products and prostatic cancer. An industrial hygienist reviewed occupational histories to derive the intensity and probability of various exposures (Siemiatycki et al. 1988). The report presented 90% CIs. Increased risks of prostatic cancer were reported for exposure to combustion products of liquid fuel (OR 1.6, 90% CI 1.2–2.1) or of coal (OR 1.6, 90% CI 1.2–2.2) but not of propane, natural gas, or wood or to any of the types of exhaust considered.
Conclusion
There were not enough relevant data to draw any sort of conclusion about exposure to fuels or their combustion products and testicular cancer.
The evidence is inconsistent regarding an association between fuel exposure and prostatic cancer. Only one study (Siemiatycki et al. 1987a) of the several reviewed by the committee reported a positive association between a fuel-related exposure and prostatic cancer.
Although the studies by Siemiatycki et al. (1987a), Aronson et al. (1996), Seidler et al. (1998), and Krstev et al. (1998) reported several positive associations between occupations having potential for exposure to combustion products or PAHs or having more rigorously derived estimates of exposure to such agents and prostatic cancer, the committee noted that the results were not consistently positive.
The committee concludes, from its assessment of the epidemiologic literature, that there is inadequate/insufficient evidence to determine whether an association exists between exposure to fuels or combustion products and prostatic cancer.
NERVOUS SYSTEM CANCERS
This section summarizes what is known about the relationship between exposure to fuels and combustion products and cancers of the nervous system (ICD-9 191–192). Most nervous system tumors are not associated with known risk factors. The few known risk factors associated with those cancers are radiation, immune system disorders, and family history.
In 2000, there were 6.6 new cases of brain and other nervous system cancers per 100,000 people (8.0 among men and 5.4 among women) and 4.5 deaths per 100,000 (5.6 among men and 3.7 among women) in the United States (Ries et al. 2004).
Fuels
Table 4.33 presents the most relevant findings reviewed by the committee in drawing its conclusion on the possibility of an association between exposure to fuels and brain cancer.
Cohort Studies
A series of studies described mortality among refinery, petrochemical, and research workers employed by Texaco (Divine and Barron 1986; Divine et al. 1985, 1999a, 1999b) for at least 5 years, with at least 1 day falling after January 1, 1947. Two of the studies presented the results of followup through 1977 for about 19,077 workers in the three categories, of when only refinery workers were of primary interest to the present committee (Divine and Barron 1986; Divine et al. 1985). With followup through 1993, addition of employees at three refineries acquired after 1977, and the inclusion of workers hired after 1977 (all with at least 5 years of employment), Divine et al. (1999b) considered a total of 28,840 workers, 738,454 person-years, and 9,575 deaths. Mortality from brain tumors (benign or malignant) was somewhat increased among white men who were ever employed in the motor-oil unit (SMR 1.78, 95% CI 0.88–3.19) and more intensely among those who had been employed in that unit for at least 5 years (SMR 3.26, 95% CI 1.40–6.43).
A cohort mortality study of 1,583 workers employed in an oil refinery near Milan, Italy that converted crude oil into a variety of hydrocarbons (solvents, fuel, and lubricants) was conducted to evaluate cancer risk (Bertazzi et al. 1989). Followup on workers was originally from 1949 to 1982; Consonni et al. (1999) extended it to 1991, for a total of 39,857 person-years and 352 deaths. There was an increased mortality from brain cancers, but the number of cases observed was low (five) and the 95% CI included the null value (SMR 2.08, 95% CI 0.67–4.85). Furthermore, the cancer excess was confined to workers employed for less than 15 years and no cases were observed among longer-term workers. Similarly, the largest increase was among workers who died from brain cancer within 9 years of first employment and no cases were observed 20 years after initial employment. No information was provided on brain cancer by type of job. The authors also reported that internal comparisons (using Poisson regression) were noninformative.
A series of cohort studies of petroleum workers at Imperial Oil Limited in Canada was conducted to assess cancer risk (Lewis et al. 2000b, 2003; Schnatter et al. 1993). There wase no notable increase in deaths from nervous system tumors overall (benign or malignant) through 1994 among workers employed in 1964–1983. Minor increases in the estimated risks of malignant brain tumors were found in refinery, upstream (exploration, drilling, production or pipeline), and office workers, whereas the estimate of this risk was less than unity (SMR 0.68, 95% CI 0.31–1.29) among marketing and distribution workers, who would be expected to have greater exposures to petroleum products than workers in other operating segments (Lewis et al. 2000b). In a study of workers hired more recently (1964–1994) by Imperial, the estimated incidence of or mortality from brain malignancies or any other nervoius system tumors were not remarkably increased in either men or women (Lewis et al. 2003).
A nationwide survey of service stations in Italy defined a cohort of 2,665 managers alive at the beginning of 1981. Following their mortality through 1992, the study authors found 250 deaths among the 2,308 men and 20 among the 357 women (Lagorio et al. 1994). The SMR for nervous system cancer was 2.14 (90% CI 0.93–4.21) for all service-station mangers. For small stations, where sales per employee (a surrogate of exposure) were greater, the risk (based on five observed cases, one of them a woman) was more pronounced (SMR 2.66, 90% CI 1.05–5.59); the observation of a single case among men who attended large service stations just exceeded the expectation of 0.9. The authors note that the station employees were exposed to a combination of hydrocarbons from fuels and combustion products.
Case-Control Studies
A case-control study was conducted to evaluation the relationship between glioma and occupational title (De Roos et al. 2003). Four hundred and eighty-nine cases were identified at three US hospitals. Controls were selected from patients admitted to the same hospitals for nonmalignant conditions. Exposure was assessed by questionnaire which was reviewed by an industrial hygienist. No increased risk was observed for gasoline station attendants (ever worked: OR 0.5, 95% CI 0.3–0.9).
A population-based case-control study of glioma, the most common form of primary malignant brain tumor in adults, was conducted in the San Francisco Bay area (Carozza et al. 2000). The estimated risk of glioma in those ever employed as petroleum or gas workers was 4.9 (95% CI 0.6–42.2), but no increase in the risk of glioma was found in service-station workers. For both occupational categories, the estimated ORs and CIs were virtually identical with or without a 10-year latent period.
Combustion Products
Table 4.34 presents the most relevant findings reviewed by the committee in drawing its conclusion on the possibility of an association between exposure to combustion products and brain cancer.
Case-Control Studies
The study by De Roos et al. (2003) that evaluated the relationship between glioma and occupational title did not find increased risk for car and light truck drivers (ever worked: OR 0.9, 95% CI 0.5–1.7) and heavy truck drivers (ever worked: OR 0.7, 95% CI 0.4–1.1). Railroad workers had a slight increase in risk (ever worked: OR 1.1, 95% CI 0.4–3.3), but the CI included the null and there were only 6 cases.
The case-control study of glioma in the San Francisco Bay area discussed above (Carozza et al. 2000) had similar negative findings for mechanics and motor-vehicle operators whether or not provision was made for a 10-year latent period. For occupations that entailed exposure to combustion products that the committee considered relevant to Gulf War veterans, the most increased risk estimate was for motor-vehicle operators exposed for at least 10 years without the requirement of a latent period (OR 2.1, 95% CI 0.7–6.2). Firefighters had an OR of 2.7 (95% CI 0.3–26.1), but they were presumed to be largely urban.
Conclusion
Several studies reported sporadic associations between fuel exposure and brain cancer (Carozza et al. 2000; Consonni et al. 1999; Divine et al. 1999a; Lagorio et al. 1994; Lewis et al. 2003), but none could be considered a high-quality study supported by an adequate exposure assessment. Data on combustion products and brain cancer were too sparse to determine whether an association exists.
The committee concludes, from its assessment of the epidemiologic literature, that there is inadequate/insufficient evidence to determine whether an association exists between exposure to fuels or combustion products and nervous system cancers.
OCULAR MELANOMA
Ocular melanoma (ICD-9 190) is a rare type of eye cancer that usually develops in the choroids, although 10% occur within the iris. Risk factors include coloration (particularly blue eye color), such inherited conditions as dysplastic nevus syndrome and oculodermal melanocytosis (nevus of Ota), and possibly sun exposure (ACS 2004d).
In 2000, there were 0.7 new case of ocular melanoma per 100,000 people (0.9 among men and 0.6 among women) and 0.1 death per 100,000 (0.1 among men and 0.1 among women) in the United States (Ries et al. 2004).
Fuels
The committee did not identify any relevant studies that examined the relationship between exposure to fuels and ocular melanoma.
Combustion Products
Table 4.35 presents the most relevant findings reviewed by the committee in drawing its conclusion on the possibility of an association between exposure to combustion products and ocular melanoma.
Case-Control Studies
Three studies of ocular melanoma were reviewed by the committee (Ajani et al. 1992; Guenel et al. 2001; Monarrez-Espino et al. 2002) all assessed exposure by using self-reported job titles. Each of these modest-size studies reported that occupations or industries involving exposure to combustion products were associated with increased risks of ocular melanoma with imprecise confidence intervals. Ajani et al. (1992) reported an OR of 1.23 (95% CI 0.55–2.74) in transportation, communications, and other public-utilities workers. Guenel et al. (2001) reported an OR of 1.4 (95% CI 0.5–3.8) in male transport equipment operators. Monarrez-Espino et al. (2002) reported an OR of 1.5 (95% CI 0.66–3.23) in male transportation-equipment operators and an OR of 2.5 (95% CI 0.94–6.58) in female station, engine, heavy equipment operators, and freight handlers.
Conclusion
No studies were identified that evaluated exposure to fuels and an association between increased risk of ocular melanoma. Three studies, all lacking adequately specific exposure assessment, reported increased, but imprecise risks of ocular melanoma in occupations related to transportation (Ajani et al. 1992; Guenel et al. 2001; Monarrez-Espino et al. 2002).
The committee concludes, from its assessment of the epidemiologic literature, that there is inadequate/insufficient evidence to determine whether an association exists between exposure to combustion products and ocular melanoma.
BLADDER CANCER
The bladder is lined with transitional and squamous cells. More than 90% of bladder cancers (ICD-9 188) arise in transitional cells, and squamous-cell carcinomas represent only about 8% (NCI, 2002). Because cells that line the renal pelvis and ureter are histologically similar to bladder epithelial cells, tumors of the renal pelvis (ICD-9 189.1), ureters (ICD-9 189.2), and urethra (ICD-9 189.3) are considered urothelial-cell tumors, as are primary tumors of the bladder. Renal-cell carcinomas are histologically distinct from tumors that arise from urothelial tissues, such as those in the renal pelvis. This section, however, addresses only bladder cancer (ICD-9 188) unless it is otherwise stated.
The major risk factor for bladder cancer is smoking. Demographic factors that have some influence on the occurrence of bladder cancer are race (highest in whites, lowest in Asians), increasing age, sex (males at higher risk), and family history. Chronic bladder inflammation due to infections, bladder or kidney stones, or parasites has been associated with bladder cancer. Known occupational risk factors include use of the drug cyclophosphamide, and exposure to aromatic amines, arsenic, and organic chemicals associated with manufacture of rubber, leather, textiles, and paint (ACS 2004o).
In 2000, there were 21.3 new cases of bladder cancer per 100,000 people (37.8 among men and 9.4 among women) and 4.3 deaths per 100,000 (7.6 among men and 2.3 among women) in the United States (Ries et al. 2004).
Fuels
Table 4.36 presents the most relevant findings reviewed by the committee in drawing its conclusion on the possibility of an association between exposure to fuels and bladder cancer. In the text below, the studies are discussed in roughly chronologic order, whereas more recent studies (with publications on a given study population grouped) are generally presented first in the table.
Case-Control Studies
In the earliest case-control study of bladder cancer reviewed by the committee (Cole et al. 1972), an industrial-hygiene-derived group of occupations associated with petroleum products was among 13 occupational classes into which subjects were categorized. When smoking and age were controlled for, no excess risk was observed among men ever or usually working in this petroleum-product group. Some later case-control studies of bladder cancer considered
employment in petroleum-related industries or occupations, as abstracted from work histories, among the possible exposures analyzed. Several found associations between petroleum-related entries in work histories and the occurrence of bladder cancer (Howe et al. 1980; Iscovich et al. 1987; Najem et al. 1982), and two found only imprecise indications of increased risks related to such industrial or occupational categories (Risch et al. 1988; Teschke et al. 1997). Using exposures to specific agents as recalled and reported by the subjects themselves, Mommsen and Aagard (1984) reported an increase associated with “work with oil or gasoline” (RR 2.71, 95% CI 1.18–6.17) but a less compelling increase associated with “work with kerosene or asphalt” (RR 3.12, 95% CI 0.88–11.00) (Mommsen et al. 1982). The committee did not regard the exposure assessments conducted in these case-control studies as sufficiently specific or reliable to be indicative themselves of an association between exposure to fuels and bladder cancer. The committee gave more weight to larger studies that included exposure analyses guided by expert understanding of the potential exposures involved in various industrial processes, as described below.
Participants in the National Cancer Institute (NCI) National Bladder Cancer Study (NBCS) were drawn from 10 centers and studied with a common protocol (Hartge et al. 1984). There were several reports from the individual centers—for example, Detroit (Silverman et al. 1983), New Jersey (Schoenberg et al. 1984), and Utah (Schumacher et al. 1989)—or from specific perspectives, such as mechanics (Smith et al. 1985), motor-vehicle exhaust-related occupations (Silverman et al. 1986), the chemical industry (Zahm et al. 1987), and racial differences (Schairer et al. 1988). The summary reports by (Silverman et al. 1989a, 1990, 1989b) on nonwhite men, white women, and white men are focused on analyses by industry and occupational titles with adjustment for smoking.
The analyses of the multicenter dataset with the most power were conducted on the large subsample of 2,100 white males who had bladder cancer and 3,874 white male population controls (Silverman et al. 1989b). For those ever employed in petroleum-processing, the increase in risk was marginally increased (RR 1.3, 95% CI 1.0–1.8); the largest risk was associated with the extraction of crude oil (RR 2.4, 95% CI 1.1–5.5). Three center-specific publications presented reanalyses involving about 62% of the white male subjects; the results were consistent with those above for petroleum-processing and a suggestion of increased risk among service-station workers, a category that had not been reported on in (Silverman et al. 1989b). In the publication on the 332 white men from the Utah study center (Schumacher et al. 1989), a slightly more increased risk of bladder cancer was reported for those who had worked at least 10 years in the “fuel industry”, but the estimate for this small subset was imprecise. In the New Jersey subset of 658 white men, Schoenberg et al. (1984) found virtually the same risk as seen in the full NBCS sample for refinery workers (again imprecise in the smaller sample) and a strong association in garage or gas-station workers (OR 2.35, 95% CI 1.47–3.78). In analyzing the Detroit subset of 303 white men, Silverman et al. (1983) found a large refining-related risk based on only six exposed subjects who had bladder cancer (RR 6.0, 95% CI 0.7–49.8) and a more modest increase in those ever employed in gasoline service (RR 1.6, 95% CI 0.8–3.5), which was further reduced when adjusted for smoking (RR 1.3).
In the NBCS subsample of 126 bladder-cancer cases in nonwhite men and their 383 controls, the risk of bladder cancer among petroleum workers (RR 2.1, 95% CI 0.5–9.2) or service-station workers (RR 1.6, 95% CI 0.5–4.9) was somewhat higher (Silverman et al. 1989a). Although the subsample of white women was larger (652 cases and 1,266 controls), there were
too few subjects employed in fuel-related jobs for analysis (Silverman et al. 1990). All the results from the NBCS are less compelling because the analyses were based only on industry or job title.
In a study of several types of cancer, Siemiatycki et al. (1987b) investigated the relationship between exposure to various fuels and 486 incident cases of bladder cancer in 29 Montreal hospitals and 2,196 other-cancer controls (excluding lung and kidney cancer). Exposure was categorized on the basis of industrial-hygiene review of occupational history. No increased risk of bladder cancer was attributable to exposure to aviation gasoline, jet fuel, diesel fuel, or heating oil; the risks posed by exposure to automotive gasoline, kerosene, and crude oil were only slightly above unity (Siemiatycki et al. 1987a). In a later analysis of this dataset focused specifically on bladder cancer (Siemiatycki et al. 1994), employment in the petroleum or coal-products industry was the sole exposure pertinent to fuels, and it showed no association with bladder cancer.
Using a record-linkage approach on the Swedish Cancer Environment Registry, Steineck et al. (1989) constructed a case-control study by identifying the 10,123 male bladder-cancer cases diagnosed in 1961–1979 that had also been listed in the 1960 national census. Controls were selected from that census. A JEM was applied to the job reported by each subject in that census with a note on the likelihood that the given job was predictive of exposure to a particular agent. There was no association of exposure with the risk of bladder cancer in men who had reported jobs deemed moderately or highly likely to involve exposure to gasoline.
Steineck et al. (1990a) gathered cases of cancer of the lower urinary tract (bladder, ureter, renal pelvis, and urethra) diagnosed in Stockholm County from 1985 to 1987 and population-based controls. Gasoline and various combustion products were among the occupational exposures assessed by an industrial hygienist on the basis of each participant’s work history. The 254 male subjects who had urothelial cancer were compared with 287 age-matched controls (Steineck et al. 1990b). After adjustment for age and smoking, the estimated risk of cancer associated with having worked with gasoline was somewhat increased (RR 1.4, 95% CI 0.7–2.9); the effect on risk apparently was more concentrated in the group considered to have the highest exposure (RR 2.5, 95% CI 0.8–7.5).
Of 1,716 incident bladder-cancer cases in people 40–85 years old identified in the State Health Registry of Iowa in 1986–1989, 1,135 men and 317 women were interviewed (Zheng et al. 2002); next of kin completed the questionnaires for 156 cases. Interviews were completed with 2,434 controls frequency-matched by sex and age group. A detailed occupational history was obtained for each job held for 5 years or more. Analyses were adjusted for smoking status, age, and family history of bladder cancer. On the basis of only seven exposed cases, men who had worked in the petroleum and coal-products industry or the petroleum-refining industry did not have an increased risk of bladder cancer. The estimated risk in garage and service-station workers was a bit high (OR 1.7, 95% CI 0.9–3.1). It was not possible to include the women in the analysis because of a lack of occupational exposure.
The European Merged Bladder Cancer Study (EMBCS) was a large effort that pooled data gathered at 11 European centers according to similar protocols in 1976–1996. There was one center each in Denmark and Greece; two each in France, Italy, and Spain; and three in Germany. Nine centers generated individual publications that considered employment in petroleum-related fields: Denmark (Jensen et al. 1987), France (1) (Clavel et al. 1994; Cordier et al. 1993), France (2) (Hours et al. 1994), Germany (1) (Claude et al. 1988; Kunze et al. 1992), Germany (3) (Pesch et al. 2000b), Greece (Rebelakos et al. 1985), Italy (1) (Vineis and Magnani 1985), Italy (2) (Porru et al. 1996), and Spain (1) (Gonzalez et al. 1989). The overall EMBCS sample was made
more uniform by limiting it to people 30–79 years old and to incident cases (only cases in those interviewed within 2 years of their diagnosis); this resulted in the exclusion of 755 male cases and 525 of their controls (Kogevinas et al. 2003) and 253 female cases and 357 of their controls (‘t Mannetje et al. 1999). To take advantage of the greater statistical power provided by the overall large sample, the committee decided to consider the findings in the pooled analyses on the 3,346 male cases and their 6,840 controls (Kogevinas et al. 2003) and on the 700 female cases and their 2,425 controls (‘t Mannetje et al. 1999). Occupations were recoded from the original work histories, and a JEM was applied to assess exposures to specific substances. On the basis of three exposed cases, the risk of bladder cancer was found not to be increased (when adjusted for age, smoking, and study center) in men ever employed as petroleum-refining workers (OR 0.52, 95% CI 0.10–2.69), the only fuel-related exposure presented; for the women, not even this occupational category was reported.
Reporting on fuel-related exposures was also quite sparse in publications concerning the individual study centers. In reporting on 658 male cases at the first French center (of whom 97 were excluded from the pooled study), Cordier et al. (1993) reported a heightened risk estimate (OR 4.04, 95% CI 0.78–21.03, based on seven exposed cases, p=0.10) in men who had worked in the petroleum-refining industry. In the first German center’s sample of 531 male cases (of whom 168 were excluded from the pooled study), Claude et al. (1988) reported no association between bladder cancer and having ever been employed as a service-station attendant (OR 0.33, 95% CI 0.04–2.87, based on one exposed case) or as an oil refinery worker (OR 1.50, 95% CI 0.25–8.87, based on three exposed cases). In the same German sample, however, Kunze et al. (1992) found that exposure to petroleum in the workplace (self-reported by 26% of the sample) was associated with an increased crude risk (OR 1.4, 95% CI 1.1–1.9); when adjusted for smoking, the risk increased (p for trend=0.01), although not monotonically, over duration of exposure. Despite its overall size, the pooled EMBCS sample analyzed by (Kogevinas et al. 2003) for men and by ‘t Mannetje et al. (1999) for women actually contains little information on fuel-related occupational exposures and bladder cancer.
Combustion Products
Table 4.37 presents the most relevant findings considered by the committee in drawing its conclusion on the possibility of an association between exposure to combustion products and bladder cancer.
Cohort Studies
Boffetta et al. (2001) used the Swedish Cancer Environment Registry developed by linking the Swedish Cancer Registry of all cancers diagnosed in 1971–1989 with records from the 1960 and 1970 Swedish censuses. According to industrial-hygiene criteria, each occupation and industry listed on the 1960 census was categorized for intensity and likelihood of exposure to diesel emissions. The rates of several cancers (including bladder cancer) in 1971–1989 in the diesel-exhaust cohort thus defined were compared with their incidences in the complementary non-diesel-exposed cohort. In both men and women, there was no indication of an association with bladder cancer.
The Netherlands Cohort Study was established to obtain detailed information on cancer risk factors, including occupational history, in a set of 58,279 men 55–69 years old in 1986 assembled from 204 municipal registries. Zeegers et al. (2001) conducted a nested case-control
study of this cohort by linking with cancer registries to identify 532 cohort members diagnosed through 1992 with urothelial cancer (including cancers of the ureter, renal pelvis, and urethra along with bladder cancers). A randomly selected subset of 1,630 men from the cohort (after elimination of those who had cancer other than skin cancer in 1986) served as controls. Industrial hygienists reviewed the occupational histories and derived cumulative estimates of exposure to PAHs and diesel exhaust and exposure to paints and aromatic amines. In the highest tertiles for both PAH and diesel-exhaust exposure, there were small increased risks (RR 1.18, 95% CI 0.62–2.24; RR 1.17, 95% CI 0.74–1.84, respectively). There was no evidence of dose-response relationships for bladder-cancer risk over the tertiles of PAH and diesel-exhaust exposure.
Case-Control Studies
As for fuel-related exposure, a number of case-control studies investigated the possibility of an association between exposure to combustion products and bladder or urothelial-cell cancers. Studies that approached exposure assessment only by addressing industry or occupation reported some suggestive findings, but they are too nonspecific as to exposure agent to be relied on in drawing a conclusion about a possible association with bladder cancer. For the transport occupations and industries related to driving and the railroads, there were reports of increased risk (Hoar and Hoover 1985; Howe et al. 1980; Iscovich et al. 1987) and reports of possibly less stable estimates of increased risk (Brownson et al. 1987; Decoufle and Stanislawczyk 1977; Notani et al. 1993; Risch et al. 1988). This situation was similar for mechanics. Brownson et al. (1987) had a positive finding, and several other researchers reported less certain increased risks of bladder cancer in those working in this field (Decoufle and Stanislawczyk 1977; Teschke et al. 1997). The findings on even these “core” combustion product occupations were not consistent across all studies, and they were found among a clutter of results for diverse types of ill-defined employment that might involve some exposure to combustion products.
NCI’s NBCS included 2,100 white men with bladder cancer at 10 US Surveillance, Epidemiology, and End Results centers whose exposure was categorized by industry and occupation (Silverman et al. 1989b). There were modest increases in risk among those who had ever been railroad workers (RR 1.3, 95% CI 0.9–2.0), mechanics (RR 1.2, 95% CI 1.0–1.4), or drivers (RR 1.2, 95% CI 1.1–1.4). In comparing the professional drivers among the white men with those who had never held an exhaust-related job, Silverman et al. (1986) found stronger results when the occupation was the subject’s “usual” occupation rather than merely one that he had “ever” held; dose-response relationships by duration of employment were demonstrated in those who had ever worked as truck or taxi drivers. Among nonwhite men (Silverman et al. 1989a), neither mechanics nor drivers had an increased risk, but an increased risk was observed in automobile mechanics (RR 1.4, 95% CI 0.4–4.4) and taxicab drivers or chauffers (RR 1.3, 95% CI 0.5–3.2). For white women (Silverman et al. 1990), the only occupation with exposure to combustion products that had enough subjects for analysis was motor-vehicle driver, for which the estimated risk was not meaningfully increased (RR 1.1, 95% CI 0.4–3.0). The size of this multicenter study compensates in part for its being limited to an analysis of occupations.
In the Iowa case-control study of bladder cancer (Zheng et al. 2002), men who had ever worked in 10 years or more in the railroad-transportation industry showed an increased risk of bladder cancer (OR 1.7, 95% CI 1.0–3.1). The “general automotive repair shops” industry and the occupation of mechanic or repairer also showed associations with bladder cancer in men, especially for those employed for more than 10 years (OR 3.4, 95% CI 1.3–9.0; OR 1.4, 95% CI 1.0–1.8, respectively). The estimated risks observed in men who had worked in the
transportation-services industry (OR 2.8, 95% CI 0.7–11.8) or held the job of driver (OR 1.3, 95% CI 0.9–1.8) were less certain. As for fuel exposure, there were no industries or occupations likely to have combustion-product exposure in which enough women had worked to merit analysis.
Considered from the perspective of individual industries or occupations, many classifications could involve exposure to combustion products, so a standard unifying approach for converting an entire work history into exposure (such as a JEM) would be extremely useful. Several studies reported equivocal increases in the risk of bladder cancer posed by exposure to diesel exhaust, either determined by self-reports (Howe et al. 1980; Risch et al. 1988) or derived from self-reports of “usual” occupation (Iyer et al. 1990). More-reliable risk estimates were generated in several studies, described below, that used more-comprehensive exposure-assessment methods informed by industrial hygienists’ understanding of the likelihood of exposure to particular substances in various jobs at different times.
Bonassi et al. (1989) contrasted the work histories of 121 men in Italy’s Bromida Valley who had been diagnosed with bladder cancer over a 10-year period with those of 342 age-matched community controls. Eleven occupations were categorized as having high risk on the basis of previous studies, and at least a year of work was required to be regarded as exposed. After adjustment for smoking, auto mechanic and truck driver had almost identical increased but imprecise risks. A JEM was used to partition the subjects into “definite”, “possible”, and unexposed classes for PAHs. After adjustment for smoking, the risk of bladder cancer was increased with possible PAH exposure (OR 1.63, 95% CI 0.95–2.83) and even more certain with definite PAH exposure (OR 2.20, 95% CI 1.12–4.38). Simultaneous adjustment for exposure to aromatic amines, however, slightly reduced the risk estimate for definite PAH exposure and diminished its precision (OR 2.14, 95% CI 0.82–5.60).
Steineck et al. (1990b) compared 254 Swedish men who had urothelial cancer (including an unspecified number of tumors of the renal epithelium) with 287 age-matched controls. An industrial hygienist estimated eight types of combustion product exposures on the basis of the subjects’ work histories: diesel or petrol exhaust and soot or combustion gases from coal, oil, or wood. The results (adjusted for age and smoking) were most suggestive for exposure to diesel exhaust (RR 1.7, 95% CI 0.9–3.3). There were patterns of increasing risk with greater exposure to petrol and diesel exhausts individually, and the effect appeared to be concentrated in the seven people who had been exposed moderately or highly to both agents (RR 7.1, 95% CI 0.9–58.8).
In the Montreal multicancer case-control study Siemiatycki et al. (1988) found no association between exposure to products of combustion of gasoline, diesel, jet fuels, coke, or liquid fuel and bladder cancer, but an association was seen between products of combustion of natural gas bladder cancer (OR 1.6, p<0.05). More-detailed analyses (Siemiatycki et al. 1994) yielded similar findings. For natural-gas combustion, all partitions of exposure scales (except duration) suggested a dose-response relationship, and the effect was most specifically associated with higher concentration. For the other industrial-hygiene-coded occupational exposures (to diesel exhaust, benzo[a]pyrene, or coal tar and pitch), no relationships with bladder cancer were found. The strongest association was for the motor-transport industry, but the effect was about the same whether employment had been for less than 10 years (OR 1.9, 95% CI 1.2–2.8) or for more than 10 years (OR 1.7, 95% CI 1.2–2.5).
The Swedish Cancer-Environment Registry (CER), which was used by Boffetta et al. (2001) as described above to define a diesel-exposure cohort, has also been the source for developing case-control studies. People employed in specific occupations as of the 1960 census
(and later the 1970 census) have been linked with incident cancers reported in the national cancer registry for 1961–1979 (and later for 1971–1989). Steineck et al. (1989) applied a JEM to 10,000 men whose bladder cancer was newly diagnosed in 1961–1979 and who had been reported as employed in 1960 census. They also reported results of 714 cancers of the renal epithelial tissues (cancers of the renal pelvis) separately, which would be expected to be included in the set of 824 cancers of the renal pelvis that McLaughlin et al. (1987) reported on by occupation in an article on this version of the CER, which also presented separate analyses on a set of renal-cell carcinomas (RCCs).
The original work histories from the 11 studies pooled in the EMBCS were coded according to a Finnish JEM aimed at estimating occupational exposures to PAHs and diesel exhaust. In contrasting the 3,346 male cases with their 6,840 controls, Kogevinas et al. (2003) found that each of the tertiles for PAH exposure had ORs greater than 1, demonstrating a dose-response relationship, culminating in an estimate of 1.23 for the high-exposure category (95% CI 1.07–1.40). Those who had ever worked as motor-vehicle drivers or mechanics showed slightly increased risks (adjusted for age, smoking, and study center); a subgroup of automobile mechanics had a more definitively increased risk (OR 1.38, 95% CI 1.02–1.87). The findings from the considerably smaller set of 700 female bladder-cancer subjects and their 2,425 controls were more limited (‘t Mannetje et al. 1999) because occupational exposures were minimal. Kogevinas et al. (2003) noted that higher risks were found in the earlier studies, perhaps implying an improvement in occupational exposure conditions in 1976–1996. The combination of those datasets into a unified analysis supports an association between exposure to the products combustion of petroleum-derived fuels and bladder cancer.
Some of the urothelial cases presented in Pesch et al. (2000b) were incorporated into the EMBCS (Kogevinas et al. 2003; ‘t Mannetje et al. 1999). However, nearly 30% of the 704 male cases and 50% of the 331 female cases had been excluded from the pooled analyses because they were prevalent cases or fell outside the age range. The publication was of particular interest to the committee because Pesch et al. used British, German, and their own task-defined JEMs to conduct detailed extractions of occupational exposure to combustion products. Again, there were not enough occupationally exposed women for the results to be precise. Only for “tar, pitch, and related products” among the men were all three JEMs applied; the British JEM appeared to be most liberal in attributing exposure (as was also the case for PAHs), and the task-based JEM most conservative. Nonetheless, the resulting risk estimates were similar in the two systems; the highest exposure category in each showed an effect to be likely (British JEM OR 1.6, 95% CI 1.1–2.3; task-based JEM OR 1.8, 95% CI 1.0–3.4). For PAHs, the British JEM, but not the task-based JEM, yielded increased risk estimates with a dose-response relationship, but for exhaust there was no clear indication of increased risk of bladder cancer. Where a contrast could be shown, the JEMs applied to subjects’ work histories inferred more exposure than did the self-assessments.
Similarly, with 97 case-control pairs eliminated for not meeting the eligibility criteria for the pooled study, the dataset of Clavel et al. (1994) was one of the two French studies incorporated into the EMBCS (Kogevinas et al. 2003). An extensive analysis of PAH exposure was performed for all 658 pairs of male bladder-cancer cases and hospital controls assembled and interviewed in 1984–1987. With adjustment for age, hospital, residence, ethnicity, smoking, and coffee consumption, exposure to PAHs was associated overall with bladder cancer (OR 1.3, 95% CI 1.0–1.7). Dose-response relationships were evident over most classifications of PAH exposure. For cumulative PAH exposure, however, the lowest category (containing almost 50%
of the exposed cases) had an increased risk (OR 1.7, 95% CI 1.2–2.4), almost as large as that for the much smaller highest exposure group (OR 1.8, 95% CI 0.8–3.9), whereas the intermediate cumulative exposure groups had lower estimated risks.
Additional Studies on Cancers of the Renal Pelvis
Of the analyses discussed above, Steineck et al. (1990b), Pesch et al. (2000b), and Zeegers et al. (2001) merged cancers of the renal epithelium with bladder cancers, and the others addressed only bladder cancers. The two studies discussed below conducted separate analyses of sets of cancers of the renal epithelium.
In conjunction with the bladder-cancer cases in Denmark that were pooled into the EMBCS (Kogevinas et al. 2003; ‘t Mannetje et al. 1999), Jensen et al. (1988) gathered a set of 96 cancers of the renal pelvis or ureter (none of the urethra) and hospital controls. A broad grouping (chemical, petrochemical, or plastics industry or exposure to gasoline or petroleum), which was related at least in part to fuel exposures, showed a risk for men and women combined. For the 60 male cases, increased smoking-adjusted risks were obtained for occupational exposure to coke or coal (RR 4.0, 95% CI 1.2–13.6) or to asphalt or tar (RR 5.5, 95% CI 1.6–19.6). Similarly, during the process of assembling the set of RCCs in Australia that were incorporated into the International Renal-Cell Cancer Study (IRCCS), McCredie and Stewart (1993) gathered 58 male and 89 female cases of renal pelvic cancer. With the exception of the PAH-related exposure related to having ever been employed in blast-furnace or coke-oven work, the exposures of interest are fuel-related. The age- and sex-adjusted risk associated with having been exposed to gasoline was increased, and the risks in two more categories were also increased: having ever been employed in the petroleum-refining industry (RR 2.97, 95% CI 1.10–8.02) and having ever been occupationally exposed to “other petroleum products”, which were said to include jet fuel, heating oil, kerosene, or diesel fuel (RR 2.16, 95% CI 1.44–4.08).
McLaughlin et al. (1987) and Steineck et al. (1989) reported on renal pelvic cancer cases diagnosed in 1961–1979 among men reported as employed in the 1960 census, as culled from the Swedish CER. The analysis of McLaughlin et al. (1987) was limited to industries and occupations listed in 1960 for 821 cases, whereas Steineck et al. (1989) performed a more rigorous exposure analysis by applying a JEM to this information for a set of about 100 fewer cases (probably because of the constraint that they were required to have been 20–64 years old in 1960). Some modest increases in risk were reported by both these record-linkage studies in association with exposures related to combustion products. Compared with the risk estimates associated with the same JEM-derived exposures on the much larger set of only bladder cancers (Steineck et al. 1989), only the estimates of an association with soot from oil, coal, or wood were somewhat higher (but still uncertain) for renal pelvic cancer; the risks of renal pelvic cancers posed by exposure to combustion gases from oil or coal were less than unity, whereas those of bladder cancer had suggested possible increases.
Conclusion
Although there was a suggestion of a relationship between fuel exposure and bladder cancer in some of the case-control studies that categorized exposure on the basis of expert review of job history, the relationship was not consistently increased in any study with detailed and specific exposure assessment. Associations were reported with work in petroleum-related industries and occupations in the NBCS (Silverman et al. 1989b), but these results were based on
broad occupational and industrial categories, and the true exposure to fuels is unknown. The large EMBCS, which pooled data from 11 European study centers, overall yielded a negative finding for petroleum refining as an occupation (Kogevinas et al. 2003). The individual northern German center (Kunze et al. 1992) reported an association with petroleum as an occupational exposure, but 32% of the cases in the sample were excluded from the pooled EMBCS because they were prevalent cases or fell outside the permissible age range. The committee concludes that the available epidemiologic data on exposure to fuels, which may be difficult to segregate entirely from exposure to combustion products in some studies, and bladder cancer is insufficient to conclude that there is a relationship between fuels and the occurrence of bladder cancer.
The committee concludes, from its assessment of the epidemiologic literature, that there is inadequate/insufficient evidence to determine whether an association exists between fuels and bladder cancer.
Studies assessing the relationship between exposure to combustion products and bladder cancer have also not been consistently positive, and no studies assessed exposure on the basis of measurements. However, a pooled analysis of occupation and bladder cancer in western Europe (Kogevinas et al. 2003) included 3,346 men who had bladder cancer and 6,840 controls. With adjustment for smoking, questionably increased risks were noted in exhaust-related occupations. A JEM was applied to the occupational histories to derive measures of exposure to PAHs, benzopyrene, and diesel-engine exhaust. Exposure was evaluated as the product of the prevalence of exposure and the average magnitude of exposure in each occupation. The risk increased with higher exposures to PAHs (OR 1.23, 95% CI 1.07–1.4 in the highest tertile and benzopyrene (OR 1.27, 95% CI 1.04–1.54) in the highest tertile. A slightly increased risk was observed for diesel exhaust. In a related study by Pesch et al. (2000b), which included some of the cases pooled in the European study, similar findings were noted with some of the JEM-derived exposures to exhausts and PAHs. Clavel et al. (1994), in cases also included in the pooled European study, carried out a more detailed assessment of PAH exposures based on expert review of work-history information and found apparently stable associations with average and cumulative PAH exposures and total duration of PAH exposures. The results taken together constitute limited or suggestive evidence of an association between combustion products and bladder cancer, but the lack of exposure measurements and the heterogeneity of results precludes classifying this association as sufficient.
The committee concludes, from its assessment of the epidemiologic literature, that there is limited/suggestive evidence to determine whether an association exists between combustion products and bladder cancer.
KIDNEY CANCER
Over 90% of kidney cancers (ICD-9 189) in adults are renal-cell carcinomas (RCCs) or adenocarcinomas (ICD-9 189.0) (ACS 2004r). Most other malignant kidney tumors are transitional-cell carcinomas that arise in the renal pelvis (ICD-9 189.1), ureter (ICD-9 189.2), or urethra (ICD-9 189.3); these are jointly referred to as urothelial carcinomas or cancers of the renal pelvis. Because they resemble bladder tumors in their behavior and microscopically, the studies that assess risk factors for cancers of the renal pelvis separately were considered with bladder cancers in the previous section. In this section, if researchers specifically addressed only
RCCs, that is indicated; otherwise, cancers of the renal pelvis were included in a more global class of kidney cancers that would have been dominated by RCCs.
Smoking and obesity are the major risk factors for kidney cancer. Other risk factors are diet, increasing age, male sex, some hereditary conditions (such as Von Hippel-Lindau disease and hereditary papillary renal-cell carcinoma), and dialysis treatment for kidney disease. Such medications as phenacetin and diuretics (or the high blood pressure that they are used to treat) have also been associated with RCC, as has occupational exposure to asbestos, cadmium, and some organic solvents (ACS 2004r).
In 2000, there were 12.1 new cases of cancer of the renal pelvis and kidney per 100,000 (16.9 among men and 8.3 among women) and 4.2 deaths per 100,000 (6.2 among men and 2.8 among women) in the United States (Ries et al. 2004).
During the 1980s, it was noted that kidney tumors in male rats occurred after chronic gasoline exposure by inhalation. Considerable attention was directed toward monitoring human populations exposed to gasoline for similar tumors. Detailed toxicologic investigations later determined that the carcinogenicity in male rats was attributable to a protein peculiar to them, so gasoline would not be a human renal carcinogen, at least by the same mechanism.
Fuels
Table 4.38 presents the most relevant findings considered by the committee in drawing its conclusion on the possibility of an association between exposure to fuels and kidney cancer. In the text below, the studies are discussed in roughly chronologic order, whereas more recent studies (with publications on a given population grouped) are generally presented first in the table’s sections by study design.
Cohort Studies
Wong et al. (1993) conducted a cohort mortality study in 18,135 US petroleum-distribution workers potentially exposed to gasoline. The assessment of exposure to hydrocarbons (HCs), both aromatic and aliphatic, was calibrated in parts per million for each job category in four periods (Smith et al. 1993). Several exposure variables (duration of exposure, time since first employment, job category, cumulative exposure, cumulative frequency of peak exposure, and year of first exposure) were analyzed separately for land-based and marine workers. The risk of kidney cancer was not increased overall (RR 0.73, 95% CI 0.47–1.09) nor did it show any sort of a dose-response relationship. A nested case-control study was conducted to investigate further whether this cancer might be associated with gasoline exposure in the land-based subpopulation of these distribution workers (Wong et al. 1999). The 12 cases of kidney cancer were each matched by age, sex, and company with up to five controls selected from the remainder of the cohort. Again, no relationship was found between kidney cancer and specific jobs ever held, duration of employment, duration of exposure, cumulative exposure, cumulative frequency of peak exposure, or year of first exposure.
A nested case-control study of whether kidney cancer is associated with exposure to HCs was conducted by identifying 100 cases of primary RCC in six petroleum-company cohorts at 36 refinery locations (Poole et al. 1993). The cases were identified by review of all 18,323 death certificates associated with the cohorts. For each case, four refinery-worker controls were selected who were alive and kidney-cancer-free at the time of the case’s diagnosis and who matched by employer, refinery location, and decade of birth. A team of industrial hygienists
assessed exposure by evaluating every job with respect to five classes of HCs associated with various refinery processes; they used three-point scales for intensity and for frequency (daily, weekly, and monthly) of exposure to each HC class. By apply the scales to the individual work-history records, they derived cumulative exposure scores for each HC class for every subject. RCC was not associated with having ever been exposed to any of the five specific petroleum-refinery HC classes or with cumulative exposure score or exposure duration.
Suggestive findings on kidney cancer in a cohort mortality study of workers at Exxon refineries in Louisiana, New Jersey, and Texas (Shallenberger et al. 1992) motivated conduct of a nested case-control study of kidney cancer diagnosed by 1990 among workers with at least 1 month of service in 1970–1982 (Gamble et al. 1996). A total or 37 confirmed RCCs or renal-cell adenocarcinomas occurred in 1970–1990; 32 of the patients had died by the time the study began. (Nine of the 32 cases, diagnosed at the Louisiana refinery in 1979–1992 and first reported by Hanis et al. (1982), were also included in the analysis of Poole et al. (1993) discussed above. Four controls per case were selected from among cohort members “at risk” (alive and cancer-free) on the date of the case’s diagnosis and frequency-matched on sex, race, and dates of birth and hire. A JEM constructed with the assistance of plant industrial hygienists was used to assess the potential intensity and duration of exposure to various classes of petroleum products, defined in terms of chain length, saturation, and whether aromatic. The cases had slightly higher mean cumulative exposure scores for the various HC categories. Workers exposed at the highest level had a 4- to 5-fold increase in risk of developing kidney cancer, but all the 95% CIs included the null value (with the lower limits ranging from 0.65 to 0.88 and the upper limits from 20.8 to 32.9 for various HC groups), and none of the HC categories showed a consistent dose-response relatoinship over quartiles of cumulative exposure. When analyses were adjusted for other risk factors—such as smoking, blood pressure, and body-mass index (BMI)—the risk estimates for each HC class generally increased, but the confidence intervals also widened. The risk associated with long tenure (over 38 years) was substantially increased but imprecise; the authors asserted that the trend over tenure was “close to significance” but gave no statistics.
Lewis et al. (2000b) found that the 41 kidney-cancer deaths observed in 1964–1994 among men who work for Imperial Oil in Canada any time in 1964–1983 were associated overall with a neutral SMR of 0.96 (95% CI 0.69–1.30); a somewhat increased risk was observed among distribution workers (SMR 1.14, 95% CI 0.64–1.88). Similarly, the 15 incident cases of kidney cancer diagnosed in 1969–1994 in the younger cohort of men who were hired in all sectors of the company in 1964–1994 (Lewis et al. 2003) corresponded closely to the incidence expected on the basis of rates in the general Canadian population (SIR 1.00, 95% CI 0.56–1.65).
Case-Control Studies
A population-based case-control study included 495 white residents (313 men and 182 women) of the Minneapolis-St. Paul standard metropolitan statistical area diagnosed with RCC in 1974–1979 and 714 controls selected from the general population matched on age and sex. Only exposures experienced before 1973 were analyzed. For 251 cases, the questionnaire eliciting occupational history and other possible risk characteristics had to be administered to proxies, so the “self-reports” of 25 suspected occupational exposures might be unreliable. McLaughlin et al. (1984) reported that exposure to “petroleum, tar, or pitch products” was the only one of them that showed an apparent association with renal cancer when adjusted only for age and smoking; the association remained high (OR for men 1.6, 95% CI 0.9–2.7; OR for women 4.6, 95% CI 0.4–51) when adjusted for all other risk factors considered (demographic,
medical, and dietary). In a later publication, McLaughlin et al. (1985) addressed petroleum-related occupational risks of the male subjects (313 cases and 428 controls) in greater detail. They controlled for potential confounding by age, smoking, BMI, drinking, country of ancestry, and phenacetin use. No trend in RCC was seen by years of employment in the petroleum occupations as a whole. In the subgroup of gasoline-station attendants, however, a modest trend with years of employment was observed.
In the Montreal multicancer case-control study, 181 men who had kidney cancer of any kind (ICD 189) were compared with the other 2,196 cancer cases remaining after the exclusion of lung and bladder cancers (Siemiatycki et al. 1987b). Siemiatycki et al. (1987a) addressed occupational exposures to petroleum-derived fuels, as coded from work histories. Adjusting for age, socioeconomic status, ethnicity, smoking, and blue- or white-collar job history led to imprecise estimates of increased risk posed by automotive gasoline, kerosene, diesel fuel, heating oil, and crude oil. Statistically significant screening results motivated more detailed logistic analysis of aviation gasoline (OR 3.1, 90% CI 1.5–6.5) and of jet fuel (OR 3.1, 90% CI 1.5–6.6); both showed increased risk, concentrated among six persons who had “substantial” exposure. The subset of 142 men who had RCC specifically was analyzed more intensely with respect to those two fuel exposures in comparison with population and cancer controls (Parent et al. 2000a). The adjusted ORs for RCC were 3.5 (95% CI 1.4–8.7) for jet fuel and 3.5 (95% CI 1.4–8.6) for aviation gasoline; and they were slightly higher for RCC than for kidney cancer in general.
Sharpe et al. (1989) conducted a case-control study of 164 male and female RCC cases diagnosed from January 1982 to June 1987 in nine hospitals in Montreal; they probably included many of the 181 male kidney-cancer (142 RCC) cases in the Montreal multicancer case-control study (Parent et al. 2000a, Siemiatycki et al. 1987a, Siemiatycki et al. 1988). In an effort to minimize recall bias, the control subjects were selected from patients who had hematuria but in whom urinary cancer had been ruled out. Having found no association between smoking history and RCC, the authors did not adjust other analyses for this factor. Self-reported occupational exposure to gasoline was associated with a slightly increased estimated risk of RCC (OR 1.09, 95% CI 0.55–2.15), and the risk estimate for kerosene exposure was higher but still imprecise (OR 2.04, 95% CI 0.69–6.28). Both findings are concordant with the results of Siemiatycki et al. (1987a) for those fuels.
Kadamani et al. (1989) gathered 210 RCC cases (142 male and 68 female) from 29 hospitals in Oklahoma City and Tulsa, Oklahoma that were newly diagnosed from July 1981 to August 1983. Controls matched by age and sex were recruited from the general population by random-digit dialing. Work histories were reviewed by two industrial hygienists who scored each job for its likely degree of HC exposure. From the job scores, a lifetime time-weighted average HC exposure index was derived for each subject; those who had any HC exposure were subdivided into low, moderate, and high groups. With adjustment only for weight, the women showed no increase in risk related to HC exposure (OR 0.7, 95% CI 0.3–1.4). An apparent increase in RCC (adjusted for weight and education) was found in the moderately exposed men (OR 2.7, 95% CI 1.2–6.5), but a clear increase was not observed among the highly exposed men (OR 1.6, 95% CI 0.7–3.6). Of the moderately exposed men, those under 60 years old were at the greatest risk for RCC (OR 3.0, p<0.05).
Asal et al. (1988a, 1988b) drew from the same source population with an additional six hospitals and 1 more year of observation to study 315 RCC cases. The cases were matched to both hospital and population controls. An analysis by industry with adjustment for age, smoking,
and weight found increases in the risk of RCC in both men (OR 4.3, 95% CI 1.7–10.9) and women (OR 1.6, 95% CI 0.4–6.5) who worked at least a year in petroleum refining and distribution (Asal et al. 1988a). In the full logistic model for RCC in males, the second-most predictive factor (after weight) was “petroleum work” (OR 6.6, 95% CI 2.3–19.2).
Partanen et al. (1991) interviewed 338 ever-employed people who had newly diagnosed RCC (the partition between males and females was not stated) in the Finnish Cancer Registry in 1977 and 1978. Each case had been matched by year of birth, sex, and survival status at the time of data-gathering to one or two responding controls drawn from the Population Register Centre, for a total of 484 controls. Job histories and other risk factors were obtained with mailed questionnaires completed by subjects or next of kin for deceased subjects. For both cases and controls, only about one-fourth of the subjects were alive. Industry and occupation were coded by international and Nordic standards, respectively, for each year from 1920 to 1968 (allowing a 10-year latent period). From that information, an industrial hygienist derived duration, magnitude, and cumulative amount of exposure to gasoline, diesel fuel (and other distilled fuel oils), PAHs, and six other agents. Exposed status was defined as at least 5 years of low-level exposure or at least 1 year of high-level exposure. There was good control for potential confounding by age, sex, obesity, smoking, and caffeine consumption. An increased OR for men and women combined was reported for gasoline (OR 1.72, 95% CI 1.03–2.87), but the increased estimate for “diesel fuels and other distilled fuel oils” was more uncertain (OR 1.20, 95% CI 0.63–2.27). ORs for men alone were slightly lower (1.63 and 1.15 for gasoline and diesel, respectively); 95% confidence limits included the null. The highest OR for men was for those exposed to gasoline without exposure to diesel (OR 2.05, 95% CI 1.05–3.98); the risk in men exposed to both categories of fuel was lower (OR 1.29), and the risk in men exposed only to diesel was not increased (OR 0.68). The authors concluded that they had found evidence of an association between exposure to gasoline and RCC.
Mandel et al. (1995) presented the overall results on occupational exposures and RCC from the IRCCS. This multicenter case-control study involved 1,732 RCC cases in men and women diagnosed in 1989–1991 in five countries. Controls were all population-based, but they were identified in different ways in the separate centers. The questionnaires used by the different study centers to determine exposures also varied somewhat in level of detail. The pooled analysis considered only occupations and exposures that were common to all centers, and it controlled for age, smoking, BMI, study center, and subjects’ level of education. Mandel et al. (1995) reported comprehensive adjusted RRs among all the men in the IRCCS (1,050 cases and 1,429 controls) for several types of exposure to petroleum: oil-refinery workers (RR 1.3, 95% CI 0.6–2.4), gas-station attendants (RR 1.3, 95% CI 0.9–1.9), and those who had self-reported exposure to gasoline (RR 1.6, 95% CI 1.2–2.0) or to jet fuel, heating oil, kerosene, or diesel fuel (RR 1.6, 95% CI 1.3–2.1, and a positive dose-response relationship). The risk of RCC was not associated with number of years worked in occupations involving gasoline exposure, and the gasoline-related risks were substantially diminished by adjusting for the other petroleum products noted above, so the authors concluded that the study was negative for an association between gasoline and RCC.
Pesch et al. (2000a) identified RCC cases newly diagnosed in 1991–1995 in five regions of Germany. The sample consisted of 570 male cases and 365 female cases interviewed in the hospital (representing a response rate of 88%) and 2,650 male and 1,648 female controls (71% response rate) matched on sex, age, and region and interviewed at home. In addition to applying both the British and German JEMs, the researchers derived a third matrix for exposure
estimation that incorporated information on tasks performed within jobs. For every subject, separate exposure indexes were derived for the exposure agents of interest on the basis of duration, probability, and intensity as characterized with each of the three JEMs. For analysis, the cases’ indexes were partitioned into four groups at the 30th, 60th, and 90th percentiles of the exposed controls’ distribution. For the occupational category “production and use of petroleum products”, which was said to include “transport and use of mineral oils and fuel”, the males were found to have slight increases in risk associated with the higher two categories of duration (OR 1.1, 95% CI 0.3–1.1; and OR 1.3, 95% CI 0.6–2.9, respectively).
Combustion Products
Table 4.39 presents the most relevant findings considered by the committee in drawing its conclusion on the possibility of an association between exposure to combustion products and kidney cancer.
Cohort Studies
As described in connection with bladder cancer, Boffetta et al. (2001) used the Swedish CER of all cancers diagnosed in 1971–1989 and records from the 1960 and 1970 Swedish censuses and applied industrial-hygiene criteria to occupations and industries listed on the 1960 census to define a cohort occupationally exposed to diesel emissions. The incidences of several cancers (including kidney cancer) in 1971–1989 in this cohort were compared with incidences in the complementary non-diesel-exposed cohort. In the small set (1,479) of women exposed to diesel exhaust, there was no indication of an association with the occurrence of kidney cancer. In the large sample (54,404) of men exposed to diesel exhaust, however, there was a slight but seemingly real increase in the risk of kidney cancer (SIR 1.06, 95% CI 1.02–1.11, adjusted only for age).
Case-Control Studies
McLaughlin et al. (1987) also used the Swedish CER to define a cohort of men employed in 1960. A search for them in the Swedish tumor registry in 1961–1979 revealed 7,405 RCC cases. There was an increased crude risk of RCC among men employed in the automobile-transportation industry in 1960 (OR 1.33, 95% CI 1.03–1.70, calculated by the committee from numbers in the article), but the overall ORs for industries and occupations with the potential for combustion-product exposure were not consistently increased.
Associations with several occupational exposures involving exhaust and combustion products were also investigated in the Montreal multicancer case-control dataset (Siemiatycki et al. 1988). No definitive associations were found between any of the agents and kidney cancer (in general). The most common exposure (to gasoline exhaust) yielded the strongest indication of increased risks (OR 1.2, 90% CI 0.9–1.4), but the pattern observed in connection with duration and intensity did not suggest a dose-response relationship. Jet-fuel exhaust showed the strongest association (OR 1.4, 90% CI 0.5–3.9). On the basis of the same four cases (which probably also constitute a subset of the people exposed to aviation gasoline and jet fuel), the reanalysis of the dataset for RCC specifically (Parent et al. 2000a) found a somewhat more intense risk for jet-fuel exhaust (OR 2.7, 95% CI 0.9–8.1). Parent et al. (2000a) reported that there was little to suggest an association between motor transport as an industry and RCC (OR 1.0, 95% CI 0.6–1.8) or between motor transport as an occupation and RCC (OR 1.1, 95% CI 0.7–1.8).
The study of 164 RCC cases in Montreal reported by Sharpe et al. (1989) appears to overlap with the Montreal multicancer study discussed above (Parent et al. 2000a; Siemiatycki et al. 1987a, 1988). There was a strong signal for exposure to PAH-laden tar or pitch (OR 9.29, 95% CI 1.16–74.20, p<0.02). The risks posed by occupational exposure to burning coke (OR 2.0, 95% CI 0.49–8.14) or burning coal (OR 2.54, 95% CI 0.96–6.99) were somewhat increased. When integrated with domestic exposure, however, a fairly strong dose-response relationship (p<0.025) was found for exposure to burning coal.
The Finnish population-based case-control study of RCCs of Partanen et al. (1991) reported mildly increased risks among men who worked for more than 5 years in the “transportation and storage” industry (OR 1.13, 95% CI 0.63–2.02) or in transportation occupations (OR 1.09, 95% CI 0.59–2.00) compared with those who never held such jobs in 1920–1968. A small increase in risk was observed among men who had been occupationally exposed to PAHs (OR 1.21, 95% CI 0.43–3.45). Those results provide some slight evidence of a combustion-product effect in association with RCC.
The finding in male gas-station attendants (RR 1.3, 95% CI 0.9–1.9) reported by Mandel et al. (1995) for the entire IRCCS, as discussed above in conjunction with fuels, could also be interpreted as evidence of a relationship between motor-vehicle exhaust and RCC. And the finding in men who had worked in the blast-furnace and coke-oven industry (RR 1.7, 95% CI 1.1–2.7) is evidence of a relationship between PAH exposure and RCC.
Mellemgaard et al. (1994) reported on occupational risk factors in the Danish subpopulation of the IRCCS, which comprised 368 RCC cases (226 men and 142 women) diagnosed in 1989–1992. Controls matched on sex and age in 5-year intervals were drawn from the Central Population Register. Exposures were determined with an interview conducted in a subject’s home; occupation was encoded according to the International Standard Classification of Occupation and Industry (ISCOI) by the Standard Industrial Classification. The analysis controlled for age, BMI, and smoking history. In addition to occupational risks similar to those reported on by Mandel et al. (1995) for the entire IRCCS, Danish men who were truck drivers for at least a year (at least 10 years before being interviewed) had an increased risk of RCC (OR 3.1, 95% CI 1.3–7.7).
Schlehofer et al. (1995) reported on the occupational risks observed for the 185 male RCC cases and 192 controls selected from among the residents of Heidelberg, Germany, the site of another participating center in the IRCCS. In addition to the exposure reported on by Mandel et al. (1995), this group reported an apparent increase in the risk of RCC in men who worked in jobs with exposure to exhaust gas for at least 5 years (RR 1.82, 95% CI 1.03–3.22).
The population-based case-control study of RCC in five regions of Germany (Pesch et al. 2000a) used three JEMs (including one that went down to the level of tasks within jobs) to generate estimates of considerably more combustion-related exposures than the single result reported above in the section on exposures to fuels. The grouping “railway brakemen, signalmen, and shunters” was among the seven occupations that had positive results (OR 6.2, 95% CI 1.6–23.4), but, in contrast with the other six positive occupations, too few women had the jobs to permit a comparison that might be informative about the stability of the result. The findings for the occupation of motor-vehicle driver were essentially negative for both men and women. There was a suggestion of a dose-response relationship for exposure of both men and women to “tar, pitch, mineral oil” in the British JEM, but only for women at the highest exposure was the increased risk marginally stable (OR 2.1, 95% CI 1.0–4.5). For PAHs, the British JEM indicated somewhat increased risks of RCC in both men and women but task-JEM-generated risk
estimates uniformly less than 1.0 in men (no results were presented for women). In several additional case-control studies, the risk of kidney cancer (or specifically RCC) was examined in relation to various exposures associated with combustion products without addressing in isolation any possible risks posed by fuels.
Several other case-control studies reviewed by the committee contained results of interest but were considered less reliable, largely because of the self-reported or less agent-specific nature of their exposure assessments. Exposures to a melange of possibly PAH-containing substances were reported by two of these additional case-control studies.
McLaughlin et al. (1984) conducted a traditional case-control study of RCC cases gathered in the Minneapolis-St. Paul area of Minnesota. They reported increased age- and smoking-adjusted risks in both women (OR 4.6, 95% CI 0.4–125.3) and men (OR 1.7, 95% CI 1.0–2.9) who had self-reported exposure to the rather nonspecific agent “petroleum, tar, and pitch products”. When adjusted for other potential confounding factors, the estimated risk in men exposed to the PAH-containing products was reduced (OR 1.6, 95% CI 0.9–2.7). The sample of working men was large enough to permit analysis by duration of exposure, which showed the increased risk to be concentrated among those who had 20 years or more of self-reported exposure (OR 2.6, 95% CI 1.2–5.7).
As part of Canada’s National Enhanced Cancer Surveillance System (NECSS), Hu et al. (2002) obtained completed questionnaires from 1,279 people (691 men and 588 women) who had newly diagnosed RCC in 1994–1997 in eight provinces (excluding Quebec). A total of 5,380 cancer-free controls (2,704 men and 2,676 women) were assembled from the provinces, frequency matched on age and sex to the overall distribution in the NECSS database of 18 cancer types. The grouping “coal tar, soot, pitch, creosote, asphalt” was one of 17 occupational exposures about which the respondents were asked. Adjusted for age, province, education, BMI, tobacco and alcohol use, and meat consumption, an association between this collection of PAH-bearing agents and RCC was evident in men (OR 1.4, 95% CI 1.1–1.8); in women, an estimated increase of similar magnitude was not nearly as certain (OR 1.3, 95% CI 0.7–2.3).
Four of the additional studies reported risks of renal cancer in association with having worked as a vehicle driver.
The male RCC subjects in the Oklahoma case-control study were also contrasted with their population controls by longest-held occupation with adjustment for age, smoking, and weight. Having a longest-held occupation of “operative”, a category noted to have a high prevalence of truck drivers, was found to be associated with the occurrence of RCC (OR 2.0, 95% CI 1.1–3.5) (Asal et al. 1988a).
Hospitals that report newly diagnosed cancers to the Missouri Cancer Registry follow a standardized protocol to gather information on smoking, alcohol use, and occupational history, but the details of the procedure were not reported. Brownson (1988) assembled the 205 white male RCC cases diagnosed from July 1984 to June 1986 and compared them with the 615 white men reported to have cancers not related to smoking (that is, excluding oral, pancreatic, laryngeal, lung, and bladder cancers). Analyses of usual occupation vs all other occupations—adjusted for age, smoking, and alcohol use—found increased risks in automobile mechanics (OR 1.8, 95% CI 0.4–2.0), machinists (OR 2.2, 95% CI 0.5–10.3), and drivers of heavy trucks (OR 3.1, 95% CI 1.1–8.5). The available data apparently were not detailed enough to permit investigation of a full spectrum of demographic and medical factors in conjunction with occupation or to pursue dose-response issues.
Auperin et al. (1994) matched 138 male RCC cases diagnosed in 10 French hospitals in 1987–1991 with 107 cancer controls and 128 noncancer controls, matching by sex, age, hospital, and interviewer. Complete occupational histories were blindly converted into ISCOI codes. After further adjustment for education, smoking, and the Quetelet index of height to weight before diagnosis, no increase in risk (OR 0.5, 95% CI 0.2–1.6) was found in men who had ever been transport-equipment operators, the only combustion-product-related occupation reported on, compared with the pooled cancer and noncancer hospital controls.
Delahunt et al. (1995) compared 710 men who had RCC entered with an active occupation code into the New Zealand Cancer Registry in 1978–1986 with 12,756 employed men who had non-urinary-tract cancers diagnosed during the same period. A crude increase in risk of RCC in firefighters (urban or forest application not specified) was intensified by adjusting for age and smoking status (RR 4.69, 95% CI 2.47–8.93). In transportation-equipment operators, however, there was no observed increase in risk (RR 0.91, 95% CI 0.63–1.32, unadjusted).
Conclusion
No key study that was positive for an association between exposure to fuels and kidney cancer was identified, but the uniformly negative results of the nested case-control study (Poole et al. 1993) of a comprehensive sample of RCC cases in the petroleum industry with excellent exposure assessment were compelling.
Although some studies of exposure to combustion products and kidney cancer suggested a possible association based on job title, the results were not consistently positive.
The committee concludes, from its assessment of the epidemiologic literature, that there is inadequate/insufficient evidence to determine whether an association exists between fuels or combustion products and kidney cancer.
NON-HODGKIN’S LYMPHOMA
Non-Hodgkin’s lymphoma (NHL, ICD-9 200, 202) is a cancer originating in the B cells or, less frequently, the T cells of the lymphatic tissue (ACS 2004k). It encompasses the many types of lymphoma that remain after the exclusion of the B-cell lymphoma known as Hodgkin’s disease (HD) and is characterized by Reed-Sternberg cells (ICD-9 201). Within the evolving classification systems for lymphohematopoietic cancers overall, there have been a series of systems just for NHL. In ICD-9 coding, those cancers are subdivided within ICD-9 200 and ICD-9 202. The nonconstancy in the terminology and coding for reporting diagnoses of or deaths from this family of diseases complicates epidemiologic research on their etiology. Many risk factors have been identified for NHL: genetic or acquired defects of the immune system; infection by HIV, related T-cell viruses, or Epstein-Barr virus or by some bacteria (such as Heliobacter pylori); aging; obesity, the only recognized “lifestyle” factor; radiation; chemotherapy drugs; and possibly some chemicals, with benzene, herbicides, and insecticides most often implicated.
In 2000, there were 19.0 new cases of non-Hodgkin’s lymphoma per 100,000 (23.4 among men and 15.4 among women) and 8.2 deaths per 100,000 (10.3 among men and 6.7 among women) in the US (Ries et al., 2004).
Fuels
Table 4.40 presents the most relevant findings considered by the committee in drawing its conclusion on the possibility of an association between exposure to fuels and NHL, presented in reverse chronologic order within type of study design.
Cohort Studies
In conjunction with a detailed exposure assessment of service-station attendants in Italy, Lagorio et al. (1993, 1994) tracked the mortality experience through 1992 of 2,308 men who had been service-station managers in 1980. With only three cases of death due to NHL, the estimated increase in mortality risk was imprecise (SMR 1.73, 90% CI 0.47–4.48).
Jarvholm et al. (1997) investigated cancer morbidity and mortality in a cohort of 4,128 male Swedish petroleum-industry workers by screening the Swedish cancer registry and death certificates. Statistics broken down by site were not presented for cancer mortality, and the incidence information was grouped for all lymphomas (ICD-9 200–202). Exposures were determined from job titles and supported by limited air monitoring of work areas and personal-exposure monitoring, which used benzene concentration as an index rather than a more global measure of HC concentrations. With nine lymphomas observed, the risk was not increased overall (SIR 0.93, 90% CI 0.48–1.6), and there was no suggestion of an increase with duration and latency.
A large cohort of Canadian workers for Imperial Oil did not show an increase in overall mortality from NHL through 1994 among men or women who had worked there any time from 1964 to 1983 (Lewis et al. 2000b). A slight increase among men in the marketing and distribution sector (SMR 1.12, 95% CI 0.65–1.79) showed no relationship to cumulative exposure to total HCs in a nested case-control study (Schnatter et al. 1996). Similarly, among the younger, overlapping cohort of 17,230 men in the entire company who had been first hired in 1964–1994, the incidence of NHL in 1969–1994 was not increased on the basis of 20 incident cases (Lewis et al. 2003).
On the basis of a positive finding for lymphohaematopoietic malignancies in a cohort-mortality study, Lewis et al. (2000a) and Huebner et al. (2000) followed up the incidence of such cancers among 8,942 employees who worked at an Exxon Corporation facility (a combined refinery and chemical plant) in Baton Rouge, Louisiana, in 1970–1992. Work histories from company payroll records were reviewed to assign workers to the occupation and unit where each spent most of his working time. Information on potential confounding factors was not consistently available. Cancers newly diagnosed in 1983–1994 were ascertained from the Louisiana cancer registry. There were 22 cases of NHL in men (SIR 1.06, 95% CI 0.67–1.61) with an indication that any excess occurred among those first employed before 1950 (SIR 1.44, 95% CI 0.85–2.27).
Case-Control Studies
In the Montreal multicancer case-control study of 206 men who had NHL, Siemiatiycki et al. (1987a) found no relationship between exposure to any of seven petroleum-derived fuels and this form of cancer.
Francheschi et al. (1989) interviewed 208 patients who had histologically confirmed NHL and were treated at a hospital in northeast Italy from June 1985 to March 1988. Their self-reported exposures were compared with those of 401 hospital controls who had acute conditions.
Adjusted for age and sex, the estimated risk of NHL in “petrochemical workers” (“chemical workers” were reported on separately) was somewhat increased (RR 1.83, 95% CI 0.87–3.84).
Blair et al. (1993) assembled white, male NHL cases diagnosed in 1980–1983 from the Iowa State Health Registry and from a surveillance network of hospitals in Minnesota. They interviewed 622 of them (or next of kin of 13% who were deceased) and 820 population controls (or next of kin) who were free of lymphohematopoietic cancer and matched by state, age, and year of death. With adjustment for age, state, smoking, family history of lymphoproliferative diseases, exposure to agricultural pesticides, hair-dye use, and response by next of kin, the risk associated with having worked in the petroleum-refining industry for at least 1 year was questionable (SIR 1.6, 95% CI 0.5–5.8).
Combustion Products
Table 4.41 presents the most relevant findings considered by the committee in drawing its conclusion on the possibility of an association between exposure to combustion products and NHL, presented in reverse chronologic order within type of study design.
Cohort Study
Boffetta et al. (1988) tracked the vital status of participants in the ACS II prospective cohort 2 years after enrollment, when detailed information that included a detailed occupational history had been gathered. With adjustment for age, smoking, and other occupational exposure, lymphomas considered together (ICD-9 200–202) showed no increase in risk (RR 0.92) associated with self-reported exposure to diesel-engine exhaust in men 40–79 years old at the time of enrollment.
Case-Control Studies
An early occupational case-control study was constructed by reviewing medical records of patients in 1956–1965 at Roswell Park Memorial Institute (Decoufle and Stanislawczyk 1977; Viadana et al. 1976). When all lymphomas were considered together, locomotive engineer or fireman was the only exhaust-related occupation that showed an intensified (but still imprecise) risk when limited to those with at least 5 years of exposure (RR 2.13).
The Montreal multicancer case-control study’s analysis of 206 men who had NHL showed only a modest increased risk posed by exposure to jet-fuel exhaust (OR 1.7, 95% CI 0.5–5.2) on the basis of four exposed cases (Siemiatycki et al. 1988).
The case-control study of NHL in Iowa and Minnesota (Blair et al. 1993) focused on agricultural exposure, but it also reported on some exposures related to combustion products derived by application of a JEM to each subject’s work history. The risk estimates for NHL associated with exposure to gasoline or diesel exhaust, to asphalt or creosote, or to oils or greases showed little deviation from unity; for each of these, the risk was slightly greater for high-intensity exposure.
Using the NECSS, Mao et al. (2000) identified histologically confirmed cases of NHL diagnosed in eight Canadian provinces in 1994–1997. Completed mailed questionnaires were received from 764 male cases, 705 female cases, and 5,073 cancer-free population controls that were frequency-matched for age and sex. The analyses of the self-reported exposures were adjusted for age, province, and BMI. Both the men (OR 1.2, 95% CI 0.9–1.5) and the women (OR 1.3, 95% CI 0.7–2.3) had somewhat increased estimated risks of NHL in association with
self-reported exposure to coal tar, soot, pitch, creosote, or asphalt. Exposure to mineral, cutting, or lubricating oils (which are often considered vehicles for PAH exposure) posed a marginally increased risk among the men (OR 1.3, 95% CI 1.0–1.5), but not among the women (OR 0.8, 95% CI 0.4–1.4).
In the study of 12 areas of Italy, the only exposure reported by Costantini et al. (2001) of possible relevance to a relationship of exposure to combustion products with NHL was having worked as a transport operator. The occurrence of NHL, also including chronic lymphocytic leukemia (CLL), in men was not related to having worked in this capacity (OR 0.9, 95% CI 0.7–1.3).
Several studies linking national censuses with tumor registries have given some suggestion of a relationship between the transport occupations reported in the census and NHL. In Sweden, the risk in male truck drivers was increased (SIR 1.4, p<0.05) (Linet et al. 1993), but the risk in women employed in the transport industry was not increased (Linet et al. 1994). A similar study in Denmark (Skov and Lynge 1991) found less-certain increases in both men (RR 1.12, 95% CI 0.91–1.38) and women (RR 1.24, 95% CI 0.40–2.90) who were unskilled transport workers.
Conclusion
Although some risk estimates were greater than unity, the reasonably well-conducted studies on NHL had no firmly positive findings. In the petroleum-refining and -distribution cohort with the most thorough quantitative exposure assessment, a nested case-control study found no indication of a dose-response relationship (Schnatter et al. 1996). Similarly, in the case-control study with the most objective exposure assessment, there was no indication of an association with any of the fuels (Siemiatycki et al. 1987a) or their combustion products (Siemiatycki et al. 1988).
The committee concludes, from its assessment of the epidemiologic literature, that there is inadequate/insufficient evidence to determine whether an association exists between exposure to fuels or combustion products and NHL.
HODGKIN’S DISEASE
Hodgkin’s disease (HD, also called Hodgkin’s lymphoma) (ICD-9 201) is a cancer that originates in the lymphatic tissue (ACS 2004k). HD is a B-cell lymphoma characterized by microscopically identifiable Reed-Sternberg cells; all other cancers of the lymphatic tissues are called non-Hodgkin’s lymphoma. The only known risk factors for HD are infectious mononucleosis (caused by the Epstein-Barr virus) and lowered immunity. HD has not been associated with family history, diet, or environmental exposure.
In 2000, there were 2.7 new cases of Hodgkin’s disease per 100,000 people (3.3 among men and 2.3 among women) and 0.5 death per 100,000 (0.6 among men and 0.4 among women) in the United States (Ries et al. 2004).
Fuels
Table 4.42 presents the most relevant findings considered by the committee in drawing its conclusion on the possibility of an association between exposure to fuels and HD, in reverse chronologic order within type of study design.
Cohort Studies
As noted above in the section on NHL, in their investigation of cancer morbidity among Swedish petroleum industry workers, Jarvholm et al. (1997) found no association between exposure to fuels and the incidence of all types of lymphoma combined.
A cohort study of mortality in 1949–1982 was conducted to evaluate cancer risk among 1,583 workers employed in an oil refinery near Milan, Italy, that converted crude oil into a variety of HCs (solvents, fuel, and lubricants) (Bertazzi et al. 1989). A later study extended followup to 1991 (for a total of 39,857 person-years and 352 deaths) (Consonni et al. 1999). The observation of two deaths from HD in 1949–1991 resulted in an increased but imprecise estimate of risk (SMR 1.51, 95% CI 0.17–5.44).
On the basis of a finding of lymphohematopoietic malignancies in a cohort mortality study (Lewis et al. 2000a), Huebner et al. (2000) followed up the incidence of such cancers among 8,942 employees working at an Exxon Corporation facility (a combined refinery and chemical plant) in Baton Rouge, Louisiana, in 1970–1992. Work histories from company payroll records were reviewed to assign each worker to the occupation and unit where he spent most of his working time. Information on potential confounding factors was not consistently available. A search of the Louisiana cancer registry for newly diagnosed cancers in 1983–1994 found four cases of HD among the men in this cohort (SIR 1.54, 95% CI 0.42–3.95), without any clear relationship to job title or year first employed.
Mortality and morbidity associated with HD have been assessed among the petroleum workers of Imperial Oil Limited in Canada (Hanis et al. 1979; Lewis et al. 2000b; Schnatter et al. 1993). In considering mortality from 1964 to 1994, Lewis et al. (2000b) found no increase in the risk of HD for men or women (SMR 0.68, 95% CI 0.28–1.41; SMR 0.79, 95% CI 0.02–4.42; respectively). There was no association between working in any particular division of the industry and HD. Lewis et al. (2003) studied cancer incidence in a younger, overlapping cohort of 17,230 men who had been first hired into any sector of the company in 1964–1994; on the basis of 11 incident cases, the incidence of HD in 1969–1994 was not notably increased (SIR 1.05, 95% CI 0.52–1.88).
Case-Control Study
In the Canadian multicancer case-control study, Fritschi and Siemiatiycki (1996b) reported no fuel-related results related to the small set of 54 HD cases.
Combustion Products
Table 4.43 presents the most relevant findings considered by the committee in drawing its conclusion on the possibility of an association between exposure to combustion products and HD.
Cohort Study
As noted above in the section on NHL, the 2-year followup of the ACS prospective cohort yielded negative findings on an association between self-reported diesel exposure and all lymphomas; a nonspecified number of HD deaths were included in that category (Boffetta et al. 1988).
Case-Control Studies
Similarly, the negative results related to combustion-product-related occupations of the case-control study of patients at the Roswell Park Memorial Institute concerned all lymphomas analyzed together (Decoufle and Stanislawczyk 1977; Viadana et al. 1976).
With only 54 male HD cases, the only finding from the Canadian multicancer case-control study that was at all related to combustion products was an imprecise increased risk posed by exposure to cooking fumes (Fritschi and Siemiatycki 1996b).
In the study of 12 areas of Italy (Costantini et al. 2001), the only reported exposure of possible relevance to the influence of combustion products on HD was the occupation of transport operator. The finding in men was entirely negative (OR 0.8, 95% CI 0.4–1.7).
Conclusion
Overall, the studies described here are limited by their small numbers of cases and the nonspecificity of their exposure assessments. The studies of workers at the Exxon chemical and refinery plant in Baton Rouge (Huebner et al. 2000) and of Italian refinery workers (Consonni et al. 1999) reported similar 50% increases in the estimated risk of HD after exposure to petroleum-related products, but both were imprecise, and neither showed a clear relationship to a specific job or to duration of employment.
In the case of combustion products, there is virtually no information beyond what is shared with NHL in analyses of all lymphomas together.
The committee concludes, from its assessment of the epidemiologic literature, that there is inadequate/insufficient evidence to determine whether an association exists between exposure to fuels or combustion products and Hodgkin’s disease.
MULTIPLE MYELOMA
Multiple myeloma (ICD-9 203) is a type of cancer formed by malignant plasma cells (ACS 20041). The overgrowth of plasma cells can produce tumors in several sites, including the soft interior of the bone marrow. So far, few risk factors for multiple myeloma have been identified. Known risk factors include increased age, race, radiation exposure, family history, some plasma-cell diseases, and some occupational exposures.
In 2000, there were 5.5 new cases of multiple myeloma per 100,000 people (6.8 among men and 4.5 among women) and 3.8 deaths per 100,000 (4.7 among men and 3.3 among women) in the United States (Ries et al. 2004).
Fuels
Table 4.44 presents the most relevant findings considered by the committee in drawing its conclusion on the possibility of an association between exposure to fuels and multiple myeloma (in reverse chronologic order within type of study design).
Cohort Studies
A retrospective cohort study examined mortality through 1989 in 9,026 petroleum-product distribution workers who worked for at least 1 year in land-based terminals for four US companies in 1946–1985 (Wong et al. 1993). Using available industrial-hygiene data, Smith et al. (1993) derived a detailed JEM in terms of total HCs for the tasks performed by distribution workers throughout this period and used it to estimate cumulative lifetime and peak exposures for the people in the cohort. Cases of myeloma were not noted separately, but there was no relationship to total HC exposure for the 18 deaths from cancers of “other lymphatic tissues” (ICD-8 203–203, 208) among land-based distribution workers. The 11 multiple-myeloma deaths in the group were carried into a nested case-control study (Wong et al. 1999), in which they were matched with as many as five controls who were still alive at the time of the cases’ deaths and did not die from myeloma, leukemia, or kidney cancer (the subjects of simultaneous nested investigations). The quantitative exposure information was used only to compare the mean values without measures of variance. The authors noted that the cases’ averages were “similar or slightly lower” compared with those of the controls; that was the case for duration of employment, duration of exposure, and cumulative exposure, but the cases’ mean peak exposure was 28% higher than the controls’. When specific jobs ever held were analyzed, the risk was highest in foremen and supervisors (OR 1.92, 95% CI 0.43–8.59).
On the basis of a positive finding for lymphohematopoietic malignancies in a cohort mortality study (Huebner et al. 2000; Lewis et al. 2000a) followed up the incidence of such cancers among 8,942 employees who worked at an Exxon Corporation facility (a combined refinery and chemical plant) in Baton Rouge in 1970–1992. Work histories from company payroll records were reviewed to assign each worker to the occupation and unit where he spent most of his working time. Information on potential confounding factors was not consistently available. Newly diagnosed cancers in 1983–1994 were ascertained from the Louisiana cancer registry. There were nine cases of multiple myeloma (SIR 1.39, 95% CI 0.64–2.64) without any obvious pattern related to length of work or job title. A formal case-control study was not done.
A series of epidemiologic studies (Hanis et al. 1979; Lewis et al. 2000b, 2003; Schnatter et al. 1992, 1993) have been conducted on workers for Imperial Oil in Canada. Schnatter et al. (1996) conducted a nested case-control study on seven deaths from multiple myeloma among male fuel-distribution workers in the Imperial Oil cohort with followup through 1983 (Schnatter et al. 1993). Four controls from the cohort were selected who were alive after a respective case’s death and matched on decade of birth. A panel of industrial hygienists estimated quantitative HC and benzene exposures by considering loading and unloading technology at each location during various periods, types of materials handled, typical tasks performed by workers and job title, typical environmental conditions, and historical industrial-hygiene surveys at some of the sites. There was no association between exposure to HCs or benzene and multiple myeloma.
The most recent update on the Canadian Imperial Oil cohort checked vital status through 1994 (Lewis et al. 2000b). All-causes mortality was lower than that in the general population, and there was no association between working in refineries and multiple myeloma (SMR 0.70,
95% CI 0.30–1.37). In marketing and distribution workers, the SMR was 1.94 (95% CI 1.11–3.15), with a more pronounced risk in workers who had 25–34 years of employment (SMR 3.06, 95% CI 1.47–5.63). In the younger, overlapping cohort of 17,230 men in the entire company who had been first hired in 1964–1994, the incidence of multiple myeloma between 1969 and 1994 was not increased, on the basis of three incident cases (Lewis et al. 2003).
Case-Control Studies
Incident cases of multiple myeloma in 1977–1981 were identified in NCI’s Surveillance, Epidemiology, and End Results tumor registries in four geographic areas (Washington state, Utah, Atlanta, and Detroit) (Demers et al. 1993; Morris et al. 1986). Controls were selected with random-digit dialing or similar methods. Interviews were conducted to gather information on 698 cases and 1,683 controls; for 221 deceased or severely ill cases the interview was completed with a proxy, whereas proxies were needed for only 1% of the controls. Respondent-selected chemical exposures were grouped into exposure categories by a toxicologist. After adjustment for sex, age, race, and geographic area, the risk of multiple myeloma did not exceed unity in those exposed to aliphatic HCs (including gasoline, diesel, and kerosene exposures), whether or not proxy responses were excluded from the sample. Demers et al. (1993) revisited the dataset’s work histories to determine risks associated with various occupations and industries. There was no association with multiple myeloma among those who had worked as gas-station attendants (OR 0.8, 95% CI 0.4–1.5). The only suggestion of a relationship with fuel exposure was seen in those said to have worked in the petroleum-refining and coal-product manufacturing industries (OR 1.2, 95% CI 0.4–3.1), but the increase vanished when the analysis was limited to self-respondents.
Linet et al. (1987) interviewed 100 cases of multiple myeloma diagnosed at seven Baltimore hospitals in 1975–1982. They were individually paired with hospital controls by sex, age, year of diagnosis, and hospital. Inquiries about occupational and environmental exposures were part of the telephone interviews conducted with each subject or next of kin. According to discordant-pair analysis with adjustment for whether the respondent was a subject or a proxy, exposure to petroleum was most strongly related with multiple myeloma (OR 3.7, 95% CI 1.3–10.3) of all the risk factors considered in the study (medical and pharmaceutical, as well as occupational). In a study this small, discordant-pair analysis is unwieldy for adjusting for confounders.
Men diagnosed with multiple myeloma (1,098 cases) in Denmark in 1970–1984 as listed in the Danish Cancer Registry were each matched to four controls (who were alive in the year of diagnosis) on the basis of sex and year of birth (Heineman et al. 1992). Work history since 1964 was obtained by linkage to the Danish Supplemental Pension Fund, and this information was abstracted by industrial hygienists to derive whether (and how long) each subject had been experienced to a variety of workplace exposures. Workers ever employed in the fuel, oil, or gas industry did not have an increased risk of multiple myeloma (OR 0.8, 95% CI 0.4–1.6). Among workers considered exposed to gasoline or oil products, the estimated ORs were consistently slightly increased. The same protocol generated data on 1,010 Danish women who had multiple myeloma and 4,040 population controls, but the analyses of interest were limited to the 363 cases and 1,517 controls who had been in the workforce at any time after 1964. Exposure to coal or oil products was the only exposure pertaining to fuels reported for the women, and there was no suggestion that it was related to multiple myeloma.
Combustion Products
Table 4.45 presents the findings considered most relevant by the committee in drawing its conclusion on the possibility of an association between exposure to combustion products and multiple myeloma, presented in reverse chronologic order within type of study design.
Nested Case-Control Studies
On the basis of self-reported exposure to diesel-engine exhaust, Boffetta et al. (1988) defined a cohort of men who were 40–79 years old at the time of enrollment in the ACS prospective cohort study. Persons who had an extant cancer diagnosis at the time of enrollment were not excluded. After 2 years of followup, comparison of multiple-myeloma mortality in the diesel-exhaust-exposed cohort with that in the complementary nonexposed cohort yielded a mildly increased estimated risk (RR 1.21). After 4 years of followup on the ACS cohort, Boffetta et al. (1989) conducted a more conventionally designed nested case-control study that considered only people who had been cancer-free at the time of enrollment. Exposure to combustion products was addressed in self-reports and the even less specific surrogate of main occupation. The risks posed by the three categories of combustion-product-related agents (coal tar, pitch, or asphalt; diesel exhaust; and gasoline exhaust) showed no consistent pattern. Fully adjusted risks of multiple myeloma were increased but imprecise in truck drivers (OR 2.8, 95% CI 0.5–16.1) but more emphatically increased in railroad workers (OR 7.1, 95% CI 1.2–43.6), although both estimates were based on only three exposed cases.
Wong et al. (1999) matched each of 11 multiple-myeloma deaths observed among 9,026 land-based petroleum-distribution workers with up to five controls on sex, year of birth, and company. None of the occupational groups (mechanics, drivers, and loaders) that might be expected to have job-related exposure to diesel exhaust had an increased rate of multiple myeloma. None of the available surrogates of dose (cumulative and peak HC exposures, duration of employment or of exposure, and year of first exposure) was found to be associated with multiple myeloma in logistic regressions.
Lee et al. (2003) contrasted the occupational exposure of 446 people who had primary incident multiple-myeloma cases in 1971–1999 in a cohort of 365,424 male Swedish construction workers with that of the remainder of the cohort. A JEM was developed on the basis of exposure monitoring conducted from 1971 to 1976 and used to determine each worker’s exposure to several substances, including diesel exhaust and asphalt. There was no association between asphalt exposure and multiple myeloma. With adjustment for age, BMI, and the other occupational exposures, the risk associated with diesel exhaust exposure was slightly increased (OR 1.3, 95% CI 1.00–1.77), but a dose-response relationship was not apparent over the three exposure levels used.
Case-Control Studies
In the set of 698 multiple-myeloma cases gathered from the SEER system in 1977–1981, working as a vehicle mechanic, the occupation most closely associated with combustion-product exposure, showed no association with multiple myeloma, with or without the proxy cases included (Demers et al. 1993). Self-reported exposures to diesel, jet-fuel, or automobile exhaust; coal fumes; and smoke were grouped as “carbon monoxide” (Morris et al. 1986). After adjustment for age, sex, race, and study site, the adjusted OR for all cases was 1.8 (95% CI 1.0–3.2); the reliability of this finding was increased by the fact that the result was a bit stronger
when proxy respondents were excluded from the analysis (OR 1.9, 95% CI 1.1–3.2). Williams et al. (1989) focused specifically on 69 “light-chain” multiple-myeloma cases in this case group, 46 of whom had completed the interview themselves. Adjusted for age, sex, race, residence, and educational attainment, the RR for all light-chain respondents was 2.9 (95% CI 1.0–8.4); for self-respondents, the relationship was considerably stronger (RR 6.1, 95% CI 2.0–18.2). When the light-chain multiple-myeloma cases were removed, the risk for all other multiple-myeloma cases became uncertain (OR 1.3, 95% CI 0.7–2.7) and led the authors to conclude that diesel exhaust was most strongly associated with the light-chain variety of multiple myeloma. However, there apparently has been no more research into this intriguing possibility.
Flodin et al. (1987) enrolled 131 cases (75 men and 56 women) of multiple myeloma identified at hospitals and clinics in six Swedish cities. They had been diagnosed in 1973–1983, but interviewing did not start until 1981, so short-term survivors were underrepresented; cross-checking with cancer registers suggested that the researchers had enlisted only about one-third of the cases occurring in the nominal study period. The 431 population-based controls, selected with no matching criteria beyond residence in the catchment areas, were the same people used in the authors’ case-control study of CLL (Flodin et al. 1988). After adjustment for smoking and other potential confounders in a Mantel-Haenszel analysis, the risk of multiple myeloma in men exposed to engine exhaust remained fairly firmly established (OR 2.1, 95% CI 1.2–3.9) on the basis of 35 exposed cases.
Heineman et al. (1992) identified 1,098 men diagnosed with multiple myeloma in 1970–1984 in the Danish Cancer Registry and drew 4,169 age- and sex-matched population controls from the Danish Central Population Registry. Work histories since 1964 were accessed from the Danish Supplementary Pension Fund, and from them industrial hygienists determined possible or probable exposure to various agents and duration of exposure. Ever having worked in the transportation industry (OR 1.3, 95% CI 1.0–1.6) was associated with an increased risk of multiple myeloma, but there was little evidence of a dose-response relationship (p for trend=0.24) when those who worked less than 5 years were compared with those who worked 5 years or more. No increased risk was associated with exposure to tar, asphalt, or soot. Exposure to engine exhaust was associated with a modest increase in estimated risk (OR for “possible” exposure 1.3, 95% CI 1.0–1.6; OR for “probable” exposure 1.2, 95% CI 0.9–1.6). Possible exposure to engine exhaust was the one exposure that retained borderline statistical significance when included in a logistic model simultaneously adjusted for exposure to gasoline, phthalates, and vinyl chloride. The exhaust findings are less convincing because “possible” exposure showed a stronger effect than “probable” exposure, and the results for duration also were contrary to dose-response expectations. A companion study of Danish women who had multiple myeloma analyzed 363 cases and 1,517 controls on whom work information was available from the files of the pension fund (Pottern et al. 1992). The increases in the risk of multiple myeloma associated with possible or probable exhaust exposure (OR 1.4, 95% CI 0.6–3.2; OR 1.6, 95% CI 0.4–5.5, respectively) were imprecise in this smaller sample.
In the study of 12 areas of Italy, the only exposure reported by Costantini et al. (2001) of possible relevance with respect to an association between exposure to combustion products and multiple myeloma was the occupation of transport operator. In men, the estimated risk was totally negative (OR 0.5, 95% CI 0.2–1.1).
Conclusion
No consistent relationship between exposure to fuels and multiple myeloma was detected in the studies described above; most studies reported no association. On the basis of small numbers of cases considered to have fuel exposure and the imprecision of the exposure assessments accompanying the case-control and cohort studies considered, there was a limited ability to detect an association between exposure to fuels and multiple myeloma.
Sizable studies of Swedish construction workers (Lee et al. 2003) and of Danish men (Heineman et al. 1992) both used industrial-hygiene methods to derive exposures from work histories, but their estimated risks of multiple myeloma after exposure to exhaust were just barely suggestive. Furthermore, the magnitude of the risks was fairly uniform, showing indications of a dose-response relationship with intensity, duration, or likelihood of exposure. The risk posed by carbon monoxide in the US SEER study (Morris et al. 1986), in which industrial hygienists grouped self-reports, was similarly marginal. Imprecise estimates of increased multiple-myeloma risk in association with exhaust exposure have been reported among Danish working women (Pottern et al. 1992) and in a study in which exposure was declared prospectively (Boffetta et al. 1989), whereas the most stable positive result, reported in a small study of Swedish men (Flodin et al. 1987), was based on self-reported exposure.
The committee concludes, from its assessment of the epidemiologic literature, that there is inadequate/insufficient evidence to determine whether an association exists between fuels or their combustion products and multiple myeloma.
LEUKEMIAS
Leukemias [ICD-9 204–208] are malignant diseases that arise from precursor cells of white blood cells. As for the lymphomas, characterizing cases gathered retrospectively for epidemiologic studies and integrating the results of studies conducted over several decades is particularly challenging because a succession of diagnostic criteria, with corresponding groupings and nomenclature, have been used. Individual leukemias may have unique etiologic factors (for example, T-cell leukemia is caused by the virus HTLV-I), but the recognized risk factors for leukemias in general include exposure to radiation or certain chemicals (for instance, occupational exposure to benzene or chemotherapy with alkylating agents), some genetic conditions (such as some chromosomal abnormalities including, Down syndrome), and particular acquired blood diseases (for example, myelodysplastic syndromes may develop into acute myeloid leukemia) (NCI 2004).
Although all leukemias originate in the bone marrow, there are 4 main types, classified by the type and developmental stage of the cells involved. Leukemias can be either acute—in which the cells grow rapidly and are not able to mature—or chronic—in which the cells grow and accumulate slowly, and look mature. Classification also depends on which cell type is affected. Lymphocytic leukemias affect the lymphocytes, a type of white blood cell that makes up lymphoid tissue; myeloid leukemias affect granulocytes or monocytes, both of which are white blood cells that circulate and protect the body against infection (ACS 2004n). Acute lymphocytic leukemia (ALL) affects children more frequently than adults, while chronic lymphocytic leukemia (CLL) affects only adults, mostly over the age of 40 (ACS 2004e, 2004g). Acute myeloid leukemia (AML), also called acute non-lymphocytic leukemia (ANLL) is the
most common leukemia and usually affects adults, particularly men, although it can occur in children (ACS 2004f). Chronic myeloid leukemia (CML) mostly affects adults and is rare in children (ACS 2004h). These 4 types of leukemias can be further divided into sub-types, based on progression of the cancer and cell sub-types.
In 2000, there were 11.9 new cases of leukemia per 100,000 people (15.2 among men and 9.4 among women) and 12.4 deaths per 100,000 (15.9 among men and 9.8 among women) in the US (Ries et al. 2004).
Fuels
The second Gulf War committee found sufficient evidence to conclude that benzene is associated with leukemia, AML in particular. Benzene is a component of all the petroleum-derived fuels under consideration by the current committee and of their exhaust. For example, gasoline contains 0.5–2.5% benzene, and kerosene and the related jet fuels contain 0.1–1% benzene (Ritchie et al. 2003). This committee, therefore, did not revisit the literature related to the possibility of an association between fuels and leukemia.
Combustion Products
Table 4.46 presents the most relevant findings considered by the committee in drawing its conclusion on the possibility of an association between exposure to combustion products and leukemia, in reverse chronologic order within type of study design.
Cohort Study
Boffetta et al. (1988) tracked the vital status of participants in the ACS II prospective cohort 2 years after enrollment, when information that included detailed occupational histories had been gathered. After adjustment for age, smoking, and other occupational exposures, all leukemias considered together (ICD-9 204–208) had an imprecisely estimated risk (RR 1.29) associated with self-reported exposure to diesel-engine exhaust among men who were 40–79 years old at the time of enrollment. The deaths analyzed include those of persons newly diagnosed during the followup period and any occurring among those already diagnosed with leukemia at the time of the cohort’s inception; this introduces the possibility of recall bias into the exposure factor defining the cohort in this nominally prospective study.
Nested Case-Control Study
Wong et al. (1999) conducted a nested case-control study of leukemia in a cohort of US land-based petroleum-distribution workers. The entire group of 35 leukemias and the subgroup of 13 AMLs were analyzed for association with several relevant occupational subcategories (mechanics, drivers, and loaders). None of those occupational groups was associated with increased rates of leukemia or AML.
Case-Control Studies
The early case-control study of patients at the Roswell Park Memorial Institute yielded no clearly positive findings on all leukemias in association with occupations that had likely exposure to combustion products (Decoufle and Stanislawczyk 1977). The most increased risk estimates were in small sets of taxi drivers and mine workers (RR 2.08 and 2.16, respectively),
but when analysis was limited to those with at least 5 years in these jobs the risks were below unity.
Flodin et al. (1988) conducted a case-control study of CLL (ICD-9 204.15) by identifying cases at hospitals and clinics in five Swedish cities. The resulting 71 male and 40 female cases were compared with 431 population-based controls that were selected on the basis of no matching criteria beyond residence in the catchment areas. Most of the cases were diagnosed in 1975–1984, but some were survivors who had been diagnosed as early as 1964. There was a detailed assessment of radiation exposure, but it and smoking were found to have no influence on the occurrence of CLL. After adjustment for age, sex, farm work, and exposure to horses, DDT, fresh wood, or solvents, the authors found an association between self-reported occupational exposure to engine exhaust and CLL (Mantel-Haenszel incidence rate ratio 2.2, 95% CI 1.2–4.2). The authors noted that benzene is present in exhaust, but they speculated that other leukemogenic agents were involved because the benzene concentratios would be very low. Methodologic weaknesses in sample assembly and in assessment of exposures of interest to this committee reduce the confidence that can be placed in the result.
Lindquist et al. (1991) interviewed 125 patients (76 men and 49 women) who had acute leukemia, classified according to the French-American-British (FAB) system. They were compared with 125 neighborhood controls matched for age and sex. The data were analyzed as exposure-discordant matched pairs, thus forcing accounting for other possible confounders to be indirect. Professional drivers had an increased risk of acute leukemia (OR 3.0, 95% CI 1.1–9.2). The same effect was apparent in a smaller number of recreational drivers and was diminished only modestly when drivers who had also worked as painters were excluded. There was evidence of a dose-response relationship in that the risk was higher in those who had a greater duration of exposure (OR 5.0, p<0.05). The authors suggested that this finding might be attributable to the presence of benzene at about 5% in Swedish fuels.
The case-control study conducted by Costantini et al. (2001) interviewed 383 men and 269 women in 12 areas of Italy who were newly diagnosed with leukemia (ICD-9 204–208) in 1991–1993. The 1,779 controls were randomly selected from each of the regions and frequency-matched for sex and age. Work as a transport operator (as abstracted from the work history) was the only reported exposure possibly related to the influence of the combustion products on the occurrence of leukemia. Among men, the risk of that occupation was only modestly increased (OR 1.1, 95% CI 0.7–1.7). The sample was of substantial size, and the interview’s coverage was considerable, but there was no attempt to use the available information to adjust occupational exposures for possible confounders.
Conclusion
The studies address leukemias overall and subtypes (AML and CLL), which represent substantial heterogeneity in health outcome in a fairly limited set of evidence. The apparent associations with exposure are related to separate types of leukemia, and the authors of the studies (Flodin et al. 1988; Lindquist et al. 1991) note that any increase in leukemia risk is difficult to attribute specifically to exhaust because of concurrent exposure to fuels and benzene. The exposure assessments in all the studies are based on information from sources of questionable reliability (personal interviews or medical records) or have a low degree of specificity for combustion products.
The committee concludes, from its assessment of the epidemiologic literature, that there is inadequate/insufficient evidence to determine whether an association exists between exposure to combustion products and leukemia.
MYELODYSPLASTIC SYNDROMES
Myelodysplastic syndromes (MDSs) are hematopoietic disorders of uncertain etiology in which the production of blood cells is compromised (ACS 2004a). Some of the syndromes are marked by high frequency of progression to AML. The FAB system of classification has recently been superseded by one from WHO. MDSs are fairly common sequelae of chemotherapy or radiation therapy, in which case they are regarded as secondary MDSs. Other risk factors thought to be related to the development of MDSs included aging, some genetic conditions, environmental or occupational exposure to radiation or chemicals (particularly benzene), and smoking.
Fuels
Table 4.47 presents the most relevant findings considered by the committee in drawing its conclusion on the possibility of an association between exposure to fuels and MDSs, in reverse chronologic order.
Case-Control Studies
In a pilot study, Farrow et al. (1989) interviewed 39 men and 24 women who had an MDS diagnosed in a hospital in Wales from October 1985 through September 1986. Age- and sex-matched controls were recruited from the outpatient clinics on the same day. The researchers used an approach modeled after that used by Siemiatycki’s team in the Montreal multicancer case-control study (Gerin et al. 1985) to derive occupational exposures from the interview data. Preliminary adjusted analyses reported associations (p<0.01) with exposure for at least 6 months to “petrol diesel liquids” or to “petrol diesel fumes” (combustion exhaust may have been intended, rather than volatized fuel).
The same group of researchers (West et al. 1995) used the same recruitment procedures and exposure-assessment technique to gather 400 case-control pairs from three areas of the UK, which probably included the 63 pairs described in Farrow et al. (1989). Of 635 newly diagnosed primary MDS cases identified, only 400 were interviewed and paired with noncancer-patient controls matched for age, sex, residence, hospital, and year of diagnosis. The low ascertainment, primarily due to failure to interview subjects before it was no longer possible, is potentially biasing if an etiologic factor influenced the progression of the disease. Analysis was based on discordant pairs, and this limited adjustment to the matching factors. Two of the five classes of “petroleum products” (“diesels and petrols” and “oils and greases”) might be considered to fit within the exposures that the present committee is considering. The risk related to “oils and greases” was modestly increased (OR 1.29, 95% CI 0.88–1.89), and neither exposure showed any suggestion of a dose-response relationship with duration or intensity of exposure.
Another pilot study (Nisse et al. 1995) reported on the first 100 cases of MDS diagnosed at the University Hospital of Lille (from September 1991 through July 1993) and suggested associations both with “oils and greases” and with exhaust gases. Collection continued through
February 1996 for the full set of 204 newly diagnosed cases and 204 sex- and age-matched population controls (Nisse et al. 2001). Cases and controls were questioned by a trained interviewer to gather extensive demographic, medical, and occupational information. The resulting data were reviewed and distilled by a group of experts in occupational exposure to estimate lifetime cumulative exposure to various agents according to the approach of the Montreal multicancer case-control study (Gerin et al. 1985). The exposures were classified as exposed or nonexposed and regarded from the perspective of duration and frequency. The risk factors analyzed included gasoline, “oil”, exhaust gases, and PAHs. Cases were more likely to have been occupationally exposed to oil (OR 4.2, 95% CI 2.0–9.9), but the risk posed by petrol exposure was less precise (OR 2.5, 95% CI 0.9–7.7). Beyond control provided by the matching variables in a Mantel-Haenzel test, there was apparently no adjustment for possible confounders despite their availability in the detailed database developed.
Several other case-control studies of MDSs (Goldberg et al. 1990; Ido et al. 1996; Nagata et al. 1999; Rigolin et al. 1998) contained no analyses specifically of fuels (or combustion products) but might be considered indirectly related to fuels by virtue of their focus on solvents, primarily benzene, and were reviewed by the second Gulf War committee (IOM 2003). With the exception of the results of Goldberg et al. (1990), the risks associated with solvent exposures (all based on self-reports) were increased.
Combustion Products
Table 4.48 presents the most relevant findings considered by the committee in drawing its conclusion on the possibility of an association between exposure to combustion products and MDSs, in reverse chronologic order.
Case-Control Studies
For their 400 case-control pairs, West et al. (1995) reported that exposure to coal tar (a PAH-containing substance) showed no association with the occurrence of MDSs. The risks posed by exposure to exhaust gases showed minor increases, and there was not a monotonic increase in risk with increasing duration of exposure. For the only occupational grouping possibly characterized by exposure to combustion products (“transport operating, material moving and storing and related”), there was no association with MDSs.
In their case-control study of French subjects, Nisse et al. (2001) found that MDS cases were as likely as controls to have been exposed to exhaust gases (OR 1.0, 95% CI 0.5–1.9), but their estimated risk related to exposure to PAHs was only modestly increased (OR 1.8, 95% CI 0.7–4.6). Machine operators, an occupational group potentially exposed to combustion products, manifested a risk of MDS (OR 2.8, 95% CI 1.3–6.4). Logistic regressions were said to have been performed on variables that were associated with MDSs in univariate comparisons, but the fully adjusted results were not presented systematically.
Conclusion
Nisse et al. (2001) obtained positive findings for exposure to petroleum-related substances. Given the benzene content of fuels, one might have expected a clear picture to emerge, but it did not in the work of West et al. (1995).
For combustion products, only the increased risk estimate for the not particularly substance-specific occupational category of machine operator appeared stable (Nisse et al. 2001).
Despite the apparent rigor of the data-collection methods used, the researchers’ analyses were rudimentary, and failed even to adjust for possible confounders when the information was at hand.
The committee concludes, from its assessment of the epidemiologic literature, that there is inadequate/insufficient evidence to determine whether an association exists between fuels or combustion products and myelodysplastic syndromes.
SUMMARY OF CONCLUSIONS
The committee’s conclusions about the strength of the evidence between fuels and combustion products and various types of cancers are summarized in Box 4.1.
|
BOX 4.1 Sufficient Evidence of a Causal Relationship No conclusions Sufficient Evidence of an Association Combustion products and lung cancer Limited/Suggestive Evidence of an Association Combustion products and: Cancers of the oral cavity and oropharynx Cancers of the nasal cavity and nasopharynx Laryngeal cancer Bladder cancer Inadequate/Insufficient Evidence of an Association Fuels and: Cancers of the oral cavity and oropharynx Cancers of the nasal cavity and nasopharynx Esophageal cancer Stomach cancer Colon cancer Rectal cancer Hepatic cancer Pancreatic cancer Laryngeal cancer Lung cancer Melanoma Non-melanoma skin cancer Female breast cancer |
|
Male breast cancer Female genital cancers (cervical, endometrial, uterine, and ovarian cancers) Prostate cancer Testicular cancer Nervous system cancers Kidney cancer Bladder cancer Hodgkin’s disease Non-Hodgkin’s lymphoma Multiple myeloma Myelodysplastic syndromes Combustion products and: Esophageal cancer Stomach cancer Colon cancer Rectal cancer Hepatic cancer Pancreatic cancer Melanoma Female breast cancer Male breast cancer Female genital cancers (cervical, endometrial, uterine, and ovarian cancers) Prostate cancer Testicular cancer Nervous system cancers Ocular melanoma Kidney cancer Non-Hodgkin’s lymphoma Hodgkin’s disease Multiple myeloma Leukemia Myelodysplastic syndromes |
TABLES
TABLE 4.1 Cancers of the Oral Cavity and Oropharynx and Exposure to Fuels—Selected Epidemiologic Studies
|
Reference |
Study Population |
Exposed Cases |
Estimated Relative Risk (95% CI) |
|
Cohort Studies—Mortality |
|||
|
Ritz 1999 |
Uranium-processing workers in Fernald, Ohio (ICD-8 140–149) |
9 |
1.05 (0.48–1.99) |
|
|
Kerosene exposure (industrial-hygiene reconstruction) |
|
|
|
|
Low exposure (>2 yr, 15-yr lag) |
na |
1.85 (0.37–9.36) |
|
|
Moderate exposure (>2 yr, 15-yr lag) |
na |
2.87 (0.43–19.2) |
|
Lagorio et al. 1994 |
Filling-station attendants in Italy (exposure reconstruction using monitoring) |
1 |
0.38 (0.02–1.79)a |
|
Cohort Study—Incidence |
|||
|
Jarvholm et al. 1997 |
Petroleum-industry workers in Sweden (ICD-9 140–149) (qualitative industrial-hygiene-interpretation of personnel records) |
|
|
|
|
≥1-yr duration; ≥1-yr latency |
6 |
1.2 (0.54–2.5)a |
|
≥1-yr duration; ≥20-yr latency |
5 |
2.0 (0.79–4.2)a |
|
|
≥10-yr duration; ≥20-yr latency |
5 |
2.2 (0.90–4.8)a |
|
|
Refinery operators |
|
|
|
|
≥1-yr duration; ≥1-yr latency |
1 |
0.58 (0.03–2.8)a |
|
|
≥1-yr duration; ≥20-yr latency |
1 |
1.1 (0.06–5.3)a |
|
|
≥10 yr-duration; ≥20-yr latency |
1 |
1.3 (0.06–5.9)a |
|
|
Distribution workers |
|
|
|
|
≥1-yr duration; ≥1-yr latency |
3 |
1.8 (0.48–4.6)a |
|
|
≥1-yr duration; ≥20-yr latency |
2 |
2.3 (0.40–7.0)a |
|
|
≥10-yr duration; ≥20-yr latency |
2 |
2.5 (0.44–7.9)a |
|
|
Case-Control Studies |
|||
|
Zheng et al. 1996 |
41 salivary gland cancer (ICD-9 142) cases among residents of Shanghai, China; self-reported agents (not smoking adjusted) |
|
|
|
|
Occupational exposure to petroleum products |
14 |
1.8 (0.8–3.8) |
|
Kerosene exposure from cooking |
13 |
3.5 (1.6–7.4) |
|
|
With multivariate analysis |
13 |
3.0 (1.4–6.8) |
|
|
Gas exposure from cooking |
28 |
1.3 (0.6–2.6) |
|
|
Huebner et al. 1992 |
762 cancers of oral cavity and pharynx (ICD-9 141, 143–146, 148, 149) among male residents of California, Georgia, and New Jersey; self-reported occupation (smoking adjusted) |
|
|
|
|
Petroleum-industry workers |
16 |
1.79 (0.75–4.25) |
|
Cancer of tongue |
8 |
3.2 (1.15–8.9) |
|
|
Cancer of mouth |
1 |
0.41 (0.05–3.46) |
|
|
Cancer of pharynx |
7 |
2.31 (0.75–7.15) |
|
|
Service-station workers |
48 |
0.85 (0.53–1.36) |
|
|
NOTE: na=not available. a90% CIs reported in this paper. |
|||
TABLE 4.2 Cancers of the Oral Cavity and Oropharynx and Exposure to Combustion Products—Selected Epidemiologic Studies
|
Reference |
Study Population |
Exposed Cases |
Estimated Relative Risk (95% CI) |
|
Case-Control Studies—Adjusted for smoking, unless otherwise noted |
|||
|
Gustavsson et al. 1998 |
545 cancer cases among male residents of two regions in Sweden; industrial-hygiene-derived agents |
|
|
|
|
Oral cavity |
|
|
|
PAHs (low) |
25 |
0.99 (0.57–1.73) |
|
|
PAHs (high) |
41 |
1.39 (0.86–2.25) |
|
|
Pharynx |
|
|
|
|
PAHs (low) |
28 |
1.06 (0.61–1.82) |
|
|
PAHs (high) |
44 |
1.52 (0.94–2.45) |
|
|
Pintos et al. 1998 |
784 pharyngeal-cancer cases among residents of three cities in southern Brazil; self-reports |
|
|
|
|
Pharynx—use of wood stove |
na |
3.82 (1.96–7.42) |
|
Males |
|
2.82 (1.63–4.86) |
|
|
Females |
|
5.78 (0.52–64.3) |
|
|
Mouth—use of wood stove |
na |
2.73 (1.76–4.24) |
|
|
Males |
|
2.52 (1.69–3.76) |
|
|
Females |
|
2.77 (1.09–7.02) |
|
|
Zheng et al. 1996 |
41 salivary gland cancer cases among residents of urban Shanghai, China; self-reported agents (not smoking adjusted) |
|
|
|
|
Fuel used for cooking |
|
|
|
Kerosene |
13 |
3.5 (1.6–7.4) |
|
|
Coal |
38 |
1.6 (0.5–5.6) |
|
|
Gas |
28 |
1.3 (0.6–2.6) |
|
|
Wood or straw |
6 |
1.6 (0.6–4.4) |
|
|
Dietz et al. 1995 |
Incident cancer cases among residents of Heidelberg, Germany; self-reported agents |
|
|
|
|
105 pharyngeal cancer cases |
|
|
|
Air pollution on job (>20 yr) |
21 |
0.94 (0.53–1.65)a |
|
|
Traffic jams on way to work (>20 yr) |
20 |
0.85 (0.48–1.50)a |
|
|
High traffic emissions, residential (>20 yr) |
23 |
0.74 (0.43–1.27)a |
|
|
Outdoor air pollution, residential (>20 yr) |
8 |
0.48 (0.20–1.07)a |
|
|
Heating, fossil-fuel stoves (>40 yr) |
33 |
2.60 (1.54–4.37)a |
|
|
Cooking, fossil-fuel stoves (>20 yr) |
24 |
1.41 (0.81–2.44)a |
|
|
100 oral cavity cancer cases |
|
|
|
|
Air pollution on the job (>20 yr) |
22 |
1.09 (0.62–1.92)a |
|
|
Traffic jams on way to work (>20 yr) |
21 |
1.03 (0.58–1.82)a |
|
|
High traffic emissions, residential (>20 yr) |
34 |
1.41 (0.86–2.31)a |
|
|
Outdoor air pollution, residential (>20 yr) |
14 |
0.67 (0.35–1.29)a |
|
|
Heating, fossil-fuel stoves (>40 yr) |
33 |
1.60 (0.97–2.65)a |
|
|
Cooking, fossil-fuel stoves (>20 yr) |
34 |
2.09 (1.26–3.48)a |
|
|
Reference |
Study Population |
Exposed Cases |
Estimated Relative Risk (95% CI) |
|
Huebner et al. 1992 |
1,114 oral- and pharyngeal-cancer cases among residents of five US locations; self-reported job titles |
|
|
|
|
762 men |
|
|
|
Boiler or furnace operators |
20 |
1.50 (0.68–3.34) |
|
|
Heavy-equipment operators |
55 |
1.25 (0.78–2.01) |
|
|
Motor-vehicle operators |
157 |
1.01 (0.75–1.35) |
|
|
Railroad-transport workers |
8 |
1.00 (0.30–3.35) |
|
|
Cooks or other food service workers |
83 |
1.00 (0.67–1.47) |
|
|
Mechanics or repairers |
207 |
0.86 (0.66–1.12) |
|
|
Transportation worker (industry) |
86 |
1.07 (0.74–1.56) |
|
|
Trucking or warehousing workers (industry) |
62 |
0.86 (0.56–1.31) |
|
|
352 women |
|
|
|
|
Motor-vehicle workers |
7 |
2.80 (0.61–12.9) |
|
|
Cooks or other food service workers |
44 |
1.34 (0.78–2.28) |
|
|
Zheng et al. 1992 |
204 oral- and pharyngeal-cancer cases among residents of urban Shanghai, China; self-reports (not smoking adjusted) |
|
|
|
|
Men |
|
|
|
Petroleum products, occupational exposure |
53 |
1.76 (1.10–2.82)a |
|
|
Use of kerosene stove |
31 |
2.24 (1.27–3.97)a |
|
|
Women |
|
|
|
|
Petroleum products, occupational exposure |
15 |
1.63 (0.72–3.72)a |
|
|
Use of kerosene stove |
13 |
1.01 (0.45–2.26)a |
|
|
Merletti et al. 1991 |
86 oropharyngeal-cancer cases among residents of Turin, Italy |
|
|
|
|
Transportation and communication (occupation) PAHs (JEM-derived agent) |
8 |
0.7 (0.9–1.5) |
|
Any exposure |
56 |
1.0 |
|
|
Probable or definite exposure |
20 |
0.6 |
|
|
Decoufle and Stanislawczyk 1977 |
Buccal-cavity and pharyngeal cancer cases among male patients at Roswell Park Memorial Institute in Buffalo, New York (job history, including durations, from medical charts) |
|
|
|
|
Occupations (ever) |
|
|
|
Deliverymen and routemen |
na |
1.16, ns |
|
|
Machinists |
na |
1.36, ns |
|
|
Mechanics and repairmen |
na |
0.98 |
|
|
Bus, taxicab, and truck drivers |
na |
1.37, ns |
|
|
Locomotive engineers and firemen |
na |
1.64, ns |
|
|
Viadana et al. 1976 |
Bus, taxicab, and truck drivers (not smoking adjusted) |
89 |
1.44, ns |
|
Exposed 5+ yr |
68 |
1.33, ns |
|
|
|
Locomotive engineers and firemen |
18 |
1.64, ns |
|
|
Exposed 5+ yr |
17 |
1.97, ns |
|
NOTE: na=not available; ns=not statistically significant (p<0.5) for a risk estimate above unity. aUnadjusted ORs and 95% CI calculated with standard methods from observed numbers presented in original paper. |
|||
TABLE 4.3 Cancers of the Nasal Cavity and Nasopharynx and Exposure to Fuels—Selected Epidemiologic Studies
|
Reference |
Study Population |
Exposed Cases |
Estimated Relative Risk (95% CI) |
|
Case-Control Studies |
|||
|
Armstrong et al. 2000 |
282 nasopharyngeal-cancer cases among Chinese residents of Selangor and Federal Territory, Malaysia; self-reported exposures (smoking adjusted) |
|
|
|
|
Motor fuel and oil |
83 |
1.33 (0.81–2.20) |
|
Teschke et al. 1997 |
48 sinonasal-cancer cases among residents of British Columbia, Canada; self-reported exposures (smoking adjusted) |
|
|
|
|
Service-station attendants and managers |
4 |
0.8 (0.2–2.8) |
|
|
20-yr latency |
4 |
1.0 (0.2–3.7) |
TABLE 4.4 Cancers of the Nasal Cavity and Nasopharynx and Exposure to Combustion Products—Selected Epidemiologic Studies
|
Reference |
Study Population |
Exposed Cases |
Estimated Relative Risk |
|
Case-Control Studies |
|||
|
Leclerc et al. 1997 |
930 sinonasal-cancer cases pooled from 12 studies in seven countries; job titles (not smoking-adjusted) |
|
|
|
|
Motor-vehicle driver, males |
41 |
1.13 (0.78–1.63) |
|
|
<10 yr |
|
1.15 |
|
|
≥10 yr |
|
1.22 |
|
Armstrong et al. 2000 |
282 nasopharyngeal-cancer cases among Chinese residents of Selangor and Federal Territory, Malaysia; self-reported agents (smoking-adjusted) |
|
|
|
|
Cooking fumes |
19 |
0.93 (0.38–2.27) |
|
10-fold exposure increase |
|
0.97 (0.78–1.21) |
|
|
Engine exhaust fumes |
59 |
1.05 (0.61–1.79) |
|
|
10-fold exposure increase |
|
1.00 (0.88–1.14) |
|
|
Wood fumes |
27 |
1.65 (0.69–3.92) |
|
|
10 fold exposure increase |
|
1.08 (0.84–1.38) |
|
|
Other fumes |
29 |
1.46 (0.66–3.23) |
|
|
10-fold exposure increase |
|
1.12 (0.91–1.39) |
|
|
Zheng et al. 1994 |
88 nasopharyngeal-cancer cases among residents of Zangwu County, China; self-reported agents (not smoking-adjusted) |
|
|
|
|
Use of wood fuel (adjusted) |
80 |
5.4 (1.5–19.8) |
|
Use of wood fuel (crude, matched) |
80 |
3.7 (p=0.02) |
|
|
With windows in home |
73 |
3.6 (p=0.03) |
|
|
Without windows in home |
7 |
7.8 (p=0.009) |
|
|
With good ventilation in home |
24 |
3.1 (p=0.07) |
|
|
With poor ventilation in home |
56 |
4.7 (p=0.01) |
|
|
With kitchen in home |
66 |
3.4 (p=0.04) |
|
|
With kitchen outside in shack |
14 |
5.9 (p=0.01) |
|
|
With windows in kitchen |
59 |
3.4 (p=0.08) |
|
|
Without windows in home |
7 |
5.4 (p=0.06) |
|
|
Reference |
Study Population |
Exposed Cases |
Estimated Relative Risk |
|
Yu et al. 1990 |
306 nasopharyngeal cancer cases among residents of Guangzhou City, China; self-reported agents (not smoking-adjusted) |
|
|
|
|
Combustion products (univariate) |
63 |
2.4 (1.4–4.2) |
|
1–9 yr |
32 |
1.6 (0.9–2.9) |
|
|
10+ yr |
31 |
7.1 (2.5–20.6) |
|
|
Combustion products (multivariate) |
|
|
|
|
1–9 yr |
32 |
1.8 (0.9–3.6) |
|
|
10+ yr |
31 |
9.0 (2.8–28.8) |
TABLE 4.5 Esophageal Cancer and Exposure to Fuels—Selected Epidemiologic Studies
|
Reference |
Study Population |
Exposed Cases |
Estimated Relative Risk (95% CI) |
|
Cohort Studies—Mortality |
|||
|
Lewis et al. 2000b |
Refinery workers in Toronto, Canada |
|
|
|
|
Males |
42 |
0.96 (0.69–1.29) |
|
Refinery segment |
20 |
1.10 (0.67–1.70) |
|
|
Marketing or distribution segment |
14 |
1.04 (0.57–1.74) |
|
|
Females |
3 |
1.54 (0.32–4.50)a |
|
|
Ritz 1999 |
Uranium-processing workers in Fernald, Ohio—esophageal and stomach cancers (analyzed together) |
|
|
|
|
Kerosene, light exposure |
|
|
|
>2-yr duration, no lag |
10 |
1.98 (0.77–5.09) |
|
|
>2-yr duration, 15-yr lag |
9 |
3.46 (1.22–9.80) |
|
|
>5-yr duration, no lag |
5 |
0.96 (0.32–2.94) |
|
|
>5-yr duration, 15-yr lag |
3 |
1.26 (0.31–5.15) |
|
|
Kerosene, moderate exposure |
|
|
|
|
>2-yr duration, no lag |
5 |
3.00 (0.81–11.2) |
|
|
>2-yr duration, 15-yr lag |
5 |
7.71 (2.04–29.1) |
|
|
>5-yr duration, no lag |
4 |
2.86 (0.60–13.6) |
|
|
>5-yr duration, 15-yr lag |
4 |
10.7 (2.26–50.7) |
|
|
Lagorio et al. 1994 |
Filling-station attendants in Italy (exposure reconstruction using monitoring) |
4 |
2.34 (0.80–5.35)b |
|
|
Men |
4 |
2.41 (0.82–5.51)b |
|
|
At smaller stations |
4 |
3.51 (1.20–8.03)b |
|
|
Women |
0 |
0.0 (0.0–36.9)a |
|
aRisk estimates and 95% CIs calculated with standard methods from observed and expected numbers presented in original paper. b90% CIs presented. |
|||
TABLE 4.6 Esophageal Cancer and Exposure to Combustion Products—Selected Epidemiologic Studies
|
Reference |
Study Population |
Exposed Cases |
Estimated Relative Risk (95% CI) |
|
Cohort Study—Mortality |
|||
|
Gustavsson et al. 1990 |
Male bus-garage workers in Stockholm, Sweden |
|
|
|
|
Stockholm referent |
4 |
1.93 (0.53–4.94) |
|
|
Sweden referent |
4 |
3.27 (0.89–8.37) |
|
Cohort Study—Incidence |
|||
|
Chow et al. 1995 |
Esophageal-cancer cases among male residents of Sweden |
|
|
|
|
Transport Industry |
143 |
1.0 (0.84–1.18)a |
|
Locomotive/traffic workers |
118 |
1.1 (0.91–1.32)a |
|
|
Machine, engine maintenance |
46 |
1.0 (0.74–1.34)a |
|
|
Case-Control Studies |
|||
|
Parent et al. 2000b |
99 esophageal-cancer cases among male residents of Montreal, Canada; industrial-hygiene-derived agents (smoking-adjusted) |
|
|
|
|
Nitrogen oxides (any) |
21 |
0.9 (0.6–1.6) |
|
Gasoline-engine emissions (any) |
41 |
0.9 (0.6–1.5) |
|
|
Carbon monoxide (any) |
45 |
0.7 (0.4–1.1) |
|
|
PAHs from any source (any) |
64 |
0.9 (0.5–1.5) |
|
|
Benzo[a]pyrene (any) |
24 |
1.1 (0.7–1.9) |
|
|
Benzo[a]pyrene (nonsubstantial) |
19 |
1.0 (0.5–1.7) |
|
|
Benzo[a]pyrene (substantial) |
5 |
2.3 (0.8–6.5) |
|
|
PAHs from coal (any) |
10 |
1.2 (0.6–2.5) |
|
|
PAHs from coal (nonsubstantial) |
4 |
0.7 (0.2–2.1) |
|
|
PAHs from coal (substantial) |
6 |
2.0 (0.8–5.3) |
|
|
PAHs from petroleum (any) |
64 |
1.0 (0.6–1.6) |
|
|
PAHs from other sources (any) |
16 |
0.7 (0.4–1.2) |
|
|
Mononuclear aromatic hydrocarbons (any) |
29 |
0.8 (0.5–1.3) |
|
|
Gustavsson et al. 1998 |
122 esophageal-cancer cases among male residents of two regions in Sweden; industrial-hygiene-derived agents (smoking-adjusted) |
|
|
|
|
PAHs (low) |
32 |
2.01 (1.16–3.48) |
|
PAHs (high) |
37 |
1.87 (1.11–3.16) |
|
|
Siemiatycki et al. 1988 |
107 esophageal-cancer cases among residents of Montreal, Canada; industrial-hygiene-derived agents (smoking-adjusted) |
|
|
|
|
Gasoline exhaust |
47 |
1.0 (0.8–1.4)b |
|
Diesel exhaust |
12 |
0.6 (0.4–0.9)b |
|
|
Jet-fuel exhaust |
2 |
2.5 (0.4–14.8)b |
|
|
Propane exhaust |
0 |
0.0 (0.0–1.7)b |
|
|
Propane combustion |
4 |
1.2 (0.5–3.0)b |
|
|
Natural-gas combustion |
3 |
0.8 (0.3–2.0)b |
|
|
Liquid-fuel combustion |
5 |
0.7 (0.3–1.4)b |
|
|
Coal combustion |
4 |
0.9 (0.4–1.9)b |
|
|
Coke combustion |
2 |
2.1 (0.5–9.8)b |
|
|
Wood combustion |
8 |
2.3 (1.2–4.5) |
|
|
a95% CIs calculated with standard methods from risks and observed numbers presented in original paper. b90% CIs reported in this paper. |
|||
TABLE 4.7 Stomach Cancer and Exposure to Fuels—Selected Epidemiologic Studies
|
Reference |
Study Population |
Exposed Cases |
Estimated Relative Risk (95% CI) |
|
Cohort Studies—Mortality |
|||
|
Lewis et al. 2000b |
Refinery workers in Toronto, Canada |
|
|
|
|
Males |
83 |
0.70 (0.56–0.87) |
|
Refinery segment |
42 |
0.80 (0.57–1.08) |
|
|
Marketing/distribution segment |
31 |
0.86 (0.58–1.22) |
|
|
Females |
4 |
0.54 (0.15–1.38) |
|
|
Ritz 1999 |
Uranium-processing workers in Fernald, Ohio—esophageal and stomach cancers (analyzed together) |
|
|
|
|
Kerosene, light exposure |
|
|
|
>2-yr duration, no lag |
10 |
1.98 (0.77–5.09) |
|
|
>2-yr duration, 15-yr lag |
9 |
3.46 (1.22–9.80) |
|
|
>5-yr duration, no lag |
5 |
0.96 (0.32–2.94) |
|
|
>5-yr duration, 15-yr lag |
3 |
1.26 (0.31–5.15) |
|
|
Kerosene, moderate exposure |
|
|
|
|
>2-yr duration, no lag |
5 |
3.00 (0.81–11.2) |
|
|
>2-yr duration, 15-yr lag |
5 |
7.71 (2.04–29.1) |
|
|
>5-yr duration, no lag |
4 |
2.86 (0.60–13.6) |
|
|
>5-yr duration, 15-yr lag |
4 |
10.7 (2.26–50.7) |
|
|
Lagorio et al. 1994 |
Filling-station attendants in Italy (exposure reconstruction using monitoring) |
6 |
0.60 (0.26–1.18)b |
|
|
Men |
6 |
0.64 (0.28–1.27)b |
|
Women |
0 |
0.0 (0.0–5.27)a |
|
|
Nelson et al. 1987 |
Amoco Oil refinery cohort |
|
|
|
|
Maintenance jobs |
4 |
0.86 |
|
Operations jobs |
9 |
2.06 |
|
|
Case-Control Study |
|||
|
Siemiatycki et al. 1987a |
250 stomach cancer cases among residents of Montreal, Canada; industrial-hygiene-derived agents (smoking-adjusted) |
|
|
|
|
Automotive gasoline |
44 |
1.5 (1.2–1.9)b |
|
Aviation gasoline |
3 |
0.8 (0.3–2.7)b |
|
|
Kerosene |
24 |
1.7 (1.2–2.3)b |
|
|
Jet fuel |
1 |
0.2 (0.0–1.7)b |
|
|
Diesel fuel |
10 |
1.0 (0.6–1.6)b |
|
|
Heating oil |
15 |
1.4 (0.9–2.1)b |
|
|
Crude oil |
3 |
1.4 (0.4–5.0)b |
|
|
aRisk estimates and 95% CIs calculated with standard methods from observed and expected numbers presented in original paper. b90% CIs presented. |
|||
TABLE 4.8 Stomach Cancer and Exposure to Combustion Products—Selected Epidemiologic Studies
|
Reference |
Study Population |
Exposed Cases |
Estimated Relative Risk (95% CI) |
|
Cohort Studies—Incidence |
|||
|
Chow et al. 1994 |
Male residents of Sweden |
|
|
|
|
Industries |
|
|
|
Transportation and communication |
1162 |
1.0 |
|
|
Occupations |
|
|
|
|
Transport and communication |
1062 |
1.0 |
|
|
Machine and engine maintenance |
348 |
1.0 (p<0.05) |
|
|
Crane operators |
66 |
1.5 (p<0.01) |
|
|
Forklift operators |
102 |
1.0 |
|
|
Dock workers |
134 |
1.3 (p<0.05) |
|
|
Warehouse workers |
443 |
1.1 (p<0.05) |
|
|
Kneller et al. 1990 |
Residents of Shanghai, China |
|
|
|
|
Fuel suppliers |
23 |
1.33 |
|
Petroleum-refinery workers |
5 |
4.39 (p<0.05) |
|
|
Boiler firemen |
118 |
1.59 (p<0.01) |
|
|
Case-Control Studies |
|||
|
Cocco et al. 1994 |
640 stomach-cancer cases among residents of Italy; occupation (not smoking-adjusted) |
|
|
|
|
Mechanics, repairmen and allied |
|
|
|
Ever worked |
36 |
1.0 (0.6–1.5) |
|
|
Worked 21+ yr |
19 |
0.8 (0.5–1.5) |
|
|
Railroad workers, drivers, and allied |
|
|
|
|
Ever worked |
51 |
1.0 (0.7–1.5) |
|
|
Worked 21+ yr |
30 |
1.3 (0.8–2.2) |
|
|
Nitrogen oxides |
|
|
|
|
Ever exposed |
453 |
1.4 (1.0–2.1) |
|
|
Exposed 21+ yr |
na |
0.7 (0.3–1.5) |
|
|
Siemiatycki et al. 1988 |
250 stomach-cancer cases among residents of Montreal, Canada; industrial-hygiene-derived agents (smoking-adjusted) |
|
|
|
|
Gasoline exhaust |
111 |
1.1 (0.9–1.3)a |
|
Diesel exhaust |
41 |
0.9 (0.7–1.1)a |
|
|
Jet-fuel exhaust |
2 |
0.8 (0.2–3.5)a |
|
|
Propane exhaust |
7 |
1.2 (0.6–2.2)a |
|
|
Propane combustion |
12 |
1.5 (0.9–2.4)a |
|
|
Natural-gas combustion |
11 |
1.3 (0.8–2.2)a |
|
|
Liquid-fuel combustion |
16 |
0.9 (0.6–1.3)a |
|
|
Coal combustion |
14 |
1.3 (0.8–2.0)a |
|
|
Coke combustion |
3 |
1.5 (0.4–5.8)a |
|
|
Weinberg et al. 1985 |
178 stomach-cancer cases among residents of four counties in Pennsylvania; next-of-kin reports (not smoking-adjusted) |
|
|
|
|
Coal heating |
162 |
|
|
Digestive-cancer controls |
|
1.69 (0.85–3.36) |
|
|
ASHD controls |
|
1.08 (0.49–2.37) |
|
|
Neighborhood controls |
|
1.20 (0.52–2.78) |
|
TABLE 4.9 Colon Cancer and Exposure to Fuels—Selected Epidemiologic Studies
|
Reference |
Study Population |
Exposed Cases |
Estimated Relative Risk (95% CI) |
|
Cohort Studies—Mortality |
|||
|
Lewis et al. 2000b |
Imperial Oil workers in Canada—cancer of the large intestine except rectum (ICD 153) |
|
|
|
|
Males |
183 |
1.06 (0.91–1.22) |
|
Refinery segment |
65 |
0.88 (0.68–1.12) |
|
|
Marketing-distribution segment |
63 |
1.20 (0.92–1.53) |
|
|
Females |
19 |
0.88 (0.53–1.37) |
|
|
Ritz 1999 |
Uranium-processing workers in Fernald, Ohio—colon and rectal cancers (analyzed together) |
|
|
|
|
Kerosene, light exposure |
|
|
|
>2-yr duration, no lag |
10 |
1.13 (0.49–2.60) |
|
|
>2-yr duration, 15-yr lag |
9 |
1.20 (0.50–2.91) |
|
|
>5-yr duration, no lag |
9 |
1.26 (0.52–3.01) |
|
|
>5-yr duration, 15-yr lag |
7 |
1.40 (0.52–3.74) |
|
|
Kerosene, moderate exposure |
|
|
|
|
>2-yr duration, no lag |
8 |
1.80 (0.64–5.06) |
|
|
>2-yr duration, 15-yr lag |
7 |
2.11 (0.75–5.97) |
|
|
>5-yr duration, no lag |
5 |
1.13 (0.31–4.18) |
|
|
>5-yr duration, 15-yr lag |
4 |
1.91 (0.50–7.27) |
|
|
Nelson et al. |
Amoco Oil refinery cohort—cancer of the large intestine |
|
|
|
Reference |
Study Population |
Exposed Cases |
Estimated Relative Risk (95% CI) |
|
1987 |
|
|
|
|
|
Maintenance jobs |
12 |
1.11 |
|
|
Operations jobs |
12 |
1.19 |
|
Case-Control Studies |
|||
|
Gerhardsson de Verdier et al. 1992 |
352 colon-cancer cases among residents of Stockholm, Sweden; self-reported occupations and agents (not smoking-adjusted) |
|
|
|
|
Petrol station and automotive repair (occupation) |
12 |
1.8 (0.6–5.2) |
|
Self-reported agents |
|
|
|
|
Combustion gases from coal, coke, and wood |
21 |
1.3 (0.6–2.5) |
|
|
Soot |
24 |
1.7 (0.8–3.4) |
|
|
Tar and asphalt |
8 |
0.7 (0.2–1.9) |
|
|
Siemiatycki et al. 1987a |
233 cases among residents of Montreal, Canada—industrial-hygiene-derived agents (smoking-adjusted) |
|
|
|
|
Colon cancer |
|
|
|
Automotive gasoline |
39 |
1.0 (0.7–1.2)a |
|
|
Aviation gasoline |
7 |
1.7 (0.7–3.6)a |
|
|
Kerosene |
14 |
0.7 (0.5–1.1)a |
|
|
Jet fuel |
7 |
2.1 (0.9–5.1)a |
|
|
Diesel fuel |
10 |
0.7 (0.4–1.1)a |
|
|
Heating oil |
13 |
0.9 (0.6–1.5)a |
|
|
Crude oil |
3 |
1.5 (0.3–6.8)a |
|
|
Rectosigmoid cancer |
|
|
|
|
Automotive gasoline |
25 |
0.9 (0.7–1.3)a |
|
|
Aviation gasoline |
3 |
0.8 (0.2–2.7)a |
|
|
Kerosene |
11 |
0.9 (0.5–1.4)a |
|
|
Jet fuel |
2 |
0.8 (0.2–3.8)a |
|
|
Diesel fuel |
4 |
0.4 (0.2–0.9)a |
|
|
Heating oil |
6 |
0.6 (0.3–1.2)a |
|
|
Crude oil |
0 |
— |
|
|
Spiegelman and Wegman 1985 |
370 colon cancer cases in seven US metropolitan areas; fuel oil; JEM-derived agents (not smoking-adjusted) |
|
|
|
|
Males: colorectal cancer |
na |
1.53 (p=0.01) |
|
Colon cancer only |
na |
1.61 (p=0.02) |
|
|
Females: colorectal cancer |
na |
1.24 (p=0.21) |
|
|
Colon cancer only |
na |
1.34 (p=0.12) |
|
|
NOTE: na=not available. a90% CIs reported in this paper. |
|||
TABLE 4.10 Colon Cancer and Exposure to Combustion Products—Selected Epidemiologic Studies
|
Reference |
Study Population |
Exposed Cases |
Estimated Relative Risk (95% CI) |
|
Case-Control Studies |
|||
|
Goldberg et al. 2001 |
497 colon cancer cases among residents of Montreal, Canada; industrial-hygiene-derived agent (smoking-adjusted) |
|
|
|
|
Diesel-engine emissions |
|
|
|
Nonsubstantial |
45 |
1.2 (0.8–1.8) |
|
|
Substantial |
35 |
1.6 (1.0–2.5) |
|
|
Reference |
Study Population |
Exposed Cases |
Estimated Relative Risk (95% CI) |
|
Gerhardsson de Verdier et al. 1992 |
352 colon-cancer cases among residents of Stockholm, Sweden; self-reported occupations, agents (not smoking-adjusted) |
|
|
|
|
Railway work |
5 |
1.4 (0.3–6.3) |
|
Combustion gases from coal, coke, and wood |
21 |
1.3 (0.6–2.5) |
|
|
Soot |
24 |
1.7 (0.8–3.4) |
|
|
Tar and asphalt |
8 |
0.7 (0.2–1.9) |
|
|
Siemiatycki et al. 1988 |
364 colon-cancer cases among residents of Montreal, Canada; industrial-hygiene-derived agents (smoking-adjusted) |
|
|
|
|
Gasoline exhaust |
147 |
1.0 (0.9–1.2)a |
|
Diesel exhaust |
68 |
1.3 (1.1–1.6)a |
|
|
Short, low |
6 |
0.7 (0.3–1.4)a |
|
|
Short, high |
5 |
0.6 (0.3–1.3)a |
|
|
Long, low |
27 |
1.5 (1.0–2.2)a |
|
|
Long, high |
30 |
1.7 (1.2–2.5)a |
|
|
Jet-fuel exhaust |
4 |
1.3 (0.4–4.2)a |
|
|
Propane exhaust |
7 |
0.9 (0.5–1.8)a |
|
|
Propane combustion |
12 |
1.0 (0.6–1.6)a |
|
|
Natural-gas combustion |
6 |
0.5 (0.2–0.9)a |
|
|
Liquid-fuel combustion |
19 |
0.9 (0.6–1.4)a |
|
|
Coal combustion |
8 |
0.5 (0.3–0.8)a |
|
|
Coke combustion |
2 |
0.7 (0.1–3.5)a |
|
|
a90% CIs reported in this paper. |
|||
TABLE 4.11 Rectal Cancer and Exposure to Fuels—Selected Epidemiologic Studies
|
Reference |
Study Population |
Exposed Cases |
Estimated Relative Risk (95% CI) |
|
Cohort Studies—Mortality |
|||
|
Lewis et al. 2000b |
Refinery workers in Toronto, Canada |
|
|
|
|
Males |
55 |
0.87 (0.65–1.13) |
|
Refinery segment |
30 |
1.09 (0.73–1.55) |
|
|
Marketing and distribution segment |
12 |
0.62 (0.32–1.08) |
|
|
Females |
3 |
0.60 (0.12–1.74) |
|
|
Ritz 1999 |
Uranium-processing workers in Fernald, Ohio—colon and rectal cancers (analyzed together) |
|
|
|
|
Kerosene, light exposure |
|
|
|
>2-yr duration, no lag |
10 |
1.13 (0.49–2.60) |
|
|
>2-yr duration, 15-yr lag |
9 |
1.20 (0.50–2.91) |
|
|
>5-yr duration, no lag |
9 |
1.26 (0.52–3.01) |
|
|
>5-yr duration, 15-yr lag |
7 |
1.40 (0.52–3.74) |
|
|
Kerosene, moderate exposure |
|
|
|
|
>2-yr duration, no lag |
8 |
1.80 (0.64–5.06) |
|
|
>2-yr duration, 15-yr lag |
7 |
2.11 (0.75–5.97) |
|
|
>5-yr duration, no lag |
5 |
1.13 (0.31–4.18) |
|
|
>5-yr duration, 15-yr lag |
4 |
1.91 (0.50–7.27) |
|
|
Nelson et al. |
Amoco Oil refinery cohort |
|
|
|
Reference |
Study Population |
Exposed Cases |
Estimated Relative Risk (95% CI) |
|
1987 |
|
|
|
|
|
Maintenance jobs |
5 |
1.67 |
|
|
Operations jobs |
5 |
1.78 |
|
Case-Control Studies |
|||
|
Gerhardsson de Verdier et al. 1992 |
217 rectal-cancer cases among residents of Stockholm, Sweden; self-reported agents (not smoking-adjusted) |
|
|
|
|
Petrol station/automotive repair |
7 |
1.5 (0.4–5.6) |
|
Combustion gases from coal, coke, and wood |
21 |
2.1 (1.0–4.6) |
|
|
Soot |
21 |
2.7 (1.2–5.7) |
|
|
Tar and asphalt |
7 |
1.0 (0.3–2.8) |
|
|
Siemiatycki et al. 1987a |
190 rectal-cancer cases among residents of Montreal, Canada; industrial-hygiene-derived agents (smoking-adjusted) |
|
|
|
|
Automotive gasoline |
24 |
1.1 (0.8–1.6)a |
|
Aviation gasoline |
4 |
2.5 (0.6–10.3)a |
|
|
Kerosene |
11 |
0.9 (0.6–1.6)a |
|
|
Jet fuel |
4 |
2.1 (0.6–7.4)a |
|
|
Diesel fuel |
11 |
1.4 (0.8–2.5)a |
|
|
Heating oil |
11 |
1.5 (0.8–2.6)a |
|
|
Spiegelman and Wegman 1985 |
Colon and rectal cancer cases in seven US metropolitan areas |
|
|
|
|
Fuel oil: males; colorectal cancer |
na |
1.53 (p=0.01) |
|
Colon-cancer only |
na |
1.61 (p=0.02) |
|
|
Females: colorectal cancer |
na |
1.24 (p=0.21) |
|
|
Colon-cancer only |
na |
1.34 (p=0.12) |
|
|
NOTE: na=not available. a90% CIs presented. |
|||
TABLE 4.12 Rectal Cancer and Exposure to Combustion Products—Selected Epidemiologic Studies
|
Reference |
Study Population |
Exposed Cases |
Estimated Relative Risk (95% CI) |
|
Case-Control Studies |
|||
|
Dumas et al. 2000 |
257 rectal-cancer cases among residents of Montreal, Canada; industrial-hygiene-derived agents (smoking-adjusted) |
|
|
|
|
Soot |
|
|
|
Any |
17 |
0.8 (0.5–1.3) |
|
|
Substantial |
4 |
0.8 (0.3–2.4) |
|
|
Coal |
|
|
|
|
Any |
8 |
0.6 (0.3–1.3) |
|
|
Substantial |
6 |
1.3 (0.5–3.3) |
|
|
Wood |
|
|
|
|
Any |
9 |
0.7 (0.3–1.4) |
|
|
Substantial |
4 |
1.0 (0.3–3.2) |
|
|
Gerhardsson de Verdier et al. 1992 |
217 rectal-cancer cases among residents of Stockholm, Sweden; self-reported agents (not smoking-adjusted) |
|
|
|
Reference |
Study Population |
Exposed Cases |
Estimated Relative Risk (95% CI) |
|
|
Railway work |
5 |
2.3 (0.5–10.4) |
|
Combustion gases from coal, coke, and wood |
21 |
2.1 (1.0–4.6) |
|
|
Soot |
21 |
2.7 (1.2–5.7) |
|
|
Tar and asphalt |
7 |
1.0 (0.3–2.8) |
|
|
Siemiatycki et al. 1988 |
190 rectal-cancer cases among residents of Montreal, Canada; industrial-hygiene-derived agents (smoking-adjusted) |
|
|
|
|
Gasoline exhaust |
89 |
1.2 (1.0–1.7)a |
|
Short, low |
17 |
1.3 (0.8–2.1)a |
|
|
Short, high |
9 |
1.0 (0.5–1.8)a |
|
|
Long, low |
27 |
1.1 (0.7–1.6)a |
|
|
Long, high |
36 |
1.6 (1.1–2.3)a |
|
|
Diesel exhaust |
35 |
1.1 (0.9–1.5)a |
|
|
Jet-fuel exhaust |
3 |
1.7 (0.4–7.8)a |
|
|
Propane exhaust |
3 |
0.7 (0.2–2.4)a |
|
|
Propane combustion |
10 |
1.1 (0.6–1.9)a |
|
|
Natural-gas combustion |
5 |
0.8 (0.3–1.8)a |
|
|
Liquid-fuel combustion |
14 |
1.1 (0.7–1.8)a |
|
|
Coal combustion |
7 |
0.7 (0.4–1.3)a |
|
|
Coke combustion |
0 |
0.0 (0.0–1.7)a |
|
|
a90% CIs reported in this paper. |
|||
TABLE 4.13 Hepatic Cancer and Exposure to Fuels—Selected Epidemiologic Studies
|
Reference |
Study Population |
Exposed Cases |
Estimated Relative Risk (95% CI) |
|
Case-Control Study |
|||
|
Stemhagen et al. 1983 |
265 hepatic-cancer cases among residents of New Jersey; industries (not smoking-adjusted) |
|
|
|
|
Motor vehicles and equipment manufacturing |
11 |
2.20 (0.95–5.07) |
|
Gasoline service stations |
12 |
2.88 (1.20–6.88) |
|
TABLE 4.14 Hepatic Cancer and Exposure to Combustion Products—Selected Epidemiologic Studies
|
Reference |
Study Population |
Exposed Cases |
Estimated Relative Risk (95% CI) |
|
Case-Control Study |
|||
|
Stemhagen et al. 1983 |
265 hepatic cancer cases among residents of New Jersey; industries (not smoking-adjusted) |
|
|
|
|
Bus lines |
7 |
2.80 (0.93–8.40) |
|
Gasoline service stations |
12 |
2.88 (1.20–6.88) |
|
TABLE 4.15 Pancreatic Cancer and Exposure to Fuels—Selected Epidemiologic Studies
|
Reference |
Study Population |
Exposed Cases |
Estimated Relative Risk (95% CI) |
|
Cohort Studies |
|||
|
Lewis et al. 2003 |
Petroleum workers in Canada |
|
|
|
|
Males, mortality |
4 |
0.51 (0.14–1.31) |
|
Females, mortality |
1 |
0.48 (0.01–2.69)a |
|
|
Males, incidence |
5 |
0.59 (0.19–1.39) |
|
|
Females, incidence |
0 |
0.00 (0.00–1.63)a |
|
|
Ritz et al. 1999 |
Uranium-processing workers in Fernald, Ohio |
|
|
|
|
Kerosene, light exposure |
|
|
|
>5-yr duration, 15-yr lag |
na |
1.33 (0.31–5.66) |
|
|
Kerosene, moderate exposure |
|
|
|
|
>5-yr duration, 15-yr lag |
na |
2.78 (0.51–15.2) |
|
|
NOTE: na=not available. aUnadjusted risk estimates and 95% CIs calculated with standard methods from observed and expected numbers presented in original paper. |
|||
TABLE 4.16 Pancreatic Cancer and Exposure to Combustion Products—Selected Epidemiologic Studies
|
Reference |
Study Population |
Exposed Cases |
Estimated Relative Risk (95% CI) |
|
Case-Control Studies |
|||
|
Alguacil et al. 2000 |
185 pancreatic-cancer cases among residents of eastern Spain (smoking-adjusted) |
|
|
|
|
Industrial-hygiene assessment |
|
|
|
PAHs |
13 |
0.81 (0.37–1.76) |
|
|
Low |
10 |
0.74 (0.31–1.77) |
|
|
High |
3 |
1.11 (0.24–5.21) |
|
|
Exposed ≥10-yr, 10 yr before diagnosis |
|
|
|
|
Low |
8 |
1.08 (0.39–3.00) |
|
|
High |
2 |
1.73 (0.22–13.8) |
|
|
Finnish JEM assessment (substantial vs low exposure) |
|
|
|
|
Benzo[a]pyrene |
6 |
3.10 (0.73–13.2) |
|
|
Diesel-engine exhaust |
4 |
2.39 (0.50–11.4) |
|
|
Gasoline-engine exhaust |
4 |
2.42 (0.51–11.6) |
|
|
PAHs |
2 |
0.78 (0.12–5.18) |
|
|
Kauppinen et al. 1995 |
595 pancreatic-cancer cases among residents of Finland; JEM-derived agents (smoking-adjusted) |
|
|
|
|
Engine exhaust |
19 |
0.89 (0.51–1.53) |
|
PAHs |
14 |
1.33 (0.69–2.57) |
|
|
Siemiatycki et al. 1988 |
117 pancreatic-cancer cases among residents of Montreal, Canada; industrial-hygiene-derived agents (smoking-adjusted) |
|
|
|
|
Gasoline exhaust |
47 |
0.9 (0.7–1.2)a |
|
Diesel exhaust |
15 |
0.6 (0.4–0.9)a |
|
|
Jet-fuel exhaust |
2 |
1.6 (0.3–7.7)a |
|
|
Propane exhaust |
2 |
0.7 (0.2–2.5)a |
|
|
Propane combustion |
3 |
0.8 (0.3–2.2)a |
|
|
Reference |
Study Population |
Exposed Cases |
Estimated Relative Risk (95% CI) |
|
|
Natural-gas combustion |
6 |
1.5 (0.7–3.1)a |
|
Liquid-fuel combustion |
10 |
1.3 (0.8–2.3)a |
|
|
Coal combustion |
10 |
2.3 (1.4–4.0)a |
|
|
Nonsubstantial |
2 |
0.7 (0.2–2.4)a |
|
|
Substantial |
8 |
3.5 (1.7–7.3)a |
|
|
Coke combustion |
2 |
2.2 (0.4–10.5)a |
|
|
NOTE: na=not available. a90% CIs reported in this paper. |
|||
TABLE 4.17 Laryngeal Cancer and Exposure to Fuels—Selected Epidemiologic Studies
|
Reference |
Study Population |
Exposed Cases |
Estimated Relative Risk (95% CI) |
|
Cohort Study—Mortality |
|||
|
Lagorio et al. 1994 |
Male filling-station attendants in Italy |
|
|
|
|
Stations of all sizes |
3 |
1.05 (0.29–2.72)a |
|
Small stations |
3 |
1.53 (0.42–3.96)a |
|
|
Case-Control Studies |
|||
|
De Stefani et al. 1998 |
112 laryngeal-cancer cases among residents of Montevideo, Uruguay (smoking-adjusted) |
|
|
|
|
Gasoline fillers (job title) |
2 |
1.4 (0.2–7.7) |
|
Gasoline (self-reported agent) |
22 |
1.4 (0.8–2.6) |
|
|
1–20 yr |
6 |
1.1 (0.4–2.8) |
|
|
21+ yr |
16 |
1.7 (0.9–3.5) |
|
|
Supraglottic |
na |
1.3 (0.5–3.4) |
|
|
Glottic |
na |
2.5 (0.8–8.2) |
|
|
Wortley et al. 1992 |
235 laryngeal-cancer cases among residents of 13 counties in western Washington; occupation (smoking-adjusted) |
|
|
|
|
Vehicle mechanics |
32 |
1.2 (0.6–2.1) |
|
Garage and service-station work |
12 |
0.8 (0.4–1.8) |
|
|
Ahrens et al. 1991 |
100 laryngeal-cancer cases among residents of Bremen, Germany; self-reported agents (smoking-adjusted) |
|
|
|
|
Diesel oil |
na |
1.7 (0.8–3.5) |
|
Gasoline |
na |
2.8 (1.0–7.7) |
|
|
Brown et al. 1988 |
183 laryngeal-cancer cases among residents along Gulf Coast of Texas; industry (smoking-adjusted) |
|
|
|
|
Petroleum refining and chemical manufacturing (ever vs never) |
47 |
0.93 (0.59–1.46) |
|
NOTE: na=not available. a90% CIs reported. |
|||
TABLE 4.18 Laryngeal Cancer and Exposure to Combustion Products—Selected Epidemiologic Studies
|
Reference |
Study Population |
Exposed Cases |
Estimated Relative Risk (95% CI) |
|
Cohort Study—Incidence |
|||
|
Boffetta et al. 2001 |
Cohort exposed to diesel exhausted defined on industrial-hygiene coding of occupation on 1960 Swedish census (not smoking-adjusted) |
|
|
|
|
Males |
730 |
1.09 (1.01–1.17) |
|
Probability of exposure |
|
|
|
|
Low |
272 |
1.1 (0.99–1.27) |
|
|
Medium |
218 |
0.92 (0.80–1.05) |
|
|
High |
204 |
1.1 (0.96–1.28) |
|
|
Intensity of exposure |
|
|
|
|
Low |
473 |
1.1 (0.95–1.17) |
|
|
Medium |
127 |
1.1 (0.88–1.26) |
|
|
High |
94 |
0.99 (0.81–1.22) |
|
|
Females |
5 |
2.39 (0.78–5.57) |
|
|
Case-Control Studies |
|||
|
1,010 cases of laryngeal cancer (ICD-9 161) or hypopharyngeal cancer (ICD-9 146.4, 146.5, 148, 149.8) among male residents of France, Italy, Spain, and Switzerland (IARC six-center study) (smoking-adjusted) |
|
|
|
|
Boffetta et al. 2003 |
Railway transport (ever vs never) (industry) |
44 |
1.52 (0.97–2.39) |
|
|
Duration |
|
p for trend=0.02 |
|
1–10 yr |
11 |
1.1 |
|
|
11–20 yr |
5 |
0.3 |
|
|
21+ yr |
28 |
2.2 (p<0.05) |
|
|
Occupations (ever vs never) |
|
|
|
|
Motor-vehicle mechanics |
17 |
1.09 (0.55–2.16) |
|
|
Other mechanic |
42 |
1.39 (0.87–2.23) |
|
|
Railway-vehicle loaders |
14 |
1.39 (0.61–3.15) |
|
|
Lorry drivers, local |
42 |
1.14 (0.73–1.79) |
|
|
Lorry drivers, long-distance |
37 |
1.28 (0.78–2.10) |
|
|
Other motor-vehicle drivers |
12 |
1.32 (0.58–3.03) |
|
|
Berrino et al. 2003 |
695 cases ≥55 yr old |
|
|
|
|
PAHs (JEM-derived agent) |
na |
1.0 (0.7–1.3) |
|
315 cases <55 yr old |
|
|
|
|
PAHs (JEM-derived agent) |
263 |
0.7 (0.3–1.4) |
|
|
Likelihood of exposure |
|
|
|
|
Possible |
107 |
0.5 (0.2–1.1) |
|
|
Probable |
156 |
0.8 (0.3–1.8) |
|
|
Duration of exposure |
|
|
|
|
<10 yr |
na |
0.6 (0.2–1.8) |
|
|
10–19 yr |
na |
0.9 (0.4–2.1) |
|
|
≥20 yr |
na |
1.1 (0.5–2.4) |
|
|
Elci et al. 2003 |
940 laryngeal-cancer cases among male residents of Istanbul, Turkey (smoking-adjusted) |
|
|
|
|
Diesel exhaust (JEM-derived agent) |
297 |
1.5 (1.3–1.9) |
|
Intensity of exposure |
|
|
|
|
Low |
161 |
1.5 (1.1–1.8) |
|
|
Medium |
91 |
1.7 (1.2–2.3) |
|
|
High |
45 |
1.6 (1.0–2.4) |
|
|
Reference |
Study Population |
Exposed Cases |
Estimated Relative Risk (95% CI) |
|
|
Probability of exposure |
|
|
|
Low |
92 |
1.6 (1.2–2.2) |
|
|
Medium |
148 |
1.5 (1.1–1.9) |
|
|
High |
57 |
1.6 (1.1–2.4) |
|
|
Gasoline exhaust (JEM-derived agent) |
220 |
1.6 (1.3–2.0) |
|
|
Intensity of exposure |
|
|
|
|
Low |
141 |
1.5 (1.2–2.0) |
|
|
Medium |
78 |
1.8 (1.3–2.5) |
|
|
Probability of exposure |
|
|
|
|
Low |
86 |
1.6 (1.1–2.2) |
|
|
Medium |
131 |
1.7 (1.3–2.2) |
|
|
High |
3 |
0.7 (0.2–2.9) |
|
|
PAHs (JEM-derived agent) |
376 |
1.3 (1.1–1.6) |
|
|
Intensity of exposure |
|
|
|
|
Low |
189 |
1.4 (1.1–1.7) |
|
|
Medium |
138 |
1.3 (1.0–1.6) |
|
|
High |
49 |
1.5 (1.0–2.2) |
|
|
Probability of exposure |
|
|
|
|
Low |
106 |
1.4 (1.0–1.8) |
|
|
Medium |
176 |
1.4 (1.1–1.7) |
|
|
High |
94 |
1.3 (1.0–1.7) |
|
|
Elci et al. 2001 |
Occupations |
|
|
|
|
Drivers |
75 |
1.7 (1.1–2.4) |
|
Glottis |
22 |
2.2 (1.3–3.8) |
|
|
Supraglottis |
27 |
1.2 (0.7–1.9) |
|
|
Other |
26 |
1.8 (1.1–3.1) |
|
|
Mechanics |
28 |
0.8 (0.5–1.3) |
|
|
De Stefani et al. 1998 |
112 laryngeal-cancer cases among male residents of Montevideo, Uruguay (smoking-adjusted) |
|
|
|
|
Automobile mechanic (job title) |
8 |
1.1 (0.5–2.8) |
|
Supraglottic |
na |
1.3 (0.3–5.9) |
|
|
Glottic |
na |
5.5 (1.3–23.5) |
|
|
Truck driver (job title) |
8 |
0.8 (0.3–1.8) |
|
|
Supraglottic |
na |
0.6 (0.1–2.9) |
|
|
Glottic |
na |
2.7 (0.7–10.7) |
|
|
Tractor driver (job title) |
7 |
0.6 (0.2–1.5) |
|
|
Gasoline fillers (job title) |
2 |
1.4 (0.2–7.7) |
|
|
Diesel exhausts (self-reported agent) |
17 |
0.8 (0.4–1.4) |
|
|
1–20 yr |
3 |
0.3 (0.1–0.9) |
|
|
20+ yr |
14 |
1.4 (0.7–2.8) |
|
|
Supraglottic |
na |
0.7 (0.2–1.9) |
|
|
Glottic |
na |
1.9 (0.6–5.8) |
|
|
Gasoline exhausts (self-reported agent) |
22 |
0.9 (0.6–1.8) |
|
|
1–20 yr |
7 |
0.8 (0.3–1.9) |
|
|
20+ yr |
15 |
1.2 (0.6–2.3) |
|
|
Supraglottic |
na |
0.8 (0.3–2.1) |
|
|
Glottic |
na |
1.8 (0.6–5.7) |
|
|
Gustavsson et al. 1998 |
Laryngeal-cancer cases among male residents of two regions in Sweden |
|
|
|
|
PAHs (low) |
26 |
0.77 (0.46–1.28) |
|
PAHs (high) |
53 |
1.47 (0.96–2.24) |
|
Reference |
Study Population |
Exposed Cases |
Estimated Relative Risk (95% CI) |
|
Pintos et al. 1998 |
Laryngeal-cancer cases among residents of three cities in southern Brazil |
|
|
|
|
Use of wood stove |
na |
2.34 (1.17–4.67) |
|
Males |
|
2.03 (1.12–3.67) |
|
|
Females |
|
16.24 (2.66–99.1) |
|
|
Goldberg et al. 1997 |
Laryngeal cancer cases among male residents of France |
|
|
|
|
Industry |
|
|
|
Railway transportation |
30 |
1.4 (0.6–3.1) |
|
|
Road transportation |
31 |
1.0 (0.4–2.1) |
|
|
Other transportation |
16 |
0.8 (0.3–2.2) |
|
|
Repair of motor vehicles |
21 |
0.9 (0.4–2.0) |
|
|
Occupation |
|
|
|
|
Motor-vehicle mechanics |
27 |
1.2 (0.5–2.5) |
|
|
Transport-equipment operators |
118 |
1.4 (0.9–2.3) |
|
|
Maier and Tisch 1997 |
Laryngeal-cancer cases among residents of Heidelberg, Germany |
na |
|
|
|
PAH |
|
2.7 (1.2–6.1) |
|
Fossil-fuel single stove |
|
|
|
|
0–20 yr |
|
1.0 |
|
|
20–40 yr |
|
1.2 (0.8–1.9) |
|
|
>40 yr |
|
2.5 (1.5–4.1) |
|
|
Dietz et al. 1995 |
Laryngeal-cancer cases among residents of Heidelberg, Germany |
|
|
|
|
Air pollution on job (>20 yr) |
34 |
1.44 (0.91–2.26)a |
|
Traffic jams on way to work (>20 yr) |
23 |
0.69 (0.41–1.14)a |
|
|
High traffic emissions, residential (>20 yr) |
39 |
33.8 (13.34–90.85)a |
|
|
Outdoor air pollution, residential (>20 yr) |
21 |
1.00 (0.58–1.71)a |
|
|
Heating, fossil-fuel stoves (>40 yr) |
57 |
2.11 (1.43–3.12)a |
|
|
Cooking, fossil-fuel stoves (>20 yr) |
33 |
1.47 (0.92–2.33)a |
|
|
Coal, briquette, or coke heating |
138 |
1.52 (0.94–2.47)a |
|
|
Gas heating |
16 |
0.52 (0.29–0.93)a |
|
|
Muscat and Wynder 1995 |
Laryngeal cancer cases among residents of New York, Illinois, Michigan, and Pennsylvania |
|
|
|
|
Truck driver |
30 |
1.22 (0.65–2.28)a |
|
Diesel-exhaust jobs |
36 |
0.96 (0.5–1.8) |
|
|
Automobile mechanics |
13 |
130 (0.4–4.1) |
|
|
Diesel exhaust |
13 |
1.47 (0.5–4.1) |
|
|
Diesel fumes |
16 |
6.4 (1.8–22.6) |
|
|
Pollan and Lopez-Abente 1995 |
Laryngeal-cancer cases among male residents of Madrid, Spain |
|
|
|
|
Mechanics and assembly workers |
8 |
1.56 (0.49–4.98) |
|
1–20 yr |
4 |
1.21 (0.25–5.82) |
|
|
>20 yr |
4 |
3.04 (0.52–17.71) |
|
|
Transport drivers |
8 |
2.71 (0.85–8.64) |
|
|
1–20 yr |
3 |
5.76 (0.71–46.48) |
|
|
>20 yr |
4 |
1.96 (0.43–8.96) |
|
Reference |
Study Population |
Exposed Cases |
Estimated Relative Risk (95% CI) |
|
Wortley et al. 1992 |
Laryngeal-cancer cases among residents of western Washington state |
|
|
|
|
Vehicle mechanics |
32 |
1.2 (0.6–2.1) |
|
<10 yr |
|
0.6 |
|
|
≥10 yr |
3.2 |
||
|
Motor vehicle operators |
54 |
1.3 (0.8–2.1) |
|
|
<10 yr |
|
1.6 |
|
|
≥10 yr |
0.8 |
||
|
Transportation, motor vehicles |
19 |
1.3 (0.6–2.8) |
|
|
<10 yr |
|
1.1 |
|
|
≥10 yr |
0.8 |
||
|
Diesel fumes—peak |
|
|
|
|
None |
112 |
1.0 |
|
|
Low |
58 |
1.2 (0.7–1.9) |
|
|
Medium |
65 |
1.1 (0.7–1.8) |
|
|
Diesel fumes—duration |
|
|
|
|
<1 yr |
118 |
1.0 |
|
|
1–9 yr |
70 |
1.0 (0.7–1.6) |
|
|
≥10 yr |
47 |
1.0 (0.6–1.8) |
|
|
Diesel fumes—exposure scores |
|
|
|
|
<5 |
158 |
1.0 |
|
|
5–19 |
39 |
1.3 (0.7–2.2) |
|
|
>20 |
38 |
1.0 (0.6–1.7) |
|
|
Ahrens et al. 1991 |
Laryngeal-cancer cases among male residents of Bremen, Germany (smoking-adjusted) |
|
|
|
|
Transportation and communication (industry) |
24 |
1.3 (0.64–2.59) |
|
Fumes or smoke (self-reported agent) |
na |
0.7 (0.3–1.4) |
|
|
Brown et al. 1988 |
183 laryngeal-cancer cases among residents along gulf coast of Texas (smoking-adjusted) |
|
|
|
|
Transportation, communication, utilities, and sanitary services (industry) |
63 |
1.62 (1.04–2.51) |
|
Transportation (occupation) |
39 |
1.42 (0.86–2.36) |
|
|
Specific occupations |
|
|
|
|
Driver |
15 |
1.69 (0.75–3.83) |
|
|
Mechanic |
33 |
1.06 (0.63–1.77) |
|
|
Diesel or gasoline fumes (industrial-hygiene-coded agent) |
79 |
1.50 (1.00–2.26) |
|
|
<5 yr |
32 |
1.8 (1.0–3.1) |
|
|
5–14 yr |
16 |
1.3 (0.6–2.7) |
|
|
≥15 yr |
26 |
1.6 (0.8–2.9) |
|
|
Decoufle and Stanislawczyk 1977 |
Laryngeal cancer cases among male patients at Roswell Park Memorial Institute in Buffalo, New York (job history, including durations, from medical charts) (smoking-adjusted) |
|
|
|
|
Occupations (ever) |
|
|
|
Bus, taxicab, and truck drivers |
na |
0.95 |
|
|
Delivery and routemen |
na |
0.68 |
|
|
Locomotive engineers and firemen |
na |
1.07, ns |
|
|
Machinists |
na |
1.38, ns |
TABLE 4.19 Lung Cancer and Exposure to Fuels—Selected Epidemiologic Studies
|
Reference |
Study Population |
Exposed Cases |
Estimated Relative Risk (95% CI) |
|
Cohort Study—Mortality |
|||
|
Lewis et al. 2000b |
Refinery workers in Toronto, Canada |
|
|
|
|
Males |
478 |
0.85 (0.77–0.93) |
|
Refinery segment |
221 |
0.96 (0.83–1.09) |
|
|
Marketing and distribution segment |
150 |
0.87 (0.74–1.02) |
|
|
Females |
34 |
1.10 (0.76–1.53) |
|
|
Case-Control Studies |
|||
|
Rosamilia et al. 1999 |
Lung-cancer cases nested among refinery workers at Mobil in Beaumont, Texas |
|
|
|
|
Process operations, duration of employment |
|
|
|
0 yr |
50 |
1.0 |
|
|
<5 yr |
12 |
0.66 (0.31–1.36) |
|
|
5–14 yr |
9 |
0.64 (0.28–1.44) |
|
|
15+ yr |
41 |
1.34 (0.82–2.19) |
|
|
Maintenance and mechanical operations, duration of employment |
|
|
|
|
0 yr |
18 |
1.0 |
|
|
<5 yr |
26 |
1.12 (0.55–2.31) |
|
|
5–14 yr |
26 |
0.70 (0.35–1.42) |
|
|
15+ yr |
42 |
1.32 (0.68–2.55) |
|
|
Siemiatycki et al. 1987a |
857 lung-cancer cases among residents of Montreal, Canada; industrial-hygiene-derived agents (smoking-adjusted) |
|
|
|
|
Automotive gasoline |
|
|
|
Oat cell |
26 |
1.2 (0.8–1.6)a |
|
|
Squamous cell |
53 |
1.0 (0.8–1.3) |
|
|
Adenocarcinoma |
26 |
1.1 (0.8–1.5) |
|
|
Other cell types |
19 |
0.8 (0.6–1.1) |
|
|
Aviation gasoline |
|
|
|
|
Oat cell |
1 |
0.4 (0.1–3.2) |
|
|
Squamous cell |
2 |
0.4 (0.1–1.6) |
|
|
Adenocarcinoma |
2 |
0.9 (0.2–3.8) |
|
|
Other cell types |
1 |
0.4 (0.1–3.1) |
|
|
Kerosene |
|
|
|
|
Oat cell |
0 |
0.9 (0.6–1.5) |
|
|
Squamous cell |
34 |
1.4 (1.0–1.9) |
|
|
Adenocarcinoma |
15 |
1.5 (1.0–2.3) |
|
|
Other cell types |
13 |
1.2 (0.8–1.9) |
|
|
Jet fuel |
|
|
|
|
Oat cell |
2 |
1.3 (0.2–7.0) |
|
TABLE 4.20 Lung Cancer and Exposure to Combustion Products—Selected Epidemiologic Studies
|
Reference |
Study Population |
Exposed Cases |
Estimated Relative Risk (95% CI) |
|
Ambient Air Pollution |
|||
|
Cohort Study—Incidence |
|||
|
Nafstad et al. 2003 |
Male residents of Oslo, Norway (smoking-adjusted) |
|
|
|
|
NOx |
|
|
|
0–9.99 μg/m3 |
18 |
1.00 |
|
|
10–19.99 μg/m3 |
17 |
1.02 (0.75–1.39) |
|
|
20–20.99 μg/m3 |
22 |
1.33 (0.87–2.04) |
|
|
30+ μg/m3 |
24 |
2.22 (1.30–3.79) |
|
|
Per 10 μg/m3 |
|
1.10 (1.03–1.17) |
|
|
SO2 |
|
|
|
|
0–9.99 μg/m3 |
18 |
1.00 |
|
|
10–19.99 μg/m3 |
21 |
0.84 (0.57–1.23) |
|
|
20–20.99 μg/m3 |
20 |
0.78 (0.53–1.16) |
|
|
30+ μg/m3 |
18 |
0.56 (0.33–0.95) |
|
|
Per 10 μg/m3 |
|
0.96 (0.88–1.04) |
|
|
Cohort Studies—Mortality |
|||
|
Hoek et al. 2002 |
Residents of Netherlands—Netherlands Cohort Study on Diet and Cancer (smoking-adjusted) |
|
|
|
|
Black smoke |
na |
1.06 (0.43–2.63) |
|
NO2 |
na |
1.25 (0.42–3.72) |
|
|
Pope et al. 2002 |
Residents of US—Cancer Prevention Study II (smoking-adjusted) |
na |
|
|
|
PM2.5 mean conc.; per 10 μg/m3 |
|
1.14 (1.04–1.23) |
|
SO4 mean conc.; per 6.5 μg/m3 |
1.10 (1.04–1.15)a |
||
|
SO2 mean conc.; per 9.7 ppb |
1.03 (0.98–1.07)a |
||
|
NO2 mean conc.; per 27.9 ppb |
0.96 (0.88–1.05)a |
||
|
CO mean conc.; per 1.7 ppm |
0.97 (0.92–1.03)a |
||
|
Reference |
Study Population |
Exposed Cases |
Estimated Relative Risk (95% CI) |
|
|
O3 mean conc.; per 47.9 ppb |
|
0.96 (0.86–1.06)a |
|
Krewski et al. 2003 |
Residents of the US—Harvard Six Cities Study (smoking-adjusted) |
na |
|
|
|
PM2.5 mean conc.; per 18.5 μg/m3 |
|
1.17 (0.67–2.04) |
|
SO4 mean conc.; per 7.5 μg/m3 |
1.14 (0.66–1.96) |
||
|
SO2 mean conc.; per 19.8 ppb |
1.13 (0.66–1.95) |
||
|
NO2 mean conc.; per 15.8 ppb |
1.15 (0.65–2.04) |
||
|
Abbey et al. 1999 |
Seventh-Day Adventist nonsmokers in California (smoking-adjusted) |
|
|
|
|
Males |
18 total |
|
|
PM10>100 μg/m3; per 43 days/yr |
|
2.38 (1.42–3.97) |
|
|
PM10 mean conc.; per 24.08 μg/m3 |
3.36 (1.57–7.19) |
||
|
SO2 mean conc.; per 3.72 ppb |
1.99 (1.24–3.20) |
||
|
NO2 mean conc.; per 19.78 ppb |
1.82 (0.93–3.57) |
||
|
Females |
12 total |
|
|
|
PM10>100 μg/m3; per 43 days/yr |
|
1.08 (0.55–2.13) |
|
|
PM10 mean conc.; per 24.08 μg/m3 |
1.33 (0.60–2.96) |
||
|
SO2 mean conc.; per 3.72 ppb |
3.01 (1.88–4.84) |
||
|
NO2 mean conc.; per 19.78 ppb |
2.81 (1.15–6.89) |
||
|
Beeson et al. 1998 |
Seventh-Day Adventist male nonsmokers in California—Incidence (smoking-adjusted) |
16 total |
|
|
|
PM10, hour in excess of μg/m3 |
|
|
|
40 μg/m3 |
|
4.50 (1.31–15.44) |
|
|
50 μg/m3 |
4.96 (1.54–16.00) |
||
|
60 μg/m3 |
4.72 (1.69–13.18) |
||
|
80 μg/m3 |
3.43 (1.71–6.88) |
||
|
100 μg/m3 |
2.95 (1.71–5.09) |
||
|
PM10 mean conc.; per 24 μg/m3 |
5.21 (1.94–13.99) |
||
|
SO2 mean conc.; per 3.7 ppb |
2.66 (1.62–4.39) |
||
|
NO2 mean conc.; per 1.98 ppb |
1.45 (0.67–3.14) |
||
|
Case-Control Studies |
|||
|
Nyberg et al. 2000 |
1,042 lung-cancer cases among residents of Stockholm, Sweden; residence linked to detailed emission database (smoking-adjusted) |
|
|
|
|
Traffic-related air pollution—NO2; 30-yr averages |
|
|
|
Per 10 μg/m3 |
|
1.05 (0.93–1.18) |
|
|
<15.20 μg/m3 |
242 |
1.0 |
|
|
15.20–19.84 μg/m3 |
276 |
1.18 (0.93–1.49) |
|
|
19.85–25.05 μg/m3 |
252 |
0.90 (0.71–1.14) |
|
|
25.06–30.54 μg/m3 |
160 |
1.05 (0.79–1.40) |
|
|
≥30.55 μg/m3 |
112 |
1.17 (0.84–1.62) |
|
|
Traffic-related air pollution—NO2; 10-yr averages, 20-yr lag |
|
|
|
|
Per 10 μg/m3 |
|
1.10 (0.97–1.23) |
|
|
<12.78 μg/m3 |
243 |
1.0 |
|
|
12.78–17.34 μg/m3 |
264 |
1.15 (0.91–1.46) |
|
|
17.35–23.16 μg/m3 |
250 |
1.01 (0.79–1.29) |
|
|
23.17–29.25 μg/m3 |
165 |
1.07 (0.81–1.42) |
|
|
≥29.26 μg/m3 |
120 |
1.44 (1.05–1.99) |
|
|
Air pollution from heating—SO2; 30-yr averages |
|
|
|
|
Per 10 μg/m3 |
|
1.00 (0.96–1.05) |
|
|
Reference |
Study Population |
Exposed Cases |
Estimated Relative Risk (95% CI) |
|
|
<41.30 μg/m3 |
245 |
1.0 |
|
41.30–52.74 μg/m3 |
254 |
1.06 (0.83–1.35) |
|
|
52.75–67.13 μg/m3 |
272 |
0.98 (0.77–1.24) |
|
|
67.14–78.20 μg/m3 |
152 |
0.90 (0.68–1.19) |
|
|
≥78.20 μg/m3 |
119 |
1.00 (0.73–1.37) |
|
|
Air pollution from heating—SO2; 10-yr averages, 20-yr lag |
|
|
|
|
Per 10 μg/m3 |
|
1.01 (0.98–1.03) |
|
|
<66.20 μg/m3 |
239 |
1.0 |
|
|
66.20–87.59 μg/m3 |
270 |
1.16 (0.91–1.47) |
|
|
87.60–110.29 μg/m3 |
259 |
1.00 (0.79–1.27) |
|
|
110.30–1 29.09 μg/m3 |
151 |
0.92 (0.70–1.21) |
|
|
≥129.10 μg/m3 |
123 |
1.21 (0.89–1.66) |
|
|
Marsh et al. 1998 |
142 lung-cancer cases among residents of four smelter towns in Arizona; atmospheric-diffusion modeling (smoking-adjusted) |
|
|
|
|
Highest exposure level |
|
|
|
None and background |
na |
1.00 |
|
|
Low |
na |
0.93 (0.51–1.70) |
|
|
Medium, high, and very high |
na |
1.00 (0.53–1.89) |
|
|
Duration above background |
|
|
|
|
0 |
na |
1.00 |
|
|
0–13 yr |
na |
1.31 (0.63–2.74) |
|
|
13–26 yr |
na |
1.20 (0.65–2.20) |
|
|
>26 yr |
na |
0.71 (0.34–1.48) |
|
|
Cumulative exposure |
|
|
|
|
0 |
na |
1.00 |
|
|
0–13 |
na |
1.22 (0.56–2.65) |
|
|
13–35 |
na |
1.19 (0.62–2.27) |
|
|
>35 |
na |
0.90 (0.48–1.71) |
|
|
Occupational exposure |
|
|
|
|
Definite smelter |
na |
1.73 (0.99–3.01) |
|
|
Potential smelter |
na |
2.24 (1.27–3.98) |
|
|
Barbone et al. 1995 |
755 lung-cancer cases among residents of Trieste, Italy (smoking-adjusted) |
|
|
|
|
Level of particulate deposition from fixed-site monitoring stations |
|
|
|
<0.175g/m2-day |
188 |
1.0 |
|
|
0.176–0.298 g/m2-day |
256 |
1.1 (0.8–1.5) |
|
|
>0.298 g/m2-day |
311 |
1.4 (1.1–1.8) p for trend=0.022 |
|
|
Jockel et al. 1992 |
194 lung-cancer cases among residents of five cities in Germany (smoking-adjusted) |
|
|
|
|
Emission index of SO2 from energy-consumption statistics |
|
|
|
Low air-pollution level |
41 |
1.0 |
|
|
High air-pollution level |
39 |
1.01 (0.53–1.91) |
|
|
Semiquantitative index of B[a]P, TSP, and SO2 from variety of sources |
|
|
|
|
Low air-pollution level |
36 |
1.0 |
|
|
High air-pollution level |
44 |
1.16 (0.64–2.13) |
|
|
Katsouyanni et al. 1991 |
101 lung-cancer cases among female residents of Athens, Greece—Cumulative air-pollution exposure from fixed-site |
|
|
|
Reference |
Study Population |
Exposed Cases |
Estimated Relative Risk (95% CI) |
|
|
monitoring stations according to borough (smoking-adjusted) |
|
|
|
Nonsmokers |
|
|
|
|
1st quartile (low) |
16 |
1.0 |
|
|
2nd quartile |
16 |
1.20 |
|
|
3rd quartile |
8 |
0.43 |
|
|
4th quartile (high) |
8 |
0.69 p for trend=0.20 |
|
|
Current and past smokers |
|
|
|
|
1st quartile (low) |
6 |
1.0 |
|
|
2nd quartile |
11 |
2.14 |
|
|
3rd quartile |
14 |
2.72 |
|
|
4th quartile (high) |
22 |
8.56 p for trend=0.007 |
|
|
Jedrychowski et al. 1990 |
Lung-cancer cases among residents of Cracow, Poland—air pollution index from fixed-site monitoring stations for TSP and SO2 and geographically interpolated (smoking-adjusted) |
|
|
|
|
Males |
|
|
|
Low air pollution |
650 |
1.0 |
|
|
Medium air pollution |
129 |
1.00 (0.75–1.33) |
|
|
High air pollution |
122 |
1.46 (1.06–1.99) |
|
|
Females |
|
|
|
|
Low air pollution |
124 |
1.0 |
|
|
Medium or high air pollution |
74 |
1.17 (0.70–1.96) |
|
|
Nonsmoking males |
|
|
|
|
Low air pollution |
32 |
1.0 |
|
|
High air pollution |
17 |
1.45 (0.74–2.87) |
|
|
Nonsmoking females |
|
|
|
|
Low air pollution |
56 |
1.0 |
|
|
High air pollution |
23 |
1.16 (0.48–2.80) |
|
|
Vena 1982 |
417 lung-cancer cases among white male residents of Erie County, New York (smoking-adjusted) |
|
|
|
|
Years in high or medium air pollution, from 21 fixed-site monitoring stations of TSP, interpolated to town level |
|
|
|
0–29 yr |
54 |
1.00 |
|
|
30–49 yr |
114 |
1.03 |
|
|
>50 yr |
249 |
1.26 |
|
|
Indoor Air Pollution |
|||
|
Cohort Study—Incidence |
|||
|
Lan et al. 2002 |
Farmers in Xuanwei County, China (smoking-adjusted) |
|
|
|
|
Males |
na |
|
|
No stove improvement |
|
1.0 |
|
|
Changed to stove with chimney |
0.59 (0.49–0.71) |
||
|
0–9 yr after improvement |
1.79 (1.48–2.18) |
||
|
10–19 yr after |
0.25 (0.19–0.31) |
||
|
≥20 yr |
0.07 (0.03–0.17) |
||
|
Cooked food <20 yr |
1.0 |
||
|
Cooked ≥20 yr |
1.42 (1.05–1.93) |
||
|
Females |
na |
|
|
|
No stove improvement |
|
1.0 |
|
|
Changed to stove with chimney |
0.54 (0.44–0.65) |
||
|
0–9 yr after improvement |
1.41 (1.15–1.73) |
||
|
Reference |
Study Population |
Exposed Cases |
Estimated Relative Risk (95% CI) |
|
|
10–19 yr after |
|
0.24 (0.19–0.31) |
|
≥20 yr |
|
0.17 (0.10–0.31) |
|
|
Case-Control Studies |
|||
|
Kleinermann et al. 2002 |
846 lung-cancer cases among residents of Pingliang and Qingyang, China; self-reported agents (smoking-adjusted) |
|
|
|
|
Type of fuel |
|
|
|
Biomass |
554 |
1.00 |
|
|
Coal |
278 |
1.29 (1.03–1.61) |
|
|
Amount of coal (tertiles) |
|
|
|
|
0 |
325 |
1.00 |
|
|
I |
146 |
1.18 (0.92–1.51) |
|
|
II |
207 |
1.06 (0.83–1.34) |
|
|
III |
134 |
1.29 (0.96–1.73) p for trend=0.1 73 |
|
|
% of time coal used |
|
|
|
|
No coal use |
478 |
1.00 |
|
|
0.7–56% |
102 |
1.99 (1.46–2.71) |
|
|
57–100% |
262 |
1.51 (1.20–1.91) p for trend=0.024 |
|
|
Lan et al. 2001 |
97 lung-cancer cases among residents of Xuanwei County, China; self-reported agents (smoking-adjusted) |
|
|
|
|
Smoky coal (tons) |
|
|
|
Total |
|
|
|
|
<130 |
na |
1.0 |
|
|
130–240 |
na |
1.48 (0.73–3.20) |
|
|
>240 |
na |
3.21 (1.23–9.03) p for trend=0.01 |
|
|
Males |
|
|
|
|
<130 |
na |
1.0 |
|
|
130–240 |
na |
1.30 (0.50–3.15) |
|
|
>240 |
na |
1.88 (0.54–7.09) P for trend=0.32 |
|
|
Females |
|
|
|
|
<130 |
na |
1.0 |
|
|
130–240 |
na |
2.21 (0.64–8.14) |
|
|
>240 |
na |
7.94 (1.46–60.44) p for trend=0.008 |
|
|
Lan et al. 1993 |
139 lung-cancer cases among female farmers in Xuanwei County, China; self-reported agents (all subjects smoked) (smoking-adjusted) |
|
|
|
|
Use of smoky coal |
74 |
7.53 (3.31–17.17) |
|
<3 tons/yr |
23 |
8.24 (2.33–29.17) |
|
|
≥3 tons/yr |
51 |
7.53 (3.03–18.72) |
|
|
Use of smoky coal from Laibin mine |
|
|
|
|
Used after 20 yr old |
12 |
1.84 (0.56–6.05) |
|
|
Used before 20 yr old |
10 |
5.10 (0.97–26.81) |
|
|
Lifetime use |
57 |
9.89 (3.95–24.75) |
|
|
Simonato et al. 2000 |
305 lung-cancer cases among residents of Venice, Italy; self-reported agents (smoking-adjusted) |
|
|
|
|
Venice islands |
|
|
|
Reference |
Study Population |
Exposed Cases |
Estimated Relative Risk (95% CI) |
|
|
Indoor heating |
30 |
1.0 |
|
No heating |
39 |
13.7 (4.2–45.3) |
|
|
No coal |
19 |
1.0 |
|
|
Ever coal |
49 |
1.3 (0.5–3.3) |
|
|
Venice inland |
|
|
|
|
Indoor heating |
67 |
1.0 |
|
|
No heating |
74 |
1.4 (0.8–2.2) |
|
|
No coal |
24 |
1.0 |
|
|
Ever coal |
119 |
0.4 (0.2–0.9) |
|
|
Zhong et al. 1999 |
504 lung-cancer cases among nonsmoking female residents of Shanghai, China; self-reported agents (smoking-adjusted) |
|
|
|
|
Fuel used for cooking |
|
|
|
Coal |
166 |
1.00 |
|
|
Coal and gas |
123 |
0.92 (0.63–1.35) |
|
|
Gas |
312 |
0.90 (0.66–1.23) |
|
|
Shen et al. 1998 |
70 lung-cancer cases among nonsmoking female residents of Nanjing, China; self-reported agents (smoking-adjusted) |
|
|
|
|
Single-factor analysis |
|
|
|
Gaseous fuel in home |
na |
1.51 (0.47–4.78) |
|
|
Coal stove for heating |
na |
1.78 (0.79–4.02) |
|
|
Ko et al. 1997 |
117 lung-cancer cases among nonsmoking female residents of Kaohsiung, Taiwan; self-reported agents (smoking-adjusted) |
|
|
|
|
No cooking or gas |
172 |
1.0 |
|
Coal or anthracite |
25 |
1.3 (0.3–5.8) |
|
|
Wood or charcoal |
113 |
2.7 (0.9–8.9) |
|
|
Presence of fume extractor |
108 |
1.0 |
|
|
No fume extractor |
160 |
8.3 (3.1–22.7) |
|
|
Dai et al. 1996 |
120 lung-cancer cases among nonsmoking female residents of Harbin, China; self-reported agents (smoking-adjusted) |
|
|
|
|
Period of coal-stove use in bedroom |
|
|
|
1–19 yr |
na |
4.46 (1.61–12.33) |
|
|
≥30 yr |
na |
18.75 (3.94–29.32) |
|
|
Period of heating with coal |
|
|
|
|
01–24 yr |
na |
5.81 (1.67–20.22) |
|
|
25–34 yr |
na |
4.70 (1.28–17.18) |
|
|
Du et al. 1996 |
849 lung-cancer cases among residents of Guangzhou, China; next-of-kin report (smoking-adjusted) |
|
|
|
|
Males—coal-fumes exposure |
na |
0.89 |
|
Nonsmokers |
|
1.50 (0.69–3.27) |
|
|
Smokers |
4.29 (2.33–7.88) |
||
|
Females—coal-fumes exposure |
na |
2.21 (1.16–4.21) |
|
|
Nonsmokers |
|
1.56 (0.57–4.25) |
|
|
Smokers |
2.89 (1.09–8.65) |
||
|
Lei et al. 1996 |
792 lung-cancer cases among residents of Guangzhou, China; next-of-kin report (smoking-adjusted) |
|
|
|
|
Exposure to coal smoke |
|
|
|
Males |
|
|
|
|
Infrequent |
350 |
1.0 |
|
Reference |
Study Population |
Exposed Cases |
Estimated Relative Risk (95% CI) |
|
|
Regular |
196 |
1.08 (0.84–1.40)b |
|
Females |
|
|
|
|
Infrequent |
48 |
1.0 |
|
|
Regular |
177 |
0.90 (0.55–1.45)b |
|
|
Luo et al. 1996 |
102 lung-cancer cases among residents of Fuzhou, China; self-reported agents |
|
|
|
|
Air pollution due to indoor burning of coal |
na |
7.6 (3.7–15.7) |
|
Squamous-cell carcinoma (smoking-adjusted) |
na |
14.1 (1.37–145.8)c |
|
|
Adenocarcinoma |
na |
6.0 (1.96–18.31)c |
|
|
Shen et al. 1996 |
263 lung-cancer cases among residents of Nanjing, China; self-reported agents |
|
|
|
|
Squamous-cell carcinoma—coal stove for heating |
na |
3.72 (0.88–15.71) |
|
Xu et al. 1996a |
1,249 lung-cancer cases among residents of Liaoning Province, China; self-reported agents (smoking-adjusted) |
|
|
|
|
Cooking characteristics—males |
|
|
|
Burning kang (coal) |
|
|
|
|
1–19 yr |
na |
1.7 (p<0.05) |
|
|
≥20 yr |
na |
2.1 (p<0.05) |
|
|
Gas fuel for cooking |
|
|
|
|
1–9 yr |
na |
0.9 |
|
|
≥10 yr |
na |
0.8 |
|
|
Cooking characteristics—females |
|
|
|
|
Burning kang (coal) |
|
|
|
|
1–19 yr |
na |
1.3 |
|
|
≥20 yr |
na |
2.3 (p<0.05) |
|
|
Cooking in bedroom (using coal) |
|
|
|
|
1–19 yr |
na |
1.5 |
|
|
≥20 yr |
na |
1.8 (p<0.05) |
|
|
Gas fuel for cooking |
|
|
|
|
1–9 yr |
na |
0.9 |
|
|
≥10 yr |
na |
0.8 |
|
|
Indoor air-pollution index (based on cooking fuel, place of cooking, and weighted by duration)—males |
|
|
|
|
I (low) |
na |
1.0 |
|
|
II |
na |
1.1 (0.8–1.4) |
|
|
III |
na |
1.2 (0.9–1.6) |
|
|
IV (high) |
na |
1.6 (1.2–2.3) |
|
|
Indoor air pollution index—females |
|
|
|
|
I (low) |
na |
1.0 |
|
|
II |
na |
1.2 (0.9–7.8) |
|
|
III |
na |
1.3 (0.9–1.9) |
|
|
IV (high) |
na |
1.5 (1.0–2.4) |
|
|
Liu et al. 1993 |
316 lung-cancer cases among residents of Guangzhou, China; self-reported agents, interviewer measurements (smoking-adjusted) |
|
|
|
|
Cooking fuel—males |
|
|
|
Coal |
200 |
1.0 |
|
|
Gas |
14 |
0.48 (0.15–1.6) |
|
|
Wood |
8 |
0.57 (0.11–3.0) |
|
|
Other |
2 |
0 |
|
Reference |
Study Population |
Exposed Cases |
Estimated Relative Risk (95% CI) |
|
|
Cooking fuel—females |
|
|
|
Coal |
81 |
1.0 |
|
|
Gas |
8 |
0.90 (0.24–3.3) |
|
|
Wood |
3 |
0.67 (0.04–11.7) |
|
|
Other |
0 |
0 |
|
|
Size of kitchen ventilation opening—males |
|
|
|
|
0.0–0.4 m2 |
79 |
1.0 |
|
|
0.5–0.9 m2 |
58 |
0.77 (0.36–1.7) |
|
|
1.0–1.4 m2 |
48 |
0.23 (0.10–0.56) |
|
|
1.5–1.9 m2 |
19 |
0.49 (0.16–1.5) |
|
|
>2.0 m2 |
20 |
0.15 (0.05–0.44) p for trend <0.001 |
|
|
Size of kitchen ventilation opening—females |
|
|
|
|
0.0–0.4 m2 |
22 |
1.0 |
|
|
0.5–0.9 m2 |
27 |
0.11 (0.02–0.60) |
|
|
1.0–1.4 m2 |
24 |
0.13 (0.02–0.74) |
|
|
1.5–1.9 m2 |
7 |
0.09 (0.01–0.63) |
|
|
>2.0 m2 |
12 |
0.06 (0.01–0.32) p for trend <0.001 |
|
|
Huang et al. 1992 |
Lung-cancer cases among residents of Sichuan, China |
|
|
|
|
Coal-burning indoors |
na |
1.59 (1.01–2.07) |
|
Chen et al. 1990 |
135 lung-cancer cases among residents of Taiwan; self-reported agents |
|
|
|
|
Cooking fuels: wood and coal |
|
|
|
Epidermoid carcinoma |
na |
0.85 (ns) |
|
|
Small-cell carcinoma |
na |
1.08 (ns) |
|
|
Adenocarcinoma |
na |
1.02 (ns) |
|
|
Cooking fuels: charcoal, gas, and electricity |
|
|
|
|
Epidermoid carcinoma |
na |
1.00 (ns) |
|
|
Small-cell carcinoma |
na |
1.00 (ns) |
|
|
Adenocarcinoma |
na |
1.00 (ns) |
|
|
Koo et al. 1983 |
200 lung-cancer cases among female residents of Hong Kong, China; self-reported agents |
na |
|
|
|
Type of cooking fuel |
|
|
|
Kerosene |
|
0.75 (0.35–1.58)d |
|
|
Wood or grass |
0.74 (0.37–1.47)d |
||
|
Liquid-petroleum gas |
0.44 (0.29–0.68)d |
||
|
Gas |
1.31 (0.79–2.18)d |
||
|
Charcoal |
0.96 (0.55–1.69)d |
||
|
Coal |
0.32 (0.07–1.32)d |
||
|
Electricity |
3.03 (0.28–76.24)d |
||
|
Occupational Studies of Engine Exhausts |
|||
|
Cohort Studies—Incidence |
|||
|
Jarvholm and Silverman 2003 |
Diesel-exposed construction workers in Sweden (smoking-adjusted) |
|
|
|
|
Truck drivers |
61 |
|
|
SIR reference group: carpenters and electricians |
|
1.29 (0.99–1.65) |
|
|
SIR reference group: population |
|
1.14 (0.87–1.46) |
|
|
Heavy-construction equipment operators |
61 |
|
|
|
SIR reference group: carpenters and electricians |
|
0.87 (0.66–1.11) |
|
|
Reference |
Study Population |
Exposed Cases |
Estimated Relative Risk (95% CI) |
|
|
SIR reference group: population |
|
0.76 (0.58–0.97) |
|
Soll-Johanning et al. 2003 |
Bus drivers or tramway employees in Copenhagen, Denmark—nested case-control study (smoking-adjusted) |
|
|
|
|
No lag time |
|
|
|
Cumulated employment |
|
|
|
|
<3 months |
5 |
0.74 (0.23–2.39) |
|
|
3 months-2 yr |
29 |
1.00 |
|
|
2-<10 yr |
54 |
1.26 (0.69–2.28) |
|
|
10-<20 yr |
22 |
1.39 (0.69–2.81) |
|
|
20+ yr |
43 |
0.63 (0.32–1.14) |
|
|
Diesel-exposed in another job |
|
|
|
|
No |
80 |
1.00 |
|
|
Yes |
57 |
0.85 (0.53–1.36) |
|
|
Air-pollution index (ordinal scale—0–10—reflecting level of pollution from bus routes used) |
|
|
|
|
Low |
14 |
1.00 |
|
|
High |
41 |
1.12 (0.40–3.12) |
|
|
>10-yr lag time |
|
|
|
|
Cumulated employment |
|
|
|
|
<3 months |
4 |
0.50 (0.14–1.81) |
|
|
3 months-2 yr |
27 |
1.00 |
|
|
2-<10 yr |
45 |
1.03 (0.54–1.95) |
|
|
10-<20 yr |
22 |
1.34 (0.65–2.77) |
|
|
20+ yr |
43 |
0.54 (0.28–1.03) |
|
|
Diesel-exposed in another job |
|
|
|
|
No |
74 |
1.00 |
|
|
Yes |
49 |
0.80 (0.48–1.32) |
|
|
Air-pollution index |
|
|
|
|
Low |
14 |
1.00 |
|
|
High |
39 |
0.99 (0.36–2.75) |
|
|
Soll-Johanning et al. 1998 |
Bus drivers or tramway employees in Copenhagen, Denmark |
|
|
|
|
Males |
|
|
|
Denmark reference |
473 |
1.6 (1.5–1.8) |
|
|
Copenhagen reference |
473 |
1.2 (1.1–1.3) |
|
|
Time since first employment |
|
|
|
|
0–14 yr |
35 |
1.2 |
|
|
15–29 yr |
77 |
1.55 (p<0.001) |
|
|
≥30 yr |
361 |
1.7 (p<0.001) |
|
|
Females |
|
|
|
|
Denmark reference |
15 |
2.6 (1.5–4.3) |
|
|
Copenhagen reference |
15 |
2.2 (1.2–3.6) |
|
|
Time since first employment |
|
|
|
|
0–14 yr |
3 |
1.3 |
|
|
15–29 yr |
10 |
3.5 (p<0.001) |
|
|
≥30 yr |
2 |
3.8 |
|
|
Guberan et al. 1992 |
Male commercial drivers in Geneva, Switzerland |
64 |
1.61 (1.29–1.98) |
|
Netterstrom 1988 |
Male bus drivers in Denmark |
15 |
0.55 (0.33–0.99) |
|
Reference |
Study Population |
Exposed Cases |
Estimated Relative Risk (95% CI) |
|
Cohort Studies—Mortality |
|||
|
Jarvholm and Silverman 2003 |
Diesel-exposed construction workers in Sweden (smoking-adjusted) |
|
|
|
|
Truck drivers |
57 |
|
|
SMR reference group: carpenters and electricians |
|
1.37 (1.04–1.78) |
|
|
SMR reference group: population |
1.18 (0.89–1.53) |
||
|
Heavy-construction equipment operators |
49 |
|
|
|
SMR reference group: carpenters and electricians |
|
0.83 (0.61–1.09) |
|
|
SMR reference group: population |
0.70 (0.51–0.92) |
||
|
Borgia et al. 1994 |
Male taxi drivers in Rome, Italy |
76 |
1.23 (0.97–1.55)e |
|
|
Age at first enrollment |
|
|
|
18–44 yr |
24 |
1.30 (0.83–1.93)e |
|
|
45–54 yr |
22 |
1.16 (0.76–1.83)e |
|
|
55+ yr |
30 |
1.23 (0.83–1.76)e |
|
|
Duration of membership |
|
|
|
|
0–9 yr |
35 |
1.18 (0.83–1.66)e |
|
|
10–19 yr |
35 |
1.50 (1.06–2.10)e |
|
|
20+ yr |
6 |
0.68 (0.25–1.48)e |
|
|
Time since first enrollment |
|
|
|
|
0–9 yr |
25 |
1.37 (0.88–2.02)e |
|
|
10–19 yr |
40 |
1.44 (1.04–1.98)e |
|
|
20+ yr |
11 |
0.70 (0.35–1.25)e |
|
|
Alfredsson et al. 1993 |
Male bus drivers in five counties in Sweden |
64 |
1.0 (0.8–1.3) |
|
Hansen 1993 |
Male truck drivers in Denmark (compared with other employed men; SES adjusted) |
|
|
|
|
All respiratory cancers |
84 |
1.60 (1.28–1.98) |
|
Lung cancer |
76 |
1.60 (1.26–2.00) |
|
|
Guberan et al. 1992 |
Commercial drivers in Geneva, Switzerland (compared with active unskilled workers) |
77 |
1.50 (1.23–1.81) |
|
|
Time from first exposure |
|
|
|
0–14 yr |
2 |
0.67 (0.08–2.41)e |
|
|
15–24 yr |
11 |
1.18 (0.59–2.12)e |
|
|
25–34 yr |
24 |
1.30 (0.83–1.93)e |
|
|
35–44 yr |
21 |
1.35 (0.84–2.07)e |
|
|
45+ yr |
21 |
2.59 (1.60–3.96)e p for trend <0.02 |
|
|
Rafnsson and Gunnarsdottir 1991 |
Taxi and truck drivers in Reykjavik, Iceland |
|
|
|
|
Truck drivers only (no other occupation) |
24 |
2.14 (1.37–3.18) |
|
Duration of employment (ever worked) |
|
|
|
|
<2 yr |
na |
2.70 (0.74–6.92) |
|
|
2–10 yr |
na |
2.46 (0.99–5.08) |
|
|
11–30 yr |
na |
0.68 (0.01–3.76) |
|
|
>30 yr |
na |
2.32 (0.85–5.04) |
|
|
Any |
na |
2.09 (1.32–3.13) |
|
|
Taxi drivers only (no other occupation) |
12 |
1.39 (0.72–2.43) |
|
|
Duration of employment (ever worked) |
|
|
|
|
Reference |
Study Population |
Exposed Cases |
Estimated Relative Risk (95% CI) |
|
|
<2 yr |
na |
0 |
|
2–10 yr |
na |
0.59 (0.02–3.30) |
|
|
11–30 yr |
na |
0 |
|
|
>30 yr |
na |
1.60 (0.33–4.66) |
|
|
Any |
na |
0.84 (0.23–2.16) |
|
|
Paradis et al. 1989 |
Male bus drivers in Montreal, Canada |
78 |
0.92 (0.73–1.14) |
|
|
<30 yr duration |
34 |
1.01 (0.70–1.38) |
|
≥30 yr duration |
44 |
0.85 (0.62–1.13) |
|
|
Stern et al. 1981 |
Motor vehicle examiners in New Jersey—respiratory-system cancer |
16 |
1.02 (0.58–1.65)e |
|
Kaplan 1959 |
Baltimore and Ohio Railroad workers |
|
|
|
|
Directly exposed occupations |
49 |
0.88 (0.65–1.16)f |
|
Less-exposed occupations |
67 |
0.72 (0.56–0.91)f |
|
|
Rarely exposed occupations |
38 |
0.89 (0.64–1.24)f |
|
|
Case-Control Studies |
|||
|
Menvielle et al. 2003 |
228 lung-cancer cases among residents of New Caledonia; self-reported job titles and industrial-hygienist-assigned exposure to specific agents (smoking-adjusted) |
|
|
|
|
Dockers |
22 |
1.1 (0.5–2.3) |
|
<5 yr |
10 |
0.5 (0.2–1.4) |
|
|
5+ yr |
12 |
3.3 (1.0–10.7) |
|
|
Transportation-equipment managers |
23 |
1.0 (0.5–2.0) |
|
|
<5 yr |
18 |
0.8 (0.4–1.6) |
|
|
5+ yr |
5 |
5.8 (1.1–30.7) |
|
|
Motor-bus, lorry, and van drivers |
13 |
2.7 (1.1–7.0) |
|
|
<15 yr |
8 |
2.1 (0.7–22.1) |
|
|
15+ yr |
5 |
4.7 (1.0–22.1) |
|
|
Diesel-engine emissions |
88 |
0.8 (0.5–1.2) |
|
|
PAHs from any source |
124 |
0.8 (0.5–1.4) |
|
|
Bruske-Hohlfeld et al. 2000 |
3,498 pooled lung-cancer cases among residents of East and West Germany; self-reported agents and job titles (smoking-adjusted) |
|
|
|
|
Transport worker and freight handler |
1,203 |
1.28 (1.13–1.45) |
|
Diesel-engine exhaust, ever exposed |
716 |
1.43 (1.23–1.67) |
|
|
>0–3 yr |
132 |
1.28 (0.95–1.73) |
|
|
>3–10 yr |
155 |
1.21 (0.91–1.61) |
|
|
>10–20 yr |
165 |
1.84 (1.34–2.52) |
|
|
>20–30 yr |
148 |
1.62 (1.16–2.24) |
|
|
>30 yr |
116 |
1.35 (0.95–1.93) |
|
|
PAHs, ever exposed |
181 |
1.53 (1.14–2.04) |
|
|
>0–3 yr |
40 |
1.16 (0.68–1.98) |
|
|
>3–10 yr |
58 |
2.02 (1.17–3.48) |
|
|
>10–20 yr |
36 |
2.03 (0.96–4.31) |
|
|
>20–30 yr |
23 |
1.40 (0.65–3.01) |
|
|
>30 yr |
24 |
1.16 (0.54–2.52) |
|
|
Cumulative PAH exposure |
|
|
|
|
>0–20 benzo[a]pyrene-yr |
80 |
1.15 (0.77–1.71) |
|
|
>20 benzo[a]pyrene-yr |
101 |
2.09 (1.36–3.22) |
|
|
Reference |
Study Population |
Exposed Cases |
Estimated Relative Risk (95% CI) |
|
Bruske-Hohlfeld et al. 1999 |
3,498 pooled lung-cancer cases among residents of East and West Germany; professional drivers, self-reported job titles (smoking-adjusted) |
|
|
|
|
West Germany, ever exposed |
412 |
1.44 (1.18–1.76) |
|
>0–3 yr |
89 |
1.69 (1.13–2.53) |
|
|
>3–10 yr |
94 |
1.09 (0.76–1.58) |
|
|
>10–20 yr |
102 |
2.02 (1.32–3.08) |
|
|
>20–30 yr |
68 |
1.15 (0.74–1.80) |
|
|
>30 yr |
59 |
1.51 (0.90–2.52) |
|
|
East Germany, ever exposed |
122 |
0.83 (0.60–1.14) |
|
|
>0–3 yr |
17 |
0.60 (0.30–1.20) |
|
|
>3–10 yr |
24 |
1.02 (0.51–2.04) |
|
|
>10–20 yr |
28 |
1.02 (0.52–2.00) |
|
|
>20–30 yr |
28 |
0.95 (0.48–1.86) |
|
|
>30 yr |
25 |
0.67 (0.34–1.30) |
|
|
Jockel et al. 1998 |
1,004 lung-cancer cases among residents of Bremen and Frankfurt, West Germany; self-reported job titles (smoking-adjusted) |
|
|
|
|
Docker and freight handler |
53 |
1.95 (1.11–3.42) |
|
Matos et al. 2000 |
199 lung-cancer cases among male residents of Buenos Aires, Argentina (adjusted for other occupations); self-reported job titles (smoking-adjusted) |
|
|
|
|
Motor-vehicle drivers |
28 |
0.7 (0.4–1.2) |
|
Truck drivers |
13 |
1.5 (0.6–3.4) |
|
|
Railway transport |
8 |
0.9 (0.4–2.3) |
|
|
PAH exposure |
|
|
|
|
Ever |
|
|
|
|
Any duration of exposure |
70 |
0.9 (0.6–1.4) |
|
|
10+ yr of exposure |
49 |
1.2 (0.7–2.1) |
|
|
Probable |
|
|
|
|
Any duration of exposure |
26 |
0.6 (0.3–1.2) |
|
|
10+ yr of exposure |
19 |
1.2 (0.6–2.6) |
|
|
Definite |
|
|
|
|
Any duration of exposure |
50 |
1.0 (0.6–1.6) |
|
|
10+ yr of exposure |
34 |
1.2 (0.7–2.2) |
|
|
Hansen et al. 1998 |
28,744 lung-cancer cases among male residents of Denmark (adjusted for SES, not smoking); job titles |
|
|
|
|
Lorry and bus drivers |
|
|
|
Duration of employment, no lag |
|
|
|
|
<0.5 yr |
na |
1.0 (0.8–1.3) |
|
|
0.5–1 yr |
na |
1.3 (0.9–1.7) |
|
|
1–5 yr |
na |
1.4 (1.1–1.6) |
|
|
>5 yr |
na |
1.4 (1.1–1.7) |
|
|
Duration of employment, 10-yr lag |
|
|
|
|
<0.5 yr |
na |
1.1 (0.9–1.4) |
|
|
0.5–1 yr |
na |
1.2 (0.8–1.6) |
|
|
1–5 yr |
na |
1.4 (1.1–1.7) |
|
|
>5 yr |
na |
1.4 (1.1–1.8) |
|
|
Taxi drivers |
|
|
|
|
Duration of employment, no lag |
|
|
|
|
<0.5 yr |
na |
0.7 (0.4–1.2) |
|
Reference |
Study Population |
Exposed Cases |
Estimated Relative Risk (95% CI) |
|
|
0.5–1 yr |
na |
1.6 (0.8–3.2) |
|
1–5 yr |
na |
1.7 (1.0–2.9) |
|
|
>5 yr |
na |
2.2 (1.1–4.7) |
|
|
Duration of employment, 1 0-yr lag |
|
|
|
|
<0.5 yr |
na |
1.0 (0.5–1.7) |
|
|
0.5–1 yr |
na |
1.6 (0.8–3.4) |
|
|
1–5 yr |
na |
1.8 (1.0–3.2) |
|
|
>5 yr |
na |
3.0 (1.2–6.8) |
|
|
Steenland et al. 1998 |
996 lung-cancer cases among male truck drivers in US Teamsters Union (smoking-adjusted) |
|
|
|
|
Assumed emissions in 1970; 5-yr lag |
|
|
|
0–169 μg/m3-yr |
na |
1.08 (0.72–1.63) |
|
|
169–257 μg/m3-yr |
na |
1.10 (0.74–1.65) |
|
|
257–331 μg/m3-yr |
na |
1.36 (0.90–2.04) |
|
|
331+ μg/m3-yr |
na |
1.64 (1.09–2.49) |
|
|
Increase across interquartile range (169–331 μg/m3-yr) |
na |
1.71 (1.08–2.34)f |
|
|
Occupation category (geometric mean exposure to elemental carbon, μg/m3), next-of-kin report |
|
|
|
|
Dockworkers (1.3) |
na |
0.93 (0.55–1.55) |
|
|
Long-haul drivers (3.8) |
na |
1.27 (0.83–1.93) |
|
|
Short-haul drivers (4.0) |
na |
1.31 (0.81–2.11) |
|
|
Mechanics (12.1) |
na |
1.69 (0.92–3.09) |
|
|
Steenland et al. 1990 |
996 lung-cancer cases among male truck drivers in the US Teamsters Union (smoking-adjusted) |
|
|
|
|
Diesel-truck driver |
|
|
|
1–24 yr employment |
48 |
1.27 (0.70–2.27) |
|
|
25–34 yr employment |
72 |
1.26 (0.74–2.16) |
|
|
35+ yr employment |
56 |
1.89 (1.04–3.42) |
|
|
Gasoline-truck driver |
|
|
|
|
1–24 yr employment |
72 |
1.24 (0.74–2.16) |
|
|
25–34 yr employment |
87 |
1.10 (0.67–1.80) |
|
|
35+ yr employment |
86 |
1.34 (0.81–2.22) |
|
|
Drove both truck types |
|
|
|
|
1–24 yr employment |
50 |
1.27 (0.71–2.26) |
|
|
25–34 yr employment |
95 |
1.15 (0.70–1.90) |
|
|
35+ yr employment |
102 |
1.34 (0.81–2.20) |
|
|
Diesel-exposed, non-truck drivers |
|
|
|
|
Teamster data |
na |
1.44 (0.88–2.39) |
|
|
Next-of-kin data |
na |
1.54 (0.93–2.15) |
|
|
Bovenzi et al. 1993 |
756 lung-cancer cases among male residents of northeastern Italy; next-of-kin reports (smoking-adjusted) |
|
|
|
|
Shipyard workers |
74 |
2.40 (1.54–3.74) |
|
Dockworkers |
32 |
2.13 (1.13–4.04) |
|
|
Swanson et al. 1993 |
3,792 lung-cancer cases among male residents of Detroit, Michigan; self-reported job titles (smoking-adjusted) |
|
|
|
|
White males |
|
|
|
Drivers of heavy trucks |
|
|
|
|
0 yr employed |
88 |
1.0 |
|
|
1–9 yr |
78 |
1.4 (0.8–2.4) |
|
|
10–19 yr |
38 |
1.6 (0.8–3.5) |
|
Reference |
Study Population |
Exposed Cases |
Estimated Relative Risk (95% CI) |
|
|
20+ yr |
121 |
2.5 (1.4–4.4) p for trend <0.05 |
|
Drivers of light trucks |
|
|
|
|
0 yr employed |
88 |
1.0 |
|
|
1–9 yr |
46 |
1.7 (0.9–3.3) |
|
|
10+ yr |
36 |
2.1 (0.9–4.6) p for trend <0.05 |
|
|
Garage and service-station workers |
|
|
|
|
0 yr employed |
88 |
1.0 |
|
|
1–9 yr |
47 |
2.2 (1.1–4.4) |
|
|
10+ yr |
7 |
2.3 (0.5–10.8) |
|
|
Black males |
|
|
|
|
Drivers of heavy trucks |
|
|
|
|
0 yr employed |
12 |
1.0 |
|
|
1–9 yr |
27 |
2.7 (0.8–9.2) |
|
|
10–19 yr |
16 |
1.9 (0.5–7.2) |
|
|
20+ yr |
16 |
2.1 (0.5–9.2) |
|
|
Drivers of light trucks |
|
|
|
|
0 yr employed |
12 |
1.0 |
|
|
1–9 yr |
11 |
1.7 (0.4–7.7) |
|
|
10+ yr |
8 |
1.4 (0.3–7.7) |
|
|
Garage and service-station workers |
|
|
|
|
0 yr employed |
12 |
1.0 |
|
|
1–9 yr |
8 |
1.7 (0.3–8.7) |
|
|
10+ yr |
9 |
6.8 (0.7–70.8) |
|
|
Hayes et al. 1989 |
1,444 lung-cancer cases among residents pooled from case-control studies in Florida, New Jersey, and Louisiana; job titles (smoking-adjusted) |
|
|
|
|
Driver or operator: truck |
|
|
|
No employment |
1,099 |
1.0 |
|
|
<10 yr employment |
196 |
0.9 (0.8–1.2) |
|
|
10+ yr employment |
147 |
1.5 (1.1–1.9) |
|
|
Driver or operator: heavy equipment |
|
|
|
|
No employment |
1,413 |
1.0 |
|
|
<10 yr employment |
17 |
1.0 (0.5–2.1) |
|
|
10+ yr employment |
14 |
1.3 (0.6–3.1) |
|
|
Driver or operator: bus |
|
|
|
|
No employment |
1,368 |
1.0 |
|
|
<10 yr employment |
38 |
1.1 (0.6–1.7) |
|
|
10+ yr employment |
38 |
1.6 (0.9–2.8) |
|
|
Driver or operator: taxi and chauffeur |
|
|
|
|
No employment |
1,386 |
1.0 |
|
|
<10 yr employment |
40 |
2.5 (1.4–4.8) |
|
|
10+ yr employment |
16 |
1.2 (0.5–2.6) |
|
|
Driver or operator: other |
|
|
|
|
No employment |
1,429 |
1.0 |
|
|
<10 yr employment |
13 |
1.0 (0.4–2.3) |
|
|
10+ yr employment |
2 |
0.2 (0.0–1.6) |
|
|
Vineis et al. 1988 |
2,973 lung-cancer cases among residents pooled from case-control studies in Louisiana, Florida, Pennsylvania, Virginia, and New Jersey; job titles (smoking-adjusted) |
|
|
|
|
Truck drivers |
433 |
1.1 (0.9–1.3) |
|
Reference |
Study Population |
Exposed Cases |
Estimated Relative Risk (95% CI) |
|
Zahm et al. 1989 |
4,431 lung-cancer cases among white male residents of |
|
|
|
|
Missouri; job titles (smoking-adjusted) |
|
|
|
Motor-vehicle drivers |
186 |
1.5 (1.2–1.8) |
|
|
Railroad and sea occupations |
30 |
1.4 (0.8–2.3) |
|
|
Freight, stock, and garbage handlers |
19 |
1.9 (0.9–4.0) |
|
|
Benhamou et al. 1988 |
1,625 lung-cancer cases among residents of France; self-reported job titles (smoking-adjusted) |
|
|
|
|
Transport-equipment operators |
157 |
1.35 (1.05–1.75) |
|
Motor-vehicle drivers |
128 |
1.42 (1.07–1.89) |
|
|
Damber and Larsson 1987 |
456 lung-cancer cases among male residents of northern Sweden; self-reported job titles (smoking-adjusted) |
|
|
|
|
Professional drivers |
|
|
|
≥1 yr |
63 |
1.0 (0.7–1.6) |
|
|
≥20 yr |
33 |
1.1 (0.6–2.2) |
|
|
Lerchen et al. 1987 |
506 lung-cancer cases among residents of New Mexico; self-reported job titles or exposures (smoking-adjusted) |
|
|
|
|
Diesel-engine mechanics, ever worked |
5 |
0.6 (0.2–2.0) |
|
Engineers and firemen, ever worked |
2 |
0.6 (0.1–3.3) |
|
|
Diesel-exhaust fumes |
7 |
0.6 (0.2–1.6) |
|
|
Buiatti et al. 1985 |
376 lung cancer cases among residents of Florence, Italy; self-reported job titles (smoking-adjusted) |
|
|
|
|
Transportation, ever worked |
45 |
1.1 (0.7–1.6) |
|
Taxi driving, ever worked |
20 |
1.8 (1.0–3.4) |
|
|
Train conductor, ever worked |
7 |
1.4 (0.5–3.9) |
|
|
Diesel Exhaust and PAHs |
|||
|
Cohort Studies—Incidence |
|||
|
Boffetta et al. 2001 |
Residents of Sweden—diesel-engine emissions |
|
|
|
|
Males |
6,266 |
1.09 (1.06–1.12) |
|
Probability of exposure |
|
|
|
|
Low |
2,222 |
1.1 (1.04–1.13) |
|
|
Medium |
1,881 |
0.90 (0.86–0.94) |
|
|
High |
1,841 |
1.2 (1.10–1.21) |
|
|
Intensity of exposure |
|
|
|
|
Low |
3,705 |
0.95 (0.92–0.98) |
|
|
Medium |
1,181 |
1.1 (1.08–1.21) |
|
|
High |
1,058 |
1.3 (1.26–1.42) |
|
|
Females |
57 |
1.09 (0.83–1.42) |
|
|
Probability of exposure |
|
|
|
|
Low |
32 |
0.85 (0.60–1.20) |
|
|
Medium |
6 |
0.62 (0.28–1.39) |
|
|
High |
13 |
1.1 (0.61–1.82) |
|
|
Intensity of exposure |
|
|
|
|
Low |
38 |
0.80 (0.58–1.10) |
|
|
Medium-high |
13 |
1.1 (0.62–1.84) |
|
|
Van Loon et al. 1997 |
Residents of Netherlands—Netherlands Cohort Study on Diet and Cancer |
|
|
|
Reference |
Study Population |
Exposed Cases |
Estimated Relative Risk (95% CI) |
|
|
Occupational exposure to PAHs—adjusted for age only |
|
|
|
No exposure |
487 |
1.0 |
|
|
1 tertile (low) |
10 |
1.44 (0.67–3.09) |
|
|
2 tertile |
12 |
1.61 (0.78–3.34) |
|
|
3 tertile (high) |
12 |
1.35 (0.66–2.76) p for trend=0.07 |
|
|
Occupational exposure to PAHs—adjusted for age and other occupational exposures |
|
|
|
|
No exposure |
487 |
1.0 |
|
|
1 tertile (low) |
10 |
1.32 (0.60–2.89) |
|
|
2 tertile |
12 |
1.09 (0.49–2.40) |
|
|
3 tertile (high) |
12 |
0.63 (0.25–1.58) p for trend=0.45 |
|
|
Occupational exposure to PAHs—adjusted for age, other occupational exposures, smoking, and vitamin intake (smoking-adjusted) |
|
|
|
|
No exposure |
487 |
1.0 |
|
|
1 tertile (low) |
10 |
0.53 (0.13–2.14) |
|
|
2 tertile |
12 |
0.83 (0.32–2.20) |
|
|
3 tertile (high) |
12 |
0.28 (0.09–0.89) p for trend <0.01 |
|
|
Van Den Eeden and Friedman 1993 |
Residents of northern California—engine-exhaust fumes (smoking-adjusted) |
|
|
|
|
Past year |
na |
1.13 (0.93–1.36) |
|
|
Past year and before |
na |
1.02 (0.81–1.29) |
|
Cohort Studies—Mortality |
|||
|
Baris et al. 2001 |
Male firefighters in Philadelphia, Pennsylvania |
162 |
1.13 (0.97–1.32) |
|
|
Cumulative runs (emergency response to a fire or false-alarm) with diesel exposure |
|
|
|
Low (1–259 runs) |
12 |
0.97 (0.53–1.79) |
|
|
Medium (260–1,422 runs) |
17 |
1.17 (0.68–2.02) |
|
|
High (≥1,423 runs) |
12 |
1.01 (0.51–2.01) |
|
|
Larkin et al. 2000 |
Railroad workers in US—diesel exhaust-exposed (vs unexposed workers with indirect adjustment for smoking) (smoking-adjusted) |
na |
|
|
|
40–44 yr old at time of entry into cohort |
|
1.44 (1.01–2.05) |
|
45–49 yr old at time of entry into cohort |
1.12 (0.81–1.54) |
||
|
50–54 yr old at time of entry into cohort |
1.04 (0.77–1.41) |
||
|
55–59 yr old at time of entry into cohort |
1.18 (0.92–1.51) |
||
|
Garshick et al. 1988 |
Railroad workers in the US—Diesel exhaust exposed (vs. unexposed workers) |
na |
|
|
|
40–44 yr old at time of entry into cohort |
|
1.45 (1.11–1.89) |
|
45–49 yr old |
1.33 (1.03–1.73) |
||
|
50–54 yr old |
1.12 (0.88–1.42) |
||
|
55–59 yr old |
1.18 (0.94–1.50) |
||
|
60–64 yr old |
0.99 (0.74–1.33) |
||
|
Saverin et al. 1999 |
Potash miners in South Harz Mountains of Germany—Exposure to diesel exhaust (smoking distributed evenly across |
|
|
|
Reference |
Study Population |
Exposed Cases |
Estimated Relative Risk (95% CI) |
|
|
exposure groups) |
|
|
|
East Germany reference |
38 |
0.78 (0.55–1.07) |
|
|
Internal workshop reference |
38 |
2.17 (0.79–5.99) |
|
|
Rate ratio for exposure increase of 4.9 mg-yr/m3 of elemental carbon: Cohort |
38 |
1.68 (0.49–5.8) |
|
|
Rate ratio for exposure increase of 4.9 mg-yr/m3 of elemental carbon: Subcohort of underground workers with stable jobs and >10 yr employment |
21 |
2.70 (0.52–14.1) |
|
|
Gustavsson et al. 1990 |
Bus-garage workers in Stockholm, Sweden |
|
|
|
|
General-population reference, Stockholm |
17 |
1.15 (0.67–1.84) |
|
Occupationally active reference, Stockholm |
17 |
1.22 (0.71–1.96) |
|
|
Cumulative exposure index to diesel exhaust |
|
|
|
|
0–10 |
5 |
0.97 (0.3 1–2.27)e |
|
|
10–30 |
5 |
1.52 (0.49–3.54)e |
|
|
>30 |
7 |
1.27 (0.5 1–2.62)e |
|
|
Cumulative exposure index to diesel exhaust; nested case-control analysis |
|
|
|
|
0–10 |
5 |
1.0 |
|
|
10–20 |
2 |
1.34 (1.09–1.64) |
|
|
20–30 |
3 |
1.81 (1.20–2.71) |
|
|
>30 |
10 |
2.43 (1.32–4.47) |
|
|
Boffetta et al. 1988 |
Male enrollees in American Cancer Society’s Cancer Prevention II Study (smoking-adjusted) |
174 |
1.18 (0.97–1.44) |
|
|
Duration of diesel-exhaust exposure |
|
|
|
1–15 yr |
na |
1.05 (0.80–1.39) |
|
|
16+ yr |
na |
1.21 (0.94–1.56) |
|
|
Ever exposed to diesel exhausts |
|
|
|
|
Nonsmokers |
7 |
1.73 (0.60–4.95) |
|
|
Ex-smokers |
85 |
11.06 (6.27–19.53) |
|
|
Current smokers |
78 |
19.82 (11.20–35.07) |
|
|
Occupations with presumptive diesel-exhaust exposure |
|
|
|
|
Railroad workers |
14 |
1.59 (0.94–2.69) |
|
|
Truck drivers |
48 |
1.24 (0.93–1.66) |
|
|
Heavy-equipment operators |
5 |
2.60 (1.12–6.06) |
|
|
Magnani et al. 1988 |
Residents of England and Wales (adjusted for social class) |
|
|
|
|
Diesel fumes, greater than background |
na |
0.97 (0.94–0.99) |
|
PAHs, greater than background |
na |
0.99 (0.97–1.01) |
|
|
Wong et al. 1985 |
Members of International Union of Operating Engineers |
|
|
|
|
Lung cancer |
309 |
0.99 (0.88–1.10) |
|
Duration of union membership |
|
|
|
|
<5 yr |
10 |
0.45 (0.22–0.83)e |
|
|
5–9 yr |
25 |
0.75 (0.48–1.11)e |
|
|
10–14 yr |
53 |
1.08 (0.81–1.42)e |
|
|
15–19 yr |
58 |
1.02 (0.78–1.33)e |
|
|
≥20 yr |
163 |
1.07 (0.91–1.25)e |
|
|
Time since first employment |
|
|
|
|
<10 yr |
28 |
0.66 (0.44–0.95)e |
|
|
10–19 yr |
90 |
0.90 (0.73–1.11)e |
|
Reference |
Study Population |
Exposed Cases |
Estimated Relative Risk (95% CI) |
|
|
≥20 yr |
191 |
1.12 (0.97–1.29)e |
|
Howe et al. 1983 |
Male pensioners of Canadian National Railway Company—cancers of trachea, bronchus, and lung |
933 |
1.06 (0.99–1.13)e |
|
|
Diesel fumes |
|
|
|
Nonexposed |
239 |
1.00 |
|
|
Possibly exposed |
407 |
1.20 (p=0.013) |
|
|
Probably exposed |
279 |
1.35 (p<0.001) |
|
|
Conductor |
50 |
1.52 (1.14–2.02)e |
|
|
Porter |
11 |
2.13 (1.06–3.81)e |
|
|
Yard helper |
14 |
1.93 (1.05–3.24)e |
|
|
Unspecified foreman |
31 |
1.62 (1.11–2.32)e |
|
|
Cook |
15 |
2.09 (1.17–3.45)e |
|
|
Case-Control Studies |
|||
|
Gustavsson et al. 2000 |
1,042 lung-cancer cases among residents of Stockholm County, Sweden; industrial-hygienist assigned occupational exposures from self-reported job titles (smoking-adjusted) |
|
|
|
|
Diesel exhaust—exposure intensity (μg NO2/m3) |
|
|
|
None |
842 |
1.00 |
|
|
40–119 |
134 |
1.16 (0.90–1.49) |
|
|
120–399 |
43 |
1.40 (0.90–2.19) |
|
|
>400 |
3 |
0.61 (0.16–2.28) |
|
|
Motor exhaust (mixed gasoline/diesel)—exposure intensity (mg CO/m3) |
|
|
|
|
None |
833 |
1.00 |
|
|
1.1–3.3 |
101 |
1.22 (0.91–1.63) |
|
|
3.4–11.3 |
60 |
1.03 (0.72–1.47) |
|
|
>11.4 |
33 |
1.31 (0.78–2.19) |
|
|
Combustion products—exposure intensity (μg benzo[a]pyrene/m3) |
|
|
|
|
None |
824 |
1.00 |
|
|
0.05–0.4 |
46 |
1.07 (0.72–1.60) |
|
|
0.5–4.9 |
48 |
1.33 (0.89–2.00) |
|
|
>5 |
35 |
2.10 (1.25–3.53) |
|
|
Diesel exhaust—cumulative exposure (mg-yr/m3 of NO2) |
|
|
|
|
None |
842 |
1.00 |
|
|
>0–0.53 |
29 |
0.65 (0.40–1.04) |
|
|
0.54–1.41 |
54 |
1.13 (0.77–1.66) |
|
|
1.42–2.37 |
45 |
1.05 (0.70–1.60) |
|
|
>2.38 |
72 |
1.63 (1.14–2.33) |
|
|
Motor exhaust (mixed gasoline and diesel)—cumulative exposure (mg-yr/m3 of CO) |
|
|
|
|
None |
833 |
1.00 |
|
|
>0–13.5 |
19 |
0.43 (0.25–0.74) |
|
|
13.6–38.8 |
47 |
1.10 (0.74–1.65) |
|
|
38.9–113.6 |
78 |
1.32 (0.92–1.90) |
|
|
>113.7 |
65 |
1.09 (0.74–1.61) |
|
|
Combustion products—cumulative exposure (μg-yr/m3 of benzo[a]pyrene) |
|
|
|
|
None |
824 |
1.00 |
|
|
>0–2.9 |
47 |
1.20 (0.80–1.80) |
|
|
3.0–6.6 |
51 |
1.05 (0.71–1.57) |
|
|
6.7–23.8 |
47 |
1.05 (0.69–1.59) |
|
|
Reference |
Study Population |
Exposed Cases |
Estimated Relative Risk (95% CI) |
|
|
>23.9 |
73 |
1.60 (1.09–2.34) |
|
Diesel exhaust—duration of exposure |
na |
|
|
|
None |
|
1.00 |
|
|
>0–9 yr |
0.76 (0.51–1.13) |
||
|
10–29 yr |
1.21 (0.88–1.65) |
||
|
>30 |
1.38 (0.97–1.97) |
||
|
Motor exhaust, mixed—duration of exposure |
na |
|
|
|
None |
|
1.00 |
|
|
>0–9 yr |
0.69 (0.48–0.99) |
||
|
10–29 yr |
1.15 (0.85–1.57) |
||
|
>30 |
1.64 (1.14–2.36) |
||
|
Combustion products—duration of exposure |
na |
|
|
|
None |
|
1.00 |
|
|
>0–9 yr |
1.42 (0.96–2.10) |
||
|
10–29 yr |
1.37 (1.01–1.85) |
||
|
>30 |
1.37 (0.98–1.91) |
||
|
Muscat et al. 1998 |
550 lung-cancer cases among black residents of New York, Illinois, Michigan, Pennsylvania, and District of Columbia; self-reported agents and occupations |
|
|
|
|
Males |
|
|
|
Gas fumes |
32 |
0.7 (0.4–1.2) |
|
|
Diesel exhaust |
11 |
0.9 (0.3–2.6) |
|
|
Coal dust |
28 |
2.8 (1.1–7.0) |
|
|
Drivers |
59 |
1.5 (0.9–2.5) |
|
|
Highway |
39 |
0.9 (0.4–1.2) |
|
|
Mechanics |
7 |
0.6 (0.2–2.1) |
|
|
Railroad workers |
3 |
0.7 (0.1–4.1) |
|
|
Females |
|
|
|
|
Gas fumes |
6 |
7.1 (1.2–41.8) |
|
|
Diesel exhaust |
0 |
0 |
|
|
Coal dust |
2 |
0.5 (0.1–4.8) |
|
|
Drivers |
2 |
0 |
|
|
Highway |
1 |
0.9 (0.0–32.9) |
|
|
Xu et al. 1996b |
610 lung-cancer cases among active or retired employees of Anshan Iron-Steel Complex in Liaoning province, China (smoking-adjusted) |
|
|
|
|
Cumulative total B[a]P (mg/m3-yr) |
|
|
|
<0.85 |
72 |
1.1 (0.8–1.7) |
|
|
0.85–1.96 |
117 |
1.6 (1.2–2.3) |
|
|
1.97–3.2 |
96 |
1.6 (1.1–2.3) |
|
|
>3.2 |
105 |
1.8 (1.2–2.5) p for trend=0.004 |
|
|
Boffetta et al. 1990 |
2,584 lung-cancer cases among residents of six US cities |
|
|
|
|
Self-reported diesel-exhaust exposure |
|
|
|
None |
442 |
1.00 |
|
|
Ever |
35 |
1.21 (0.73–2.02) |
|
|
1–15 yr |
11 |
0.90 (0.40–1.99) |
|
|
16–30 yr |
12 |
1.04 (0.44–2.48) |
|
|
31+ yr |
12 |
2.39 (0.87–6.57) p for trend=0.12 |
TABLE 4.21 Melanoma Skin Cancer and Exposure to Fuels—Selected Epidemiologic Studies
|
Reference |
Study Population |
Exposed Cases |
Estimated Relative Risk (95% CI) |
|
Cohort Studies |
|||
|
Workers for Imperial Oil, Canada; total HCs from solvents or fuels industrial-hygiene-derived from job histories (ppm-yr) |
|
|
|
|
Lewis et al. 2000b |
Melanoma deaths in 1964–1994 among 34,560 workers employed any time during 1964–1983 |
|
|
|
|
Females |
1 |
0.39 (0.01–2.16)a |
|
Males |
22 |
1.32 (0.83–2.00) |
|
|
Refinery |
4 |
0.65 (0.18–1.66) |
|
|
Marketing or distribution |
8 |
1.59 (0.69–3.14) |
|
|
5–14 yr, ≥20-yr latency |
1 |
2.70 (0.07–15.05)a |
|
|
15–24 yr, ≥20-yr latency |
3 |
3.45 (0.71–10.08)a |
|
|
25–34 yr, ≥20-yr latency |
2 |
1.27 (0.15–4.60)a |
|
|
>34 yr, ≥20-yr latency |
0 |
0.00 (0.0–4.19)a |
|
|
Upstream (exploration, drilling, production, or pipeline) |
7 |
2.82 (1.13–5.81) |
|
|
Schnatter et al. 1992 |
Melanoma deaths in 1964–1983 |
16 |
1.87 (1.07–3.04) |
|
Females |
1 |
0.91 |
|
|
|
Males |
15 |
|
|
Refinery |
3 |
1.00 (0.21–2.92)a |
|
|
Marketing/distribution |
6 |
2.56 (0.94–5.57) |
|
|
Upstream |
6 |
6.00 (2.19–13.06) |
|
|
Unexposed |
2 |
6.62 (0.80–23.92) |
|
|
Exposed to HCs |
3 |
5.48 (1.13–16.03) |
|
|
Unknown exposure status |
1 |
6.64 (0.17–36.90) |
|
|
Lewis et al. 2003 |
Incident melanoma cases in 1969–1994 among 25,292 workers hired in 1964–1983 |
|
|
|
|
Females |
16 |
1.46 (0.83–2.37) |
|
Males |
26 |
1.25 (0.82–1.83) |
|
|
Unexposed to HCs |
10 |
1.0 |
|
|
>0->2.5 ppm-yr |
6 |
1.1 (0.4–3.0) |
|
|
≥2.5->30.0 ppm-yr |
6 |
1.2 (0.4–3.4) |
|
|
≥30.0 ppm-yr |
4 |
0.6 (0.2–2.1) |
|
|
Jarvholm et al. 1997 |
4,128 male workers in Swedish petroleum industry for at least 1 yr (qualitative industrial-hygiene-interpretation of personnel records) |
|
|
|
|
Incident cases of melanoma (1958–1991) (all <20 yr latency) |
7 |
1.1 (0.49–2.0)b |
|
Nelson et al. 1987 |
Skin-cancer deaths through 1982 among 9,187 white male workers employed at 10 Amoco refineries in |
11 |
2.01 (1.00–3.60) |
TABLE 4.22 Melanoma Skin Cancer and Exposure to Combustion Products—Selected Epidemiologic Studies
|
Reference |
Study Population |
Exposed Cases |
Estimated Relative Risk (95% CI) |
|
Cohort Studies |
|||
|
Boffetta et al. 2001 |
Cohort defined as those exposed to diesel emissions within Swedish Cancer Environment Registry of occupationally active residents of Sweden, 1960 and 1970—record-linkage approach (agent coded by JEM from 1960 occupation) |
|
|
|
|
Melanoma cases (1971–1989) |
|
|
|
Men |
1,272 |
0.88 (0.83–0.93) |
|
|
Women |
37 |
0.87 (0.61–1.19) |
|
|
Cohort of ACS Cancer Prevention II Study |
|||
|
Boffetta et al. 1988 |
Melanoma deaths among 369,943 male enrollees 40–79 yr old at 2-yr followup—Diesel engine exhaust (self-reported agent) |
11 |
1.67, ns |
|
Pion et al. 1995 |
2,780 melanoma cases among male and female enrollees at 6-yr followup |
|
|
|
|
Self-reported agents |
|
|
|
Coal tar, pitch, asphalt |
na |
0.90 (0.64–1.25) |
|
|
Diesel-engine exhaust |
na |
0.97 (0.82–1.15) |
|
|
Gasoline exhaust |
na |
0.99 (0.87–1.13) |
|
|
Occupation, males only |
|
|
|
|
Truck driver |
14 |
0.72 (0.40–1.30) |
|
|
Fireman |
7 |
2.29 (0.85–6.16) |
|
|
Case-Control Studies |
|||
|
Multicancer case-control study in Montreal, Canada (industrial-hygiene-coded agents from interview) |
|
|
|
|
Siemiatycki et al. 1988 |
121 male melanoma cases vs 2,737 cancer controls |
|
|
|
|
Gasoline exhaust |
43 |
0.9 (0.7–1.2)a |
|
Diesel exhaust |
17 |
1.1 (0.7–1.7)a |
|
|
Reference |
Study Population |
Exposed Cases |
Estimated Relative Risk (95% CI) |
|
|
Jet-fuel exhaust |
3 |
1.8 (0.5–6.4)a |
|
Liquid-fuel combustion |
8 |
1.8 (0.9–3.4)a |
|
|
Coke combustion |
0 |
0.0 (0.0–1.9)a |
|
|
Propane exhaust |
5 |
3.3 (1.2–9.0)a |
|
|
Fritschi and Siemiatycki 1996a |
103 male melanoma cases vs 533 cancer and 533 population controls pooled |
|
|
|
|
Gasoline-engine emissions |
37 |
1.1 (0.7–1.8) |
|
Carbon monoxide |
42 |
1.0 (0.6–1.5) |
|
|
PAHs from petroleum |
54 |
0.9 (0.6–1.4) |
|
|
Linet et al. 1995 |
3,850 male melanoma cases (1961–1979) from Swedish Cancer Environment Registry of occupationally active residents of Sweden in 1 960—record-linkage approach (occupation and industry from 1960 census) |
|
|
|
|
Transportation (industry) |
327 |
1.0 |
|
Transport |
251 |
1.0 |
|
|
Transport-associated |
31 |
0.9 |
|
|
Post office and telecommunications |
45 |
0.9 |
|
|
Transport and communications (occupation) |
281 |
0.9 |
|
|
Ship’s officers |
17 |
1.0 |
|
|
Deck and machine-crew work |
13 |
1.0 |
|
|
Aeronautics |
4 |
2.7, ns |
|
|
Locomotive engineers and other railroad or highway |
168 |
0.8 |
|
|
Traffic administration |
23 |
1.6, p<0.05 |
|
|
Traffic enforcement and railroad work |
18 |
3.1, p<0.01 |
|
|
Post office and telecommunications |
14 |
1.6, ns |
|
|
Postal and other messenger work |
34 |
1.9, ns |
|
|
Other transport and communications |
7 |
1.0 |
|
|
Nelemans et al. 1993 |
140 melanoma cases among residents of mideastern part of Netherlands (industry from interview work history) |
|
|
|
|
Petrochemical |
1 |
– |
|
Transportation or communication |
|
|
|
|
Ever vs never this industry |
44 |
1.70 (0.84–3.46) |
|
|
Ever vs never any high-risk industry |
44 |
1.92 (0.84–4.35) |
|
|
Decoufle and Stanislawczyk 1977 |
Male melanoma cases among patients at Roswell Park Memorial Institute in Buffalo, New York |
|
|
|
|
Bus drivers |
0 |
– |
|
Taxicab drivers and chauffeurs |
1 |
3.51 |
|
|
Truck and tractor drivers |
2 |
1.24 |
|
|
Bus, taxicab, or truck drivers, exposed 5+ yr |
2 |
1.68 |
|
|
Delivery and routemen |
1 |
1.92 |
|
|
Locomotive engineers and firemen |
3 |
9.70 |
|
|
Exposed 5+ yr |
2 |
9.07 |
|
|
Mechanics and repairmen |
4 |
1.81 |
|
|
Exposed 5+ yr |
4 |
2.33 |
|
|
Mine operatives and laborers |
3 |
6.78 |
TABLE 4.23 Non-Melanoma Skin Cancer and Exposure to Fuels—Selected Epidemiologic Studies
|
Reference |
Study Population |
Exposed Cases |
Estimated Relative Risk (95% CI) |
|
Cohort Study—Incidence (not smoking-adjusted) |
|||
|
Jarvholm et al. 1997 |
Male workers in the Swedish petroleum industry ≥1 yr (qualitative industrial-hygiene-interpretation of personnel records) |
|
|
|
|
Cases of nonmelanoma skin cancer |
7 |
1.3 (0.61–2.4)a |
|
With ≥20-yr latency |
6 |
1.8 (0.77–3.5)a |
|
|
With ≥10-yr duration |
3 |
0.97 (0.26–2.5)a |
|
|
Case-Control Studies-Incidence (none smoking-adjusted) |
|||
|
Gallagher et al. 1996 |
Nonmelanoma skin cancers among male residents of Alberta, Canada; self-reported agents |
|
|
|
|
226 BCCs-ever exposed to petroleum products (gasoline and oil) |
88 |
0.9 (0.6–1.3) |
|
180 SCCs-ever exposed to petroleum products (gasoline and oil) |
91 |
1.3 (1.0–2.0) |
|
|
Kubasiewicz et al. 1991 |
376 skin cancer cases among male residents of Lodz, Poland; self-reported agents |
|
|
|
|
Petrol ever exposed |
71 |
1.30, ns |
|
Petroleum ever exposed |
57 |
1.17, ns |
|
|
Gasoline ever exposed |
Too sparse to report |
– |
|
|
NOTE: ns=estimated risk greater than unity not significant at 0.05 level. aThis article reported 90% CIs. |
|||
TABLE 4.24 Non-Melanoma Skin Cancer and Exposure to Combustion Products—Selected Epidemiologic Studies
|
Reference |
Study Population |
Exposed Cases |
Estimated Relative Risk (95% CI) |
|
Case-Control Studies (none smoking-adjusted) |
|||
|
Hannuksela-Svahn et al. 1999 |
Nonmelanoma skin cancers diagnosed in 1971–1995 among residents of Finland born in 1906–1945—record linkage approach (main occupation from 1970 census) |
|
|
|
|
Basal-cell carcinoma |
|
|
|
49,910 male |
|
|
|
|
Transportation and communication |
1,910 |
1.0 (1.0–1.1) |
|
|
Engine drivers |
na |
1.6 |
|
|
70,320 female |
|
|
|
|
Transportation and communication |
542 |
1.0 (0.9–1.1) |
|
|
Other non-melanoma skin cancer cases (predominantly squamous cell carcinomas) |
|
|
|
|
8,380 male |
|
|
|
|
Reference |
Study Population |
Exposed Cases |
Estimated Relative Risk (95% CI) |
|
|
Transportation and communication |
232 |
0.9 (0.8–1.0) |
|
|
9,395 female |
|
|
|
|
Transportation and communication |
61 |
1.1 (0.9–1.4) |
|
Gallagher et al. 1996 |
Nonmelanoma skin cancers among male residents of Alberta, Canada (self-reported agents) |
|
|
|
|
226 basal-cell carcinomas—ever exposed to: |
|
|
|
Diesel fumes |
85 |
1.1 (0.8–1.6) |
|
|
Pitch tar and tar products |
32 |
1.2 (0.7–2.1) |
|
|
Grease |
84 |
0.9 (0.6–1.3) |
|
|
Coal dust |
67 |
1.4 (0.9–2.1) |
|
|
180 squamous-cell carcinomas—ever exposed to: |
|
|
|
|
Diesel fumes |
83 |
1.7 (1.1–2.5) |
|
|
Pitch tar and tar products |
27 |
0.9 (0.5–1.7) |
|
|
Grease |
94 |
1.4 (0.9–2.1) |
|
|
Coal dust |
69 |
1.6 (1.0–2.4) |
|
|
Kubasiewicz et al. 1991 |
376 skin-cancer cases among male residents of Lodz, Poland |
|
|
|
|
PAHs (composite of self-reports on 17 agents) |
|
|
|
None |
160 |
1.0 |
|
|
Any (vs population controls) |
216 |
1.15 (0.90–1.51)a |
|
|
>0–9 yr |
49 |
1.43, ns |
|
|
10–19 yr |
42 |
1.20, ns |
|
|
20–29 yr |
36 |
0.78 |
|
|
30+ yr |
89 |
1.29, ns |
|
|
Ever exposed to source of PAHs (self-reported agents) |
|
|
|
|
Grease |
172 |
1.15, ns |
|
|
Tar |
28 |
1.09, ns |
|
|
Pitch |
15 |
0.93 |
|
|
Soot |
29 |
1.22, ns |
|
|
Mineral oils |
99 |
1.46 (1.06–2.05) |
|
|
Coke |
32 |
1.29, ns |
|
|
Paraffin |
24 |
1.81, ns |
|
|
Paraffin oils |
8 |
1.45, ns |
|
|
Bituminous mass |
13 |
2.03, ns |
|
|
NOTE: na=not available; ns=estimated risk greater than unity not statistically significant at 0.05%. a95% CIs calculated with standard methods from observed and expected numbers presented in original paper. |
|||
TABLE 4.25 Female Breast Cancer and Exposure to Fuels—Selected Epidemiologic Studies
|
Reference |
Study Population |
Exposed Cases |
Estimated Relative Risk (95% CI) |
|
Cohort Studies |
|||
|
Lewis et al. 2003 |
Imperial Oil workers in Canada |
|
|
|
|
Mortality |
20 |
1.08 (0.66–1.67) |
|
Incidence |
76 |
1.02 (0.80–1.28) |
|
|
Divine et al. 1999b |
Texaco mortality study |
15 |
0.71 (0.40–1.18) |
|
Lagorio et al. |
Filling-station attendants in Italy (exposure |
2 |
1.04 (0.18–3.28) |
|
Reference |
Study Population |
Exposed Cases |
Estimated Relative Risk (95% CI) |
|
1994 |
reconstruction using monitoring) |
|
|
TABLE 4.26 Female Breast Cancer and Exposure to Combustion Products—Selected Epidemiologic Studies
|
Reference |
Study Population |
Exposed Cases |
Estimated Relative Risk (95% CI) |
|
Case-Control Studies (not adjusted for smoking) |
|||
|
Petralia et al. 1999 |
301 cases among premenopausal female residents of western New York state; JEM-derived agents |
|
|
|
|
PAHs (with or without benzene exposure) |
38 |
1.82 (1.02–3.16) |
|
PAHs (without benzene exposure) |
6 |
1.01 (0.55–3.45) |
|
|
PAHs (with benzene exposure) |
32 |
2.01 (1.08–3.75) |
|
|
Duration |
|
|
|
|
<4 yr |
19 |
2.25 (0.99–5.09) |
|
|
≥4 yr |
18 |
1.49 (0.70–3.18) |
|
|
Average probability |
|
|
|
|
Low |
23 |
1.56 (0.78–3.12) |
|
|
Medium to high |
14 |
2.40 (0.96–6.01) |
|
|
Intensity |
|
|
|
|
Low |
26 |
1.65 (0.85–3.21) |
|
|
Medium to high |
11 |
2.25 (0.82–6.13) |
|
|
Cumulative exposure |
|
|
|
|
Low |
26 |
2.10 (1.07–4.53) |
|
|
Medium to high |
11 |
1.30 (0.54–3.17) |
|
|
Latency |
|
|
|
|
10–19 yr |
12 |
1.48 (0.59–3.71) |
|
|
≥20 yr |
13 |
1.78 (0.70–4.52) |
|
|
Lewis-Michl et al. 1996 |
627 cases among postmenopausal female residents of Nassau and Suffolk counties, New York; geographic-information-system-derived exposures (fully adjusted) |
|
|
|
|
Nassau—401 cases |
|
|
|
Chemical or other facilities in residence grid |
127 |
1.11 (0.83–1.48) |
|
|
Chemical facilities in residence grid |
58 |
1.61 (1.06–2.43) |
|
|
Only other facilities in residence grid |
69 |
1.08 (0.80–1.46) |
|
|
High-density traffic |
33 |
1.29 (0.77–2.15) |
|
|
Suffolk—226 cases |
|
|
|
|
Chemical or other facilities in residence grid |
44 |
1.12 (0.72–1.74) |
|
|
Chemical facilities in residence grid |
14 |
1.58 (0.71–3.51) |
|
|
Only other facilities in residence grid |
30 |
0.99 (0.62–1.56) |
|
|
High-density traffic |
11 |
0.89 (0.40–1.99) |
|
TABLE 4.27 Male Breast Cancer and Exposure to Fuels—Selected Epidemiologic Studies
|
Reference |
Study Population |
Exposed Cases |
Estimated Relative Risk (95% CI) |
|
Case-Control Study (not adjusted for smoking) |
|||
|
Hansen 2000 |
230 cases among male residents of Denmark; exposure derived from job title and white- or blue-collar worker status |
|
|
|
|
Gasoline and combustion products |
|
|
|
No lag |
19 |
2.2 (1.4–3.6) |
|
|
Period of first exposure |
|
|
|
|
<1965 |
10 |
2.6 (1.3–4.9) |
|
|
1965–1974 |
8 |
2.0 (1.0–4.2) |
|
|
1975–1989 |
1 |
1.5 (0.2–10.1) |
|
|
Age at first exposure |
|
|
|
|
<40 yr |
9 |
3.7 (1.7–7.9) |
|
|
40–66 yr |
10 |
1.7 (0.9–3.4) |
|
|
10 yr lag |
12 |
2.5 (1.3–4.5) |
|
|
Period of first exposure |
|
|
|
|
<1965 |
8 |
2.8 (1.4–5.5) |
|
|
1965–1974 |
4 |
2.0 (1.0–4.0) |
|
|
1975–1989 |
0 |
– |
|
|
Age at first exposure |
|
|
|
|
<40 yr |
8 |
5.4 (2.4–11.9) |
|
|
40–66 yr |
4 |
1.2 (0.4–3.3) |
|
TABLE 4.28 Male Breast Cancer and Exposure to Combustion Products—Selected Epidemiologic Studies
|
Reference |
Study Population |
Exposed Cases |
Estimated Relative Risk (95% CI) |
|
Case-Control Studies |
|||
|
Hansen 2000 |
230 cases among male residents of Denmark; exposure derived from job title and white- or blue-collar worker status (not smoking-adjusted) |
|
|
|
|
Gasoline and combustion products |
|
|
|
No lag time |
19 |
2.2 (1.4–3.6) |
|
|
Period of first exposure |
|
|
|
|
<1965 |
10 |
2.6 (1.3–4.9) |
|
|
1965–1974 |
8 |
2.0 (1.0–4.2) |
|
|
1975–1989 |
1 |
1.5 (0.2–10.1) |
|
|
Age at first exposure |
|
|
|
|
<40 yr |
9 |
3.7 (1.7–7.9) |
|
|
40–66 yr |
10 |
1.7 (0.9–3.4) |
|
|
10-yr lag time |
12 |
2.5 (1.3–4.5) |
|
|
Period of first exposure |
|
|
|
|
<1965 |
8 |
2.8 (1.4–5.5) |
|
|
1965–1974 |
4 |
2.0 (1.0–4.0) |
|
|
Age at first exposure |
|
|
|
|
<40 yr |
8 |
5.4 (2.4–11.9) |
|
|
40–66 yr |
4 |
1.2 (0.4–3.3) |
|
|
Cocco et al. 1998 |
178 cases among male residents of US; job titles, JEM-derived agents (smoking-adjusted) |
|
|
|
|
PAHs |
|
|
|
Nonexposed |
135 |
1.0 |
|
|
Reference |
Study Population |
Exposed Cases |
Estimated Relative Risk (95% CI) |
|
|
Probability of exposure |
|
|
|
Low |
13 |
1.3 (0.7–2.6) |
|
|
Medium |
7 |
0.6 (0.3–1.5) |
|
|
High |
23 |
0.7 (0.4–1.2) |
|
|
Intensity of exposure |
|
|
|
|
Low |
25 |
0.7 (0.5–1.2) |
|
|
Medium |
12 |
1.0 (0.5–2.1) |
|
|
High |
6 |
1.0 (0.4–2.5) |
|
|
Taxicab drivers |
3 |
4.8 (1.1–20.1) |
|
|
Motor vehicles and equipment (industry) |
7 |
3.1 (1.2–8.2) |
|
|
Railways (industry) |
3 |
1.0 (0.3–3.7) |
TABLE 4.29 Female Genital Cancers and Exposure to Fuels—Selected Epidemiologic Studies
|
Reference |
Study Population |
Exposed Cases |
Estimated Relative Risk (95% CI) |
|
Cohort Studies (not adjusted for smoking) |
|||
|
Lewis et al. 2003 |
Cancers 1969–1994 among female Canadian Imperial Oil workers hired in 1964–1994 |
|
|
|
|
Cervical cancer |
|
|
|
Incidence |
7 |
0.42 (0.17–0.86) |
|
|
Mortality |
3 |
1.01 (0.21–2.95)a |
|
|
Uterine cancer |
|
|
|
|
Incidence |
3 |
0.31 (0.06–0.89) |
|
|
Mortality |
0 |
0.00 (0.00–7.24)a |
|
|
Cancers of the ovary, fallopian tubes, and broad ligaments |
|
|
|
|
Incidence |
15 |
1.40 (0.78–2.30) |
|
|
Mortality |
7 |
1.74 (0.70–3.58) |
|
|
Divine et al. 1999b |
Texaco mortality study |
|
|
|
Cervical cancer |
1 |
0.30 (0.00–1.67) |
|
|
|
Uterine cancer |
4 |
1.43 (0.39–3.67) |
|
Nested Case-Control Study (not adjusted for smoking) |
|||
|
Vasama-Neuvonen et al. 1999 |
5,072 ovarian-cancer cases nested among occupationally active female residents of Finland; JEM-derived agents |
|
|
|
|
Gasoline |
na |
0.8 (0.2–3.4) |
|
Low |
|
0.8 (0.4–1.8) |
|
|
Medium and high |
|
0.8 (0.2–3.4) |
|
|
NOTE: na=not available. aUnadjusted risk estimates and 95% CIs calculated with standard methods from observed and expected numbers presented in original paper. |
|||
TABLE 4.30 Female Genital Cancers and Exposure to Combustion Products—Selected Epidemiologic Studies
|
Reference |
Study Population |
Exposed Cases |
Estimated Relative Risk (95% CI) |
|
Case-Control Studies (not adjusted for smoking) |
|||
|
Velema et al. 2002 |
366 cervical-cancer cases among female residents of Honduras |
|
|
|
|
Exposure to wood smoke (self-reported agent) |
|
|
|
Grade I neoplasia |
|
|
|
|
0 yr |
9 |
1.00 |
|
|
1–14 yr |
20 |
0.61 (0.20–1.90) |
|
|
15–24 yr |
10 |
0.45 (0.13–1.55) |
|
|
25+ yr |
5 |
0.32 (0.06–1.58) p for trend=0.105 |
|
|
Grade II neoplasia |
|
|
|
|
0 yr |
9 |
1.00 |
|
|
1–14 yr |
11 |
0.28 (0.07–1.15) |
|
|
15–24 yr |
10 |
0.90 (0.19–4.25) |
|
|
25+ yr |
6 |
0.66 (0.08–5.63) p for trend=0.152 |
|
|
Grade III neoplasia |
|
|
|
|
0 yr |
9 |
1.00 |
|
|
1–14 yr |
11 |
0.36 (0.11–1.18) |
|
|
15–24 yr |
8 |
0.35 (0.09–1.39) |
|
|
25–34 yr |
8 |
1.34 (0.20–91.8) |
|
|
35+ yr |
9 |
4.89 (0.51–47.1) p for trend=0.022 |
|
|
Weiderpass et al. 2001 |
Finnish women born in 1906–1945 employed according to 1 970 census (excluding managerial, clerical, and agricultural); agent exposure determined with Finnish JEM |
|
|
|
|
1,101 cervical cancers |
|
|
|
Diesel-engine exhaust |
|
|
|
|
Low |
15 |
1.0 (0.6–1.7) |
|
|
High |
2 |
1.7 (0.4–6.8) |
|
|
Gasoline-engine exhaust |
|
|
|
|
Low |
15 |
1.4 (0.8–2.3) |
|
|
High |
13 |
1.3 (0.7–2.2) |
|
|
PAHs |
|
|
|
|
Low |
20 |
1.3 (0.8–2.1) |
|
|
High |
2 |
1.2 (0.3–4.8) |
|
|
2,833 endometrial cancers |
|
|
|
|
Diesel-engine exhaust |
|
|
|
|
Low |
20 |
0.8 (0.5–1.2) |
|
|
High |
2 |
0.8 (0.2–3.0) |
|
|
Gasoline-engine exhaust |
|
|
|
|
Low |
22 |
0.9 (0.6–1.4) |
|
|
High |
17 |
0.9 (0.6–1.5) |
|
|
PAHs |
|
|
|
|
Low |
35 |
1.0 (0.7–1.5) |
|
|
High |
2 |
0.6 (0.1–2.2) |
|
|
Vasama-Neuvonen et al. 1999 |
5,072 ovarian cancers |
|
|
|
Diesel-engine exhaust |
na |
1.3 (0.8–2.2) |
|
|
|
Low |
|
1.3 (0.9–1.8) |
TABLE 4.31 Prostatic Cancer and Exposure to Fuels—Selected Epidemiologic Studies
|
Reference |
Study Population |
Exposed Cases |
Estimated Relative Risk (95% CI) |
|
Cohort Studies (not adjusted for smoking) |
|||
|
Lewis et al. 2003 |
Cancers 1969–1994 among male Canadian Imperial Oil workers hired in 1964–1994 |
|
|
|
|
Prostate cancer |
|
|
|
Incidence |
20 |
0.67 (0.41–1.03) |
|
|
Mortality |
1 |
0.22 (0.01–1.21)a |
|
|
Testicular cancer |
|
|
|
|
Incidence |
14 |
0.82 (0.45–1.37) |
|
|
Mortality |
3 |
1.86 (0.38–5.45)a |
|
|
Ritz et al. 1999 |
Prostatic-cancer cases among white male uranium-processing workers in Fernald, Ohio |
24 |
1.40 (0.90–2.08) |
|
|
Kerosene (exposure reconstruction by industrial-hygienists) |
|
|
|
|
Light exposure |
|
|
|
>2 yr duration, no lag |
7 |
0.76 (0.29–2.02) |
|
|
>2 yr duration, 15 yr lag |
7 |
0.88 (0.33–2.36) |
|
|
>5 yr duration, no lag |
6 |
0.92 (0.32–2.63) |
|
|
>5 yr duration, 15 yr lag |
6 |
1.10 (0.37–3.23) |
|
|
Moderate exposure |
|
|
|
|
>2 yr duration, no lag |
6 |
2.00 (0.54–7.34) |
|
|
>2 yr duration, 15 yr lag |
6 |
2.44 (0.69–2.36) |
|
|
>5 yr duration, no lag |
6 |
3.69 (0.91–15.0) |
|
|
>5 yr duration, 15 yr lag |
5 |
3.40 (0.78–14.8) |
|
|
Case-Control Study (adjusted for smoking) |
|||
|
Siemiatycki et al. 1987a |
452 prostatic cancer cases among residents of Montreal, Canada; industrial-hygiene-derived agents |
|
|
|
|
Automotive gasoline |
56 |
1.0 (0.8–1.2)b |
|
Aviation gasoline |
6 |
0.9 (0.4–2.0)b |
|
|
Kerosene |
34 |
1.1 (0.8–1.5)b |
|
|
Jet fuel |
4 |
0.7 (0.2–2.1)b |
|
|
Diesel fuel |
25 |
1.7 (1.2–2.5)b |
|
|
Heating oil |
26 |
1.4 (1.0–1.9)b |
|
|
Crude oil |
6 |
2.3 (0.7–7.1)b |
|
|
aRisk estimates and 95% CIs calculated with standard methods from observed and expected numbers presented in original paper. b90% CIs presented. |
|||
TABLE 4.32 Prostatic Cancer and Exposure to Combustion Products—Selected Epidemiologic Studies
|
Reference |
Study Population |
Exposed Cases |
Estimated Relative Risk (95% CI) |
|
Case-Control Studies (adjusted for smoking, unless noted otherwise) |
|||
|
Krstev et al. 1998 |
Prostate cancer cases among residents of Atlanta, GA; Detroit, MI; and 10 counties in NJ; job titles, occupation (not adjusted for smoking) |
|
|
|
|
Firefighting (occupation) |
10 |
3.34 (1.13–9.91) |
|
Railroad transportation (industry) |
65 |
1.66 (1.13–2.44) |
|
|
<5 yr |
41 |
1.47 (0.92–2.34) |
|
|
5–19 yr |
14 |
1.43 (0.66–3.09) |
|
|
≥20 yr |
10 |
6.47 (1.40–29.9) |
|
|
Aronson et al. 1996 |
449 prostatic-cancer cases among residents of Montreal, Canada; job titles, industrial-hygiene-derived agents (not adjusted for smoking) |
|
|
|
|
Railway transport (industry) |
|
|
|
<10 yr |
19 |
1.51 (0.88–2.61) |
|
|
≥10 yr |
32 |
1.27 (0.83–1.94) |
|
|
Mechanics |
|
|
|
|
<10 yr |
16 |
1.02 (0.57–1.80) |
|
|
≥10 yr |
32 |
1.29 (0.84–1.97) |
|
|
Railway-transport workers |
|
|
|
|
<10 yr |
5 |
4.47 (1.26–15.83) |
|
|
≥10 yr |
7 |
1.81 (0.71–4.58) |
|
|
Diesel-engine emissions |
|
|
|
|
Nonsubstantial |
44 |
1.54 (1.04–2.27) |
|
|
Substantial |
32 |
1.05 (0.68–1.64) |
|
|
Propane-engine emissions |
|
|
|
|
Nonsubstantial |
5 |
1.88 (0.61–5.75) |
|
|
Substantial |
8 |
1.83 (0.77–4.38) |
|
|
Liquid-fuel combustion products |
|
|
|
|
Nonsubstantial |
19 |
1.51 (0.85–2.70) |
|
|
Substantial |
20 |
1.77 (0.98–3.19) |
|
|
Soot |
|
|
|
|
Nonsubstantial |
40 |
1.25 (0.78–2.01) |
|
|
Substantial |
10 |
1.20 (0.52–2.81) |
|
|
PAHs from any source |
|
|
|
|
Nonsubstantial |
238 |
0.84 (0.63–1.12) |
|
|
From coal |
40 |
1.99 (1.24–3.20) |
|
|
Substantial |
62 |
1.21 (0.68–2.17) |
|
|
From coal |
20 |
1.08 (0.40–2.95) |
|
|
Benzo[a]pyrene, substantial |
22 |
0.63 (0.28–1.39) |
|
|
Siemiatycki et al. 1988 |
452 prostate cancer cases among residents of Montreal, Canada; industrial-hygiene-derived agents |
|
|
|
|
Exhausts |
|
|
|
Gasoline |
197 |
1.1 (0.9–1.2)a |
|
|
Diesel |
86 |
1.2 (1.0–1.5) |
|
|
Jet fuel |
2 |
0.7 (0.1–5.1) |
|
|
Propane |
13 |
1.5 (0.9–2.7) |
|
|
Combustion products |
|
|
|
|
Propane |
17 |
1.3 (0.8–2.0) |
|
|
Natural gas |
9 |
0.8 (0.4–1.4) |
|
|
Liquid fuel |
39 |
1.6 (1.2–2.1) |
|
TABLE 4.33 Brain/CNS Cancers and Exposure to Fuels—Selected Epidemiologic Studies
|
Reference |
Study Population |
Exposed Cases |
Estimated Relative Risk (95% CI) |
|
Cohort Studies—Mortality (not adjusted for smoking) |
|||
|
Divine et al. 1999a |
Deaths through 1993 among Texaco refinery, petrochemical, or research workers employed for at least 5 yr (with at least 1 day after 1976) |
|
|
|
|
Tumors (benign or malignant) of brain and CNS |
|
|
|
White men |
85 |
1.13 (0.90–1.40) |
|
|
Date of hire |
|
|
|
|
Before 1950 |
62 |
1.13 (0.86–1.45) |
|
|
1950 or after |
23 |
1.13 (0.72–1.70) |
|
|
Motor-oil unit |
|
|
|
|
Ever |
11 |
1.78 (0.88–3.19) |
|
|
>5 yr |
8 |
3.26 (1.40–6.43) |
|
|
Divine et al. 1999b |
Cancers of brain and CNS (ICD-8 191–192) |
|
|
|
|
White men |
64 |
1.08 (0.83–1.37) |
|
Duration of employment |
|
|
|
|
5–10 yr |
8 |
1.25 (0.54–2.46) |
|
|
10–19 yr |
14 |
1.25 (0.68–2.10) |
|
|
20–29 yr |
16 |
1.00 (0.57–1.62) |
|
|
>30 yr |
26 |
1.00 (0.66–1.47) |
|
|
Date of hire |
|
|
|
|
Before 1950 |
48 |
1.13 (0.83–1.50) |
|
|
1950 or after |
16 |
0.95 (0.54–1.54) |
|
|
Reference |
Study Population |
Exposed Cases |
Estimated Relative Risk (95% CI) |
|
|
Motor oil units, >5 yr |
6 |
3.14 (1.15–6.84) |
|
Nonwhite men |
4 |
2.87 (0.77–7.35) |
|
|
Women |
1 |
0.40 (0.01–2.21) |
|
|
Consonni et al. 1999 |
Oil-refinery workers in Milan vicinity, Italy |
5 |
2.08 (0.67–4.85) |
|
|
Duration of employment |
|
|
|
0–4 yr |
3 |
3.97 (0.80–11.61) |
|
|
5–14 yr |
2 |
2.26 (0.25–8.17) |
|
|
15+ yr |
0 |
0.00 (0.00–4.77) |
|
|
Time since first hire |
|
|
|
|
0–9 yr |
3 |
9.60 (1.93–28.04) |
|
|
10–19 yr |
2 |
3.41 (0.38–12.31) |
|
|
20–29 yr |
0 |
0.00 (0.00–4.01) |
|
|
30+ yr |
0 |
0.00 (0.00–6.18) |
|
|
Lagorio et al. 1994 |
Filling-station attendants in Italy—xervous system cancer (exposure reconstruction using monitoring) |
6 |
2.14 (0.93–4.21) |
|
|
Subset of smaller stations |
5 |
2.66 (1.05–5.59) |
|
Men |
5 |
1.95 (0.77–4.11) |
|
|
Employed at small stations |
4 |
2.33 (0.79–5.32) |
|
|
Women |
1 |
4.00 (0.20–18.98) |
|
|
Employed at small stations |
1 |
6.25 (0.32–29.65) |
|
|
Case-Control Studies (not adjusted for smoking) |
|||
|
De Roos et al. 2003 |
479 glioma cases from three US hospitals |
|
|
|
|
Gas station attendants |
14 |
0.5 (0.3–0.9) |
|
|
>5 years total |
3 |
0.8 (0.2–3.6) |
|
Carozza et al. 2000 |
476 glioma cases among residents of six San Francisco Bay counties in California; occupation |
|
|
|
|
No latency |
|
|
|
Petroleum and gas workers |
|
|
|
|
Ever |
5 |
4.9 (0.6–42.2) |
|
|
<10 yr |
|
3.8 (0.4–34.4) |
|
|
Service station attendants |
|
|
|
|
Ever |
17 |
0.5 (0.3–1.0) |
|
|
<10 yr |
|
0.4 (0.2–0.9) |
|
|
10-yr latency |
|
|
|
|
Petroleum and gas workers |
|
|
|
|
Ever |
|
4.9 (0.6–42.2) |
|
|
<10 yr |
|
3.8 (0.4–34.4) |
|
|
Service station attendants |
|
|
|
|
Ever |
|
0.5 (0.3–1.1) |
|
|
<10 yr |
|
0.4 (0.2–0.9) |
|
TABLE 4.34 Brain/CNS Cancers and Exposure to Combustion Products—Selected Epidemiologic Studies
|
Reference |
Study Population |
Exposed Cases |
Estimated Relative Risk (95% CI) |
|
Case-Control Studies (not adjusted for smoking) |
|||
|
De Roos et al. 2003 |
479 glioma cases from three US hospitals |
|
|
|
|
Drivers (car and light trucks) |
20 |
0.9 (0.5–1.7) |
|
>5 years total |
3 |
0.6 (0.2–2.3) |
|
|
Truck drivers (heavy) |
31 |
0.7 (0.4–1.1) |
|
|
>5 years total |
13 |
0.7 (0.3–1.3) |
|
|
Railroad occupations |
6 |
1.1 (0.4–3.3) |
|
|
>5 years total |
0 |
0.0 (0.0–∞) |
|
|
Carozza et al. 2000 |
476 glioma cases among residents of six San Francisco Bay counties in California; occupation |
|
|
|
|
No latency |
|
|
|
Motor-vehicle operators, ever employed |
42 |
1.0 (0.6–1.6) |
|
|
<10 yr |
|
0.8 (0.5–1.4) |
|
|
≥10 yr |
|
2.1 (0.7–6.2) |
|
|
Vehicle mechanics, ever employed |
24 |
0.4 (0.2–0.7) |
|
|
<10 yr |
|
0.5 (0.2–0.9) |
|
|
≥10 yr |
|
0.4 (0.2–1.0) |
|
|
Mechanics, not elsewhere classified, ever employed |
18 |
0.7 (0.4–1.4) |
|
|
<10 yr |
|
0.9 (0.4–1.8) |
|
|
≥10 yr |
|
0.4 (0.1–1.7) |
|
|
10-yr latency |
|
|
|
|
Motor-vehicle operators, ever employed |
|
1.0 (0.6–1.8) |
|
|
<10 yr |
0.8 (0.4–1.6) |
||
|
≥10 yr |
1.8 (0.6–5.3) |
||
|
Vehicle mechanics, ever employed |
0.5 (0.3–0.8) |
||
|
<10 yr |
0.6 (0.3–1.1) |
||
|
≥10 yr |
0.4 (0.2–1.0) |
||
|
Mechanics, not elsewhere classified, ever employed |
0.7 (0.3–1.4) |
||
|
<10 yr |
0.8 (0.4–1.7) |
||
|
≥10 yr |
0.3 (0.0–2.5) |
||
TABLE 4.35 Ocular Melanoma and Exposure to Combustion Products—Selected Epidemiologic Studies
|
Reference |
Study Population |
Exposed Cases |
Estimated Relative Risk (95% CI) |
|
Case-Control Studies (not adjusted for smoking) |
|||
|
Monarrez-Espino et al. 2002 |
118 pooled uveal melanoma cases from two studies among residents of Germany; self-reported job titles |
|
|
|
Men |
|
|
|
|
|
Transport equipment operators |
11 |
1.5 (0.66–3.23) |
|
Women |
|
|
|
|
Station, engine, heavy-equipment operators, freight handlers |
9 |
2.5 (0.94–6.58) |
|
|
Guenel et al. 2001 |
50 ocular melanoma cases among residents of 10 administrative areas in France; self-reported job titles |
|
|
|
Reference |
Study Population |
Exposed Cases |
Estimated Relative Risk (95% CI) |
|
|
Transport-equipment operators |
|
|
|
Males |
5 |
1.4 (0.5–3.8) |
|
|
Females |
0 |
– |
|
|
Ajani et al. 1992 |
197 uveal melanoma cases among white residents of six New England states; self-reported job titles |
|
|
|
|
Transportation, communications, and other public utilities |
13 |
1.23 (0.55–2.74) |
TABLE 4.36 Bladder Cancer and Exposure to Fuels—Selected Epidemiologic Studies
|
Reference |
Study Population |
Exposed Cases |
Estimated Relative Risk (95% CI) |
|
Case-Control Studies (adjusted for smoking, unless noted otherwise) |
|||
|
Kogevinas et al. 2003 |
3,346 incident bladder cancer cases in men 30–79 yr old in six countries pooled in EMBCS |
|
|
|
|
Petroleum-refining occupation (ISCO code 745) (ever) |
3 |
0.52 (0.10–2.69) |
|
Cordier et al. 1993 |
658 male bladder-cancer cases in France (561 included in EMBCS sample+97 men excluded from pooled study) |
|
|
|
|
Petroleum-refining industry (ever) |
7 |
4.04 (0.78–21.03) |
|
Claude et al. 1988 |
531 male bladder cancer cases in Germany (363 included in EMBCS sample+168 men excluded from pooled study) |
|
|
|
|
Occupation (ever) (not adjusted for smoking) |
|
|
|
Gas station attendant and garage |
1 |
0.33 (0.04–2.87) |
|
|
Oil refinery worker |
3 |
1.50 (0.25–8.87) |
|
|
Kunze et al. 1992 |
Petroleum (self-reported agent) (not adjusted for smoking) |
156 |
1.4 (1.1–1.9) |
|
|
Duration |
|
|
|
1–9 yr |
20 |
1.2 |
|
|
10–19 yr |
26 |
1.0 |
|
|
20–29 yr |
30 |
1.3 |
|
|
≥30 yr |
80 |
1.8 (p<0.05) |
|
|
Zheng et al. 2002 |
1,135 male bladder-cancer cases among residents of Iowa |
|
|
|
|
Industries |
|
|
|
Petroleum and coal products |
7 |
1.0 (0.4–2.9) |
|
|
<10 yr |
2 |
3.2 (0.3–40.9) |
|
|
≥10 yr |
5 |
0.8 (0.2–2.6) |
|
|
Petroleum refining |
7 |
1.1 (0.4–3.2) |
|
|
<10 yr |
2 |
3.2 (0.3–40.9) |
|
|
≥10 yr |
5 |
0.8 (0.3–2.8) |
|
|
Occupation |
|
|
|
|
Garage and service station |
27 |
1.7 (0.9–3.1) |
|
|
<10 yr |
10 |
1.8 (0.7–4.8) |
|
|
≥10 yr |
17 |
1.6 (0.8–3.5) |
|
|
Reference |
Study Population |
Exposed Cases |
Estimated Relative Risk (95% CI) |
|
Steineck et al. 1990b |
254 male urothelial-cancer cases among residents of Stockholm, Sweden |
|
|
|
|
Petrol (industrial-hygiene integration of self-reports of occupation, industry, and specific exposures) |
18 |
1.4 (0.7–2.9) |
|
Low annual dose |
na |
0.7 (0.2–2.7) |
|
|
Medium annual dose |
na |
0.9 (0.2–4.3) |
|
|
High annual dose |
na |
2.5 (0.8–7.5) |
|
|
Steineck et al. 1989 |
10,123 bladder-cancer cases (1961–1979) among men employed in 1960 Swedish census (record-linkage approach, not adjusted for smoking) (JEM used to derive exposure from census occupation) |
|
|
|
|
Gasoline—moderate-high likelihood |
245 |
0.87 (0.76–1.00) |
|
Gasoline—high likelihood |
70 |
1.00 (0.79–1.27) |
|
|
Multicancer case-control study in Montreal, Canada |
|
|
|
|
Siemiatycki et al. 1987a |
486 male bladder cancer cases vs cancer controls, Agents—ever exposed (industrial-hygienist-derived) |
|
|
|
|
Automotive gasoline |
64 |
1.2 (0.9–1.4)a |
|
Aviation gasoline |
6 |
1.0 (0.5–2.2)a |
|
|
Kerosene |
31 |
1.1 (0.8–1.5)a |
|
|
Jet fuel |
4 |
0.7 (0.3–1.8)a |
|
|
Diesel fuel |
13 |
0.7 (0.5–1.1)a |
|
|
Heating oil |
18 |
0.9 (0.6–1.3)a |
|
|
Crude oil |
1 |
0.2 (0.1–2.0)a |
|
|
Siemiatycki et al. 1994 |
484 male bladder-cancer cases vs pooled cancer and population controls |
|
|
|
|
Petroleum and coal products (industry) |
|
|
|
<10 yr |
4 |
0.9 (0.3–2.7) |
|
|
≥10 yr |
2 |
0.4 (0.1–1.6) |
|
|
NCI NBCS, exposure classification by industry and occupation |
|
|
|
|
Silverman et al. 1989a |
126 nonwhite male bladder-cancer cases in 10 US SEER centers |
|
|
|
|
Petroleum worker (ever) |
4 |
2.1 (0.5–9.2) |
|
Garage and/or gas-station worker (ever) |
6 |
1.6 (0.5–4.9) |
|
|
Silverman et al. 1989b |
2,100 white male bladder cancer cases in 10 US SEER centers |
|
|
|
|
Petroleum-processing occupation (ever) |
71 |
1.3 (1.0–1.8) |
|
Crude extraction |
16 |
2.4 (1.1–5.5) |
|
|
Refining |
39 |
1.3 (0.8–2.0) |
|
|
Products |
22 |
1.2 (0.7–2.1) |
|
|
Silverman et al. 1983 |
303 white male bladder-cancer cases in Detroit subset of NBCS |
|
|
|
|
Industry (ever) |
6 |
6.0 (0.7–49.8) |
|
Petroleum extracting and refining (not adjusted for smoking) |
|
|
|
|
Gasoline service (adjusted for smoking and age) |
18 |
1.3 (0.8–3.5) |
|
|
Garage and/or gas-station occupation (ever) (not |
18 |
1.2 (0.6–2.4) |
|
TABLE 4.37 Bladder Cancer and Exposure to Combustion Products—Selected Epidemiologic Studies
|
Reference |
Study Population |
Exposed Cases |
Estimated Relative Risk (95% CI) |
|
Cohort Studies (adjusted for smoking, unless noted otherwise) |
|||
|
Zeegers et al. 2001 |
Nested case-control study of 532 male urothelial-cancer cases from Netherlands Cohort Study |
|
|
|
|
PAHs (industrial-hygiene integration of probability and duration of exposure) |
|
|
|
Low exposure tertile |
7 |
0.51 (0.22–1.19) |
|
|
Medium exposure tertile |
13 |
0.97 (0.49–1.90) |
|
|
High exposure tertile |
19 |
1.18 (0.62–2.24) p for trend=0.85 |
|
|
Diesel exhaust (industrial-hygiene integration of probability and duration of exposure) |
|
|
|
|
Low exposure tertile |
35 |
1.00 (0.65–1.54) |
|
|
Medium exposure tertile |
31 |
0.96 (0.60–1.53) |
|
|
High exposure tertile |
32 |
1.17 (0.74–1.84) p for trend=0.76 |
|
|
Boffetta et al. 2001 |
Cohort exposed to diesel emissions (industrial-hygiene-derived agent from job on 1960 Swedish census) defined among occupationally active residents of Sweden, 1960 and 1970—record-linkage approach, not adjusted for smoking |
|
|
|
|
Bladder-cancer (ICD-7 181) cases (1971–1989) |
|
|
|
Men |
4,018 |
1.00 (0.97–1.03) |
|
|
Women |
38 |
1.02 (0.72–1.41) |
|
|
Case-Control Studies (adjusted for smoking, unless noted otherwise) |
|||
|
European Merged Bladder Cancer Study (EMBCS) pooling results from 11 studies in six countries |
|
|
|
|
Kogevinas et al. 2003 |
3,346 incident bladder-cancer cases in men 30–79 yr old |
|
|
|
|
Occupations (ever) |
|
|
|
Firefighters, urban not distinguished from forest |
7 |
0.66 (0.27–1.62) |
|
|
Motor-vehicle mechanic |
108 |
1.16 (0.90–1.50) |
|
|
Automobile mechanic |
78 |
1.38 (1.02–1.87) |
|
|
Selected transport occupations |
|
|
|
|
Railway-engine drivers and firemen |
34 |
1.41 (0.87–2.28) |
|
|
Reference |
Study Population |
Exposed Cases |
Estimated Relative Risk (95% CI) |
|
|
Railway brakemen, signalmen, and shunters |
18 |
1.43 (0.77–2.63) |
|
Motor-vehicle drivers |
302 |
1.14 (0.97–1.33) |
|
|
Agents (Finnish JEM)—highest tertile vs unexposed |
|
|
|
|
PAHs |
na |
1.23 (1.07–1.40) |
|
|
Benzo[a]pyrene |
na |
1.27 (1.04–1.54) |
|
|
‘t Mannetje et al. 1999 |
700 incident bladder-cancer cases in women 30–79 yr old |
|
|
|
|
Motor-vehicle drivers (occupation ever) |
2 |
1.15 (unadjusted) |
|
PAHs (Finnish JEM) |
|
|
|
|
Low |
17 |
1.5 (0.8–2.9) |
|
|
Medium |
4 |
1.1 (0.4–3.5) |
|
|
High |
7 |
1.0 (0.4–2.5) |
|
|
PAHs (British JEM) |
|
|
|
|
Low |
42 |
0.9 (0.6–1.4) |
|
|
Medium |
5 |
1.1 (0.4–3.4) |
|
|
High |
5 |
1.2 (0.4–3.3) |
|
|
Pesch et al. 2000b |
Urothelial-carcinoma cases among residents of five regions in Germany (508 men and 176 women in EMBCS sample, plus 196 male and 155 female cases excluded from pooled study) |
|
|
|
|
704 male cases |
|
|
|
Motor-vehicle driver (occupation) |
|
|
|
|
Medium duration |
43 |
1.0 (0.7–1.4) |
|
|
Long duration |
54 |
1.7 (1.2–2.4) |
|
|
Very long duration |
21 |
1.5 (0.9–2.6) |
|
|
Production of tar, pitch, or bitumen (occupation) |
|
|
|
|
Medium duration |
1 |
0.8 (0.1–8.2) |
|
|
Long duration |
1 |
0.6 (0.1–5.0) |
|
|
Very long duration |
3 |
4.8 (0.9–26.0) |
|
|
Tar, pitch, and related products (agent) |
|
|
|
|
Self-report |
|
|
|
|
Medium duration |
14 |
0.6 (0.4–1.2) |
|
|
Long duration |
27 |
1.1 (0.7–1.7) |
|
|
Very long duration |
8 |
1.0 (0.4–2.2) |
|
|
British JEM |
|
|
|
|
Medium |
111 |
1.1 (0.9–1.4) |
|
|
High |
112 |
1.2 (0.9–1.5) |
|
|
Substantial |
50 |
1.6 (1.1–2.3) |
|
|
German JEM |
|
|
|
|
Medium |
71 |
0.7 (0.5–0.9) |
|
|
High |
87 |
0.8 (0.6–1.1) |
|
|
Substantial |
27 |
1.0 (0.7–1.7) |
|
|
Task-based JEM |
|
|
|
|
Medium |
18 |
0.6 (0.4–1.0) |
|
|
High |
36 |
1.2 (0.8–1.8) |
|
|
Substantial |
18 |
1.8 (1.0–3.4) |
|
|
PAHs (agent) |
|
|
|
|
British JEM |
|
|
|
|
Medium |
97 |
1.0 (0.8–1.3) |
|
|
High |
123 |
1.3 (1.0–1.7) |
|
|
Substantial |
47 |
1.6 (1.1–2.3) |
|
Reference |
Study Population |
Exposed Cases |
Estimated Relative Risk (95% CI) |
|
|
Task-based JEM |
|
|
|
Medium |
70 |
0.7 (0.5–1.0) |
|
|
High |
92 |
0.8 (0.6–1.1) |
|
|
Substantial |
47 |
1.2 (0.9–1.8) |
|
|
Exhaust (agent) |
|
|
|
|
Self-assessed |
|
|
|
|
Medium |
38 |
0.6 (0.4–0.9) |
|
|
High |
74 |
1.0 (0.8–1.3) |
|
|
Substantial |
19 |
0.8 (0.5–1.4) |
|
|
German JEM |
|
|
|
|
Medium |
157 |
1.0 (0.8–1.3) |
|
|
High |
173 |
1.3 (1.0–1.6) |
|
|
Substantial |
57 |
1.2 (0.9–1.7) |
|
|
331 female cases |
|
|
|
|
Tar, pitch, and related products—British JEM (agent) |
|
|
|
|
Medium |
14 |
1.1 (0.6–2.0) |
|
|
High |
16 |
1.3 (0.7–2.3) |
|
|
Substantial |
7 |
1.6 (0.6–4.3) |
|
|
PAHs—British JEM (agent) |
|
|
|
|
Medium |
17 |
1.0 (0.6–1.8) |
|
|
High |
17 |
1.3 (0.7–2.3) |
|
|
Substantial |
4 |
1.3 (0.4–4.2) |
|
|
Exhaust (agent) |
|
|
|
|
Self-assessed |
|
|
|
|
Medium |
2 |
0.6 (0.1–2.9) |
|
|
High |
1 |
0.3 (0.04–2.2) |
|
|
Substantial |
2 |
1.2 (0.2–6.0) |
|
|
German JEM |
|
|
|
|
Medium |
21 |
1.3 (0.7–2.2) |
|
|
High |
18 |
1.0 (0.6–1.8) |
|
|
Substantial |
2 |
0.7 (0.2–3.2) |
|
|
Clavel et al. 1994 |
658 male bladder-cancer cases among male residents of France (561 in EMBCS sample, plus 97 cases excluded from pooled study) |
|
|
|
|
Motor-vehicle mechanics (occupation) |
26 |
1.1 (0.6–2.1) |
|
Motor-vehicle driver (occupation) |
52 |
0.8 (0.6–1.2) |
|
|
PAHs (from expert review of job history) |
|
|
|
|
Exposed |
231 |
1.3 (1.0–1.7) |
|
|
Maximal exposure |
|
p for trend <0.05 |
|
|
Low |
129 |
1.2 (0.9–1.7) |
|
|
Medium |
64 |
1.3 (0.9–2.1) |
|
|
High |
29 |
1.8 (0.9–3.6) |
|
|
Average exposure to PAHs |
|
p for trend <0.05 |
|
|
Low |
127 |
1.2 (0.9–1.7) |
|
|
Medium |
64 |
1.4 (0.9–2.2) |
|
|
High |
26 |
1.8 (0.8–3.9) |
|
|
Cumulative exposure to PAHs (ng/m3×yr) |
|
p for trend, ns |
|
|
<100 |
108 |
1.7 (1.2–2.4) |
|
|
100–499 |
37 |
0.8 (0.5–1.3) |
|
|
500–14,999 |
48 |
1.3 (0.8–2.0) |
|
|
≥15,000 |
24 |
1.8 (0.8–3.9) |
|
|
Total duration (yr) |
|
p for trend, ns |
|
Reference |
Study Population |
Exposed Cases |
Estimated Relative Risk (95% CI) |
|
|
≤5 |
46 |
1.3 (0.9–2.1) |
|
5–15 |
50 |
1.5 (0.9–2.4) |
|
|
16–30 |
74 |
2.3 (1.3–4.2) |
|
|
>30 |
47 |
0.8 (0.5–1.3) |
|
|
Time since starting exposure (yr) |
|
p for trend=0.09 |
|
|
≤20 |
18 |
1.4 (0.7–2.8) |
|
|
20–29 |
26 |
1.8 (0.9–3.5) |
|
|
30–39 |
74 |
1.3 (0.8–1.9) |
|
|
40–49 |
56 |
1.2 (0.8–1.9) |
|
|
>50 |
43 |
1.3 (0.7–2.2) |
|
|
Age at beginning of exposure |
|
p for trend <0.05 |
|
|
≤25 |
157 |
1.2 (0.9–1.6) |
|
|
>25 |
60 |
1.7 (1.1–2.7) |
|
|
Time since cessation of exposure |
|
|
|
|
≤15 yr |
101 |
1.1 (0.8–1.6) |
|
|
16–25 |
76 |
1.9 (1.2–2.8) |
|
|
>35 |
40 |
1.3 (0.8–2.2) |
|
|
Jensen et al. 1987 |
281 male and 91 female bladder-cancer cases among residents of Copenhagen, Denmark (subset with complete information of 288 men and 96 women contributed to EMBCS sample) |
|
|
|
|
Land transport (industry) ever |
51 |
1.55 (1.06–2.28) |
|
Land transport (occupation) for 10 yr |
na |
1.28 (1–04–1.45) |
|
|
Bus, taxi, or truck driver (occupation)-for 10 yr |
na |
1.29 (1.05–1.59) |
|
|
Zheng et al. 2002 |
1,135 male bladder-cancer cases among residents of Iowa |
|
|
|
|
Industries (≥5 yr) |
|
|
|
Railroad transportation (40) |
33 |
1.4 (0.8–2.3) |
|
|
<10 yr |
4 |
0.6 (0.2–2.0) |
|
|
≥10 yr |
29 |
1.7 (1.0–3.1) |
|
|
Railroads (401) |
11 |
1.5 (0.6–3.9) |
|
|
<10 yr |
3 |
2.1 (0.3–13.3) |
|
|
≥10 yr |
8 |
1.4 (0.5–4.0) |
|
|
Transportation services (47) |
6 |
2.8 (0.7–11.8) |
|
|
<10 yr |
2 |
2.9 (0.2–35.4) |
|
|
≥10 yr |
4 |
2.7 (0.5–15.8) |
|
|
General automotive repair shops |
20 |
3.0 (1.3–6.7) |
|
|
<10 yr |
4 |
2.0 (0.4–9.3) |
|
|
≥10 yr |
16 |
3.4 (1.3–9.0) |
|
|
Occupations (≥5 yr) |
|
|
|
|
Mechanics and repairers (61) |
118 |
1.3 (1.0–1.8) |
|
|
<10 yr |
21 |
1.2 (0.6–2.1) |
|
|
≥10 yr |
97 |
1.4 (1.0–1.9) |
|
|
Automobile mechanics (6111) |
44 |
1.6 (1.0–2.6) |
|
|
<10 yr |
8 |
1.4 (0.5–3.7) |
|
|
≥10 yr |
36 |
1.7 (1.0–2.8) |
|
|
Miscellaneous mechanics and repairers (617) |
32 |
1.8 (1.0–3.1) |
|
|
<10 yr |
8 |
1.0 (0.4–2.7) |
|
|
≥10 yr |
24 |
2.4 (1.2–4.7) |
|
|
Drivers |
78 |
1.3 (0.9–1.8) |
|
|
<10 yr |
21 |
1.3 (0.7–2.4) |
|
|
≥10 yr |
57 |
1.3 (0.9–2.0) |
|
Reference |
Study Population |
Exposed Cases |
Estimated Relative Risk (95% CI) |
|
Steineck et al. 1990b |
254 male urothelial-cancer cases among residents of Stockholm, Sweden |
|
|
|
|
Occupation |
|
|
|
Railway |
8 |
0.4 (0.2–1.0) |
|
|
Petrol station and automobile repair |
17 |
1.3 (0.6–2.8) |
|
|
Agents (self-reported) |
|
|
|
|
Combustion gases from coal, coke, or wood |
53 |
1.0 (0.7–1.6) |
|
|
Tar or asphalt |
19 |
0.9 (0.5–1.7) |
|
|
Agents (industrial-hygiene integration of self-reports of occupation, industry, and specific exposures) |
|
|
|
|
Combustion gases from coal |
27 |
0.8 (0.5–1.4) |
|
|
Low annual dose |
na |
0.9 (0.3–2.2) |
|
|
Medium annual dose |
na |
0.8 (0.3–2.2) |
|
|
High annual dose |
na |
0.9 (0.4–1.9) |
|
|
Combustion gases from oil |
10 |
0.9 (0.4–2.3) |
|
|
Combustion gases from wood |
23 |
1.2 (0.6–2.3) |
|
|
Diesel exhausts |
25 |
1.7 (0.9–3.3) |
|
|
Low annual dose |
na |
1.3 (0.6–3.1) |
|
|
Medium annual dose |
na |
2.2 (0.7–6.6) |
|
|
High annual dose |
na |
2.9 (0.3–30.0) |
|
|
Petrol exhausts |
24 |
1.0 (0.5–1.9) |
|
|
Low annual dose |
na |
0.6 (0.3–1.3) |
|
|
Medium annual dose |
na |
1.4 (0.5–3.7) |
|
|
High annual dose |
na |
3.9 (0.4–35.5) |
|
|
Both diesel and petrol exhausts (moderate/high) |
7 |
7.1 (0.9–58.8) |
|
|
Steineck et al. 1989 |
10,123 male bladder-cancer cases (1961–1979) among men employed in 1 960 Swedish census—record-linkage approach, not adjusted for smoking (JEM used to derive exposure from census job, linked to Swedish Cancer Registry) |
|
|
|
|
Diesel exhausts |
332 |
0.98 (0.87–1.10) |
|
Gasoline exhausts |
567 |
0.95 (0.87–1.03) |
|
|
Combustion gases from oil |
88 |
1.17 (0.95–1.44) |
|
|
Combustion gases from coal |
112 |
1.19 (0.99–1.43) |
|
|
Soot from oil or coal |
19 |
1.28 (0.82–2.01) |
|
|
Combustion gases from wood |
72 |
1.16 (0.92–1.46) |
|
|
Soot from wood |
56 |
1.19 (0.91–1.54) |
|
|
Coal tar |
2 |
1.60 (0.40–6.29) |
|
|
NCI National Bladder Cancer Study (NBCS); occupational history from interview |
|
|
|
|
Silverman et al. 1986, 1989b |
2,100 bladder-cancer cases among white male residents of 10 US SEER locations |
|
|
|
|
Railroad workers (ever) |
57 |
1.3 (0.9–2.0) |
|
Mechanics (ever) |
353 |
1.2 (1.0–1.4) |
|
|
Motor-vehicle drivers (ever) |
556 |
1.2 (1.1–1.4) |
|
|
Motor-vehicle drivers vs those never holding exhaust-related occupation |
|
|
|
|
Truck driver or deliveryman (usual) |
99 |
1.5 (1.1–2.0) |
|
|
Truck driver or deliveryman (ever) |
488 |
1.3 (1.1–1.4) |
|
|
Duration (yr) |
|
p for trend <0.001 |
|
|
<5 |
208 |
1.1 |
|
|
Reference |
Study Population |
Exposed Cases |
Estimated Relative Risk (95% CI) |
|
|
5–9 |
102 |
1.3 |
|
10–14 |
58 |
1.7 |
|
|
15–24 |
59 |
2.2 |
|
|
25+ |
54 |
1.1 |
|
|
Taxicab driver or chauffeur (usual) |
10 |
6.3 (1.6–29.3) |
|
|
Taxicab driver or chauffeur (ever) |
77 |
1.6 (1.2–2.2) |
|
|
Duration (yr) |
|
p for trend=0.0 14 |
|
|
<5 |
44 |
1.9 |
|
|
5–9 |
14 |
1.0 |
|
|
10+ |
16 |
2.0 |
|
|
Bus driver (usual) |
9 |
1.5 (0.6–3.9) |
|
|
Bus driver (ever) |
49 |
1.3 (0.9–1.9) |
|
|
Duration (yr) |
|
p for trend, ns |
|
|
<5 |
21 |
1.3 |
|
|
5–9 |
11 |
1.2 |
|
|
10+ |
16 |
1.3 |
|
|
Silverman et al. 1989a |
126 bladder-cancer cases among nonwhite male residents of 10 US SEER locations |
|
|
|
|
Mechanics (ever) |
13 |
1.1 (0.5–2.5) |
|
Auto mechanic (ever) |
6 |
1.4 (0.4–4.4) |
|
|
Motor vehicle drivers (ever) |
40 |
1.0 (0.6–1.5) |
|
|
Taxicab driver or chauffer (ever) |
10 |
1.3 (0.5–3.2) |
|
|
Silverman et al. 1990 |
652 bladder-cancer cases among white female residents of 10 US SEER locations |
|
|
|
|
Motor vehicle drivers (ever) |
9 |
1.1 (0.4–3.0) |
|
Bonassi et al. 1989 |
121 male bladder-cancer cases among residents of Bormida Valley, Italy |
|
|
|
|
Auto mechanics |
3 |
1.84 (0.43–7.84) |
|
Truck drivers |
3 |
1.88 (0.44–8.00) |
|
|
PAHs (JEM-derived agent) |
|
|
|
|
Possible |
74 |
1.63 (0.95–2.83) |
|
|
Also adjusted for aromatic amine exposure |
|
1.05 (0.45–2.44) |
|
|
Definite |
25 |
2.20 (1.12–4.38) |
|
|
Also adjusted for aromatic amine exposure |
|
2.14 (0.82–5.60) |
|
|
Multicancer case-control study in Montreal, Canada |
|||
|
Siemiatycki et al. 1988 |
486 male bladder-cancer cases vs cancer controls Agents—ever exposed (industrial-hygiene-derived) |
|
|
|
|
Gasoline exhaust |
208 |
1.0 (0.9–1.1)a |
|
Diesel exhaust |
82 |
1.0 (0.8–1.2)a |
|
|
Jet-fuel exhaust |
1 |
0.2 (0.0–1.2)a |
|
|
Liquid-fuel combustion |
28 |
0.9 (0.7–1.2)a |
|
|
Coke combustion |
3 |
0.7 (0.2–2.5)a |
|
|
Natural-gas combustion |
22 |
1.6 (1.1–2.3)a, p<0.05 |
|
|
Siemiatycki et al. 1994 |
484 male bladder-cancer cases vs pooled cancer and population controls |
|
|
|
|
Industries |
|
|
|
Motor transport |
|
|
|
|
<10 yr |
34 |
1.9 (1.2–2.8) |
|
|
≥10 yr |
40 |
1.7 (1.2–2.5) |
|
TABLE 4.38 Kidney Cancer and Exposure to Fuels—Selected Epidemiologic Studies
|
Reference |
Study Population |
Exposed Cases |
Estimated Relative Risk (95% CI) |
|
Cohort Studies (not adjusted for smoking, unless otherwise noted) |
|||
|
Imperial Oil, Canada |
|
|
|
|
Lewis et al. 2000b |
Kidney-cancer (ICD-9 189.0–189.2) deaths in 1964–1994 among petroleum workers employed anytime during 1964–1983 |
|
|
|
|
Males |
41 |
0.96 (0.69–1.30) |
|
Refinery segment |
16 |
0.91 (0.52–1.48) |
|
|
Marketing and distribution segment |
15 |
1.14 (0.64–1.88) |
|
|
Females |
3 |
0.91 (0.19–2.67)a |
|
|
Lewis et al. 2003 |
Incident cases of kidney cancer in 1969–1994 among male petroleum workers hired in 1964–1994 |
15 |
1.00 (0.56–1.65) |
|
Exxon refineries in Louisiana, New Jersey, and Texas |
|
|
|
|
Shallenberger et al. 1992 |
Kidney-cancer (ICD-8 189) deaths in LA (1970–1982) |
18 |
1.92 (p<0.05) |
|
Hanis et al. 1982 |
Kidney-cancer (ICD-8 189) deaths in LA (1970–1977 |
9 |
1.55 (0.71–2.94) |
|
Gamble et al. 1996 |
Nested case-control study of 37 incident kidney cancer (ICD-8 189) cases (1970–1990) |
(32 dead and 5 alive) |
|
|
|
By duration of employment (adjusted for smoking) |
|
|
|
<25 yr |
10 |
1.0 |
|
|
25–32 yr |
9 |
1.34 (0.23–7.77) |
|
|
32–38 yr |
9 |
3.26 (0.27–39.72) |
|
|
≥38 yr |
9 |
4.08 (0.24–68.72) |
|
|
Poole et al. 1993 |
Nested case-control study of 100 RCC deaths among petroleum industry workers from 36 US locations |
|
|
|
|
Ever (vs never) exposed above background: |
|
|
|
Nonaromatic, liquid gasoline distillates |
87 |
1.00 (0.51–1.94) |
|
|
Aromatic hydrocarbons |
80 |
0.95 (0.50–1.80) |
|
|
Volatile hydrocarbons |
85 |
1.31 (0.72–2.39) |
|
|
Higher boiling hydrocarbons |
86 |
0.95 (0.49–1.84) |
|
|
PAHs |
76 |
0.69 (0.40–1.21) |
|
|
Wong et al. 1993 |
Kidney-cancer (ICD-8 189) deaths among US petroleum-distribution workers |
24 |
0.73 (0.47–1.09) |
|
|
Marine distribution workers |
12 |
0.84 (0.46–1.41) |
|
Land-based distribution workers |
12 |
0.65 (0.34–1.14) |
|
|
Total hydrocarbons (JEM-derived)—cumulative exposure |
|
|
|
|
<500 ppm-yr |
4 |
1.19 |
|
|
500–1,000 ppm-yr |
1 |
0.40 |
|
|
1,000–2,000 ppm-yr |
4 |
0.95 |
|
|
>2,000 ppm-yr |
3 |
0.37 |
|
|
Reference |
Study Population |
Exposed Cases |
Estimated Relative Risk (95% CI) |
|
Case-Control Studies (adjusted for smoking, unless otherwise noted) |
|||
|
Pesch et al. 2000a |
570 male RCC cases among residents of five regions in Germany |
|
|
|
|
Production and use of petroleum products (grouped over job tasks)—duration |
|
|
|
Medium |
9 |
0.5 (0.3–1.0) |
|
|
Long |
10 |
1.1 (0.3–1.1)b |
|
|
Very long |
8 |
1.3 (0.6–2.9) |
|
|
Mandel et al. 1995 |
1,050 male RCC cases in five countries pooled in International Renal Cell Cancer Study |
|
|
|
|
Oil refinery (industry) |
21 |
1.3 (0.6–2.4) |
|
Gas-station attendants (occupation) |
56 |
1.3 (0.9–1.9) |
|
|
Gasoline (self-reported agent) |
164 |
1.6 (1.2–2.0) |
|
|
1–5 yr |
56 |
1.6 (1.1–2.4) |
|
|
6–27 yr |
56 |
1.4 (0.9–2.1) |
|
|
28–62 yr |
52 |
1.6 (1.1–2.5) |
|
|
Jet fuel, heating oil, kerosene, or diesel fuel (self-reported agent) |
195 |
1.6 (1.3–2.1) |
|
|
1–9 yr |
49 |
1.5 (1.0–2.2) |
|
|
10–24 yr |
75 |
1.6 (1.1–2.3) |
|
|
25–60 yr |
71 |
1.9 (1.8–2.7) |
|
|
Partanen et al. 1991 |
338 RCC cases among residents of Finland (industrial-hygiene-coded agents) |
|
|
|
|
Diesel or fuel oils (not adjusted for smoking) |
21 |
1.20 (0.63–2.27) |
|
Gasoline (≥1 yr high or ≥5 yr low) (not adjusted for smoking, but all of following estimates are) |
39 |
1.72 (1.03–2.87) |
|
|
Level (ppm equivalent of benzene) |
|
|
|
|
0.1–0.19 |
4 |
0.63 (0.19–2.12) |
|
|
0.2–0.9 |
25 |
1.55 (0.83–2.91) |
|
|
1.0–2.0 |
10 |
7.39 (1.58–34.6) |
|
|
Duration (yr) |
|
|
|
|
5–11 |
13 |
1.39 (0.61–3.13) |
|
|
12–20 |
13 |
2.02 (0.83–4.90) |
|
|
21–51 |
13 |
1.58 (0.69–3.63) |
|
|
Cumulative exposure (ppm-yr) |
|
|
|
|
0.5–1.9 |
7 |
1.28 (0.45–3.65) |
|
|
2.0–13 |
23 |
1.39 (0.75–2.58) |
|
|
14–102 |
9 |
4.34 (1.15–16.4) |
|
|
Latency (yr) |
|
|
|
|
17–26 |
10 |
1.23 (0.51–2.96) |
|
|
27–33 |
17 |
2.82 (1.17–6.80) |
|
|
34–58 |
12 |
1.28 (0.56–2.98) |
|
|
Men only (<278, exact number not given) |
|
|
|
|
Either gasoline or diesel |
42 |
|
|
|
Diesel |
19c |
1.15 (0.60–2.20) |
|
|
Gasoline |
36c |
1.63 (0.97–2.75) |
|
|
Only gasoline |
23 |
2.05 (1.05–3.98) |
|
|
Reference |
Study Population |
Exposed Cases |
Estimated Relative Risk (95% CI) |
|
|
Only diesel |
6 |
0.68 (0.23–2.01) |
|
|
Both |
13 |
1.29 (0.55–3.02) |
|
Kadamani et al. 1989 |
210 RCC cases among patients at 23 hospitals in Oklahoma City and Tulsa, Oklahoma (not adjusted for smoking) |
|
|
|
|
68 women |
|
|
|
Any hydrocarbon exposure (industrial-hygiene-coded agent) |
28 |
0.7 (0.3–1.4) |
|
|
142 men |
|
|
|
|
Any hydrocarbon exposure (industrial-hygiene-coded agent) |
121 |
1.6 (0.8–3.2) |
|
|
Low |
29 |
1.3 (0.5–3.0) |
|
|
Moderate |
53 |
2.7 (1.2–6.5) |
|
|
High |
39 |
1.6 (0.7–3.6) |
|
|
Duration of hydrocarbon exposure (yr) |
|
|
|
|
1–15 |
35 |
1.2 (0.6–2.4) |
|
|
16–30 |
31 |
2.4 (1.0–6.2) |
|
|
>30 |
55 |
2.3 (1.0–5.2) |
|
|
Siemiatycki et al. 1987a |
181 kidney-cancer (ICD 189) cases in multi-cancer study among male residents of Montreal, Canada (1979–1985)—industrial-hygiene-coded agents |
|
|
|
|
Adjusted for age, socioeconomic status, ethnicity, and blue- vs white-collar jobs, in addition to smoking |
|
|
|
Crude oil |
2 |
1.2 (0.2–6.3)d |
|
|
Automotive gasoline |
24 |
1.2 (0.8–1.6)d |
|
|
Kerosene |
12 |
1.3 (0.8–2.1)d |
|
|
Diesel fuel |
10 |
1.4 (0.8–2.3)d |
|
|
Heating oil |
8 |
1.1 (0.6–2.1)d |
|
|
Logistic model with adjustment for all identified potential confounders |
|
|
|
|
Aviation gasoline |
7 |
3.1 (1.5–6.5)d |
|
|
Nonsubstantial |
1 |
1.5 (0.3–8.6)d |
|
|
Substantial |
6 |
3.9 (1.7–8.8)d |
|
|
Jet fuel |
7 |
3.1 (1.5–6.6)d |
|
|
Nonsubstantial |
1 |
2.1 (0.3–12.7)d |
|
|
Substantial |
6 |
3.4 (1.5–7.6)d |
|
|
McLaughlin et al. 1985 |
313 RCC cases among male residents of Minneapolis-St. Paul, Minnesota |
|
|
|
|
Petroleum-related (occupation—ever) |
116 |
1.0 (0.7–1.4) |
|
1–2 yr |
32 |
0.9 (0.5–1.6) |
|
|
3–10 yr |
39 |
1.0 (0.6–1.6) |
|
|
>10 yr |
45 |
1.1 (0.7–1.7) |
|
|
Gasoline station attendants (occupation) |
20 |
1.2 (0.6–2.3) |
|
|
1–2 yr |
8 |
0.9 (0.3–2.4) |
|
|
3–5 yr |
6 |
1.3 (0.3–4.5) |
|
|
>5 yr |
6 |
1.7 (0.4–6.5) |
|
|
NOTE: na=not available; RCC=renal-cell cancer. aRisk estimate and 95% CI calculated with standard methods from observed and expected numbers presented in original paper. |
|||
TABLE 4.39 Kidney Cancer and Exposure to Combustion Products—Selected Epidemiologic Studies
|
Reference |
Study Population |
Exposed Cases |
Estimated Relative Risk (95% CI) |
|
Cohort Study (not adjusted for smoking) |
|||
|
Boffetta et al. 2001 |
Kidney cancer [ICD-7 180] cases (1971–1989) among occupationally active residents of Sweden, 1960 and 1970 from data in Swedish Cancer-Environment Registry established by record linkage |
|
|
|
|
Diesel emissions (industrial-hygiene-coded agent from 1960 occupation and industry) |
|
|
|
Men |
2,243 |
1.06 (1.02–1.11) |
|
|
Women |
33 |
0.82 (0.57–1.16) |
|
|
Case-Control Studies (adjusted for smoking, unless otherwise noted) |
|||
|
Pesch et al. 2000a |
RCC cases among residents of five regions in Germany |
|
|
|
|
570 male RCC cases |
|
|
|
Railway brakemen, signalmen, and shunters (longest-held job, 3-digit occupation) |
5 |
6.2 (1.6–23.4) |
|
|
Motor-vehicle driver (occupation)—duration |
|
|
|
|
Medium |
27 |
0.9 (0.6–1.4) |
|
|
Long |
28 |
0.9 (0.6–1.4) |
|
|
Very long |
7 |
0.6 (0.3–1.4) |
|
|
Tar, pitch, and mineral oil—British JEM |
|
|
|
|
Medium |
86 |
1.1 (0.9–1.5) |
|
|
High |
96 |
1.2 (0.9–1.6) |
|
|
Substantial |
34 |
1.4 (0.9–2.1) |
|
|
PAHs |
|
|
|
|
British JEM |
|
|
|
|
Medium |
71 |
0.9 (0.7–1.2) |
|
|
High |
96 |
1.3 (1.0–1.6) |
|
|
Substantial |
32 |
1.2 (0.8–1.9) |
|
|
Task approach—JEM |
|
|
|
|
Medium |
80 |
0.9 (0.7–1.2) |
|
|
High |
67 |
0.8 (0.6–1.0) |
|
|
Substantial |
26 |
0.9 (0.6–1.4) |
|
|
365 female RCC cases |
|
|
|
|
Motor vehicle drivers (occupation)—duration |
|
|
|
|
Medium |
0 |
— |
|
|
Long |
1 |
0.9 (0.1–7.7) |
|
|
Very long |
1 |
1.9 (0.2–21.3) |
|
|
Tar, pitch, mineral oil—British JEM |
|
|
|
|
Medium |
15 |
1.0 (0.6–1.7) |
|
|
High |
16 |
1.2 (0.7–2.0) |
|
|
Substantial |
10 |
2.1 (1.0–4.5) |
|
|
PAHs—British JEM |
|
|
|
|
Medium |
17 |
1.1 (0.6–1.8) |
|
|
Reference |
Study Population |
Exposed Cases |
Estimated Relative Risk (95% CI) |
|
|
High |
21 |
1.5 (0.9–2.4) |
|
|
Substantial |
6 |
1.3 (0.5–3.3) |
|
Mandel et al. 1995 |
1,050 male RCC cases in five countries pooled in International Renal Cell Cancer Study |
|
|
|
|
Blast furnace and coke ovens (occupation) |
57 |
1.7 (1.1–2.7) |
|
Partanen et al. 1991 |
338 RCC cases (including at least 60 women) among residents of Finland; results from analyses on men only |
|
|
|
|
Transport and storage (industry) |
23 |
1.13 (0.63–2.02) |
|
Transportation (occupation) |
21 |
1.09 (0.59–2.00) |
|
|
PAHs (industrial-hygienist-coded agent) |
7 |
1.21 (0.43–3.45) |
|
|
Multicancer study among male residents of Montreal, Canada (1979–1985) |
|
|
|
|
Siemiatycki et al. 1988 |
181 kidney cancer (ICD 189) cases vs cancer controls |
|
|
|
|
Gasoline exhaust (industrial-hygienist-coded agent) |
80 |
1.2 (0.9–1.4)a |
|
Short, low |
15 |
1.5 (0.9–2.3)a |
|
|
Short, high |
7 |
0.7 (0.4–1.4)a |
|
|
Long, low |
24 |
1.1 (0.8–1.7)a |
|
|
Long, high |
34 |
1.4 (1.0–2.0)a |
|
|
Diesel exhaust (industrial-hygienist-coded agent) |
29 |
0.9 (0.7–1.3)a |
|
|
Jet-fuel exhaust (industrial-hygienist-coded agent) |
4 |
1.4 (0.5–3.9)a |
|
|
Liquid-fuel combustion (industrial-hygienist-coded agent) |
10 |
0.8 (0.5–1.4)a |
|
|
Coke combustion (industrial-hygienist-coded agent) |
1 |
0.6 (0.0–7.4)a |
|
|
Parent et al. 2000a |
142 RCC (ICD 189.0) cases (subset of cases in Siemiatycki et al. 1988) vs. pooled cancer and population controls |
|
|
|
|
Jet-fuel engine emissions (industrial-hygiene-coded agent) |
4 |
2.7 (0.9–8.1) |
|
Motor transport |
|
|
|
|
Industry |
14 |
1.0 (0.6–1.8) |
|
|
Occupation |
21 |
1.1 (0.7–1.8) |
|
|
Sharpe et al. 1989 |
164 RCC cases among residents of Montreal, Canada (men and women, but partition not given; about 65% of men were probably in Siemiatycki dataset) (not adjusted for smoking after smoking history found to be unrelated to cancer status)—self-reported agents |
|
|
|
|
Occupational exposures |
|
|
|
Tar or pitch |
9 |
9.29 (1.16–74.2) |
|
|
Burning coke |
6 |
2.00 (0.49–8.14) |
|
|
Burning coal |
17 |
2.54 (0.96–6.99) |
|
|
Any exposure to burning coal (in order of assumed increasing exposure) |
|
|
|
|
House with coal fuel but no handling |
53 |
1.07 (0.58–1.96) |
|
|
Domestic handling only |
56 |
1.41 (0.76–2.62) |
|
|
Reference |
Study Population |
Exposed Cases |
Estimated Relative Risk (95% CI) |
|
|
Occupational handling |
14 |
2.42 (0.81–7.46) |
|
|
Occupational and domestic handling |
3 |
8.45 (0.42–168.7) |
|
McLaughlin et al. 1987 |
7,405 male RCCs (1961–1979) employed in Sweden in 1960 from data in Swedish Cancer-Environment Registry established by record linkage (not adjusted for smoking) |
|
|
|
|
Transport and communication (industry) |
606 |
1.04 (0.96–1.13)b |
|
Automobile transportation |
65 |
1.33 (1.03–1.70)b |
|
|
Transport and communication (occupation) |
532 |
1.00 (0.92–1.09)b |
|
|
Craftsmen, production workers, and laborers (occupation)—code 8 |
965 |
0.94 (0.88–1.00)b |
|
|
Stationary engine and equipment operators—code 87 |
170 |
1.15 (0.99–1.34)b |
|
|
Stationary engine and equipment operators—code 88 |
233 |
0.93 (0.82–1.06)b |
|
|
NOTE: RCC=renal-cell cancer. a90% CIs reported in this paper. b95% CIs calculated with standard methods from risks and observed numbers presented in original paper. |
|||
TABLE 4.40 Non-Hodgkin’s Lymphoma and Exposure to Fuels—Selected Epidemiologic Studies
|
Reference |
Study Population |
Exposed Cases |
Estimated Relative Risk (95% CI) |
|
Cohort Studies |
|||
|
Imperial Oil, Canada |
|
|
|
|
Lewis et al. 2000b |
NHL (ICD-9 200, 202.0, 202.2) deaths (1964–1994) among petroleum workers employed anytime in 1 964–1983 |
|
|
|
|
Females |
5 |
0.82 (0.27–1.91) |
|
Males |
49 |
0.98 (0.72–1.29) |
|
|
Refinery segment |
22 |
1.09 (0.68–1.65) |
|
|
Marketing and distribution segment |
17 |
1.12 (0.65–1.79) |
|
|
Schnatter et al. 1996 |
Nested case-control study of 8 NHL deaths occurring before 1984 (with 5-yr lag); total hydrocarbons (ppm-yr) |
|
|
|
|
0.0–11.6 |
3 |
1.0 |
|
11.7–29.9 |
2 |
1.73 (0.02–137) |
|
|
30.0–549 |
2 |
0.52 (0.01–12.1) |
|
|
550–6,721 |
1 |
1.22 (0.01–137) |
|
|
Lewis et al. 2003 |
Incident NHL (ICD-9 200.0–200.2, 202.0, 202.2) cases (1969–1994) among male petroleum workers hired 1964–1994 |
|
|
|
|
Females |
7 |
1.19 (0.48–2.46) |
|
Males |
20 |
0.97 (0.59–1.50) |
|
|
Huebner et al. 2000 |
Incident NHL (ICD-9 200.0–200.2, 200.8, 202.0–202.2, 202.8–202.9) cases (1983–1994) among men working in 1970–1992 at Exxon facility in Baton |
|
|
|
|
Rouge, Louisiana |
22 |
1.06 (0.67–1.61) |
|
|
First employed |
|
|
|
Reference |
Study Population |
Exposed Cases |
Estimated Relative Risk (95% CI) |
|
|
≥1950 |
4 |
0.49 (0.13–1.26) |
|
<1950 |
18 |
1.44 (0.85–2.27) |
|
|
Latency ≥40 yr |
17 |
1.40 (0.82–2.24) |
|
|
Duration of employment |
|
|
|
|
20–39 yr |
13 |
1.27 (0.68–2.18) |
|
|
≥40 yr |
4 |
2.07 (0.56–5.31)a |
|
|
Jarvholm et al. 1997 |
Male workers in the Swedish petroleum industry ≥1 yr (qualitative industrial-hygienist-interpretation of personnel records) |
|
|
|
|
Incident cases of all types of lymphoma (ICD-9 200–202) |
9 |
0.93 (0.48–1.6)b |
|
With ≥20-yr latency |
3 |
0.65 (0.18–1.7)b |
|
|
With ≥10-yr duration |
2 |
0.48 (0.08–1.5)b |
|
|
Lagorio et al. 1994 |
NHL (ICD-9 200, 202) deaths among male filling-station attendants in Italy (exposure reconstruction using monitoring) |
|
|
|
|
At stations of all sizes |
3 |
1.73 (0.47–4.48)b |
|
|
At small stations |
2 |
1.71 (0.30–5.38)b |
|
Case-Control Studies |
|||
|
Blair et al. 1993 |
622 NHL cases among white male residents of Iowa and Minnesota; self-reported industry |
|
|
|
|
Petroleum refining |
5 |
1.6 (0.5–5.8) |
|
Franceschi et al. 1989 |
208 NHL cases among residents of northeast Italy; self-reported occupation |
|
|
|
|
Petrochemical worker |
15 |
1.83 (0.87–3.84) |
|
Siemiatycki et al. 1987a |
206 NHL cases vs cancer controls among male residents of Montreal, Canada; industrial-hygiene-derived agents |
|
|
|
|
Automotive gasoline |
20 |
0.8 (0.5–1.1)b |
|
Aviation gasoline |
1 |
0.4 (0.1–2.5)b |
|
|
Kerosene |
5 |
0.4 (0.2–0.7)b |
|
|
Jet fuel |
2 |
0.7 (0.2–3.2)b |
|
|
Diesel fuel |
10 |
1.1 (0.7–1.8)b |
|
|
Heating oil |
6 |
0.7 (0.4–1.3)b |
|
|
Crude oil |
1 |
0.5 (0.1–3.8)b |
|
|
NOTE: NHL=non-Hodgkin’s lymphoma. aRisk estimate and 95% CI calculated with standard methods from observed and expected numbers presented in original paper. b90% CIs reported in this paper. |
|||
TABLE 4.41 Non-Hodgkin’s Lymphoma and Exposure to Combustion Products—Selected Epidemiologic Studies
|
Reference |
Study Population |
Exposed Cases |
Estimated Relative Risk (95% CI) |
|
Cohort Study—Mortality |
|||
|
Boffetta et al. 1988 |
All lymphoma deaths (ICD-9 200–202) among male 40- to 79-yr-old enrollees of ACS Cancer Prevention Study at 2-yr followup |
|
|
|
|
Diesel-engine exhaust (self-reported agent) |
20 |
0.92 |
|
Case-Control Studies |
|||
|
Costantini et al. 2001 |
811 NHL (ICD-9 200, 202) and CLL (ICD-9 204.1) cases among men in 12 areas of Italy; occupation (not smoking-adjusted) |
|
|
|
|
Transport operators (occupation) |
74 |
0.9 (0.7–1.3) |
|
Mao et al. 2000 |
764 male and 705 female incident NHL cases from Canada’s National Enhanced Cancer Surveillance System in eight provinces (self-reported exposures on mailed questionnaire) |
|
|
|
|
Coal tar, soot, pitch, creosote, or asphalt |
|
|
|
Men |
122 |
1.2 (0.9–1.5) |
|
|
Women |
19 |
1.3 (0.7–2.3) |
|
|
Mineral, cutting, or lubricating oil |
|
|
|
|
Men |
177 |
1.3 (1.0–1.5) |
|
|
Women |
14 |
0.8 (0.4–1.4) |
|
|
Blair et al. 1993 |
622 NHL cases among white male residents of Iowa and Minnesota |
|
|
|
|
Transportation by air (industry) |
7 |
1.8 (0.6–5.5) |
|
Air transport on certified carriers |
4 |
3.1 (0.6–16.9) |
|
|
Oils and greases (JEM-derived agent) |
280 |
1.1 (0.9–1.4) |
|
|
Lower intensity |
168 |
1.1 (0.8–1.4) |
|
|
Higher intensity |
112 |
1.2 (0.9–1.7) |
|
|
Gasoline and diesel exhausts (JEM-derived agent) |
265 |
1.0 (0.8–1.3) |
|
|
Lower intensity |
230 |
1.0 (0.8–1.2) |
|
|
Higher intensity |
35 |
1.1 (0.7–1.7) |
|
|
Asphalt and creosote (JEM-derived agent) |
53 |
1.0 (0.7–1.5) |
|
|
Lower intensity |
49 |
1.0 (0.7–1.5) |
|
|
Higher intensity |
4 |
1.1 (0.3–4.0) |
|
|
Siemiatycki et al. 1988 |
206 NHL cases vs cancer controls among male residents of Montreal, Canada |
|
|
|
|
Gasoline exhaust (industrial-hygienist-coded agent) |
83 |
0.9 (0.8–1.1)a |
|
Diesel exhaust (industrial-hygienist-coded agent) |
29 |
0.7 (0.5–1.0)a |
|
|
Jet-fuel exhaust (industrial-hygienist-coded agent) |
4 |
1.7 (0.5–5.2)a |
|
|
Liquid-fuel combustion (industrial-hygienist-coded agent) |
11 |
0.8 (0.5–1.3)a |
|
|
Coke combustion (industrial-hygienist-coded agent) |
2 |
1.4 (0.3–7.3)a |
|
|
Decoufle and |
Male lymphoma cases of all types among patients at |
|
|
TABLE 4.42 Hodgkin’s Disease and Exposure to Fuels—Selected Epidemiologic Studies
|
Reference |
Study Population |
Exposed Cases |
Estimated Relative Risk (95% CI) |
|
Cohort Studies |
|||
|
Imperial Oil, Canada |
|
|
|
|
Lewis et al. 2000b |
HD (ICD-9 201) deaths (1964–1994) among petroleum workers employed any time during 1964–1983 |
|
|
|
|
Females |
1 |
0.79 (0.02–4.42)a |
|
Males |
7 |
0.68 (0.28–1.41) |
|
|
Refinery segment |
1 |
0.25 (0.01–1.41)a |
|
|
Marketing and distribution segment |
3 |
0.97 (0.20–2.83)a |
|
|
Lewis et al. 2003 |
Incident HD (ICD-9 201) cases (1969–1994) among male petroleum workers hired in 1964–1994 |
|
|
|
|
Females |
3 |
0.90 (0.19–2.63)a |
|
|
Males |
11 |
1.05 (0.52–1.88) |
|
Huebner et al. 2000 |
Incident HD (ICD-9 201) cases (1983–1994) among men working in 1970–1992 at Exxon facility in Baton Rouge, Louisiana |
4 |
1.54 (0.42–3.95)a |
|
Consonni et al. 1999 |
Oil-refinery workers in Milan vicinity, Italy |
2 |
1.51 (0.17–5.44) |
|
Jarvholm et al. 1997 |
Male workers in the Swedish petroleum industry ≥1 yr (qualitative industrial-hygienist-interpretation of personnel records) |
|
|
|
|
Incident cases of all types of lymphoma (ICD 200–202) |
9 |
0.93 (0.48–1.6)b |
|
With ≥20-yr latency |
3 |
0.65 (0.18–1.7)b |
|
|
With ≥10-yr duration |
2 |
0.48 (0.08–1.5)b |
|
|
aRisk estimates and 95% CI were calculated with standard methods from observed and expected numbers presented in original paper. b90% CIs reported in this paper. |
TABLE 4.43 Hodgkin’s Disease and Exposure to Combustion Products—Selected Epidemiologic Studies
TABLE 4.44 Multiple Myeloma and Exposure to Fuels—Selected Epidemiologic Studies
|
Reference |
Study Population |
Exposed Cases |
Estimated Relative Risk (95% CI) |
|
Cohort Studies |
|||
|
Imperial Oil, Canada |
|
|
|
|
Lewis et al. 2000b |
Multiple myeloma (ICD-9 203) deaths (1964–1994) among petroleum workers employed any time in 1964–1983 |
|
|
|
|
Females |
2 |
0.71 (0.09–2.58)a |
|
Males |
30 |
1.10 (0.75–1.58) |
|
|
Refinery segment |
8 |
0.70 (0.30–1.37) |
|
|
Marketing and distribution segment |
16 |
1.94 (1.11–3.15) |
|
|
Duration |
|
|
|
|
Reference |
Study Population |
Exposed Cases |
Estimated Relative Risk (95% CI) |
|
|
<25 yr |
4 |
1.88 (0.51–4.81)a |
|
25–34 yr |
10 |
3.06 (1.47–5.63) |
|
|
≥35 yr |
2 |
0.82 (0.10–2.96)a |
|
|
Schnatter et al. 1996 |
Nested case-control study of seven multiple myeloma deaths occurring before 1984 (with 5-yr lag) |
|
|
|
|
Total hydrocarbons (ppm-yr) |
|
|
|
0.0–29.9 |
3 |
1.0 |
|
|
30.0–549 |
1 |
1.41 (0.02–118) |
|
|
550–6,721 |
3 |
0.86 (0.10–7.48) |
|
|
Lewis et al. 2003 |
Incident multiple myeloma (ICD-9 203.0) cases (1969–1994) among male petroleum workers hired in 1964–1994 |
3 |
0.89 (0.17–2.40)a |
|
Huebner et al. 2000 |
Incident multiple myeloma (ICD-9 203.0) cases (1983–1994) among men working in 1970–1992 at Exxon facility in Baton Rouge, Louisiana |
9 |
1.39 (0.64–2.64) |
|
US land-based oil-distribution workers |
|
|
|
|
Wong et al. 1993 |
Deaths (1946–1989) from cancers of “other lymphatic tissue” (ICD-8 202–203, 208) |
18 |
0.92 (0.54–1.45) |
|
|
Total hydrocarbon exposure (ppm-yr) (JEM-derived) |
|
|
|
<500 |
4 |
1.12, ns |
|
|
500–1,000 |
2 |
0.76 |
|
|
1,000–2,000 |
4 |
0.90 |
|
|
≥2,000 |
8 |
0.90 |
|
|
Wong et al. 1999 |
Nested case-control study of 11 multiple myeloma (ICD-8 203) deaths |
|
|
|
|
Job (company records, ever vs never) |
|
|
|
Plantmen |
na |
0.55 (0.15–2.10) |
|
|
Warehousemen |
na |
1.82 (0.32–10.4) |
|
|
Clerks and office workers |
na |
0.29 (0.04–2.28) |
|
|
Foremen and supervisors |
na |
1.92 (0.43–8.59) |
|
|
Case-Control Studies |
|||
|
Multiple myeloma cases from Danish Cancer Registry (1970–1984) |
|
|
|
|
Heineman et al. 1992 |
1,098 male multiple myeloma cases |
|
|
|
Industry, ever (from Danish Pension Fund) |
|
|
|
|
|
Wholesale trade in fuel, oil, or gas |
12 |
0.8 (0.4–1.6) |
|
Industrial-hygiene-derived exposures |
|
|
|
|
Gasoline |
|
|
|
|
Possible exposure |
146 |
1.2 (1.0–1.5) |
|
|
1 months-5 yr |
48 |
1.3 (0.9–1.9) |
|
|
≥5 yr |
85 |
1.2 (0.9–1.5) |
|
|
Probable exposure |
41 |
1.4 (0.9–2.1) |
|
|
1 months-5 yr |
14 |
1.5 (0.8–2.9) |
|
|
≥5 yr |
24 |
1.4 (0.9–2.4) |
|
|
Oil products |
|
|
|
TABLE 4.45 Multiple Myeloma and Exposure to Combustion Products—Selected Epidemiologic Studies
|
Reference |
Study Population |
Exposed Cases |
Estimated Relative Risk (95% CI) |
|
Nested Case-Control Studies |
|||
|
Lee et al. 2003 |
466 male multiple myeloma cases diagnosed 1971–1999 among Swedish construction workers |
|
|
|
|
JEM-derived agents |
|
|
|
Diesel exhaust (ever) |
79 |
1.3 (1.00–1.77) |
|
|
Low |
52 |
1.4 (0.99–1.92) |
|
|
Medium |
10 |
1.1 (0.56–2.04) |
|
|
High |
17 |
1.4 (0.77–2.59) |
|
|
Asphalt (ever) |
6 |
0.8 (0.35–1.85) |
|
|
Wong et al. 1999 |
11 multiple myeloma deaths in nested case-control study of cohort of land-based US distribution workers |
|
|
|
Reference |
Study Population |
Exposed Cases |
Estimated Relative Risk (95% CI) |
|
|
(Wong et al. 1993, which presented no separate results for multiple myeloma) |
|
|
|
Job (company records-ever vs never) |
|
|
|
|
Mechanic |
na |
0.45 (0.05–3.81) |
|
|
Loader |
na |
1.00 (0.11–9.51) |
|
|
Driver |
na |
0.91 (0.21–3.96) |
|
|
Boffetta et al. 1989 |
128 multiple myeloma deaths among cancer-free enrollees in ACS Cancer Prevention Study II cohort during 4-yr followup |
|
|
|
|
Agents (self-report) |
|
|
|
Diesel exhaust |
14 |
1.4 (0.7–2.7) |
|
|
Gasoline exhaust |
14 |
0.9 (0.5–1.6) |
|
|
Coal tar, pitch, or asphalt |
4 |
1.7 (0.5–5.6) |
|
|
Main occupation (self-report) |
|
|
|
|
Truck driver |
3 |
2.8 (0.5–16.1) |
|
|
Railroad worker |
3 |
7.1 (1.2–43.6) |
|
|
Case-Control Studies |
|||
|
Costantini et al. 2001 |
133 multiple myeloma cases among men in 12 areas of Italy |
|
|
|
|
Transport operators (self-reported occupation) |
7 |
0.5 (0.2–1.1) |
|
Multiple myeloma cases from Danish Cancer Registry (1970–1984) |
|
|
|
|
Heineman et al. 1992 |
1,098 male multiple myeloma cases |
|
|
|
|
Industry, ever (from Danish Pension Fund) |
|
|
|
Transportation |
100 |
1.3 (1.0–1.6) |
|
|
1 month-5 yr |
41 |
1.1 (0.8–1.6) |
|
|
≥5 yr |
59 |
1.2 (0.9–1.6) |
|
|
Industrial-hygiene-derived exposures |
|
|
|
|
Tar, asphalt, or soot |
|
|
|
|
Possible exposure |
49 |
1.1 (0.8–1.6) |
|
|
Probable exposure |
17 |
0.6 (0.3–1.0) |
|
|
Engine exhaust |
|
|
|
|
Possible exposure |
|
|
|
|
1 month-5 yr |
52 |
1.5 (1.0–2.1) |
|
|
≥5 yr |
76 |
1.3 (1.0–1.7) |
|
|
Probable exposure |
|
|
|
|
1 month-5 yr |
25 |
1.4 (0.9–2.4) |
|
|
≥5 yr |
52 |
1.3 (0.9–1.8) |
|
|
Pottern et al. 1992 |
363 female multiple cases employed after 1964 |
|
|
|
|
Industry, ever (from Danish Pension Fund) |
|
|
|
Transportation |
13 |
1.0 (0.5–1.9) |
|
|
Industrial-hygiene-derived exposures |
|
|
|
|
Exhaust gases |
|
|
|
TABLE 4.46 Leukemias and Exposure to Combustion Products—Selected Epidemiologic Studies
|
Reference |
Study Population |
Exposed Cases |
Estimated Relative Risk (95% CI) |
|
Cohort Study |
|||
|
Boffetta et al. 1988 |
All leukemia deaths (ICD-9 204–208) occurring during 2-yr followup in cohort of 62,800 men 40–79 yr old at enrollment in ACS Cancer Prevention Study with self-reported exposure to diesel engine exhaust; expectations based on experience of 307,143 nonexposed counterparts |
17 |
1.29, ns |
|
Nested Case-Control Study |
|||
|
Wong et al. 1999 |
Nested case-control study on cohort of land-based US distribution workers (Wong et al. 1993) Jobs from company records (ever vs never) |
|
|
|
|
Total leukemia (ICD-8 204–207) deaths |
35 |
|
|
Mechanic |
na |
0.83 (0.30–2.34) |
|
|
Loader |
na |
0.79 (0.09–6.82) |
|
|
Drivers |
na |
0.77 (0.35–1.71) |
|
|
AML (ICD-8 205.0) |
13 |
|
|
|
Mechanic |
na |
0.91 (0.17–4.80) |
|
|
Loader |
0 |
– |
|
|
Drivers |
na |
0.42 (0.13–1.44) |
|
TABLE 4.47 Myelodysplastic Syndromes and Exposure to Fuels—Selected Epidemiologic Studies
|
Reference |
Study Population |
Exposed Cases |
Estimated Relative Risk (95% CI) |
|
Case-Control Studies (none adjusted for smoking) |
|||
|
Nisse et al. 2001 |
204 MDS cases among residents of northern France; industrial-hygiene-derived agents |
|
|
|
|
Petrol |
15 |
2.5 (0.9–7.7) |
|
Oil |
44 |
4.2 (2.0–9.9) |
|
|
West et al. 1995 |
400 MDS cases among residents of three regions in UK; industrial-hygiene-derived agents |
|
|
|
|
Petroleum products (≥low intensity) |
203 |
1.09 (0.79–1.50)a |
|
Diesels and petrols (≥low intensity) |
123 |
1.01 (0.72–1.44)a |
|
|
>50 hr (≥medium intensity) |
na |
1.02 (0.67–1.56)a |
|
|
>2,500 hr (≥medium intensity) |
na |
1.09 (0.66–1.81)a |
|
|
Reference |
Study Population |
Exposed Cases |
Estimated Relative Risk (95% CI) |
|
|
Oils and greases (≥low intensity) |
123 |
1.29 (0.88–1.89) |
|
>50 hr (≥medium intensity) |
na |
0.92 (0.60–1.40)a |
|
|
>2,500 hr (≥medium intensity) |
na |
1.22 (0.77–1.95)a |
|
|
Farrow et al. 1989 |
63 MDS cases among residents of Wales; industrial-hygiene-derived agents; pilot for and likely subset of sample in West et al. 1995 |
|
|
|
|
Petrol-diesel liquids |
29 |
2.99 (1.29–6.98)a |
|
|
Petrol-diesel fumes |
35 |
2.17 (1.00–4.74)a |
|
NOTE: na=not available; ns=risk estimate greater than unity not statistically significant at 0.05 level. aUnadjusted ORs and 95% CIs calculated with standard methods from observed numbers presented in original paper. |
|||
TABLE 4.48 Myelodysplastic Syndromes and Exposure to Combustion Products—Selected Epidemiologic Studies
|
Reference |
Study Population |
Exposed Cases |
Estimated Relative Risk (95% CI) |
|
Case-Control Studies (none adjusted for smoking) |
|||
|
Nisse et al. 2001 |
204 MDS cases among residents of northern France |
|
|
|
|
Industrial-hygiene-derived agents |
|
|
|
Exhaust gases |
33 |
1.0 (0.5–1.9) |
|
|
PAHs |
17 |
1.8 (0.7–4.6) |
|
|
Machine operator (occupation, ≥6 mo) |
na |
2.8 (1.3–6.4) |
|
|
West et al. 1995 |
400 MDS cases among residents of three regions in UK |
|
|
|
|
Industrial-hygiene-derived agents |
|
|
|
Exhaust gases (≥low intensity) |
79 |
1.26 (0.86–1.86) |
|
|
>50 hr (≥medium intensity) |
na |
1.72 (0.93–3.20) |
|
|
>2,500 hr (≥medium intensity) |
na |
1.57 (0.77–3.23) |
|
|
Coal tar (≥low intensity) |
35 |
1.07 (0.62–1.84)a |
|
|
>50 hr (≥medium intensity) |
na |
1.00 (0.47–2.14)a |
|
|
>2,500 hr (≥medium intensity) |
na |
0.88 (0.27–2.76)a |
|
|
Transport operating, material moving and storing, and so on (occupation, ≥6 mo) |
32 |
0.78 (0.46–1.31)a |
|
|
NOTE: na=not available; ns=risk estimate greater than unity not statistically significant at 0.05 level. aUnadjusted ORs and 95% CIs calculated with standard methods from observed numbers presented in original paper. |
|||
REFERENCES
Abbey DE, Nishino N, McDonnell WF, Burchette RJ, Knutsen SF, Beeson WL, Yang JX. 1999. Long-term inhalable particles and other air pollutants related to mortality in nonsmokers. American Journal of Respiratory and Critical Care Medicine 159(2):373–382.
ACS (American Cancer Society). 2003a. ACS: Laryngeal andHypopharyngeal Cancer Detailed Guide. [Online]. Available: http://www.cancer.org/docroot/CRI/content/CRI_2_4_7×_CRC_Laryngeal_and_Hypopharyngeal_Cancer_PDF.asp [accessed January 28, 2004].
ACS. 2003b. ACS: Nasal Cavity andParanasal Cancer. [Online]. Available: http://www.cancer.org/docroot/CRI/CRI_2_3×.asp?dt=75 [accessed January 28, 2004].
ACS. 2003c. ACS: Nasospharyngeal Cancer. [Online]. Available: http://www.cancer.org/docroot/CRI/CRI_2_3×.asp?dt=17 [accessed January 28, 2004].
ACS. 2003d. ACS: Oral Cavity and Oropharyngeal Cancer Detailed Guide. [Online]. Available: http://www.cancer.org/docroot/CRI/content/CRI_2_4_7×_CRC_Oral_Cavity_and_Oropharyngeal_Cancer_PDF.asp [accessed January 28, 2004].
ACS. 2003e. ACS: What Are the Risk Factors for Breast Cancer? [Online]. Available: http://www.cancer.org/docroot/CRI/content/CRI_2_4_2X_What_are_the_risk_factors_for_breast_cancer_5.asp?sitearea= [accessed June 9, 2004].
ACS. 2003f. ACS: What Are the Risk Factors for Liver Cancer? [Online]. Available: http://www.cancer.org/docroot/CRI/content/CRI_2_4_2X_What_are_the_risk_factors_for_liver_cancer_25.asp?sitearea= [accessed June 4, 2004].
ACS. 2003g. Cancer Facts and Figures 2003. [Online]. Available: http://www.cancer.org/docroot/STT/content/STT_1x_Cancer_Facts_Figures_2003.asp [accessed January 14, 2003].
ACS. 2004a. ACS: All About Myelodysplastic Syndrome. [Online]. Available: http://www.cancer.org/docroot/cri/cri_2×.asp [accessed September 7, 2004].
ACS. 2004b. ACS: Detailed Guide: Cervical Cancer. [Online]. Available: http://www.cancer.org/docroot/CRI/CRI_2_3×.asp?rnav=cridg&dt=8 [accessed June 10, 2004].
ACS. 2004c. ACS: Detailed Guide: Endometrial Cancer. [Online]. Available: http://www.cancer.org/docroot/CRI/CRI_2_3×.asp?dt=11 [accessed June 10, 2004].
ACS. 2004d. ACS: Detailed Guide: Eye Cancer. [Online]. Available: http://www.cancer.org/docroot/CRI/content/CRI_2_4_1x_What_is_eye_cancer_74.asp?rnav=cri [accessed April 22, 2004].
ACS. 2004e. ACS: Detailed Guide: Leukemia—Acute Lymphocytic (ALL). [Online]. Available: http://www.cancer.org/docroot/CRI/CRI_2_3×.asp?dt=57 [accessed November 5, 2004].
ACS. 2004f. ACS: Detailed Guide: Leukemia—Acute Myeloid (AML). [Online]. Available: http://www.cancer.org/docroot/CRI/CRI_2_3×.asp?dt=82 [accessed November 5, 2004].
ACS. 2004g. ACS: Detailed Guide: Leukemia—Chronic Lymphocytic (CLL). [Online]. Available: http://www.cancer.org/docroot/CRI/CRI_2_3×.asp?dt=62 [accessed November 5, 2004].
ACS. 2004h. ACS: Detailed Guide: Leukemia—Chronic Myeloid (CML). [Online]. Available: http://www.cancer.org/docroot/CRI/CRI_2_3×.asp?dt=83 [accessed November 5, 2004].
ACS. 2004i. ACS: Detailed Guide: Ovarian Cancer. [Online]. Available: http://www.cancer.org/docroot/CRI/CRI_2_3×.asp?dt=33 [accessed June 10, 2004].
ACS. 2004j. ACS: Detailed Guide: Testicular Cancer. [Online]. Available: http://www.cancer.org/docroot/CRI/CRI_2_3×.asp?dt=41 [accessed June 10, 2004].
ACS. 2004k. ACS: Hodgkin’s Disease Detailed Guide. [Online]. Available at: http://www.cancer.org/docroot/CRI/content/CRI_2_4_7×_CRC_Hodgkin_Disease_PDF.asp [accessed February 10, 2004].
ACS. 2004l. ACS: Multiple Myeloma Detailed Guide. [Online]. Available: http://www.cancer.org/docroot/CRI/content/CRI_2_4_7×_CRC_Multiple_Myeloma_PDF.asp [accessed February 10, 2004].
ACS. 2004m. ACS: Overview: Pancreatic Cancer. [Online]. Available: http://www.cancer.org/docroot/CRI/CRI_2_1x.asp?dt=34 [accessed January 30, 2004].
ACS. 2004n. ACS: The Different Types of Leukemia. [Online]. Available: http://www.cancer.org/docroot/CRI/content/CRI_2_2_1X_The_different_types_of_leukemia_57.asp?sitearea= [accessed November 5, 2004].
ACS. 2004o. ACS: What Is Bladder Cancer? [Online]. Available: http://www.cancer.org/docroot/CRI/content/CRI_2_4_1X_What_is_bladder_cancer_44.asp?sitearea= [accessed February 4, 2004].
ACS. 2004p. ACS: What Is Colorectal Cancer? [Online]. Available: http://www.cancer.org/docroot/CRI/content/CRI_2_2_1X_What_is_colon_and_rectum_cancer_10.asp?sitearea= [accessed January 30, 2004].
ACS. 2004q. ACS: What Is Esophagus Cancer? [Online]. Available: http://www.cancer.org/docroot/CRI/content/CRI_2_2_1X_What_is_esophagus_cancer_12.asp?sitearea= [accessed January 30, 2004].
ACS. 2004r. ACS: What Is Kidney Cancer (Renal Cell Carcinoma)? [Online]. Available: http://www.cancer.org/docroot/CRI/content/CRI_2_4_1X_What_is_kidney_cancer_22.asp?sitearea= [accessed February 4, 2004].
ACS. 2004s. ACS: What Is Lung Cancer? [Online]. Available: http://www.cancer.org/docroot/CRI/content/CRI_2_2_1X_What_is_lung_cancer_26.asp?sitearea= [accessed February 4, 2004].
ACS. 2004t. ACS: What Is Male Breast Cancer? [Online]. Available: http://www.cancer.org/docroot/CRI/content/CRI_2_4_1X_What_is_male_breast_cancer_28.asp?sitearea= [accessed February 4, 2004].
ACS. 2004u. ACS: What Is Melanoma Skin Cancer? [Online]. Available: http://www.cancer.org/docroot/CRI/content/CRI_2_2_1X_What_is_melanoma_skin_cancer_50.asp?sitearea= [accessed February 4, 2004].
ACS. 2004v. ACS: What Is Prostate Cancer? [Online]. Available: http://www.cancer.org/docroot/CRI/content/CRI_2_4_1X_What_is_prostate_cancer_36.asp?sitearea= [accessed February 4, 2004].
ACS. 2004w. ACS: What Is Stomach Cancer? [Online]. Available: http://www.cancer.org/docroot/CRI/content/CRI_2_2_1X_What_is_stomach_cancer_40.asp?sitearea= [accessed January 30, 2004].
Ahrens W, Jockel KH, Patzak W, Elsner G. 1991. Alcohol, smoking, and occupational factors in cancer of the larynx: A case-control study. American Journal of Industrial Medicine 20(4):477–493.
Ajani UA, Seddon JM, Hsieh CC, Egan KM, Albert DM, Gragoudas ES. 1992. Occupation and risk of uveal melanoma. An exploratory study. Cancer 70(12):2891–2900.
Alarie Y, Ulrich CE, Busey WM, Krumm AA, MacFarland HN. 1972. Long-term continuous exposure to sulfur dioxide in cynomolgus monkeys. Archives of Environmental Health 24(2):115–128.
Alfredsson L, Hammar N, Hogstedt C. 1993. Incidence of myocardial infarction and mortality from specific causes among bus drivers in Sweden. International Journal of Epidemiology 22(1):57–61.
Alguacil J, Kauppinen T, Porta M, Partanen T, Malats N, Kogevinas M, Benavides FG, Obiols J, Bernal F, Rifa J, Carrato A. 2000. Risk of pancreatic cancer and occupational exposures in Spain. Annals of Occupational Hygiene 44(5):391–403.
Armstrong RW, Armstrong MJ. 1983. Environmental risk factors and nasopharyngeal carcinoma in Selangor, Malaysia: A cross-ethnic perspective. Ecology of Disease 2(3):185–198.
Armstrong RW, Imrey PB, Lye MS, Armstrong MJ, Yu MC, Sani S. 2000. Nasopharyngeal carcinoma in Malaysian Chinese: Occupational exposures to particles, formaldehyde and heat. International Journal of Epidemiology 29(6):991–998.
Aronson KJ, Siemiatycki J, Dewar R, Gerin M. 1996. Occupational risk factors for prostate cancer: Results from a case-control study in Montreal, Quebec, Canada. American Journal of Epidemiology 143(4):363–373.
Asal NR, Geyer JR, Risser DR, Lee ET, Kadamani S, Cherng N. 1988a. Risk factors in renal cell carcinoma. II. Medical history, occupation, multivariate analysis, and conclusions. Cancer Detection and Prevention 13(3–4):263–279.
Asal NR, Risser DR, Kadamani S, Geyer JR, Lee ET, Cherng N. 1988b. Risk factors in renal cell carcinoma: I. Methodology, demographics, tobacco, beverage use, and obesity. Cancer Detection and Prevention 11(3–6):359–377.
ATSDR (Agency for Toxic Substances and Disease Registry). 1995. Toxicological Profile for Poly cyclic Aromatic Hydrocarbons (PAHs) (Update). Atlanta, GA: US Department of Health and Human Services, Public Health Service, ATSDR
Auperin A, Benhamou S, Ory-Paoletti C, Flamant R. 1994. Occupational risk factors for renal cell carcinoma: A case-control study. Occupational and Environmental Medicine 51(6):426–428.
Barbone F, Bovenzi M, Cavallieri F, Stanta G. 1995. Air pollution and lung cancer in Trieste, Italy. American Journal of Epidemiology 141(12):1161–1169.
Baris D, Garrity TJ, Telles JL, Heineman EF, Olshan A, Zahm SH. 2001. Cohort mortality study of Philadelphia firefighters. American Journal of Industrial Medicine 39(5):463–476.
Beeson WL, Abbey DE, Knutsen SF. 1998. Long-term concentrations of ambient air pollutants and incident lung cancer in California adults: Results from the AHSMOG study. Environmental Health Perspectives 106(12):813–823.
Benhamou S, Benhamou E, Flamant R. 1988. Occupational risk factors of lung cancer in a French case-control study. British Journal of Industrial Medicine 45(4):231–233.
Berrino F, Richiardi L, Boffetta P, Esteve J, Belletti I, Raymond L, Troschel L, Pisani P, Zubiri L, Ascunce N, Guberan E, Tuyns A, Terracini B, Merletti F, Arduini L, Baldasseroni A, Continenza D, Crosignani P, Ferrario F, Macaluso M, Magnani C, Merler E. 2003. Occupation and larynx and hypopharynx cancer: A job-exposure matrix approach in an international case-control study in France, Italy, Spain and Switzerland. Cancer Causes and Control 14(3):213–223.
Bertazzi PA, Pesatori AC, Zocchetti C, Latocca R. 1989. Mortality study of cancer risk among oil refinery workers. International Archives of Occupational and Environmental Health 61(4):261–270.
Biggeri A, Barbone F, Lagazio C, Bovenzi M, Stanta G. 1996. Air pollution and lung cancer in Trieste, Italy: Spatial analysis of risk as a function of distance from sources. Environmental Health Perspectives 104(7):750–754.
Blair A, Linos A, Stewart PA, Burmeister LF, Gibson R, Everett G, Schuman L, Cantor KP. 1993. Evaluation of risks for non-Hodgkin’s lymphoma by occupation and industry exposures from a case-control study. American Journal of Industrial Medicine 23(2):301–312.
Boffetta P, Dosemeci M, Gridley G, Bath H, Moradi T, Silverman D. 2001. Occupational exposure to diesel engine emissions and risk of cancer in Swedish men and women. Cancer Causes & Control 12(4):365–374.
Boffetta P, Harris RE, Wynder EL. 1990. Case-control study on occupational exposure to diesel exhaust and lung cancer risk. American Journal of Industrial Medicine 17(5):577–591.
Boffetta P, Richiardi L, Berino F, Esteve J, Pisani P, Crosignani P, Raymond L, Zubire L, Del Moral A, Lehmann W, Donato F, Terracini B, Tuyns A, Merletti F. 2003. Occupation and larynx and hypopharynx cancer: An international case-control study in France, Italy, Spain, and Switzerland. Cancer Causes & Control 14(3):203–212.
Boffetta P, Stellman SD, Garfinkel L. 1988. Diesel exhaust exposure and mortality among males in the American Cancer Society prospective study. American Journal of Industrial Medicine 14(4):403–415.
Boffetta P, Stellman SD, Garfinkel L. 1989. A case-control study of multiple myeloma nested in the American Cancer Society prospective study. International Journal of Cancer 43(4):554–559.
Bonassi S, Merlo F, Pearce N, Puntoni R. 1989. Bladder cancer and occupational exposure to polycyclic aromatic hydrocarbons. International Journal of Cancer 44(4):648–651.
Borgia P, Forastiere F, Rapiti E, Rizzelli R, Magliola ME, Perucci CA, Axelson O. 1994. Mortality among taxi drivers in Rome: A cohort study. American Journal of Industrial Medicine 25(4):507–517.
Bovenzi M, Stanta G, Antiga G, Peruzzo P, Cavallieri F. 1993. Occupational exposure and lung cancer risk in a coastal area of northeastern Italy. International Archives of Occupational and Environmental Health 65(1):35–41.
Brown LM, Mason TJ, Williams Pickle L, Stewart PA, Buffler PA, Burau K, Ziegler RG, Fraumeni Jr JF. 1988. Occupational risk factors for laryngeal cancer on the Texas Gulf Coast. Cancer Research 48(7):1960–1964.
Brownson RC. 1988. A case-control study of renal cell carcinoma in relation to occupation, smoking, and alcohol consumption. Archives of Environmental Health 43(3):238–241.
Brownson RC, Chang JC, Davis JR. 1987. Occupation, smoking, and alcohol in the epidemiology of bladder cancer. American Journal of Public Health 77(10):1298–1300.
Bruske-Hohlfeld I, Mohner M, Ahrens W, Pohlabeln H, Heinrich J, Kreuzer M, Jockel KH, Wichmann HE. 1999. Lung cancer risk in male workers occupationally exposed to diesel motor emissions in Germany. American Journal of Industrial Medicine 36(4):405–414.
Bruske-Hohlfeld I, Mohner M, Pohlabeln H, Ahrens W, Bolm-Audorff U, Kreienbrock L, Kreuzer M, Jahn I, Wichmann HE, Jockel KH. 2000. Occupational lung cancer risk for men in Germany: Results from a pooled case-control study. American Journal of Epidemiology 151(4):384–395.
Buiatti E, Kriebel D, Geddes M, Santucci M, Pucci N. 1985. A case control study of lung cancer in Florence, Italy. I. Occupational risk factors. Journal of Epidemiology and Community Health 39(3):244–250.
Carozza SE, Wrensch M, Miike R, Newman B, Olshan AF, Savitz DA, Yost M, Lee M. 2000. Occupation and adult gliomas. American Journal of Epidemiology 152(9):838–846.
Chen CJ, Wu HY, Chuang YC, Chang AS, Luh KT, Chao HH, Chen KY, Chen SG, Lai GM, Huang HH. 1990. Epidemiologic characteristics and multiple risk factors of lung cancer in Taiwan. Anticancer Research 10(4):971–976.
Chow WH, McLaughlin JK, Malker HS, Linet MS, Weiner JA, Stone BJ. 1995. Esophageal cancer and occupation in a cohort of Swedish men. American Journal of Industrial Medicine 27(5):749–757.
Chow WH, McLaughlin JK, Malker HS, Weiner JA, Ericsson JL, Stone BJ, Blot WJ. 1994. Occupation and stomach cancer in a cohort of Swedish men. American Journal of Industrial Medicine 26(4):511–520.
Claude JC, Frentzel-Beyme RR, Kunze E. 1988. Occupation and risk of cancer of the lower urinary tract among men. A case-control study. International Journal of Cancer 41(3):371–379.
Clavel J, Mandereau L, Limasset JC, Hemon D, Cordier S. 1994. Occupational exposure to polycyclic aromatic hydrocarbons and the risk of bladder cancer: A French case-control study. International Journal of Epidemiology 23(6):1145–1153.
Cocco P, Figgs L, Dosemeci M, Hayes R, Linet MS, Hsing AW. 1998. Case-control study of occupational exposures and male breast cancer. Occupational and Environmental Medicine 55(9):599–604.
Cocco P, Palli D, Buiatti E, Cipriani F, DeCarli A, Manca P, Ward MH, Blot WJ, Fraumeni Jr JF. 1994. Occupational exposures as risk factors for gastric cancer in Italy. Cancer Causes & Control 5(3):241–248.
Cole P, Hoover R, Friedell GH. 1972. Occupation and cancer of the lower urinary tract. Cancer 29(5):1250–1260.
Consonni D, Pesatori AC, Tironi A, Bernucci I, Zocchetti C, Bertazzi PA. 1999. Mortality study in an Italian oil refinery: Extension of the follow-up. American Journal of Industrial Medicine 35(3):287–294.
Cordier S, Clavel J, Limasset JC, Boccon-Gibod L, Le Moual N, Mandereau L, Hemon D. 1993. Occupational risks of bladder cancer in France: A multicentre case-control study. International Journal of Epidemiology 22(3):403–411.
Costantini AS, Miligi L, Kriebel D, Ramazzotti V, Rodella S, Scarpi E, Stagnaro E, Tumino R, Fontana A, Masala G, Vigano C, Vindigni C, Crosignani P, Benvenuti A, Vineis P. 2001. A multicenter case-control study in Italy on hematolymphopoietic neoplasms and occupation. Epidemiology 12(1):78–87.
Dai XD, Lin CY, Sun XW, Shi YB, Lin YJ. 1996. The etiology of lung cancer in nonsmoking females in Harbin, China. Lung Cancer 14(Suppl 1):S85–S91.
Damber L, Larsson LG. 1985. Professional driving, smoking, and lung cancer: A case referent study. British Journal of Industrial Medicine 42(4):246–252.
Damber LA, Larsson LG. 1987. Occupation and male lung cancer: A case-control study in northern Sweden. British Journal of Industrial Medicine 44(7):446–453.
De Roos AJ, Stewart PA, Linet MS, Heineman EF, Dosemeci M, Wilcosky T, Shapiro WR, Selker RG, Fine HA, Black PM, Inskip PD. 2003. Occupation and the risk of adult glioma in the United States. Cancer Causes and Control 14(2):139–50.
De Stefani E, Boffetta P, Oreggia F, Ronco A, Kogevinas M, Mendilaharsu M. 1998. Occupation and the risk of laryngeal cancer in Uruguay. American Journal of Industrial Medicine 33(6):537–542.
Decoufle P, Stanislawczyk K. 1977. A Retrospective Survey of Cancer in Relation to Occupation. Cincinnati, OH: Center for Disease Control, National Institute for Occupational Safety and Health.
Delahunt B, Bethwaite PB, Nacey JN. 1995. Occupational risk for renal cell carcinoma. A case-control study based on the New Zealand Cancer Registry. British Journal of Urology 75(5):578–582.
Demers PA, Kogevinas M, Boffetta P, Leclerc A, Luce D, Gerin M, Battista G, Belli S, Bolm-Audorf U, Brinton LA, Colin D, Comba P, Hardell L, Hayes RB, Magnani C, Merler E, Morcet JF, Preston-Martin S, Matos E, Rodella S, Vaughan TL, Zheng W, Vainio H. 1995. Wood dust and sino-nasal cancer: Pooled reanalysis of twelve case-control studies. American Journal of Industrial Medicine 28(2):151–166.
Demers PA, Vaughan TL, Koepsell TD, Lyon JL, Swanson GM, Greenberg RS, Weiss NS. 1993. A case-control study of multiple myeloma and occupation. American Journal of Industrial Medicine 23(4):629–639.
Dietz A, Senneweld E, Maier H. 1995. Indoor air pollution by emissions of fossil fuel single stoves: Possibly a hitherto underrated risk factor in the development of carcinomas in the head and neck. Otolaryngology—Head & Neck Surgery 112(2):308–315.
Divine BJ, Barron V. 1986. Texaco Mortality Study: II. Patterns of mortality among white males by specific job groups. American Journal of Industrial Medicine 10(4):371–381.
Divine BJ, Barron V, Kaplan SD. 1985. Texaco mortality study. I. Mortality among refinery, petrochemical, and research workers. Journal of Occupational Medicine 27(6):445–447.
Divine BJ, Hartman CM, Wendt JK. 1999a. Update of the Texaco mortality study 1947–93: Part II. Analyses of specific causes of death for white men employed in refining, research, and petrochemicals. Occupational & Environmental Medicine 56(3):174–180.
Divine BJ, Hartman CM, Wendt JK. 1999b. Update of the Texaco mortality study 1947–93: Part I. Analysis of overall patterns of mortality among refining, research, and petrochemical workers. Occupational and Environmental Medicine 56(3):167–173.
Du YX, Cha Q, Chen XW, Chen YZ, Huang LF, Feng ZZ, Wu XF, Wu JM. 1996. An epidemiological study of risk factors for lung cancer in Guangzhou, China. Lung Cancer 14(Suppl 1):S9–S37.
Dumas S, Parent ME, Siemiatycki J, Brisson J. 2000. Rectal cancer and occupational risk factors: A hypothesis-generating, exposure-based case-control study. International Journal of Cancer 87(6):874–879.
Elci OC, Akpinar-Elci M, Blair A, Dosemeci M. 2003. Risk of laryngeal cancer by occupational chemical exposure in Turkey. Journal of Occupational and Environmental Medicine 45(10):1100–1106.
Elci OC, Dosemeci M, Blair A. 2001. Occupation and the risk of laryngeal cancer in Turkey. Scandinavian Journal of Work, Environment & Health 27(4):233–239.
Emmelin A, Nystrom L, Wall S. 1993. Diesel exhaust exposure and smoking: A case-referent study of lung cancer among Swedish dock workers. Epidemiology 4(3):237–244.
Farrow A, Jacobs A, West RR. 1989. Myelodysplasia, chemical exposure, and other environmental factors. Leukemia 3(1):33–35.
Flodin U, Fredriksson M, Persson B. 1987. Multiple myeloma and engine exhausts, fresh wood, and creosote: A case-referent study. American Journal of Industrial Medicine 12(5):519–529.
Flodin U, Fredriksson M, Persson B, Axelson O. 1988. Chronic lymphatic leukaemia and engine exhausts, fresh wood, and DDT: A case-referent study. British Journal of Industrial Medicine 45(1):33–38.
Franceschi S, Serraino D, Bidoli E, Talamini R, Tirelli U, Carbone A, La Vecchia C. 1989. The epidemiology of non-Hodgkin’s lymphoma in the north-east of Italy: A hospital-based case-control study. Leukemia Research 13(6):465–472.
Fritschi L, Siemiatycki J. 1996a. Melanoma and occupation: Results of a case-control study. Occupational and Environmental Medicine 53(3):168–173.
Fritschi L, Siemiatycki J. 1996b. Lymphoma, myeloma and occupation: Results of a case-control study. International Journal of Cancer 67(4):498–503.
Gallagher RP, Bajdik CD, Fincham S, Hill GB, Keefe AR, Goldman A, McLean DI. 1996. Chemical exposures, medical history, and risk of squamous and basal cell carcinoma of the skin. Cancer Epidemiology, Biomarkers and Prevention 5(6):419–424.
Gamble JF, Pearlman ED, Nicolich MJ. 1996. A nested case-control study of kidney cancer among refinery/petrochemical workers. Environmental Health Perspectives 104(6):642–650.
Garshick E, Schenker MB, Munoz A, Segal M, Smith TJ, Woskie SR, Hammond SK, Speizer FE. 1987. A case-control study of lung cancer and diesel exhaust exposure in railroad workers. American Review of Respiratory Disease 135(6):1242–1248.
Garshick E, Schenker MB, Munoz A, Segal M, Smith TJ, Woskie SR, Hammond SK, Speizer FE. 1988. A retrospective cohort study of lung cancer and diesel exhaust exposure in railroad workers. American Review of Respiratory Disease 137(4):820–825.
Gerhardsson de Verdier MG, Plato N, Steineck G, Peters JM. 1992. Occupational exposures and cancer of the colon and rectum. American Journal of Industrial Medicine 22(3):291–303.
Gerin M, Siemiatycki J, Kemper H, Begin D. 1985. Obtaining occupational exposure histories in epidemiologic case-control studies. Journal of Occupational Medicine 27(6):420–426.
Goldberg H, Lusk E, Moore J, No well PC, Besa EC. 1990. Survey of exposure to genotoxic agents in primary myelodysplastic syndrome: Correlation with chromosome patterns and data on patients without hematological disease. Cancer Research 50(21):6876–6881.
Goldberg MS, Parent ME, Siemiatycki J, Desy M, Nadon L, Richardson L, Lakhani R, Latreille B, Valois MF. 2001. A case-control study of the relationship between the risk of colon cancer in men and exposures to occupational agents. American Journal of Industrial Medicine 39(6):531–546.
Goldberg P, Leclerc A, Luce D, Morcet JF, Brugere J. 1997. Laryngeal and hypopharyngeal cancer and occupation: Results of a case control-study. Occupational and Environmental Medicine 54(7):477–482.
Gonzalez CA, Lopez-Abente G, Errezola M, Escolar A, Riboli E, Izarzugaza I, Nebot M. 1989. Occupation and bladder cancer in Spain: A multi-centre case-control study. International Journal of Epidemiology 18(3):569–577.
Guberan E, Usel M, Raymond L, Bolay J, Fioretta G, Puissant J. 1992. Increased risk for lung cancer and for cancer of the gastrointestinal tract among Geneva professional drivers. British Journal of Industrial Medicine 49(5):337–344.
Guenel P, Laforest L, Cyr D, Fevotte J, Sabroe S, Dufour C, Lutz JM, Lynge E. 2001. Occupational risk factors, ultraviolet radiation, and ocular melanoma: A case-control study in France. Cancer Causes & Control 12(5):451–459.
Gustavsson P, Jakobsson R, Johansson H, Lewin F, Norell S, Rutkvist LE. 1998. Occupational exposures and squamous cell carcinoma of the oral cavity, pharynx, larynx, and oesophagus: A case-control study in Sweden. Occupational and Environmental Medicine 55(6):393–400.
Gustavsson P, Jakobsson R, Nyberg F, Pershagen G, Jarup L, Scheele P. 2000. Occupational exposure and lung cancer risk: A population-based case-referent study in Sweden. American Journal of Epidemiology 152(1):32–40.
Gustavsson P, Plato N, Lidstrom EB, Hogstedt C. 1990. Lung cancer and exposure to diesel exhaust among bus garage workers. Scandinavian Journal of Work, Environment & Health 16(5):348–354.
Hanis NM, Stavraky KM, Fowler JL. 1979. Cancer mortality in oil refinery workers. Journal of Occupational Medicine 21(3):167–174.
Hanis NM, Holmes TM, Shallenberger G, Jones KE. 1982. Epidemiologic study of refinery and chemical plant workers. Journal of Occupational Medicine 24(3):203–212.
Hannuksela-Svahn A, Pukkala E, Karvonen J. 1999. Basal cell skin carcinoma and other nonmelanoma skin cancers in Finland from 1956 through 1995. Archives of Dermatology 135(7):781–786.
Hansen ES. 1993. A follow-up study on the mortality of truck drivers. American Journal of Industrial Medicine 23(5):811–821.
Hansen J. 2000. Elevated risk for male breast cancer after occupational exposure to gasoline and vehicular combustion products. American Journal of Industrial Medicine 37(4):349–352.
Hansen J, Raaschou-Nielsen O, Olsen JH. 1998. Increased risk of lung cancer among different types of professional drivers in Denmark. Occupational and Environmental Medicine 55(2):115–118.
Hartge P, Cahill JI, West D, Hauck M, Austin D, Silverman D, Hoover R. 1984. Design and methods in a multi-center case-control interview study. American Journal of Public Health 74(1):52–56.
Hayes RB, Thomas T, Silverman DT, Vineis P, Blot WJ, Mason TJ, Pickle LW, Correa P, Fontham ETH, Schoenberg JB. 1989. Lung cancer in motor exhaust-related occupations. American Journal of Industrial Medicine 16(6):685–695.
He XZ, Chen W, Liu ZY, Chapman RS. 1991. An epidemiological study of lung cancer in Xuan Wei County, China: Current progress. Case-control study on lung cancer and cooking fuel. Environmental Health Perspectives 94:9–13.
Heineman EF, Olsen JH, Pottern LM, Gomez M, Raffn E, Blair A. 1992. Occupational risk factors for multiple myeloma among Danish men. Cancer Causes & Control 3(6):555–568.
Hoar SK, Hoover R. 1985. Truck driving and bladder cancer mortality in rural New England. Journal of the National Cancer Institute 74(4):771–774.
Hoek G, Brunekreef B, Goldbohm S, Fischer P, Van den Brandt PA. 2002. Association between mortality and indicators of traffic-related air pollution in the Netherlands: A cohort study. Lancet 360(9341):1203–1209.
Hours M, Dananche B, Fevotte J, Bergeret A, Ayzac L, Cardis E, Etard JF, Fallen C, Roy P, Fabry J. 1994. Bladder cancer and occupational exposures. Scandinavian Journal of Work, Environment & Health 20(5):322–330.
Howe GR, Burch JD, Miller AB, Cook GM, Esteve J, Morrison B, Gordon P, Chambers LW, Fodor G, Winsor GM. 1980. Tobacco use, occupation, coffee, various nutrients, and bladder cancer. Journal of the National Cancer Institute 64(4):701–713.
Howe GR, Fraser D, Lindsay J, Presnal B, Yu SZ. 1983. Cancer mortality (1965–77) in relation to diesel fume and coal exposure in a cohort of retired railway workers. Journal of the National Cancer Institute 70(6):1015–1019.
Hu J, Mao Y, White K. 2002. Renal cell carcinoma and occupational exposure to chemicals in Canada. Occupational Medicine 52(3):157–164.
Huang C, Zhang X, Qiao Z, Guan L, Peng S, Liu J, Xie R, Zheng L. 1992. A case-control study of dietary factors in patients with lung cancer. Biomedical & Environmental Sciences 5(3):257–265.
Huebner WW, Chen VW, Friedlander BR, Wu XC, Jorgensen G, Bhojani FA, Friedmann CH, Schmidt BA, Sales EA, Joy JA, Correa CN. 2000. Incidence of lymphohaematopoietic malignancies in a petrochemical industry cohort: 1983–94 follow up. Occupational & Environmental Medicine 57(9):605–614.
Huebner WW, Schoenberg JB, Kelsey JL, Wilcox HB, McLaughlin JK, Greenberg RS, Preston-Martin S, Austin DF, Stemhagen A, Blot WJ, Winn DM, Fraumeni J, Jr. 1992. Oral and pharyngeal cancer and occupation: A case-control study. Epidemiology 3(4):300–309.
IARC (International Agency for Research on Cancer). 1984a. Polynuclear Aromatic Compounds, Part 2, Carbon Blacks, Mineral Oils and some Nitroarenes. 33. Lyon, France: IARC.
IARC. 1984b. Polynuclear Aromatic Compounds, Part 3, Industrial Exposures in Aluminum Production, Coal Gasification, Coke Production, and Iron and Steel Founding. 34. Lyon, France: IARC.
IARC. 1985. Polynuclear aromatic Compounds, Part 4, Bitumens, Coal-Tars and Derived Products, Shale-oils and Soots. 35. Lyon, France: IARC.
Ido M, Nagata C, Kawakami N, Shimizu H, Yoshida Y, Nomura T, Mizoguchi H. 1996. A case-control study of myelodysplastic syndromes among Japanese men and women. Leukemia Research 20(9):727–731.
IOM (Institute of Medicine). 2003. Gulf War and Health, Volume 2: Insecticides and Solvents. Washington, DC: The National Academies Press.
Iscovich J, Castelletto R, Esteve J, Munoz N, Colanzi R, Coronel A, Deamezola I, Tassi V, Arslan A. 1987. Tobacco smoking, occupational exposure and bladder cancer in Argentina. International Journal of Cancer 40(6):734–740.
Iyer V, Harris RE, Wynder EL. 1990. Diesel exhaust exposure and bladder cancer risk. European Journal of Epidemiology 6(1):49–54.
Jarvholm B, Silverman D. 2003. Lung cancer in heavy equipment operators and truck drivers with diesel exhaust exposure in the construction industry. Occupational and Environmental Medicine 60(7):516–520.
Jarvholm B, Mellblom B, Norrman R, Nilsson R, Nordlinder R. 1997. Cancer incidence of workers in the Swedish petroleum industry. Occupational and Environmental Medicine 54(9):686–691.
Jedrychowski W, Becher H, Wahrendorf J, Basa-Cierpialek Z. 1990. A case-control study of lung cancer with special reference to the effect of air pollution in Poland. Journal of Epidemiology and Community Health 44(2):114–120.
Jemal A, Murray T, Samuels A, Ghafoor A, Ward E, Thun MJ. 2003. Cancer statistics, 2003. CA: A Cancer Journal for Clinicians 53(1):5–26.
Jensen OM, Knudsen JB, McLaughlin JK, Sorensen BL. 1988. The Copenhagen case-control study of renal pelvis and ureter cancer: Role of smoking and occupational exposures. International Journal of Cancer 41(4):557–561.
Jensen OM, Wahrendorf J, Knudsen JB, Sorensen BL. 1987. The Copenhagen case-referent study on bladder cancer. Risks among drivers, painters and certain other occupations. Scandinavian Journal of Work, Environment & Health 13(2):129–134.
Jockel KH, Ahrens W, Jahn I, Pohlabeln H, Bolm-Audorff U. 1998. Occupational risk factors for lung cancer: A case-control study in West Germany. International Journal of Epidemiology 27(4):549–560.
Jockel KH, Ahrens W, Wichmann HE, Becher H, Bolm-Audorff U, Jahn I, Molik B, Greiser E, Timm J. 1992. Occupational and environmental hazards associated with lung cancer. International Journal of Epidemiology 21(2):202–213.
Kadamani S, Asal NR, Nelson RY. 1989. Occupational hydrocarbon exposure and risk of renal cell carcinoma. American Journal of Industrial Medicine 15(2):131–141.
Kaplan I. 1959. Relationship of noxious gases to carcinoma of the lung in railroad workers. JAMA 171:2039–2043.
Katsouyanni K, Trichopoulos D, Kalandidi A, Tomos P, Riboli E. 1991. A case-control study of air pollution and tobacco smoking in lung cancer among women in Athens. Preventive Medicine 20(2):271–278.
Kauppinen T, Partanen T, Degerth R, Ojajarvi A. 1995. Pancreatic cancer and occupational exposures. Epidemiology 6(5):498–502.
Kleinerman RA, Wang Z, Wang L, Metayer C, Zhang S, Brenner AV, Zhang S, Xia Y, Shang B, Lubin JH. 2002. Lung cancer and indoor exposure to coal and biomass in rural China. Journal of Occupational and Environmental Medicine 44(4):338–344.
Kneller RW, Gao YT, McLaughlin JK, Gao RN, Blot WJ, Liu MH, Sheng JP, Fraumeni JF Jr. 1990. Occupational risk factors for gastric cancer in Shanghai, China. American Journal of Industrial Medicine 18(1):69–78.
Ko YC, Lee CH, Chen MJ, Huang CC, Chang WY, Lin HJ, Wang HZ, Chang PY. 1997. Risk factors for primary lung cancer among non-smoking women in Taiwan. International Journal of Epidemiology 26(1):24–31.
Kogevinas M, ‘t Mannetje A, Cordier S, Ranft U, Gonzalez C, Vineis P, Chang-Claude J, Lynge E, Wahrendorf J, Tzonou A, Jockel K, Serra C, Porru S, Hours M, Greiser E, Boffetta P. 2003. Occupation and bladder cancer among men in Western Europe. Cancer Causes & Control 14(10):907–914.
Koo LC, Lee N, Ho JH. 1983. Do cooking fuels pose a risk for lung cancer? A case-control study of women in Hong Kong. Ecology of Disease 2(4):255–265.
Krewski D, Burnett RT, Goldberg MS, Hoover BK, Siemiatycki J, Jerrett M, Abrahamowicz M, White WH. 2003. Overview of the reanalysis of the Harvard Six Cities Study and American Cancer Society Study of Particulate Air Pollution and Mortality. Journal of Toxicology and Environmental Health—Part A 66(16–19):1507–1551.
Krewski D, Snyder R, Beatty P, Granville G, Meek B, Sonawane B. 2000. Assessing the health risks of benzene: A report on the Benzene State-of-the-Science Workshop. Journal of Toxicology and Environmental Health—Part A 61(5–6):307–338.
Krstev S, Baris D, Stewart P, Dosemeci M, Swanson G, Greenberg R, Schoenberg J, Schwartz A, Liff J, Hayes RB. 1998. Occupational risk factors and prostate cancer in U.S. blacks and whites. American Journal of Industrial Medicine 34(5):421–430.
Kubasiewicz M, Starzynski Z. 1989. Case-referent study on skin cancer and its relation to occupational exposure to polycyclic aromatic hydrocarbons: I. Study design. Polish Journal of Occupational Medicine 2(3):221–228.
Kubasiewicz M, Starzynski Z, Szymczak W. 1991. Case-referent study on skin cancer and its relation to occupational exposure to polycyclic aromatic hydrocarbons. II. Study results. Polish Journal of Occupational Medicine and Environmental Health 4(2):141–147.
Kunze E, Chang-Claude J, Frentzel-Beyme R. 1992. Life style and occupational risk factors for bladder cancer in Germany: A case-control study. Cancer 69(7):1776–1790.
Lagorio S, Forastiere F, Iavarone I, Rapiti E, Vanacore N, Perucci CA, Carere A. 1994. Mortality of filling station attendants. Scandinavian Journal of Work, Environment & Health 20(5):331–338.
Lagorio S, Forastiere F, Iavarone I, Vanacore N, Fuselli S, Carere A. 1993. Exposure assessment in a historical cohort of filling station attendants. International Journal of Epidemiology 22(Suppl 2):S51–S56.
Lan Q, Chapman RS, Schreinemachers DM, Tian L, He X. 2002. Household stove improvement and risk of lung cancer in Xuanwei, China. Journal of the National Cancer Institute 94(11):826–835.
Lan Q, Chen W, Chen H, He XZ. 1993. Risk factors for lung cancer in non-smokers in Xuanwei County of China. Biomedical and Environmental Sciences 6(2):112–118.
Lan Q, Feng Z, Tian D, He X, Rothman N, Tian L, Lu X, Terry MB, Mumford JL. 2001. p53 gene expression in relation to indoor exposure to unvented coal smoke in Xuan Wei, China. Journal of Occupational and Environmental Medicine 43(3):226–30.
Larkin EK, Smith TJ, Stayner L, Rosner B, Speizer FE, Garshick E. 2000. Diesel exhaust exposure and lung cancer: Adjustment for the effect of smoking in a retrospective cohort study. American Journal of Industrial Medicine 38(4):399–409.
Leclerc A, Luce D, Demers PA, Boffetta P, Kogevinas M, Belli S, Bolm-Audorff U, Brinton LA, Colin D, Comba P, Gerin M, Hardell L, Hayes RB, Magnani C, Merler E, Morcet JF, Preston-Martin S, Vaughan TL, Zheng W. 1997. Sinonasal cancer and occupation. Results from the reanalysis of twelve case-control studies. American Journal of Industrial Medicine 31(2):153–165.
Lee WJ, Baris D, Jarvholm B, Silverman DT, Bergdahl IA, Blair A. 2003. Multiple myeloma and diesel and other occupational exposures in Swedish construction workers. International Journal of Cancer 107(1):134–138.
Lei YX, Cai WC, Chen YZ, Du YX. 1996. Some lifestyle factors in human lung cancer: A case-control study of 792 lung cancer cases. Lung Cancer 14(Suppl 1):S121–S136.
Lerchen ML, Wiggins CL, Samet JM. 1987. Lung cancer and occupation in New Mexico. Journal of the National Cancer Institute 79(4):639–45.
Lewis RJ, Gamble JF, Jorgensen G. 2000a. Mortality among three refinery/petrochemical plant cohorts. I. 1970 to 1982 active/terminated workers. Journal of Occupational and Environmental Medicine 42(7):721–729.
Lewis RJ, Schnatter AR, Drummond I, Murray N, Thompson FS, Katz AM, Jorgensen G, Nicolich MJ, Dahlman D, Theriault G. 2003. Mortality and cancer morbidity in a cohort of Canadian petroleum workers. Occupational and Environmental Medicine 60(12):918–928.
Lewis RJ, Schnatter AR, Katz AM, Thompson FS, Murray N, Jorgensen G, Theriault G. 2000b. Updated mortality among diverse operating segments of a petroleum company. Occupational and Environmental Medicine 57(9):595–604.
Lewis-Michl EL, Melius JM, Kallenbach LR, Ju CL, Talbot TO, Orr MF, Lauridsen PE. 1996. Breast cancer risk and residence near industry or traffic in Nassau and Suffolk Counties, Long Island, New York. Archives of Environmental Health 51(4):255–265.
Lindquist R, Nilsson B, Eklund G, Gahrton G. 1991. Acute leukemia in professional drivers exposed to gasoline and diesel. European Journal of Haematology 47(2):98–103.
Linet MS, Harlow SD, McLaughlin JK. 1987. A case-control study of multiple myeloma in whites: Chronic antigenic stimulation, occupation, and drug use. Cancer Research 47(11):2978–2981.
Linet MS, Malker HS, Chow WH, McLaughlin JK, Weiner JA, Stone BJ, Ericsson JL, Fraumeni JF Jr. 1995. Occupational risks for cutaneous melanoma among men in Sweden. Journal of Occupational and Environmental Medicine 37(9):1127–1135.
Linet MS, Malker HS, McLaughlin JK, Weiner JA, Blot WJ, Ericsson JL, Fraumeni JF Jr. 1993. Non-Hodgkin’s lymphoma and occupation in Sweden: A registry based analysis. British Journal of Industrial Medicine 50(1):79–84.
Linet MS, McLaughlin JK, Malker HS, Chow WH, Weiner JA, Stone BJ, Ericsson JL, Fraumeni JF Jr. 1994. Occupation and hematopoietic and lymphoproliferative malignancies among women: A linked registry study. Journal of Occupational Medicine 36(11):1187–1198.
Liu Q, Sasco AJ, Riboli E, Hu MX. 1993. Indoor air pollution and lung cancer in Guangzhou, People’s Republic of China. American Journal of Epidemiology 137(2):145–154.
Luce D, Leclerc A, Begin D, Demers PA, Gerin M, Orlowski E, Kogevinas M, Belli S, Bugel I, Bolm-Audorff U, Brinton LA, Comba P, Hardell L, Hayes RB, Magnani C, Merler E, Preston-Martin S, Vaughan TL, Zheng W, Boffetta P. 2002. Sinonasal cancer and occupational exposures: A pooled analysis of 12 case-control studies. Cancer Causes & Control 13(2):147–157.
Luo RX, Wu B, Yi YN, Huang ZW, Lin RT. 1996. Indoor burning coal air pollution and lung cancer-a case-control study in Fuzhou, China. Lung Cancer 14(Suppl 1):S113–S119.
Magnani C, Pannett B, Winter PD, Coggon D. 1988. Application of a job-exposure matrix to national mortality statistics for lung cancer. British Journal of Industrial Medicine 45(1):70–72.
Maier H, Tisch M. 1997. Epidemiology of laryngeal cancer: Results of the Heidelberg case-control study. Acta Oto-laryngologica. Supplementum 527:160–164.
Mandel JS, McLaughlin JK, Schlehofer B, Mellemgaard A, Helmert U, Lindblad P, McCredie M, Adami HO. 1995. International renal-cell cancer study. IV. Occupation. International Journal of Cancer 61(5):601–605.
Mao Y, Hu J, Ugnat AM, White K. 2000. Non-Hodgkin’s lymphoma and occupational exposure to chemicals in Canada. Canadian Cancer Registries Epidemiology Research Group. Annals of Oncology 11(Suppl 1):69–73.
Marsh GM, Stone RA, Esmen NA, Gula MJ, Gause CK, Petersen NJ, Meaney FJ, Rodney S, Prybylski D. 1998. A case-control study of lung cancer mortality in four rural Arizona smelter towns. Archives of Environmental Health 53(1):15–28.
Matos EL, Vilensky M, Mirabelli D, Boffetta P. 2000. Occupational exposures and lung cancer in Buenos Aires, Argentina. Journal of Occupational and Environmental Medicine 42(6):653–659.
McCredie M, Stewart JH. 1993. Risk factors for kidney cancer in New South Wales. IV. Occupation. British Journal of Industrial Medicine 50(4):349–354.
McLaughlin JK, Blot WJ, Mehl ES, Stewart PA, Venable FS, Fraumeni JF Jr. 1985. Petroleum-related employment and renal cell cancer. Journal of Occupational Medicine 27(9):672–674.
McLaughlin JK, Malker HS, Stone BJ, Weiner JA, Malker BK, Ericsson JL, Blot WJ, Fraumeni JF Jr. 1987. Occupational risks for renal cancer in Sweden. British Journal of Industrial Medicine 44(2):119–123.
McLaughlin JK, Mandel JS, Blot WJ, Schuman LM, Mehl ES, Fraumeni JF Jr. 1984. A population-based case-control study of renal cell carcinoma. Journal of the National Cancer Institute 72(2):275–284.
Mellemgaard A, Engholm G, McLaughlin JK, Olsen JH. 1994. Occupational risk factors for renal-cell carcinoma in Denmark. Scandinavian Journal of Work, Environment & Health 20(3):160–165.
Menvielle G, Luce D, Fevotte J, Bugel I, Salomon C, Goldberg P, Billon-Galland MA, Goldberg M. 2003. Occupational exposures and lung cancer in New Caledonia. Occupational and Environmental Medicine 60(8):584–589.
Merletti F, Boffetta P, Ferro G, Pisani P, Terracini B. 1991. Occupation and cancer of the oral cavity or oropharynx in Turin, Italy. Scandinavian Journal of Work, Environment and Health 17(4):248–254.
Metayer C, Wang Z, Kleinerman RA, Wang L, Brenner AV, Cui H, Cao J, Lubin JH. 2002. Cooking oil fumes and risk of lung cancer in women in rural Gansu, China. Lung Cancer 35(2):111–117.
Michelozzi P, Fusco D, Forastiere F, Ancona C, Dell’Orco V, Perucci CA. 1998. Small area study of mortality among people living near multiple sources of air pollution. Occupational and Environmental Medicine 55(9):611–615.
Mommsen S, Aagard J. 1984. Occupational exposures as risk indicator of male bladder carcinoma in a predominantly rural area. Acta Radiologica—Oncology 23(2–3):147–152.
Mommsen S, Aagaard J, Sell A. 1982. An epidemiological case-control study of bladder cancer in males from a predominantly rural district. European Journal of Cancer and Clinical Oncology 18(11):1205–1210.
Mommsen S, Aagaard J, Sell A. 1983. An epidemiological study of bladder cancer in a predominantly rural district. Scandinavian Journal of Urology and Nephrology 17(3):307–312.
Monarrez-Espino J, Stang A, Bromen K, Merzenich H, Anastassiou G, Jockel KH. 2002. Occupation as a risk factor for uveal melanoma in Germany. Scandinavian Journal of Work, Environment & Health 28(4):270–277.
Morris PD, Koepsell TD, Daling JR, Taylor JW, Lyon JL, Swanson GM, Child M, Weiss NS. 1986. Toxic substance exposure and multiple myeloma: A case control-study. Journal of the National Cancer Institute 76(6):987–994.
Muir C, Waterhouse J, Mack T, Powell J, Whelan S. 1987. Cancer Incidence in Five Continents, Vol. 5. IARC Scientific Publication. 88. Lyon, France: IARC; as cited in Yu et al. 1990.
Muscat JE, Wynder EL. 1995. Diesel exhaust, diesel fumes, and laryngeal cancer. Otolaryngology—Head and Neck Surgery 112(3):437–440.
Muscat JE, Stellman SD, Richie JP Jr, Wynder EL. 1998. Lung cancer risk and workplace exposures in black men and women. Environmental Research 76(2):78–84.
Nadon L, Siemiatycki J, Dewar R, Krewski D, Gerin M. 1995. Cancer risk due to occupational exposure to polycyclic aromatic hydrocarbons. American Journal of Industrial Medicine 28(3):303–324.
Nafstad P, Haheim LL, Oftedal B, Gram F, Holme I, Hjermann I, Leren P. 2003. Lung cancer and air pollution: A 27 year follow up of 16,209 Norwegian men. Thorax 58(12):1071–1076.
Nagata C, Shimizu H, Hirashima K, Kakishita E, Fujimura K, Niho Y, Karasawa M, Oguma S, Yoshida Y, Mizoguchi H. 1999. Hair dye use and occupational exposure to organic solvents as risk factors for myelodysplastic syndrome. Leukemia Research 23(1):57–62.
Najem GR, Louria DB, Seebode JJ, Thind IS, Prusakowski JM, Ambrose RB, Fernicola AR. 1982. Life time occupation, smoking, caffeine, saccharine, hair dyes and bladder carcinogenesis. International Journal of Epidemiology 11(3):212–217.
NCI (National Cancer Institute). 2002. What You Need to Know About Bladder Cancer; Information About Detection, Symptoms, Diagnosis, and Tretment of Bladder Cancer. [Online]. Available: http://www.lnci.nih.gov/cancerinfo/wyntk/bladder [accessed May 18, 2004].
NCI. 2004. What You Need to Know About Leukemia. [Online]. Available: http://www.nci.nih.gov/cancertopics/wyntk/leukemia [accessed August, 2004].
Nelemans PJ, Scholte R, Groenendal H, Kiemeney LA, Rampen FH, Ruiter DJ, Verbeek AL. 1993. Melanoma and occupation: Results of a case-control study in The Netherlands. British Journal of Industrial Medicine 50(7):642–646.
Nelson NA, Barker DM, Van Peenen PF, Blanchard AG. 1985. Determining exposure categories for a refinery retrospective cohort mortality study. American Industrial Hygiene Association Journal 46(11):653–657.
Nelson NA, Van Peenen PF, Blanchard AG. 1987. Mortality in a recent oil refinery cohort. Journal of Occupational Medicine 29(7):610–612.
Netterstrom B. 1988. Cancer incidence among urban bus drivers in Denmark. International Archives of Occupational and Environmental Health 61(3):217–221.
Nisse C, Haguenoer JM, Grandbastien B, Preudhomme C, Fontaine B, Brillet JM, Lejeune R, Fenaux P. 2001. Occupational and environmental risk factors of the myelodysplastic syndromes in the North of France. British Journal of Haematology 112(4):927–935.
Nisse C, Lorthois C, Dorp V, Eloy E, Haguenoer JM, Fenaux P. 1995. Exposure to occupational and environmental factors in myelodysplastic syndromes. Preliminary results of a case-control study. Leukemia 9(4):693–699.
Notani PN, Shah P, Jayant K, Balakrishnan V. 1993. Occupation and cancers of the lung and bladder: A case-control study in Bombay. International Journal of Epidemiology 22(2):185–191.
Nyberg F, Gustavsson P, Jarup L, Bellander T, Berglind N, Jakobsson R, Pershagen G. 2000. Urban air pollution and lung cancer in Stockholm. Epidemiology 11(5):487–495.
Paradis G, Theriault G, Tremblay C. 1989. Mortality in a historical cohort of bus drivers. International Journal of Epidemiology 18(2):397–402.
Parent ME, Hua Y, Siemiatycki J. 2000a. Occupational risk factors for renal cell carcinoma in Montreal. American Journal of Industrial Medicine 38(6):609–618.
Parent ME, Siemiatycki J, Fritschi L. 2000b. Workplace exposures and oesophageal cancer. Occupational & Environmental Medicine 57(5):325–334.
Partanen T, Heikkila P, Hernberg S, Kauppinen T, Moneta G, Ojajarvi A. 1991. Renal cell cancer and occupational exposure to chemical agents. Scandinavian Journal of Work, Environment & Health 17(4):231–239.
Pesch B, Haerting J, Ranft U, Klimpel A, Oeschlagel B, Schill W. 2000a. Occupational risk factors for renal cell carcinoma: Agent-specific results from a case-control study in Germany. International Journal of Epidemiology 29(6):1014–1024.
Pesch B, Haerting J, Ranft U, Klimpel A, Oelschlagel B, Schill W. 2000b. Occupational risk factors for urothelial carcinoma: Agent-specific results from a case-control study in Germany. International Journal of Epidemiology 29(2):238–247.
Petralia SA, Vena JE, Freudenheim JL, Dosemeci M, Michalek A, Goldberg MS, Erasure J, Graham S. 1999. Risk of premenopausal breast cancer in association with occupational exposure to polycyclic aromatic hydrocarbons and benzene. Scandinavian Journal of Work, Environment & Health 25(3):215–221.
Pietri F, Clavel F, Auquier A, Flamant R. 1990. Occupational risk factors for cancer of the pancreas: A case-control study. British Journal of Industrial Medicine 47(6):425–428.
Pintos J, Franco EL, Kowalski LP, Oliveira BV, Curado MP. 1998. Use of wood stoves and risk of cancers of the upper aero-digestive tract: A case-control study. International Journal of Epidemiology 27(6):936–940.
Pion IA, Rigel DS, Garfinkel L, Silverman MK, Kopf AW. 1995. Occupation and the risk of malignant melanoma. Cancer 75(2 Suppl):637–644.
Pollan M, Lopez-Abente G. 1995. Wood-related occupations and laryngeal cancer. Cancer Detection & Prevention 19(3):250–257.
Poole C, Dreyer NA, Satterfield MH, Levin L, Rothman KJ. 1993. Kidney cancer and hydrocarbon exposures among petroleum refinery workers. Environmental Health Perspectives 101(Suppl 6):53–62.
Pope CA 3rd, Burnett RT, Thun MJ, Calle EE, Krewski D, Ito K, Thurston GD. 2002. Lung cancer, cardiopulmonary mortality, and long-term exposure to fine particulate air pollution. Journal of the American Medical Association 287(9):1132–1141.
Pope CA 3rd, Thun MJ, Namboodiri MM, Dockery DW, Evans JS, Speizer FE, Heath CW Jr. 1995. Particulate air pollution as a predictor of mortality in a prospective study of U.S. adults. American Journal of Respiratory and Critical Care Medicine 151(3 Pt 1):669–674.
Porru S, Aulenti V, Donato F, Boffetta P, Fazioli R, Cosciani Cunico S, Alessio L. 1996. Bladder cancer and occupation: A case-control study in northern Italy. Occupational and Environmental Medicine 53(1):6–10.
Pottern LM, Heineman EF, Olsen JH, Raffn E, Blair A. 1992. Multiple myeloma among Danish women: Employment history and workplace exposures. Cancer Causes & Control 3(5):427–432.
Pukkala E, Soderholm AL, Lindqvist C. 1994. Cancers of the lip and oropharynx in different social and occupational groups in Finland. European Journal of Cancer. Part B, Oral Oncology 30B(3):209–215.
Raabe GK, Collingwood KW, Wong O. 1998. An updated mortality study of workers at a petroleum refinery in Beaumont, Texas. American Journal of Industrial Medicine 33(1):61–81.
Rafnsson V, Gunaarsdottir H. 1991. Mortality among professional drivers. Scandinavian Journal of Work, Environment & Health 17(5):312–317.
Rebelakos A, Trichopoulos D, Tzonou A, Zavitsanos X, Velonakis E, Trichopoulos A. 1985. Tobacco smoking, coffee drinking, and occupation as risk factors for bladder cancer in Greece. Journal of the National Cancer Institute 75(3):455–461.
Ries, LAG, Eisner, MP, Kosary, CL Hankey BF, Miller, BA, Clegg, L, Mariotto, A, Fay, MP, Feuer, EJ, Edwards, BK, eds. 2003. SEER Cancer Statistics Review, 1975–2000. [Online]. Available: http://seer.cancer.gov/csr/1975_2000/ [accessed February 2, 2004].
Ries, LAG, Eisner, MP, Kosary, CL, Hankey BF, Miller, BA, Clegg, L, Mariotto, A, Feuer, EJ, Edwards, BK, eds. 2004. SEER Cancer Statistics Review, 1975–2001. [Online]. Available: http://seer.cancer.gov/csr/1975_2001/ [accessed July 15, 2004].
Rigolin GM, Cuneo A, Roberti MG, Bardi A, Bigoni R, Piva N, Minotto C, Agostini P, De Angeli C, Del Senno L, Spanedda R, Castoldi G. 1998. Exposure to myelotoxic agents and myelodysplasia: Case-control study and correlation with clinicobiological findings. British Journal of Haematology 103(1):189–197.
Risch HA, Burch JD, Miller AB, Hill GB, Steele R, Howe GR. 1988. Occupational factors and the incidence of cancer of the bladder in Canada. British Journal of Industrial Medicine 45(6):361–367.
Ritchie G, Still K, Rossi J 3rd, Bekkedal M, Bobb A, Arfsten D. 2003. Biological and health effects of exposure to kerosene-based jet fuels and performance additives. Journal of Toxicology and Environmental Health B Critical Review 6(4):357–451.
Ritz B. 1999. Cancer mortality among workers exposed to chemicals during uranium processing. Journal of Occupational and Environmental Medicine. 41(7):556–566.
Rosamilia K, Wong O, Raabe GK. 1999. A case-control study of lung cancer among refinery workers. Journal of Occupational and Environmental Medicine 41(12):1091–1103.
Saverin R, Braunlich A, Dahmann D, Enderlein G, Heuchert G. 1999. Diesel exhaust and lung cancer mortality in potash mining. American Journal of Industrial Medicine 36(4):415–422.
Schairer C, Hartge P, Hoover RN, Silverman DT. 1988. American Journal of Epidemiology 128(5):1027–1037.
Schlehofer B, Heuer C, Blettner M, Niehoff D, Wahrendorf J. 1995. Occupation, smoking and demographic factors, and renal cell carcinoma in Germany. International Journal of Epidemiology 24(1):51–57.
Schnatter AR, Armstrong TW, Nicolich MJ, Thompson FS, Katz AM, Huebner WW, Pearlman ED. 1996. Lymphohaematopoietic malignancies and quantitative estimates of exposure to benzene in Canadian petroleum distribution workers. Occupational and Environmental Medicine 53(11):773–781.
Schnatter AR, Katz AM, Nicolich MJ, Theriault G. 1993. A retrospective mortality study among Canadian petroleum marketing and distribution workers. Environmental Health Perspectives 101(Suppl 6):85–99.
Schnatter AR, Theriault G, Katz AM, Thompson FS, Donaleski D, Murray N. 1992. A retrospective mortality study within operating segments of a petroleum company. American Journal of Industrial Medicine 22(2):209–229.
Schoenberg JB, Stemhagen A, Mogielnicki AP, Altman R, Abe T, Mason TJ. 1984. Case-control study of bladder cancer in New Jersey. I. Occupational exposures in white males. Journal of the National Cancer Institute 72(5):973–981.
Schumacher MC, Slattery ML, West DW. 1989. Occupation and bladder cancer in Utah. American Journal of Industrial Medicine 16(1):89–102.
Seidler A, Heiskel H, Bickeboller R, Elsner G. 1998. Association between diesel exposure at work and prostate cancer. Scandinavian Journal of Work, Environment & Health 24(6):486–494.
Shallenberger LG, Acquavella JF, Donaleski D. 1992. An updated mortality study of workers in three major United States refineries and chemical plants. British Journal of Industrial Medicine 49(5):345–354.
Sharpe CR, Rochon JE, Adam JM, Suissa S. 1989. Case-control study of hydrocarbon exposures in patients with renal cell carcinoma. Canadian Medical Association Journal 140(11):1309–1318.
Shen XB, Wang GX, Huang YZ, Xiang LS, Wang XH. 1996. Analysis and estimates of attributable risk factors for lung cancer in Nanjing, China. Lung Cancer 14(Suppl 1):S107–S112.
Shen XB, Wang GX, Zhou BS. 1998. Relation of exposure to environmental tobacco smoke and pulmonary adenocarcinoma in non-smoking women: A case control study in Nanjing. Oncology Reports. 5(5):1221–1223.
Siemiatycki J, Dewar R, Nadon L, Gerin M. 1994. Occupational risk factors for bladder cancer: Results from a case-control study in Montreal, Quebec, Canada. American Journal of Epidemiology 140(12):1061–1080.
Siemiatycki J, Dewar R, Nadon L, Gerin M, Richardson L, Wacholder S. 1987a. Associations between several sites of cancer and twelve petroleum-derived liquids. Results from a case-referent study in Montreal. Scandinavian Journal of Work, Environment & Health 13(6):493–504.
Siemiatycki J, Gerin M, Stewart P, Nadon L, Dewar R, Richardson L. 1988. Associations between several sites of cancer and ten types of exhaust and combustion products. Results from a case-referent study in Montreal. Scandinavian Journal of Work, Environment & Health 14(2):79–90.
Siemiatycki J, Wacholder S, Richardson L, Dewar R, Gerin M. 1987b. Discovering carcinogens in the occupational environment. Methods of data collection and analysis of a large case-referent monitoring system. Scandinavian Journal of Work, Environment & Health 13(6):486–492.
Silverman DT, Hoover RN, Albert S, Graff KM. 1983. Occupation and cancer of the lower urinary tract in Detroit. Journal of the National Cancer Institute 70(2):237–245.
Silverman DT, Hoover RN, Mason TJ, Swanson MG. 1986. Motor exhaust-related occupations and bladder cancer. Cancer Research 46(4 II):2113–2116.
Silverman DT, Levin LI, Hoover RN. 1989a. Occupational risks of bladder cancer in the United States: II. Nonwhite men. Journal of the National Cancer Institute 81(19):1480–1483.
Silverman DT, Levin LI, Hoover RN. 1990. Occupational risks of bladder cancer among white women in the United States. American Journal of Epidemiology 132(3):453–461.
Silverman DT, Levin LI, Hoover RN, Hartge P. 1989b. Occupational risks of bladder cancer in the United States: I. White men. Journal of the National Cancer Institute 81(19):1472–1480.
Simonato L, Zambon P, Ardit S, Della Sala S, Fila G, Gaborieau V, Gallo G, Magarotto G, Mazzini R, Pasini L, Stracca Pansa V, Sella Della S. 2000. Lung cancer risk in Venice: a population-based case-control study. [Erratum appears in Eur J Cancer Prev 2000 9(2):135. Note: Sella Della S corrected to Della Sala S]. European Journal of Cancer Prevention 9(1):35–39.
Skov T, Lynge E. 1991. Non-Hodgkin’s lymphoma and occupation in Denmark. Scandinavian Journal of Social Medicine 19(3):162–169.
Smith EM, Miller ER, Woolson RF, Brown CK. 1985. Bladder cancer risk among auto and truck mechanics and chemically related occupations. American Journal of Public Health 75(8):881–883.
Smith TC, Heller JM, Hooper TI, Gackstetter GD, Gray GC. 2002. Are Gulf War veterans experiencing illness due to exposure to smoke from Kuwaiti oil well fires? Examination of Department of Defense hospitalization data. American Journal of Epidemiology 155(10):908–917.
Smith TJ, Hammond SK, Wong O. 1993. Health effects of gasoline exposure. I. Exposure assessment for U.S. distribution workers. Environmental Health Perspectives 101(Suppl 6):13–21.
Soll-Johanning H, Bach E, Jensen SS. 2003. Lung and bladder cancer among Danish urban bus drivers and tramway employees: A nested case-control study. Occupational Medicine 53(1):25–33.
Soll-Johanning H, Bach E, Olsen JH, Tuchsen F. 1998. Cancer incidence in urban bus drivers and tramway employees: a retrospective cohort study. Occupational & Environmental Medicine 55(9):594–598.
Spiegelman D, Wegman DH. 1985. Occupation-related risks for colorectal cancer. Journal of the National Cancer Institute 75(5):813–821.
Steenland K, Deddens J, Stayner L. 1998. Diesel exhaust and lung cancer in the trucking industry: exposure-response analyses and risk assessment. American Journal of Industrial Medicine 34(3):220–228.
Steenland NK, Silverman DT, Hornung RW. 1990. Case-control study of lung cancer and truck driving in the Teamsters Union. American Journal of Public Health 80(6):670–674.
Steineck G, Hagman U, Gerhardsson M, Norell SE. 1990a. Vitamin A supplements, fried foods, fat and urothelial cancer. A case-referent study in Stockholm in 1985–87. International Journal of Cancer 45(6):1006–1011.
Steineck G, Plato N, Alfredsson L, Norell SE. 1989. Industry-related urothelial carcinogens: Application of a job-exposure matrix to Census data. American Journal of Industrial Medicine 16(2):209–224.
Steineck G, Plato N, Gerhardsson M, Norell SE, Hogstedt C. 1990b. Increased risk of urothelial cancer in Stockholm during 1985–87 after exposure to benzene and exhausts. International Journal of Cancer 45(6):1012–1017.
Stemhagen A, Slade J, Altman R, Bill J. 1983. Occupational risk factors and liver cancer. A retrospective case-control study of primary liver cancer in New Jersey. American Journal of Epidemiology 117(4):443–454.
Swanson GM, Lin CS, Burns PB. 1993. Diversity in the association between occupation and lung cancer among black and white men. Cancer Epidemiology, Biomarkers and Prevention 2(4):313–320.
Stern FB, Lemen RA, Curtis RA. 1981. Exposure of motor vehicle examiners to carbon monoxide: A historical prospective mortality study. Archives of Environmental Health 36(2):59–65.
‘t Mannetje A, Kogevinas M, Chang-Claude J, Cordier S, Gonzalez CA, Hours M, Jockel KH, Bolm-Audorff U, Lynge E, Porru S, Donato F, Ranft U, Serra C, Tzonou A, Vineis P, Wahrendorf J, Boffetta P. 1999. Occupation and bladder cancer in European women. Cancer Causes and Control 10(3):209–217.
Teschke K, Morgan MS, Checkoway H, Franklin G, Spinelli JJ, van Belle G, Weiss NS. 1997. Surveillance of nasal and bladder cancer to locate sources of exposure to occupational carcinogens. Occupational and Environmental Medicine 54(6):443–451.
Vagero D, Swerdlow AJ, Beral V. 1990. Occupation and malignant melanoma: A study based on cancer registration data in England and Wales and in Sweden. British Journal of Industrial Medicine 47(5):317–324.
Van Den Eeden SK, Friedman GD. 1993. Exposure to engine exhaust and risk of subsequent cancer. Journal of Occupational Medicine 35(3):307–311.
van Loon AJ, Kant IJ, Swaen GM, Goldbohm RA, Kremer AM, van den Brandt PA. 1997. Occupational exposure to carcinogens and risk of lung cancer: Results from The Netherlands cohort study. Occupational and Environmental Medicine 54(11):817–824.
Vasama-Neuvonen K, Pukkala E, Paakkulainen H, Mutanen P, Weiderpass E, Boffetta P, Shen N, Kauppinen T, Vainio H, Partanen T. 1999. Ovarian cancer and occupational exposures in Finland. American Journal of Industrial Medicine 36(1):83–89.
Vaughan TL. 1989. Occupation and squamous cell cancers of the pharynx and sinonasal cavity. American Journal of Industrial Medicine 16(5):493–510.
Velema JP, Ferrera A, Figueroa M, Bulnes R, Toro LA, de Barahona O, Claros JM, Melchers WJ. 2002. Burning wood in the kitchen increases the risk of cervical neoplasia in HPV-infected women in Honduras. International Journal of Cancer 97(4):536–541.
Vena JE. 1982. Air pollution as a risk factor in lung cancer. American Journal of Epidemiology 116(1):42–56.
Viadana E, Bross ID, Houten L. 1976. Cancer experience of men exposed to inhalation of chemicals or to combustion products. Journal of Occupational Medicine 18(12):787–792.
Vineis P, Magnani C. 1985. Occupation and bladder cancer in males: a case-control study. International Journal of Cancer 35(5):599–606.
Vineis P, Thomas T, Hayes RB, Blot WJ, Mason TJ, Pickle LW, Correa P, Fontham ET, Schoenberg J. 1988. Proportion of lung cancers in males, due to occupation, in different areas of the USA. International Journal of Cancer 42(6):851–856.
Weiderpass E, Pukkala E, Vasama-Neuvonen K, Kauppinen T, Vainio H, Paakkulainen H, Boffetta P, Partanen T. 2001. Occupational exposures and cancers of the endometrium and cervix uteri in Finland. American Journal of Industrial Medicine 39(6):572–580.
Weinberg GB, Kuller LH, Stehr PA. 1985. A case-control study of stomach cancer in a coal mining region of Pennsylvania. Cancer 56(3):703–713.
West RR, Stafford DA, Farrow A, Jacobs A. 1995. Occupational and environmental exposures and myelodysplasia: A case-control study. Leukemia Research 19(2):127–139.
WHO (World Health Organization). 2003. World Health Report 2003—Shaping the Future. [Online]. Available: http://www.who.int/whr/2003/en/Annex2-en.pdf [accessed January 14, 2004].
Williams AR, Weiss NS, Koepsell TD, Lyon JL, Swanson GM. 1989. Infectious and noninfectious exposures in the etiology of light chain myeloma: A case-control study. Cancer Research 49(14):4038–4041.
Wong O, Harris F, Rosamilia K, Raabe GK. 2001. An updated mortality study of workers at a petroleum refinery in Beaumont, Texas, 1945 to 1996. Journal of Occupational and Environmental Medicine 43(4):384–401.
Wong O, Harris F, Smith TJ. 1993. Health effects of gasoline exposure. II. Mortality patterns of distribution workers in the United States. Environmental Health Perspectives 101(Suppl 6):63–76.
Wong O, Morgan RW, Kheifets L, Larson SR, Whorton MD. 1985. Mortality among members of a heavy construction equipment operators union with potential exposure to diesel exhaust emissions. British Journal of Industrial Medicine 42(7):435–48.
Wong O, Trent L, Harris F. 1999. Nested case-control study of leukaemia, multiple myeloma, and kidney cancer in a cohort of petroleum workers exposed to gasoline. Occupational and Environmental Medicine 56(4):217–221.
Wortley P, Vaughan TL, Davis S, Morgan MS, Thomas DB. 1992. A case-control study of occupational risk factors for laryngeal cancer. British Journal of Industrial Medicine 49(12):837–844.
Wu-Williams AH, Dai XD, Blot W, Xu ZY, Sun XW, Xiao HP, Stone BJ, Yu SF, Feng YP, Ershow AG. 1990a. Lung cancer among women in north-east China. British Journal of Cancer 62(6):982–987.
Wu-Williams AH, Yu MC, Mack TM. 1990b. Life-style, workplace, and stomach cancer by subsite in young men of Los Angeles County. Cancer Research 50(9):2569–2576.
Wu-Williams AH, Xu ZY, Blot WJ, Dai XD, Louie R, Xiao HP, Stone BJ, Sun XW, Yu SF, Feng YP, Fraumeni Jr JF, Henderson BE. 1993. Occupation and lung cancer risk among women in Northern China. American Journal of Industrial Medicine 24(1):67–79.
Xu Z, Brown LM, Pan GW, Liu TF, Gao GS, Stone BJ, Cao R-M, Guan DX, Sheng JH, Yan ZS, Dosemeci M, Fraumeni JF Jr, Blot WJ. 1996b. Cancer risks among iron and steel workers in Anshan, China, part II: Case-control studies of lung and stomach cancer. American Journal of Industrial Medicine 30(1):7–15.
Xu ZY, Blot WJ, Xiao HP, Wu A, Feng YP, Stone BJ, Sun J, Ershow AG, Henderson BE, Fraumeni JF Jr. 1989. Smoking, air pollution, and the high rates of lung cancer in Shenyang, China. Journal of the National Cancer Institute 81(23):1800–1806.
Xu ZY, Brown L, Pan GW, Li G, Feng YP, Guan DX, Liu TF, Liu LM, Chao RM, Sheng JH, Gao GC. 1996a. Lifestyle, environmental pollution and lung cancer in cities of Liaoning in northeastern China. Lung Cancer 14(Suppl 1):S149–S160.
Yang CY, Cheng MF, Chiu JF, Tsai SS. 1999. Female lung cancer and petrochemical air pollution in Taiwan. Archives of Environmental Health 54(3):180–185.
Yu MC, Garabrant DH, Huang TB, Henderson BE. 1990. Occupational and other non-dietary risk factors for nasopharyngeal carcinoma in Guangzhou, China. International Journal of Cancer 45(6):1033–1039.
Zahm SH, Brownson RC, Chang JC, Davis JR. 1989. Study of lung cancer histologic types, occupation, and smoking in Missouri. American Journal of Industrial Medicine 15(5):565–578.
Zahm SH, Hartge P, Hoover R. 1987. The National Bladder Cancer Study: Employment in the chemical industry. Journal of the National Cancer Institute 79(2):217–222.
Zeegers MP, Swaen GM, Kant I, Goldbohm RA, van den Brandt PA. 2001. Occupational risk factors for male bladder cancer: Results from a population based case cohort study in the Netherlands. Occupational and Environmental Medicine 58(9):590–596.
Zheng T, Cantor KP, Zhang Y, Lynch CF. 2002. Occupation and bladder cancer: A population-based, case-control study in Iowa. Journal of Occupational and Environmental Medicine 44(7):685–691.
Zheng W, Blot WJ, Shu XO, Diamond EL, Gao YT, Ji BT, Fraumeni JF Jr. 1992. Risk factors for oral and pharyngeal cancer in Shanghai, with emphasis on diet. Cancer Epidemiology, Biomarkers and Prevention 1(6):441–448.
Zheng W, Shu XO, Ji BT, Gao YT. 1996. Diet and other risk factors for cancer of the salivary glands: A population-based case-control study. International Journal of Cancer 67(2):194–198.
Zheng YM, Tuppin P, Hubert A, Jeannel D, Pan YJ, Zeng Y, De The G. 1994. Environmental and dietary risk factors for nasopharyngeal carcinoma: A case-control study in Zangwu County, Guangxi, China. British Journal of Cancer 69(3):508–514.
Zhong L, Goldberg MS, Gao YT, Jin F. 1999. Lung cancer and indoor air pollution arising from Chinese-style cooking among nonsmoking women living in Shanghai, China. Epidemiology 10(5):488–494.


