National Academies Press: OpenBook
« Previous: Appendix G Acronyms
Suggested Citation:"Color Plates." National Research Council. 2004. Utilization of Operational Environmental Satellite Data: Ensuring Readiness for 2010 and Beyond. Washington, DC: The National Academies Press. doi: 10.17226/11187.
×

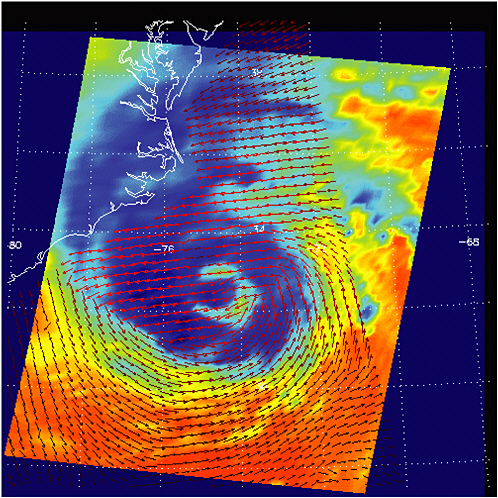
PLATE 1 Hurricane Isabel on September 13, 2003. The red vectors in the image show Isabel’s surface winds as measured by the SeaWinds scatterometer on ADEOS-2, and the background colors show the temperature of clouds and surface, as viewed in the infrared by AIRS. Light blue areas show adjacent cold clouds’ tops associated with strong thunderstorms embedded within the storm. SOURCE: Courtesy of NASA Jet Propulsion Laboratory.

Suggested Citation:"Color Plates." National Research Council. 2004. Utilization of Operational Environmental Satellite Data: Ensuring Readiness for 2010 and Beyond. Washington, DC: The National Academies Press. doi: 10.17226/11187.
×

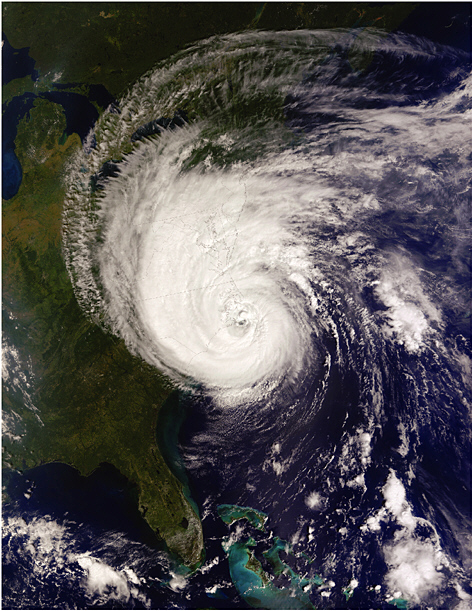
PLATE 2 Hurricane Isabel as it approached landfall on the outer banks of North Carolina on September 18, 2003. The image is a true-color (red-green-blue) NASA image taken by the Moderate-resolution Imaging Spectroradiometer (MODIS)—the research equivalent of the Visible and Infrared Imager/ Radiometer Suite (VIIRS) to be flown on NPP and operationally by NPOESS in three orbit planes (with global coverage every 4 hours) beginning in 2009. SOURCE: Courtesy of NASA Goddard Space Flight Center.

Suggested Citation:"Color Plates." National Research Council. 2004. Utilization of Operational Environmental Satellite Data: Ensuring Readiness for 2010 and Beyond. Washington, DC: The National Academies Press. doi: 10.17226/11187.
×

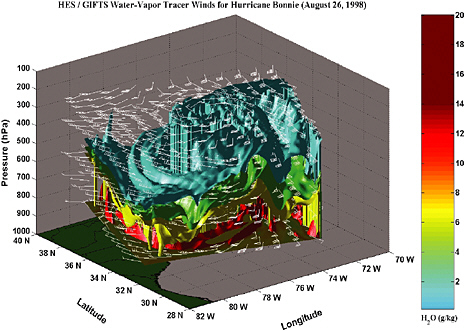
PLATE 3 Example of a future capability to be delivered with the Hyperspectral Environmental Suite (HES) on GOES-R in 2012: four-dimensional water vapor structure and wind profiling, in this case water-vapor tracer winds (the tracking of moisture features on constant-altitude surfaces determined by retrieval analyses) for Hurricane Bonnie (August 26, 1998). This simulation demonstrates the power of hyperspectral atmospheric profiling of temperature, moisture, and winds. Compared with the current operational system, the new capability will provide greatly improved spatial resolution, more rapid temporal refresh, and finer vertical resolution through increased spectral information content. SOURCE: Bormin Huang, University of Wisconsin-Madison.

Suggested Citation:"Color Plates." National Research Council. 2004. Utilization of Operational Environmental Satellite Data: Ensuring Readiness for 2010 and Beyond. Washington, DC: The National Academies Press. doi: 10.17226/11187.
×

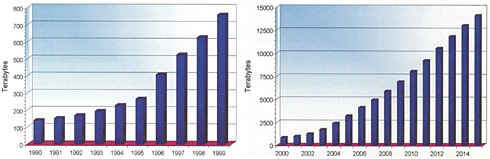
PLATE 4 Archive growth during the 1990s and 15-year projected archive growth. SOURCE: NOAA, 2001, The Nation’s Environmental Data: Treasures at Risk, Report to Congress on the Status and Challenges for NOAA’s Environmental Data Systems (A. Hittelman and I. Hakkarinen, eds.), U.S. Department of Commerce, National Oceanic and Atmospheric Administration, August 2001, p. viii. Available online at http://www.ngdc.noaa.gov/noaa_pubs/treasures.shtml.

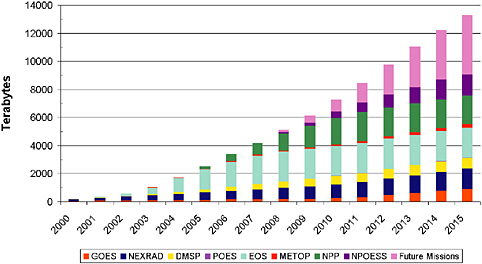
PLATE 5 Major systems archive growth from 2000 to 2015. SOURCE: NOAA, 2001, The Nation’s Environmental Data: Treasures at Risk, Report to Congress on the Status and Challenges for NOAA’s Environmental Data Systems (A. Hittelman and I. Hakkarinen, eds.), U.S. Department of Commerce, National Oceanic and Atmospheric Administration, August 2001, p. 16. Available online at http://www.ngdc.noaa.gov/noaa_pubs/treasures.shtml.

Suggested Citation:"Color Plates." National Research Council. 2004. Utilization of Operational Environmental Satellite Data: Ensuring Readiness for 2010 and Beyond. Washington, DC: The National Academies Press. doi: 10.17226/11187.
×

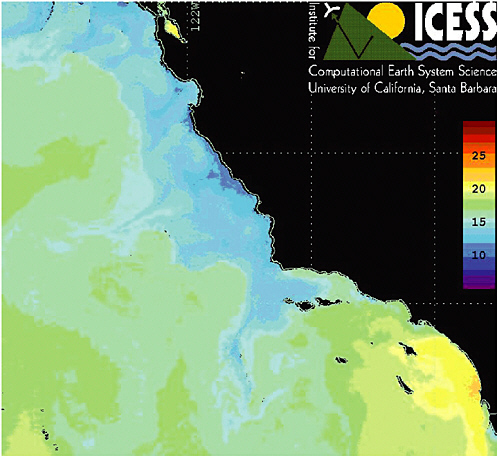
PLATE 6 Sample Advanced Very High Resolution Radiometer (AVHRR) composite (5-day) mean sea-surface temperature, Pacific Ocean, California, September 11, 2002 (the color bar is temperature in degrees Celsius). Image courtesy of the Institute for Computational Earth System Science (ICESS), University of California, Santa Barbara.

Suggested Citation:"Color Plates." National Research Council. 2004. Utilization of Operational Environmental Satellite Data: Ensuring Readiness for 2010 and Beyond. Washington, DC: The National Academies Press. doi: 10.17226/11187.
×

PLATE 7 Sample AVHRR snow-cover image, Sierra Nevada, California, March 19, 2003 (NOAA-17 satellite, channel 1,2,3A color composite, snow is cyan). Image courtesy of the Institute for Computational Earth System Science (ICESS), University of California, Santa Barbara.

Suggested Citation:"Color Plates." National Research Council. 2004. Utilization of Operational Environmental Satellite Data: Ensuring Readiness for 2010 and Beyond. Washington, DC: The National Academies Press. doi: 10.17226/11187.
×

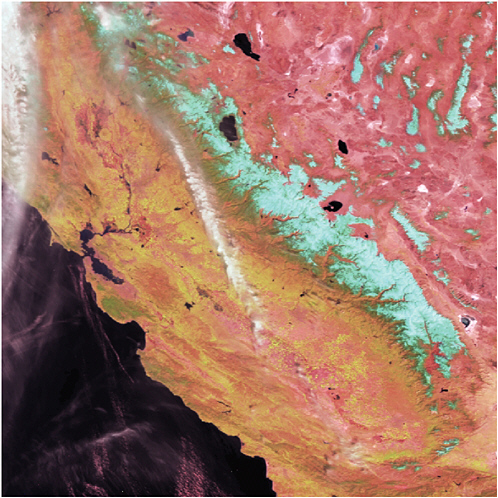
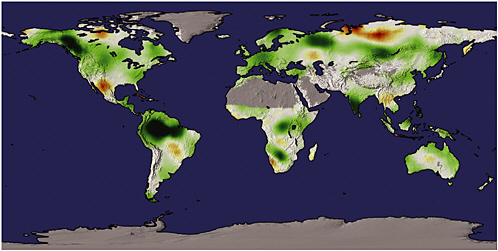
PLATE 8 Change in global terrestrial net primary production from 1982 to 1999. SOURCE: Reprinted with permission from R. Nemani, C. Keeling, H. Hashimoto, W. Jolly, S. Piper, C. Tucker, R. Myneni, and S. Running. 2003. “Climate-Driven Increases in Global Terrestrial Net Primary Production from 1982 to 1999,” Science 300:1560-1563. Copyright 2003 AAAS.

Suggested Citation:"Color Plates." National Research Council. 2004. Utilization of Operational Environmental Satellite Data: Ensuring Readiness for 2010 and Beyond. Washington, DC: The National Academies Press. doi: 10.17226/11187.
×

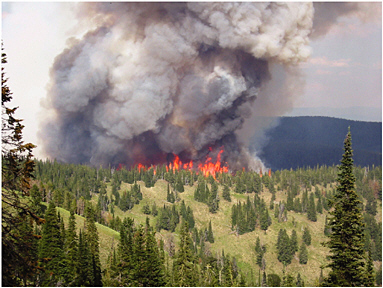
PLATE 9 The MODIS Rapid Response system (http://rapidfire.sci.gsfc.nasa.gov/) has proven effective as a decision support tool for fighting large forest fires, such as the one pictured here in Montana. SOURCE: Courtesy of Lloyd Queen, University of Montana.

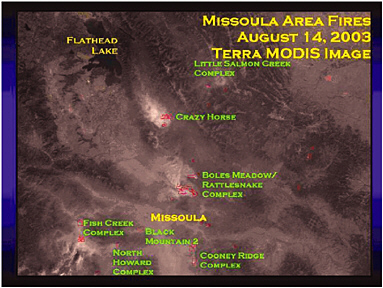
PLATE 10 Terra MODIS (Moderate-resolution Imaging Spectroradiometer) satellite image of fires in the area around Missoula, Montana, August 2003. SOURCE: Courtesy of Lloyd Queen, University of Montana.

Suggested Citation:"Color Plates." National Research Council. 2004. Utilization of Operational Environmental Satellite Data: Ensuring Readiness for 2010 and Beyond. Washington, DC: The National Academies Press. doi: 10.17226/11187.
×
Page 161
Suggested Citation:"Color Plates." National Research Council. 2004. Utilization of Operational Environmental Satellite Data: Ensuring Readiness for 2010 and Beyond. Washington, DC: The National Academies Press. doi: 10.17226/11187.
×
Page 162
Suggested Citation:"Color Plates." National Research Council. 2004. Utilization of Operational Environmental Satellite Data: Ensuring Readiness for 2010 and Beyond. Washington, DC: The National Academies Press. doi: 10.17226/11187.
×
Page 163
Suggested Citation:"Color Plates." National Research Council. 2004. Utilization of Operational Environmental Satellite Data: Ensuring Readiness for 2010 and Beyond. Washington, DC: The National Academies Press. doi: 10.17226/11187.
×
Page 164
Suggested Citation:"Color Plates." National Research Council. 2004. Utilization of Operational Environmental Satellite Data: Ensuring Readiness for 2010 and Beyond. Washington, DC: The National Academies Press. doi: 10.17226/11187.
×
Page 165
Suggested Citation:"Color Plates." National Research Council. 2004. Utilization of Operational Environmental Satellite Data: Ensuring Readiness for 2010 and Beyond. Washington, DC: The National Academies Press. doi: 10.17226/11187.
×
Page 166
Suggested Citation:"Color Plates." National Research Council. 2004. Utilization of Operational Environmental Satellite Data: Ensuring Readiness for 2010 and Beyond. Washington, DC: The National Academies Press. doi: 10.17226/11187.
×
Page 167
Suggested Citation:"Color Plates." National Research Council. 2004. Utilization of Operational Environmental Satellite Data: Ensuring Readiness for 2010 and Beyond. Washington, DC: The National Academies Press. doi: 10.17226/11187.
×
Page 168
Utilization of Operational Environmental Satellite Data: Ensuring Readiness for 2010 and Beyond Get This Book
×
Buy Paperback | $58.00 Buy Ebook | $46.99
MyNAP members save 10% online.
Login or Register to save!
Download Free PDF
  1. ×

    Welcome to OpenBook!

    You're looking at OpenBook, NAP.edu's online reading room since 1999. Based on feedback from you, our users, we've made some improvements that make it easier than ever to read thousands of publications on our website.

    Do you want to take a quick tour of the OpenBook's features?

    No Thanks Take a Tour »
  2. ×

    Show this book's table of contents, where you can jump to any chapter by name.

    « Back Next »
  3. ×

    ...or use these buttons to go back to the previous chapter or skip to the next one.

    « Back Next »
  4. ×

    Jump up to the previous page or down to the next one. Also, you can type in a page number and press Enter to go directly to that page in the book.

    « Back Next »
  5. ×

    Switch between the Original Pages, where you can read the report as it appeared in print, and Text Pages for the web version, where you can highlight and search the text.

    « Back Next »
  6. ×

    To search the entire text of this book, type in your search term here and press Enter.

    « Back Next »
  7. ×

    Share a link to this book page on your preferred social network or via email.

    « Back Next »
  8. ×

    View our suggested citation for this chapter.

    « Back Next »
  9. ×

    Ready to take your reading offline? Click here to buy this book in print or download it as a free PDF, if available.

    « Back Next »
Stay Connected!