
5
Critical Factors Driving the Evolution of Operational Satellite Data Management Responsibilities
It is clear that, because of the growing multiplicity of environmental satellite data users, a “one size fits all” system will not provide the desired utilization of the data. Similarly, some factors and/or attributes critical to some in a versatile serving system will not be needed by, or even benefit, all of the user applications. This chapter identifies the driving requirements for operational data system management, captures the principal critical factors, and provides references to user segments where they are definitely required.
REAL-TIME PROCESSING
Latency—the amount of time it takes to progress from photons into the sensor to useful data products in the hands of the users—is a measure of product quality that is as significant as accuracy, precision, long-term stability, and spatial-temporal resolution. Product timeliness is a leading priority for operational users, numerical weather prediction centers, National Weather Service field office forecasters, the forest services, marine warnings and surveillance, and FEMA/homeland security. Getting the information to users involves the practical handling of:
-
Data volume—ability to process and disseminate,
-
Data reduction and fusion—knowledge extraction within an enterprise IT architecture,
-
Integration of satellite data and information into decision aids, and
-
Integrated sensor training to achieve the optimal use of information in operations.1
Several examples serve to illustrate the criticality of real-time processing. First, consider weather forecasting. Numerical weather prediction models are scheduled to be run twice daily, and they use the most recent data available at the time of execution. The fresher the data, the better the forecast, and the sooner the forecast is available for use, the more utility it provides. Louis Uccellini, director of the National Centers for Environmental Prediction (NCEP), stated, “Products have a 2.5 hour shelf-life—anything you can do to compress the front end that can give me minutes on the back end is critical.” For example at the local level, where a field-office meteorologist is assessing lifted index or convective available potential energy (CAPE) between clouds or near an approaching cold front (both are measures of severe thunderstorm potential), fine spatial resolution and timeliness are tied for the highest priority.
During the summers of 2001, 2002, and 2003 the collaboration of NASA, the U.S. Forest Service, and the University of Maryland streamlined the direct reception, immediate processing, and distribution of 250-m MODIS data identifying fire activity and perimeters directly to the National Interagency Fire Center in Boise, as well as to Regional Fire Coordination Centers (see in Appendix D the section titled “MODIS Fire Rapid Response System”).
The U.S. Navy’s Fleet Numerical Meteorology and Oceanography Center (FNMOC) and U.S. Air Force Weather Agency (AFWA) face equally challenging real-time applications and are engaged no less than the civilian side in the utilization of both operational and research products for operational exploitation. For example, on March 23, 2003, when a frontal passage over Iraq introduced deteriorating conditions over Baghdad, the Air Force stopped operations and Navy ships took over all operations in support of ground troops. “We are currently using the [Satellite Focus] products to determine the Abe’s track to safely support the mission,” stated AG2 Anthony Wade, USS ABRAHAM LINCOLN (CVN-72). “We check the [Satellite Focus] website twice per day…. thank you for the support, it has been helpful to us out here…. We use this [MODIS dust product] to monitor dust events over Iraq and the NAG and it is an awesome product,” stated AGC Steven Cole, USS KITTY HAWK (CV-63).2 For the Forest Service, using data taken four times daily by NASA’s Moderate-resolution Imaging Spectroradiometer (MODIS) instruments flying on the Terra and Aqua platforms and processed and made available by the University
of Maryland as well as through direct broadcast, provides critical information to manage emergency response to emerging and evolving fire threats.
It is clear that, for these classes of operational users, real-time, or near-real-time, processing is a critical factor in the utility of environmental satellite data. There is value in reducing system latency until, as a goal, a pixel of information appears on a user’s display as the corresponding detector is read out on orbit. As a philosophy, no system should be designed or implemented that unnecessarily adds latency into the end-to-end data stream. Here, the system level includes sensor tasking, processing, exploitation, and dissemination, including the time taken to command the acquisition of needed data, delays within sensor and satellite, buffering and delays in the satellite-to-ground downlink, delays in collection of all satellite and ancillary data at the processing centrals, the wall-clock time required to produce the end products, and the time required to notify the end users and deliver the valid products to their workstations.
Reduction of latency is an area ripe for exploitation in data system management. Current POES systems typically use infrequent contacts with polar ground stations or data relay satellites. This introduces one to two orbits (1 to 3 hours) of delay into the data acquisition even before the ground processing begins. The NPOESS implementation, termed “SafetyNet,” leverages the global presence of high-bandwidth fiber optic cable. Not only is the solution cheaper than today’s traditional approaches, but the globally distributed network of 15 receptors are also linked to processing centrals via commercial fiber to enable both low data latency and high data availability. Facilitated by the near-instantaneous and near-continuous data availability, ground processing executes efficiently, producing and delivering the first environmental satellite data products less than 4 minutes after they are sensed on orbit, completing more than 60 percent in 10 minutes, and 95 percent of the products in less than half an hour.
DATA STREAM AND PRODUCT TRANSPARENCY
Transparency is critical and has several applicable definitions. In one context, the term “transparency” means that users are unaware of, and unconcerned with, the system supporting their data utilization. This includes transparent data interfaces efficiently handling the tasking, processing, storage, formatting, exploitation, delivery, visualization, and decision support systems. An example of transparency is dial tone when you pick up your telephone receiver; another is the link between a computer keyboard and the screen where the character you just typed is displayed. One gives no thought to the complex systems that connect your action to the response—unless they don’t work transparently. This simple concept has significant implications. Beyond simple latency, this implies a relentless focus on total customer
satisfaction. It mandates intuitive user interfaces, pervasive (“anywhere, anytime”) access, immediate response, and delivery of the requested data—and no more than the requested data—at the requested resolution and in the “right” data formats. In today’s technology, this suggests Web-enabled technologies, backed-up total interoperability, and the maximum possible online storage, with the custom ordering of data (e.g., spatial, spectral, and/or temporal subsetting and subsampling) designed in. Portal technologies (e.g., “My NOAA”) can facilitate this, greeting the “customer” with announcements of available—and even recommended—data, and remembering recent orders and preferences. Commercial providers such as Amazon.com provide glimpses of this new operational concept.
Transparency has a second context: the provision of comprehensive metadata that enables user high-level and drill-down capability for insight into the complete pedigree of a product, algorithm theoretical basis, sensor, calibration, ancillary data, and processing path, with error budgets all available on the Web. Taken as a whole, this information empowers the environmental satellite data users as comprehensive authorities on the products they are using. It also mandates a comprehensive product/ algorithm revision history. Transparency also means that research and operations are managed as a continuum, with continuous improvement designed into the operations concept such that engaged researchers anticipate, and underpin, improved operational requirements satisfaction. Finally, it means transparent and efficient user interfaces to proactively and iteratively collect, understand, and embrace operational users’ requirements and feedback.
DATA ARCHIVING AND RETRIEVAL
Meeting NOAA’s NPOESS and GOES-R system goals will require a re-examination of how NOAA will do its weather business, its ocean business, its land business, and in fact the entirety of its environmental data business, to achieve full system potential. EOSDIS provides perhaps the premier example for environmental satellite data archiving and retrieval. The lessons learned on EOSDIS (see “The Experience with EOSDIS,” in Chapter 3) brought about profound changes in the data system’s topology and architecture at all levels.3 The potential to improve performance will require rethinking much of the existing architecture and an end-to-end process from satellite system and instrument design (data utilization experts at the table) to end-user data utilization (satellite and instrument characterization engineers at the table). As described in “Making It Easier to Use Environmental Satellite Data,” in Chapter 3,
the committee believes that the operations concept for data distribution should be built around tailoring products to the system’s and users’ processing, storage, distribution, communications resources, and information requirements, to include:
-
Direct broadcast,
-
Subsetting,
-
Subsampling,
-
Subscriptions,
-
Search and order,
-
Peer-to-peer access interfaces,
-
Tailored delivery,
-
Data assurance,
-
Short-term storage to meet the immediate user needs, and
-
Long-term archiving to enable product improvements through reanalysis, reprocessing, and new product development.
GEOSPATIAL ONE-STOP
Compliance with Geospatial One-Stop is discussed in “Geospatial One-Stop,” in Chapter 4.
REPROCESSING
Operational timelines rightfully dictate that products be generated on rigid schedules to meet immediate end-user expectations. A purely operational weather forecasting system requires a minimum data throughput (after allowance for maintenance and repair) equal to the rate of data acquisition to avoid accumulating irreducible backlogs.
Frequently, whether science-initiated or a correction to repair an anomaly or error, operational algorithms are improved, refined, or otherwise revised or replaced. In addition, improved externally supplied, ancillary data are not fully available or available at their best quality in near real time. Every change to an algorithm, be it the theoretical basis or even the exception handling, breaks the continuity of the measurement time-series, even as it improves the instantaneous product quality.
For end-user applications that depend on self-consistent long-term data records, for example to assess inter-annual variability, predict the onset of the next el Niño event, or conduct change detection and/or monitoring, it is critical that the changed algorithm signal in the measurement time-series database (“the noise”) not exceed the climate signal of interest. Recovery of this long-term measurement stability requires a reprocessing cycle using a consistent algorithm theoretical basis and implementation.
Traditionally, long-term data records—such as the 25-year total SBUV and TOMS ozone measurement record critical for assessing the growth and recovery of the Antarctic ozone hole—may undergo as many as 10 reprocessing cycles. The types of data users least concerned with reprocessing are associated with operational weather forecasting (environmental data records; EDRs) and four-dimensional data assimilation (using radiances and EDRs). Users most interested in reprocessed data sets include those involved with emerging operational climate forecasting and climate research. New remote sensing systems, such as NPOESS and GOES-R, will not fully meet NOAA climate data record (CDR) requirements, as discontinuities will be routine, and reprocessing is outside of the scope of the activity. The United States operates two satellites in geostationary orbits, over fixed equatorial positions (HES PORD; http://cimss.ssec.wisc.edu/goes/goes.html) (see in Appendix D the section “GOES Imager and Sounder” for details).
In these near-real-time operational data products, the sensor data records (SDRs) and EDRs, the leading signal will be the algorithm revision signal. For this very reason, NCEP performed a systematic re-analysis of its geopotential height data record to eliminate the false algorithm signal.4,5 While the NPOESS sensors are generally designed to assure long-term stability, as will be the case for GOES-R, improvements to on-orbit sensor characterizations/calibrations will not be retrospectively applied to the operational products, and this required long-term stability will be achieved only when the data are consistently reprocessed.
The SBUV/TOMS case study, and many similar projects, including SeaWiFS and MODIS, have demonstrated the importance of self-consistent long-term climate data sets. NOAA/NESDIS and downstream end users have a critical need for high-quality, long-term, self-consistent time-series. Their common attributes will be standard SDR/EDR/CDR algorithms, consistently applied, common sensor characterizations, refined and peer-reviewed sensor calibrations, the best possible ancillary data. Any reprocessed data must be available in a reasonably timely manner, and validated to assure the high quality that will stand up to rigorous peer review.
Environmental satellite data processing systems are sized to process a day’s worth of data in one day, or “1X.” Such a system would be insufficient for reprocess-
ing a multiyear data set. For reprocessing a measurement record of several months duration, 3X is quite appropriate. In order to permit new algorithm development for research or operations, new retrospective analyses to detect climate or other trends, and so on, the aggregate available data processing capacity/throughput devoted to the overall system must be several multiples of the real-time data acquisition and processing capacity required by the operational satellite systems. For a measurement record spanning years or more, 3X is barely sufficient, and the recommended minimum threshold accelerated rate would be 5X, with a goal of 10X. Achieving this throughput requires as much attention to input/output data handling as to the data processing core itself. The question then becomes where the additional capacity should be located (e.g., in specialized research or service centers), and who should fund that capacity.
All future environmental satellite data systems should have, whether integrated or associated, full capability for both processing and reprocessing. A compatible data system capable of delivering reprocessed data sets must be able to do so at affordable cost. It also must be an agile system that can be reconfigured to respond to evolving science and practice, with a high 5X+ throughput to cycle through large data sets in a reasonable time, with assured reliability to help NOAA succeed in its evolving operational role, and standards-based to facilitate interoperability and community collaboration. Because of computer technology evolution, such as Moore’s law and the equivalents, hardware refresh cycles built into the system design will provide faster reprocessing capabilities in proportion with the growing length of the environmental data set.
PRODUCT CHARACTERIZATION—ADDRESSING THE SKILL LEVELS OF USERS
The diverse environmental satellite data user community has equally diverse product characterization requirements. Not only do skill levels vary from lay person to experts in the field, but the required level of product characterization fidelity is also a function of the use to which the data are being put. A level of product characterization that is deficient with respect to the end user’s needs will result in reduced utilization, while fidelity better than required is not cost-effective. Increasingly, materials available on the Web, and Web-based training, provide excellent mechanisms for users to pull information. Combined with customized workshops and partnerships, these can form the basis for easily accessed product characterization information to the level required by each user. Here, the committee considers several user communities, and differentiates their various product characterization needs.
NWP Data Assimilation Centers
Louis Uccellini, director of the National Centers for Environmental Prediction, NWS, has said, “It’s not a question of if we use satellite data but how to make optimal use of all the data.” As Figure 5.1 illustrates, the operational use of environmental satellite data is increasing rapidly. The amount of received data, the blue curve in the figure, is increasing annually. The quality of the data, and its “freshness,” or latency, is also improving in parallel. The consequence is tremendous potential improvement in the quality of information available to a weather prediction model. Most of these data (green curve) pass the quality checks and can potentially be utilized. The red curve indicates the amount of data actually incorporated into the model’s initial state. The gap in current utilization of environmental satellite data is illustrated in the light blue area between the red and green curves. This gap
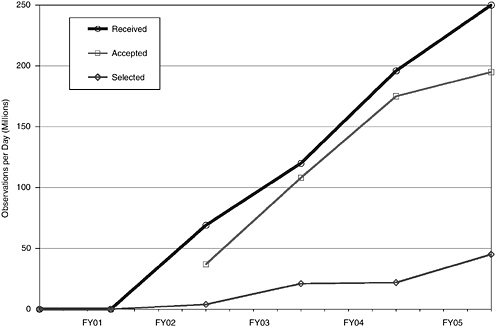
FIGURE 5.1 Use of operational satellite data over the past several years. SOURCE: “The Role of Satellite Data in Environmental Modeling,” Louis Uccellini, director, NCEP, presentation to the National Research Council Committee on Environmental Satellite Data Utilization, September 11, 2003.
does not reflect a failure, but rather an extraordinary opportunity. Note that even though the red curve shows less than 20 percent of the data collected, the roughly 50 million daily observations that remain provide for some 98 percent of the data ingested into the models.
The rejected data contain significant additional information—information that is independent from the data currently utilized. They include cloudy observations, over-land observations, and cases that involve more complex phenomenology. The limiting constraints are (1) our understanding of the theoretical basis for scientific algorithms to “make sense” of the information in the data; and (2) our understanding of the spatial, spectral, and radiometric characterization of the flight sensors. Together, these constitute a remote-sensing system-level product characterization, and the delivery of this understanding into the “hands” of the end users. Reducing this utilization gap will require a fully funded, end-to-end process from satellite/sensor/ system design (data utilization experts at the table) to data utilization (satellite/sensor engineers at the table). To accelerate use of research and operational satellite data in operational NWP models, the environmental satellite data teams must work with weather prediction operations staff as early in the process as possible, and continually coordinate in advance during operations so that processing changes don’t “break the system.”
NWP will always want to use promising new (and possibly complex) instruments. NWP’s job is made much easier
-
If the instrument is well characterized before launch, and
-
If a simulated data stream is available in near real time, for 6 to 12 months before launch.
This has been the case with AIRS, enabling us to be ready for operational implementation within a year or so of launch (see in Appendix D the ECMWF case study for details).
Additionally, other nations’ agencies, such as the U.K. Met Office, have a significantly larger number of trained staff in the environmental data assimilation area alone.
This nation is approaching a crisis stage in the data assimilation area—there are many new, advanced instruments in development for flight in the upcoming 5 to 10 years, but the system as currently staffed will be unable to handle them. Part of the answer is the Joint Center for Satellite Data Assimilation, created July 2, 2001. Partners include NOAA/NCEP/Environmental Modeling Center, NOAA/NESDIS/ Office of Research and Applications, NOAA/OAR/Office of Weather and Air Quality, NASA/Goddard Space Flight Center (GSFC)/Data Assimilation Office, NASA/GSFC/ Seasonal Interannual Prediction Project, U.S. Navy/Office of Naval Research, and
U.S. Air Force/Air Weather Agency. One goal of the center is to “accelerate use of research and operational satellite data in operational numerical prediction models,” reducing the average time for operational implementations of new satellite technology from 2 years to 1. This is a laudable goal, and one that will be best supported through a comprehensive end-to-end system and multimission perspective.
Operational Forecast Centers and Decision Support Systems
Operational forecast centers are diverse and include NOAA centers such as the NWS Storm Prediction Center (http://www.spc.noaa.gov/), NWS Aviation Weather Center (http://aviationweather.gov/), the NWS Tropical Prediction Center and National Hurricane Center (http://www.nhc.noaa.gov/), the many NWS local field offices, and other agencies including the Air Force Weather Agency (https://afweather.afwa.af.mil/ and http://www.af.mil/factsheets/factsheet.asp?fsID=157). The single most-important constraint for these operational users is the operational time line, and their chief interest is assured delivery of timely environmental satellite data to them. As Uccelini summed up, “The users will slap me on the back for meeting a 99.5 percent on-time delivery, not a small, incremental improvement in quality.” Secondarily, they require a characterization of the spatial, spectral, and radiometric properties of the sensors, and of the underlying sensing platform and algorithms.
With the initiation of NPOESS and GOES-R, with significant increases in data volume, product complexity, and underlying information content and potential, future operational forecasters will require a sufficient characterization of the information and products to enable their efficient and appropriate utilization. As an example, the current DOD polar orbiting imager returns a single reflective and emissive spectral band, whereas the NOAA POES and GOES imagers transmit five spectral bands. With 22-23 spectral bands of information on NPOESS VIIRS, and a planned 16 on the GOES-R imager, this is a factor of 5X to 10X greater complexity. The Advanced Baseline Imager (ABI) is the primary GOES-R cloud, land, and ocean imager. ABI is a significant upgrade to the current GOES imager capability, intended to provide enhanced spatial and temporal resolution and spectral capability to meet data product requirements described in the mission requirements document (MRD) for atmospheric, ocean, and land environmental sensing (ABI PORD) (see in Appendix D the section “GOES Imager and Sounder” for details). To this end, NPOESS has produced basic users’ guides to assist with the utilization of the imagery.6
|
6 |
See the NPOESS “User’s Guide for VIIRS Cloud Imagery Products, Version 5: March 2002,” available online at http://npoesslib.ipo.noaa.gov/atbd/viirs/Y2466b-Imagery-ATBD-v5.DOC. |
Research Users
Research users of satellite data make use of unique attributes of these data to investigate underlying physical phenomena. For example, small changes in the gravity field detected by NASA’s Gravity Recovery and Climate Experiment (GRACE) (http://www.csr.utexas.edu/grace/) can show important changes in the underlying aquifer over broad regions; inspection of the 12-year altimetry time-series over large reservoirs from NASA’s TOPEX/Poseidon and Jason missions (http://topexwww.jpl.nasa.gov/index.html), once the seasonal cycle is removed, shows variability of reservoir height over seasonal and inter-annual periods. These serve as proxies for agricultural efficiency. This altimetric data also has high value for oceanographers and climate scientists who use it to track sea-surface height changes linked to ENSO (http://topex-www.jpl.nasa.gov/science/el-nino.html) and longer-period variability in the ocean, including the rise of sea level associated with global warming (http://www.csr.utexas.edu/gmsl/main.html) and, by assimilating altimetric data into models, seek to improve forecasts of climate variability linked to the ocean (http://www.giss.nasa.gov/research/projects/cafe/summary.html). These analyses are possible only with the most detailed characterization of a product. Perhaps the most critical characterization element is that of long-term stability. Without reprocessing, often the leading signal in an environmental satellite data set is the manmade signal deriving from changes in sensor and algorithm. Only if these are understood can the data be effectively utilized. Product characterization for this class of user will require comprehensive descriptive information, termed “metadata,” that includes insight into all input data sets, algorithms, and look-up tables. Detailed information on the sensors’ spectroradiometric characterization (e.g., relative spectral response of each band) is also essential, even more so with the increased utilization of the radiances themselves for use in numerical assimilation schemes.
RESOURCES
Ready access, easy utilization, and assured preservation of our nation’s environmental satellite data are essential to achieving NOAA’s four mission goals, which directly relate to improving the quality of our weather forecasts, advanced notification of severe weather, understanding the impact of global climate change, sustaining an optimized long-term energy and agricultural policy, transportation management, and even homeland security planning and scenario development. The next generations of environmental satellites, NPOESS and GOES-R, represent a taxpayer investment in system development in excess of $10 billion.
The FY2004 budget from NASA for EOSDIS functions that are equivalent for the CLASS responsibilities of satellite Earth data archiving and distribution is $65 mil-
lion, of which $1.5 million is for CLASS. This figure provides a starting point for NOAA to estimate the future cost of a sufficient data system. This budget does not include platform mission operations, data downlinking, algorithm processing, or permanent archiving. As illustrated in other chapters of this report, the number of data products, data volumes, and numbers of users are all increasing rapidly, and in many cases exponentially. While computer hardware costs are also going down, the number of staff required to handle, document, and distribute these data sets will probably stay proportional to the number, complexity, and diversity of the products and level of support to be supplied to the users.
A number of recent analyses have raised the question as to whether NOAA can meet these data utilization needs. For example: (1) a 2001 NOAA report, The Nation’s Environmental Data: Treasures at Risk, states that the influx in volume of satellite and other environmental data will far exceed NOAA NESDIS archive and access capabilities; and (2) the General Accounting Office (GAO) has documented (GAO-02-684T-July 2002) that NOAA lacks a comprehensive plan and sufficient funding to address the utilization of the nation’s current and future environmental satellite data.
NOAA recognizes the challenges and investments needed to provide for improved utilization of these data. In response to the analyses and reports, NOAA has performed a comprehensive evaluation of its data utilization capabilities that identified the shortfalls and challenges. NOAA Administrator VADM Conrad C. Lautenbacher, Jr. (Ret.), has stated, “If Earth observations are going to be useful, it requires more than just developing more sensors. We are also faced in the near future with the need to double—even triple—existing data management capacities to match sensor system capacity.” Even with the brightest staff, and the best intent, NOAA will be seriously challenged to succeed in providing the level of utilization these expensive and most-capable orbital systems and their end users merit unless: (1) sufficient and stable funding is identified and allocated to enable transparent data access; and (2) partnerships with industry, academia, and other government agencies, modeled after NASA/NOAA Pathfinder program partnerships that have worked so well in the past, are created, sustained, and leveraged.
PARTNERSHIP RESPONSIBILITIES
Many of the issues that NOAA is facing and will face in migrating from today’s state to a near-future state where, say, 20 times the data are readily and comprehensively accessed by 20 times the users, have already been faced by NASA’s Earth Observing System Data and Information System (EOSDIS), which provides a wealth of lessons learned. NASA and NOAA have a long-standing partnership where NASA provides technology readiness development and NOAA provides on-orbit opera-
tions. NASA has developed and transitioned technology in polar and geostationary environmental instrumentation from research to operations for NOAA’s fleet of environmental satellites. Every primary GOES, POES, and NPOESS sensor has a direct heritage to research instruments flown on prior NASA missions (e.g., MODIS to VIIRS, AIRS to CrIS, SBUV/TOMS to SBUV/2 and OMPS). Additionally, as described in the committee’s SBUV and TOMS ozone data case study in Appendix D, NOAA and NASA have partnered to achieve great success in the calibration, validation, algorithm development, and technology evolution of long-term, global, daily ozone observations. Historically, this partnership has not extended to the transfer of data system technology that NASA developed as part of NASA’s environmental science mission infrastructure. Extending the NASA-NOAA “research to operations” cooperation provides NOAA with proven technology without incurring system development costs.
Cross-cutting international partnerships in environmental satellite data sharing, processing, and utilization have also been successful within the weather and climate areas for more than two decades. As the international cooperation to observe Earth’s environment makes a transition into the sustained implementation phase in the next decade, facilitated through the Integrated Earth Observation System (IEOS), it is expected that international partners will be increasingly engaged, for their mutual benefit, to assist with many facets of an advanced utilization system.
It is worth recalling that Mars is now being comprehensively sensed by multiple spectrometers from orbit (http://themis.asu.edu/, http://emma.la.asu.edu/) and miniaturized spectrometers on the ground (http://minites.asu.edu/). Often, such NASA planetary missions serve to demonstrate new flight, ground, and data utilization technologies and capabilities that have direct application to environmental satellite data utilization here on Earth.
The synergies that are emerging across many maturing technologies are enabling the increasingly meaningful application of environmental satellite data to diverse real-world problems. The committee expects that natural partnerships will emerge where environmental satellite data help users to solve their problems. Recently, for example, satellite data have become an essential part of decision support systems such as forest fire management (http://activefiremaps.fs.fed.us/) through moderate-resolution thermal monitoring from orbit; global aquifer (http://www.csr.utexas.edu/grace/) and reservoir monitoring (http://iliad.gsfc.nasa.gov/opf/usda.html) through gravity field change, altimetry, and precision orbit determination; and “nowcasting” of coastal ocean states (http://ourocean.jpl.nasa.gov/aosn.cgi) through satellite scatterometry and coupled modeling. New applications, such as geostationary real-time and predictive monitoring of lower-tropospheric air quality and pollution, are on the horizon, enabled through breakthroughs in compact hyperspectral devices such as Fabry-Perot interferometers. In every case, it is an effective partnership
between the data collection and the data use that underpins the effective utilization of the environmental satellite data.
USER PULL: INNOVATION—IN THE EYE OF THE BEHOLDER
Environmental satellite data exists for only one reason: to meet users’ needs. Responsiveness to users’ changing needs, their “value stream,” is essential to facilitating the comprehensive utilization of environmental satellite data. It should be clear from the sections above that every one of the core technologies required to make NPOESS, GOES-R, and the IEOS successful in meeting the needs of the user community are either already in place today or will be in place when they are needed. For example, thanks to Moore’s law, computing capacities in 2012 at the launch of the first GOES-R will be 64 times (26) greater than today. This means that, as was the case for NASA’s EOSDIS, maximum data utilization is “not a technological challenge—rather it is a sociological challenge.”7 It is exactly this set of exponential changes in technology that creates the sociological drivers for data use. The key to maximizing data utilization is to seamlessly fuse research and operations in full partnership with the user community. In doing so, one hopes to achieve balance and combine freedom and stability to achieve agile, consistent, repeatable, continuous adaptation.8 As Wheatley notes, we don’t have to look any further than the definition of stability to find out why change is hard to accomplish: “Stability—that attribute of the system which enables it to develop restoring forces between the elements thereof, equal to or greater than the disturbing forces so as to restore a state of equilibrium between the elements.”
Success in the optimal use of environmental satellite data will come only if end users’ needs are well met. “Listening to customers, users, will yield the insight to develop innovative solutions. Listening to the customer makes it possible to respond to and deliver the unarticulated needs of the customer—true innovation.”9 To succeed, to enable change in response to the pull of the end users, requires the application of a process that includes the routine utilization of emerging disruptive technologies at its very core. As the CONNTRO final report stated, “The operational community may be slow to recognize the potential of new technologies because it cannot foresee uses for them, their impact on operations, or new users created by these technologies.”10 The report pointed out that opportunities exist at the system level
|
7 |
Personal communication, K. Ramapriyan, NASA/GSFC, 1991. |
|
8 |
See M. Wheatley, Leadership and the New Science, Berrett-Koehler, San Francisco, Calif., 1992. |
|
9 |
Rebecca Rhoads, 2003; see http://www.raytheon.com/newsroom/speeches/rr062503.pdf. |
|
10 |
National Research Council, 2003, Satellite Observations of the Earth’s Environment: Accelerating the Transition of Research to Operations, p. 18, The National Academies Press, Washington, D.C. |
and include both advanced satellite sensor systems and enhanced data exploitation. Merging research and operations, in partnership with the end users, can help to foster a culture that supports judicious risk taking and a common sense of urgency. This approach can be underpinned through an advisory process focused on keeping pace with and anticipating user needs, finding ways to proactively meet them, and building a culture that demands, rewards, and adopts innovation. An excellent example of this is the set of GOES user workshops, which bring together some 200 government, commercial, academic, scientific, and international participants. These workshops typically inform users of future capabilities and applications; determine user needs for new products, distribution of GOES data, data archiving and access to stored data, instruments of opportunity, access to sample data sets (prior to the launch of the next series), and future training; assess user and societal benefits; and improve communication between NOAA and users.11 Ensuring that users’ needs are met may be bolstered through a system of knowledgeable environmental satellite data utilization brokers who can work among the communities involved—essentially, trained practitioners who develop effective linkages, connecting people with people throughout the end-to-end system.
VALIDATION
The objective of validation is to independently determine and document the performance (accuracy and uncertainties) and the limitations (assumptions and constraints) of the environmental satellite data at the end-to-end system level, including the sensor, ancillary data, processing approaches, and algorithms, thereby establishing standard quantitative measures that can be assigned to the measurements (SDRs, or level 1) and derived products (EDRs, or level 2). As depicted in Figure 1.1, validation of measurements and products to characterize their accuracy and long-term stability is an important link in the end-to-end process. Usually validation of environmental satellite missions is achieved through the following five activities:
-
Monitoring instrument performance, including radiometric calibration, over the lifetime of the mission. This includes a constant upkeep of the health and safety of the instrument and updates to the calibration procedures and maintenance of a consistent measurement standard.
|
11 |
J.J. Gurka, T.J. Schmit, and R.R. Reynolds, 2004, “Highlights from the Second GOES Users’ Conference: Recommendations for the GOES-R Series,” paper P2.1, 20th International Conference on Interactive Information and Processing Systems (IIPS) for Meteorology, Oceanography, and Hydrology, 84th Annual Meeting of the American Meteorological Society, Seattle, Wash., January 14, 2004. Available online at http://ams.confex.com/ams/84Annual/techprogram/paper_68746.htm (accessed September 21, 2004). |
-
Detailed assessment of errors and shortfalls in processing methods, including assessment of the sources of error and the maintenance of error budgets to track performance and mitigate negative effects of errors on the quality of measurements and data products.
-
Independent on-orbit confirmation and substantiation of prelaunch estimates of the uncertainty of the derived products, defined as a combination of processing-method-introduced uncertainties and measurement uncertainty, using direct and indirect techniques. This includes the validation of measurements and product accuracy and uncertainty by way of direct comparison to in situ measurements; the validation of measurements’ and products’ performance by means of indirect comparison of measurements; intercomparison with other environmental satellite measurements and products; and the documentation of measurement and product error characteristics for retrospective evaluation of the statistical performance.
-
Historical evaluation of the statistical distribution in records produced by the environmental satellite instruments. This includes the derivation and documentation of the statistical performance of all products.
-
Updates to the processing algorithms as and when required, and data/ products reprocessing as part of a circular cycle of validation activities. This includes updated algorithm processing and reproduction of measurements and products, current and historical, using the updated algorithms, as well as the derivation and documentation of self-consistent, long-term measurement and product records for climate and other environmental studies.
ALGORITHM DEVELOPMENT
Decades of experience have established the following five salient points:
-
Algorithms that will be successful at launch or shortly thereafter can be developed and tested only in the context of the complete end-to-end system within which they operate.
-
Relatively small investments, in parallel with operations, ensure algorithm refinement to eliminate areas of performance shortfall, while identifying promising areas for advanced product development and improvement—further satisfying end users.
-
Agile approaches that incorporate lessons learned, often in parallel research and operational environments, reduce risk while improving product quality and user satisfaction.
-
An integrated “spiral” approach to implementation reduces schedule pressure and risk, allowing early system implementation and thus removing uncertainties while ensuring a simple mechanism for ready insertion of improved algorithms
-
as they become available, unlike the “waterfall” approach more appropriate to stable technologies.
-
The tighter the communications and advisory linkage among research, operations, and the end users, the more rapid the acceptance of the data products, and the more comprehensive their utilization.
As shown in Figure 5.2, the progress of enabling technologies in the upcoming decade may be equivalent to that of the past two or three decades. By 2009-2012, many of today’s technologies will be obsolete. Yet progress is iterative. It is critical to obtain maximum benefit from today’s prototype systems. Research and operations, properly managed, planned, and coordinated as a partnership with the user community, provide an integrated basis for future operational system, sensor, and algorithm stewardship.
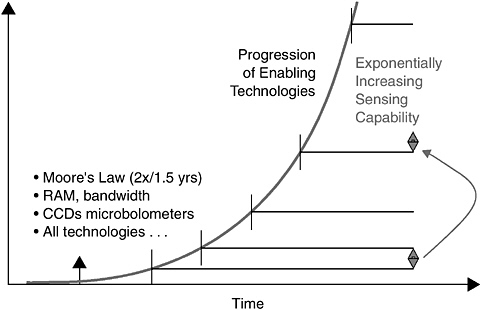
FIGURE 5.2 The chart portrays that the exponential increase of remote sensing capability is enabled by the corresponding growth in specific technologies such as computer processor chips (whose performance improves by a factor of two every 1.5 years according to Moore’s law), random-access memory (RAM), signal bandwidth, and charge-coupled devices and microbolometers for imaging and infrared detection. Related technology generally seems to follow this trend.
First, consider the instruments and scientific algorithms that enable the sensing and conversion of sensed data into useful environmental information. It is critical that lessons learned in sensing Earth be not only publicized, but also quantitatively stated, and then efficiently incorporated into next-generation systems. Every NPOESS and GOES-R planned sensor either has a counterpart in orbit today or will within the next year. Ongoing intensive validation of environmental products created from these new sensors is exposing, for the first time, specific areas of algorithm theoretical basis shortfall. These can be addressed through the collection of refined spectroradiometric data (a new or revised spectral band, for example) to fill in missing information, or improvement of the retrieval algorithm to more robustly account for the local phenomenology. The challenge is in achieving this so that the lessons learned are rapidly exposed, socialized, and assimilated—thereby affecting next-generation systems. This requires quantitative, not qualitative, findings so that cost-benefit assessments can be performed, understood, and communicated. Business “as in the past” may mean that the lessons learned are available just in time—for a third generation—skipping a near-future system that could otherwise have benefited.
The algorithm development process, including mechanisms for algorithm portability, update, and documentation, discussed below, are critical components in a system capable of routinely producing environmental satellite data records and products that will be broadly and fully utilized.
Standard and Synergistic Development Process
Algorithms that convert raw satellite measurements, termed “raw data records” (RDRs, or level-0 or level-1A), to geo-referenced and radiometrically calibrated physical units, termed “sensor data records” (SDRs, or level-1B), and furthermore, to products ready for end-user applications, termed “environmental data records” (EDRs, or level-2 or level-3), provide a complete satellite data processing chain. A standard algorithm development process must be designed and demonstrated in the prelaunch period for every environmental satellite.
This “standard,” or “baseline” processing algorithm suite can be defined as that algorithm set meeting the mission’s critical operational requirements, though possibly without achieving the full system potential and/or enhanced capabilities. Standard processing algorithms must meet all operational requirements, including threshold quality, time latency, and distribution and availability to the users. “Synergistic,” or “evolved” algorithms, on the other hand, often require the use of multiple SDRs and/ or EDRs, significant processing resources, and both development and production time to produce the best achievable satellite products—these enable the satisfaction of challenging operational requirements and the monitoring and understanding of
long-term climate signals and climate change. For example, these climate data records (CDRs) are suitable for the study of climate and environmental system evolution and underpin the monitoring of global change, which requires highly accurate, self-consistent measurements of the Earth-atmosphere system in global and decadal scales.
It is prudent to bring a long-term, strategic vision when designing the standard and evolved algorithms, taking full advantage of heritage approaches, for the next-generation NPOESS and GOES-R satellite systems that will fly in the upcoming decade. This vision must include early algorithm processing demonstrations of the following components:
-
Full cycle, end-to-end, simulation of sensors’ theoretical model and physical measurements—physical modeling of sensor signal, information content, noise sources, geolocation, calibration, and validation (using a judicious mixture of proxy and synthetic simulated data).
-
Complete demonstration of RDR conversion to SDRs and to EDRs—testing and verifying processes required transferring records from raw to user-required states from both standard and evolved processing algorithms.
-
Proactive, routine early and ongoing availability of all standard and evolved SDRs, EDRS, and CDRs to engaged end users for evaluation and feedback.
-
An integrated “spiral” approach to implementation that reduces schedule pressure and risk, allowing early system implementation to remove uncertainties while ensuring a simple mechanism for ready insertion of improved (“evolved”) algorithms as they become available, often from heritage research aircraft or satellite systems (e.g., EOS MODIS for NPOESS VIIRS, EOS AIRS for NPOESS CrIS, EOS ATMS for NPOESS ATMS, and EOS OMI for NPOESS OMPS—see Appendix G for definitions). The outdated “waterfall” approach, where a single implementation is effected years before launch, has been demonstrated over many research and operational flight missions, including UARS, EOS, DMSP, and POES, to add risk due to a decoupling between the parallel and advancing state of the research algorithms and the operational algorithms, which become outdated even before launch.
Availability of Documentation
RDRs, SDRs, EDRs, and their associated processing algorithms and external ancillary data should be documented in a consistent and accessible manner, where all metadata and processing procedures are included to the extent that retrospective users following the “recipe” would be able to successfully repeat the production process.
Mechanism for Portability
All environmental satellite operational algorithms are adapted from heritage and research-grade approaches and implemented in the operational processing infrastructure—this continuity is the only proven or known approach that ensures useful products from any research or operational system. The two-way portability between heritage/research and operation must be designed to be easy, agile, and transparent. There are many instances where revolutionary sensors and algorithms are demonstrated but are unable to bridge the transition to operational implementation. The CONNTRO report documents that committee’s findings and recommendations on this issue in great detail.12 Many of the recommendations are directly and equally relevant to environmental satellite data utilization, and they should be considered and responded to by policy makers.
Perhaps the utmost and critical aspect of algorithm portability with respect to the transition of research capabilities to operational use “is the development not only of the retrieval schemes but also assimilation methods. In either case, parallel development and funding are required to achieve operational use of the satellite data.”13 As a possible real-world example, the Joint Center for Satellite Data Assimilation (JCSDA) could be chartered not simply as a “virtual center.” Rather, it could become an interagency mechanism expanding its responsibility beyond data assimilation to ensure that most of the critical NWP-focused operational processing algorithms are ideally transitioned from research to operations.
Update Process
Rigorous measurement quality and product accuracy validation efforts are required for any exemplary environmental data and product utilization. This is possible only in the satellite post-launch period when the operational, and not just proxy or synthetic, data are acquired. As a consequence of these validation activities, not-infrequent updates of the implemented processing algorithms will be mandatory, especially when sensors’ characteristics are fully understood in the constantly changing thermally and optically stressing space environment. Reprocessing is then required for the measurements and products already produced using the outdated algorithms. This is critical for achieving self-consistent long-term measurement
records where the leading signal is the environment, not the change in algorithm of calibration. To ensure efficient reprocessing, the update mechanisms must be well-defined in the beginning to allow agile and consistent reproductions of measurements and products. Otherwise, inconsistent and sub-optimal uses of the respective measurements and products for environmental monitoring, applications, and research will result. Proactive, rather than reactive, management of the algorithm update and reprocessing will avoid draining scarce resources, disrupting operational scheduling, and impacting users’ confidence. To succeed, up-front and integrated life cycle cost estimates and planning that include this essential update process require flexible and comprehensive understanding of the process itself.
CONSISTENT SPECTRORADIOMETRIC SCALES
Obtaining Desired Accuracies
Four-dimensional data assimilation for NWP, as well as less-esoteric remote sensing data applications such as nowcasting, rural and urban environmental development monitoring, and research, all depend on satellite data in the form of estimated top-of-the-atmosphere (TOA) radiances. Clearly, the more accurate these estimates are, the more effective the applications. So, key ingredients in any effective remote sensing system are excellent satellite radiometers and well-characterized and validated radiative transfer models. While radiometer performance must be characterized by spatial and spectral coverage and resolution, “radiometry” is fundamental. Radiometry is characterized, in turn, in terms of both coverage and resolution, as well. In the case of radiometry, radiance “dynamic range” defines the sensor’s ability to measure radiance from the smallest to the largest magnitude to be encountered in a given application. Radiance “sensitivity” defines the sensor’s ability to distinguish the smallest variations in radiance to be encountered.
Increasingly, utilization of environmental satellite data is expanding toward a focus on calibrated, geolocated radiances as a critical end point, as opposed to the geophysical data products themselves. Driving this transition is the increasing incorporation and complexity of three-dimensional and four-dimensional direct radiance-based assimilation techniques into operational NWP and climate research models, and the increasingly diverse, multidisciplinary, heterogeneous, and distributed nature of the final products and applications. This shift places an added premium on the quality, readiness, robustness, stability, and consistency of the associated spatial, spectral, and radiometric characterization, calibration, and validation algorithms and approaches. Such so-called level-1, or SDR-quality, data must be ensured even more aggressively than the downstream level-2 (EDR) and level-3 (gridded) geophysical data products, or the environmental data records themselves. Unless they
are matured and validated early, the radiance products, produced upstream of the geophysical products, therefore can delay or otherwise impact operational production, validation, and utilization.
While spatial coverage and resolution must be accurate in terms of geolocation, this accuracy can be obtained across platforms and sensors via a common “global” reference frame, Earth itself. Radiometric accuracy, however, defined as the error between a measurement of TOA radiance and the “true value” of that radiance, is difficult to measure consistently because every sensor must carry its own calibration reference, or refer to a common reference provided by another sensor that happens to be making precisely the same environmental measurement at the same time. Common radiance sources do exist that are known to a high degree of accuracy, and these can be used to develop accurate transfer reference radiance sources that can be carried aboard each sensor.
In the reflective spectral range from ultraviolet to short-wave infrared (SWIR) from 0.3 to 2.5 μm, the Sun itself provides a direct reference source. This source has been estimated to a high degree of accuracy via continuing experimental and now more routine measurements by the National Institute of Standards and Technology (NIST) based on pioneering research conducted in the 20th century by Neckel and Labs.14 The result is an excellent spectroradiometric solar characterization at fine spectral resolution. This reference provides the basis for a solid standard that all radiometers can use. The difficulty is in transferring the solar reference to the sensor, as most sensors are not capable of looking directly at the Sun.
The Moderate-resolution Imaging Spectroradiometer (MODIS) uses a Spectralon solar diffuser reflectance reference, reducing the reflectance with a partial screen so that the reflected light is within the MODIS dynamic range. To compensate for solar diffuser reflectance variation over time, MODIS carries its own lamp-illuminated integrating sphere calibration reference standard. This solar diffuser stability monitor (SDSM) comprises a radiometer that views the lamp-illuminated integrating sphere and the Sun-illuminated solar diffuser, comparing the ratio of the two measurements over time to detect and estimate solar diffuser reflectance variations. These results are used to update the reflectance spectral calibration coefficients used in the MODIS ground calibration processing. These coefficients were initialized before launch based on MODIS measurements of the output of the NIST-calibrated laboratory integrating sphere radiance. The NPOESS Visible Infrared Imaging Radiometer Suite (VIIRS) will copy the MODIS reflectance calibration process.15
|
14 |
H. Neckel and D. Labs, 1984, “The Solar Radiation Between 3300 and 12500 Å,” Solar Physics 90:205-258. |
|
15 |
“NPOESS and GOES-R: Building a ‘System of Systems’,” Philip E. Ardanuy, William R. Bergen, Gary E. Gray, Tom Hickey, Hung-Lung (Allen) Huang, Steve Marley, Jeffery J. Puschell, and Carl Schueler, AMS 2004 Annual Meeting (ams.confex.com/ams/pdfpapers/73919.pdf). |
In the emissive portion of the spectrum, it is necessary to create an approximation of the ultimate reference, the classical Planck “blackbody.” The blackbody is an ideal (not perfectly attainable) device that can remain at constant temperature in thermal isolation while absorbing radiative power at visible to SWIR wavelengths. It does this by emitting the same power at longer wavelengths, because otherwise its temperature would rise. The Kirchoff expression “power emitted = power incident” defines a blackbody. A greybody, on the other hand, reflects some incident light, and the Kirchoff expression includes the reflectance and a multiplicative factor in front of the emission term called the “emissivity,” which is less than unity, indicating that the device is not emitting the same power incident on the device. Were it possible to create a perfect blackbody, then a superb emissive spectral band calibration reference could be built, because the emission from a blackbody at any temperature is perfectly defined by the Planck radiation law. The approach would be to measure the emission of the blackbody at a series of temperatures covering the range of anticipated Earth scene temperatures. The known blackbody emission provides a “universal” reference frame, and the only problem left is to ensure that the temperature is well known.
Obtaining Inter-Comparable Data Sets
Polar and geostationary satellite data already constitute the vast majority of the data ingested in NWP models. As these systems are improved, the ability to extend severe storm forecasts for the United States depends on consistent radiometry between current and future systems, and between the next-generation POES (NPOESS) and GOES (GOES-R) systems. Further success in extending severe storm warnings across the globe to benefit all nations will depend on extending the benefits of U.S. environmental satellite calibration consistency to other international satellite systems.


