
Analysis of Emissions, Exposures, and Risks of Toxic Air Emissions from U.S. Coal-Fired and Oil-Fired Power Plants
CHRIS G. WHIPPLE
ENVIRON International Corporation
Coal has been mined in the United States since the mid-1700s and used for the production of electric power since about 1890. Major national efforts to control the environmental effects of coal combustion began in the last half of the twentieth century, but local efforts began much earlier. The cities of Chicago and Cincinnati enacted clean air legislation in 1881. In 1904, Philadelphia passed an ordinance “to regulate emission of smoke from chimneys, stacks, flues or open spaces, providing a color scale for the measurement of the degree of darkness of such smoke, making it unlawful to permit the escape of smoke of a certain degree of darkness and providing a penalty for the violation of the ordinance. The Bureau of Boiler Inspectors enforced it” (Philadelphia Department of Public Health, 2004).
In 1955, Congress passed the Air Pollution Control Act. The first Clean Air Act was passed in 1963, and amendments were enacted in 1965, 1967, and 1969. In 1970, the Environmental Protection Agency (EPA) was formed, and significant changes were made to the Clean Air Act. Previous versions had provided mainly for research and development and left the regulation of air quality to the states, but the 1970 Act required that national primary and secondary ambient air quality standards be set. Primary standards applied to the protection of health, secondary standards to adverse economic impacts. In 1971, EPA set health standards for emissions of sulfur dioxide (SO2). In 1977, President Carter’s National Energy Plan recommended that all new power plants install best available pollution control technology. At that time, scrubbing was the only efficient process for removing high SO2. In the following decade, EPA established national ambient standards for particulates, carbon monoxide, nitrogen oxides (NOx), and ozone.
In 1980, Congress enacted the National Acid Precipitation Assessment Program (NAPAP) Study, a $555-million, 10-year research program for the study of “acid rain.” Industries spent more than $1 billion on air pollution control equipment that year.
Prior to the passage of the 1990 Clean Air Act Amendments, emissions of trace substance “air toxics” from power plants were not regulated. EPA did have the authority, however, to regulate radionuclide emissions from power plants, and in the 1980s EPA established national emission standards for hazardous air pollutants (NESHAPS) for several sources of radionuclide emissions to air. In 1979 and 1984, EPA considered including coal- and oil-fired power plants as regulated sources of radionuclide emissions but ultimately determined that this was not necessary to protect public health.
ANALYSES BY THE ENVIRONMENTAL PROTECTION AGENCY AND THE ELECTRIC POWER RESEARCH INSTITUTE
In Section 112(n)(1)(A) of the 1990 Clean Air Act Amendments, Congress directed EPA to “perform a study of the hazards to public health reasonably anticipated to occur as a result of emissions by electric utility steam-generating units of…hazardous air pollutants.” The amendments define an “electric utility steam-generating unit” as “any fossil-fuel-fired combustion unit of more than 25 megawatts electric (MWe) that serves a generator that produces electricity for sale.” The amendments also required that “EPA proceed with rulemaking activities under section 112 to control HAP [hazardous air pollutant] emissions from utilities if EPA finds such regulation is appropriate and necessary after considering the results of the study.”
The 1990 Clean Air Act Amendments also directed EPA to prepare “a study of mercury emissions from electric utility steam generating units, municipal waste combustion units, and other sources, including area sources. Such study shall consider the rate and mass of such emissions, the health and environmental effects of such emissions, technologies which are available to control such emissions, and the costs of such technologies.”
The EPA mercury study, written in response to the 1990 amendments, was published in December 1997 (EPA, 1997). The EPA electric utility air toxics study, published in February 1998, includes an air toxics inhalation risk assessment for every fossil-fired steam-electric power plant in the United States with a capacity of 25 MWe or more.
In parallel with the EPA analyses, the U.S. electric utilities funded their own analyses of power plant air toxics by the Electric Power Research Institute (EPRI). Like EPA, the EPRI-sponsored studies included characterizations of emissions under various power-generation and emission-control scenarios, estimates of the cost and effectiveness of various control technologies, an assessment of air dispersion, an assessment of exposure through inhalation for all U.S. plants and
exposure through multiple pathways (e.g., atmospheric deposition on food and through water) for case-study plants, and an assessment of the health risks associated with the estimated exposures (EPRI, 1994). (EPRI continued to sponsor similar studies after 1994.)
The results of the analyses are described in the remainder of this paper, based on the major elements of the analyses by EPA and EPRI listed below:
-
scenarios for future power-plant inventories and use, including fuel mix, coal sources, and emission controls
-
identification of substances included in the study
-
emission factors for each fuel type and plant configuration
-
air dispersion modeling
-
exposure modeling for various exposure scenarios
-
calculations of inhalation exposures for all U.S. plants
-
calculations of multipathway exposures for selected chemicals for model plants (EPA) or case-study plants (EPRI)
-
-
assessment of health effects from carcinogens and noncarcinogens
-
assessment of inhalation risks
-
assessment of multipathway inhalation risks
-
characterization of results, including uncertainties
Both EPA and EPRI calculated inhalation exposures and risks for the more than 600 U.S. fossil-fuel, steam-electric power plants with a capacity of 25 MWe or more. Exposures and risks by the inhalation pathway were of particular interest for substances not considered likely to accumulate in the food chain.
However, another approach had to be used for some substances, such as mercury, for which the food pathway is more important than the inhalation pathway. EPA addressed exposures and risks from pathways other than inhalation by analyzing several model plants configured to be representative of common plant configurations. EPRI performed similar analyses using actual power plants, rather than hypothetical model plants. The primary focus of these multipathway analyses was on arsenic, mercury, and organics, such as dioxins and furans.
For radionuclides, EPA’s office of radiation conducted a separate study of all U.S. plants using CAP88-PC, the model EPA uses for compliance analyses for air emissions of radioactive materials. EPRI did not conduct analyses for all U.S. plants but did analyze several case-study plants. In addition, EPRI reevaluated EPA’s analyses of the plants found to pose the highest risks.
Power-Generation Scenarios
The 1990 Clean Air Act Amendments required that EPA project risks from U.S. power plants as they will be configured following compliance with other sections of the 1990 Amendments. For this reason, EPA first had to estimate the
configuration of the industry in 2010. Increase in demand was taken into consideration, as were the requirements for compliance with other parts of the Clean Air Act Amendments, primarily reductions in SO2 beginning in 2000. In addition, EPA estimated the number and types of new plants to be built between 1990 and 2010 to meet the increased demand. Controls to reduce NOx emissions were also taken into account.
Some plants operating in 1990 will be retired by 2010, so the industry configuration includes both new and currently operating plants, as well as retrofits of emission controls on many existing plants to meet the required reductions in SO2. In addition, some fuel switching is anticipated, notably a continuing decline in the market share of oil used for power generation and an increase in market share for natural gas and coal.
The EPA and EPRI estimates of the power-generation mix in 2010 are both based on a decrease in the use of oil; data collected since these projections were made have shown that the expected decline in oil was correct. But neither organization anticipated the rapid increase in the use of natural gas. It is too soon to tell how accurate the estimates are of the mix of power plant controls in 2010, because required reductions in SO2 and NOx have not taken full effect.
Identification of Substances
The 1990 Clean Air Act Amendment’s list of air toxics includes 189 specific substances or classes of substances. Some of these (e.g., pesticides) are not likely to be emitted from a fossil-fuel-fired power plant. Both organizations focused primarily on toxic metals known to exist at trace levels in coal and oil ash. After an initial screening assessment, EPA developed a list of 13 toxic metals to be assessed for chronic exposures and three substances of concern for acute exposure; the latter are hydrochloric acid (HCl), hydrofluoric acid (HF), and acrolein. EPRI included several other substances (e.g., antimony and selenium), but these did not affect the findings. In addition to trace metals, EPA included many organic chemicals (the full list is available in Appendix A of the EPA study) (EPA, 1994). The EPRI study contained fewer organic chemicals; these included benzene, dioxins and furans, formaldehyde, polycyclic aromatic hydrocarbons (PAHs), and toluene. A partial list of the substances evaluated by EPA and EPRI is provided in Table 1. All of the substances shown on the list were evaluated for coal-fired power plants, but if the source term data indicated that they were not likely to produce significant exposures, they were not evaluated for oil-fired and gas-fired plants.
Estimated Emission Factors
An emission rate for each applicable substance was estimated for each U.S. power plant. These source-term estimates were based on measurements taken at a
TABLE 1 Partial List of Substances Included in the EPA and EPRI Analyses
|
EPA Analysis |
EPRI Analysis |
|
Arsenic |
Arsenic |
|
Beryllium |
Beryllium |
|
Cadmium |
Cadmium |
|
Chromium |
Chromium |
|
Dioxins/furans |
Dioxins/furans |
|
Formaldehyde |
Formaldehyde |
|
Acid gases (HCl, HF) |
Acid gases (HCl, HF) |
|
Lead |
Lead |
|
Manganese |
Manganese |
|
Mercury |
Mercury |
|
Nickel |
Nickel |
|
n-nitrosodimethylamine |
|
|
|
PAHs |
|
Radionuclides |
Radionuclides |
representative sample of power plants with different types of emission controls and fuels. Because many of the samples were provided to EPA by EPRI, both organizations estimated emission rates based on essentially the same raw data.
EPA and EPRI used similar but not identical methods to assess the source term of metals from coal-fired plants. Both attempted to construct a mass balance for each pollutant based on measured concentrations in the coal, in the bottom ash removed by each control device, and in the particulates emitted. EPA used this method to develop an emission factor for each configuration that was proportional to the amount of material in the coal that was burned. EPRI used a slightly different method. EPRI observed differences in the removal efficiencies of various control devices depending on the power plant capacity. Typically, the removal efficiencies were higher for coal streams with high concentrations of the pollutant of interest. The degree to which this effect occurred depended on the specific pollutant. Figure 1 indicates the observed release rates, in pounds of particulate emissions per pound of fuel input; EPRI used these and similar data to estimate source terms.
Determining the content of organic pollutants in fuels was not as useful as for trace metals because organic hazardous air pollutants (HAPs) may be created in the combustion or control processes. For this reason, both EPA and EPRI estimated emission rates for organics based on measured emissions from plants of different configurations. For some substances (e.g., PAHs and dioxins/furans), estimating source terms was complicated by a relatively high number of measurements with concentrations below the detection limits. Naturally occurring radionuclides, principally uranium and thorium and their
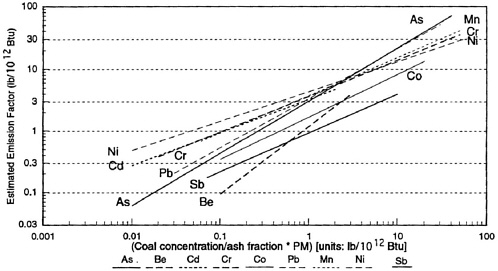
FIGURE 1 Emission factors used in the EPRI study. Source: EPRI, 1994.
decay products, are present in coal ash and in oil. EPA estimated radionuclide releases based on emission factors per unit energy consumed in generation; these estimates were developed in 1989 as part of an assessment of radionuclide emissions from coal-fired plants. In that analysis, EPA determined that controls targeting radionuclides were not necessary. The emission factors in the present study were based on the radionuclide content of the ash in the fuel (coal and oil), with adjustments made to account for nonuniform partitioning of radionuclides between fly ash and bottom ash. EPRI used a different method. EPRI based the radionuclide emission estimate on the annual mass of particulate emissions and representative concentrations of radionuclides in fly ash for the type of plant being analyzed.
Air-Dispersion Models and Exposure and Risk Assessment
The usual approach to assessing exposures to hazardous substances is to calculate an “exposure point concentration” and then apply assumptions or data regarding individual factors that would affect exposure. For the inhalation pathway, the exposure point concentration of interest is the concentration of the substances of concern in air once a plume has reached ground level. For U.S. power plants with tall stacks, a plume may reach the ground about 10 kilometers from the plant. In both the EPA and EPRI analyses, air-dispersion calculations were made using versions of EPA’s integrated-source, complex, long-term (ISCLT) model.
Given a calculated exposure point concentration over time, an individual
exposure assessment includes many factors, such as an individual’s inhalation rate (which varies with the level of activity), the mix of time spent indoors and outdoors (indoor concentrations tend to be lower), the length of time an individual remains at the location of interest, and body weight (when risk factors are based on intake rates expressed as microgram (µg)/day per kilogram of body weight). In addition to individual exposure rates, these studies also estimated health effects for the total exposed population.
The substances of concern in these studies included both carcinogens and noncarcinogens. For carcinogens, it is standard practice in the United States to assume a linear relation between exposure and risk, with no threshold for low doses or low dose rates. This requires using a risk factor in which risk is proportional to intake relative to body weight. A consequence of this assumption is that the risk to an individual is directly proportional to the individual’s cumulative lifetime intake of a carcinogenic substance. Similarly, the cancer risk in a population, in terms of the expected number of additional cases per year, is assumed to be proportional to the total exposure of the population.
For noncarcinogens, EPA limits exposures based on a defined level called a reference dose (RfD); for inhalation exposures, a reference concentration (RfC) is sometimes used. EPA considers exposures at these levels to be virtually risk free, but exposures above the RfD or RfC level is to be avoided. Exposures to noncarcinogens are expressed in terms of a dimensionless index called a hazard quotient (HQ), which is simply the ratio of exposure to the RfD. For example, the RfD for methylmercury is 0.1 µg/kg-day (one microgram per day per kilogram of body weight). For a person who weights 70 kg, the reference dose is 7 µg/day. This means that a person who weighs 70 kg who consumes 0.7 µg/day of methylmercury would have an HQ of 0.1. If there are exposures to more than one substance, the HQs are added up to determine a hazard index (HI).
EPA and EPRI used the same toxicity values for the substances studied. The cancer unit risk factors, RfDs, and RfCs were based on the current values (at the time the studies were conducted) on EPA’s Integrated Risk Information System (IRIS) (EPA, 1994).
Results
The risk assessments for inhalation were generally very low. Figure 2, which shows the results of the EPA study for coal-fired plants, indicates that the calculated lifetime cancer risk to the maximally exposed individual exceeded one in a million for only two plants. As a point of comparison, EPA frequently uses an acceptable risk range for lifetime cancer risks of one in ten thousand to one in a million. Risks of less than one in a million are judged to be too low to be of concern. As Figure 3 shows, the inhalation cancer risk comes primarily from arsenic and chromium, with only a small contribution from cadmium. Radionuclides are not included in this analysis.
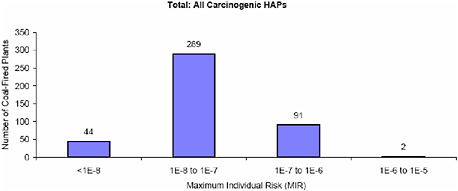
FIGURE 2 Maximum individual risk (MIR) of cancer from coal-fired plants. Source: EPA, 1998.
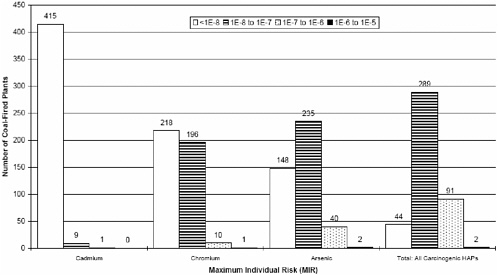
FIGURE 3 EPA results of inhalation cancer risks by chemical for coal-fired power plants. Source: EPA, 1998.
Surprisingly, both EPA and EPRI found that many of the plants that pose the highest risk burn oil. This may be because many oil-fired plants are small to medium-sized peaking plants in urban locations with generally shorter stacks than coal-fired plants and with no controls for particulate emissions. Figure 4 shows EPA’s results for oil-fired plants. The primary contributor to inhalation cancer risk from the oil-fired plants comes from nickel. We must keep in mind that this finding depends on the toxicity assumptions applied to nickel. EPA has
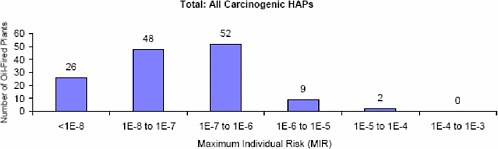
FIGURE 4 EPA results for oil-fired power plants. Source: EPA, 1998.
not classified soluble nickel salts as carcinogens but has classified nickel refinery dust, nickel carbonyl, and nickel subsulfide as carcinogens. Both EPA and EPRI found that the risks from gas-fired plants were low. As Figures 5 and 6 show, EPRI’s analytical findings for inhalation cancer risks were consistent with EPA’s findings. Figure 7 shows that the range of calculated risk for each plant type varied widely, depending on the location, stack characteristics, weather conditions, local population, and whether the setting was urban or rural.
As for noncancer end points, both studies found that exposures were well below the applicable RfDs and RfCs. Figure 8 shows cumulative distributions of the HIs calculated by EPRI. The HI for coal plants is due mainly to HCl and manganese.
Both EPA and EPRI evaluated multipathway exposures, especially for substances where the main concern was not inhalation exposure but accumulation in the food chain (mercury, dioxins and furans, and others). In addition, the studies took into account indirect exposures to arsenic, lead, cadmium, and radionuclides. A multipathway risk assessment is much more complex and requires much more input data than an inhalation risk assessment. The EPA study noted that power-plant emissions of lead and cadmium are roughly 1 percent of the total annual U.S. emissions of these metals and, therefore, concluded that the incremental exposures from power-plant releases were small in comparison to releases from other sources.
Mercury
Mercury has long been identified as a neurotoxin. As poisoning episodes at Minimata, Japan, and in Iraq have demonstrated, high-dose exposures to mercury can cause severe damage to human health. In the context of coal-fired power plants, the concern is that mercury releases to the environment will be deposited on watersheds, migrate into lakes and rivers, be converted to methylmercury in lake and river sediments, and accumulate in fish.
In 1994, when the EPRI study was published, the RfD for exposure to
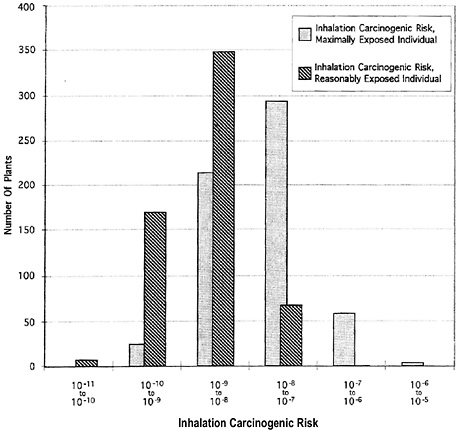
FIGURE 5 Results from the EPRI inhalation risk assessment. Source: EPRI, 1994.
methylmercury was based on a dose high enough to cause parasthesia (numbness and a tingling sensation in the extremities, typically the fingers). This RfD was 0.3 µg/kg-day (that is, the defined safe intake rate was 0.3 µg/day per kg of body weight). In 1997, when the EPA study was published, a revised RfD of 0.1 µg/kg-day was used, based on developmental effects observed in connection with methylmercury poisoning in Iraq. Neither RfD was based on exposure through fish consumption.
Since the publication of the EPA electric utility air toxics study, EPA has updated the methylmercury RfD based on epidemiological studies of populations that consume large amounts of fish (relative to the United States). Evaluations of children’s performance on a variety of childhood development tests showed that poor performance was correlated with high maternal exposure to methylmercury, indicated by measurements of methylmercury in the mother’s
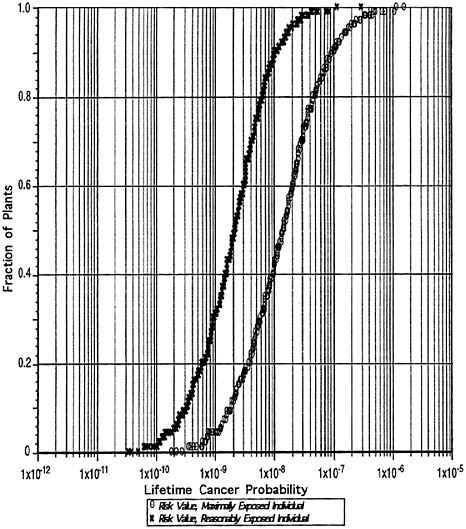
FIGURE 6 Cumulative distribution of inhalation risks from the EPRI analysis. Source: EPRI, 1994.
hair or blood or by a dietary survey concerning fish consumption. Although the current basis for the RfD is concerns about exposures during pregnancy, the RfD is the same, 0.1 µg/kg-day.
In EPA’s case studies, exposures to methylmercury from power plants alone did not exceed the RfD for the typical recreational angler (assumed to consume 8 grams per day of freshwater fish). However, the RfD would be exceeded for someone higher on the consumption distribution, such as a subsistence fish
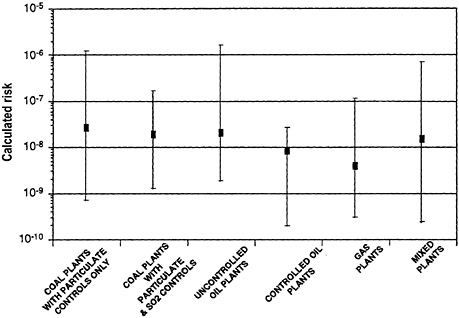
FIGURE 7 Comparison of inhalation cancer risk by plant type. Source: EPRI, 1994.
consumer. Although mercury exposures occur mainly through the consumption of marine fish, incremental exposures from power-plant emissions added to other exposures could exceed the RfD for a significant number of people.
In the EPRI case studies, the highest calculated methylmercury exposure led to a calculated HI of 0.28, based on an RfD of 0.3 µg/kg-day. This corresponds to an HI of 0.84 based on the current RfD. The HI was calculated for the contribution from each case-study plant and did not include exposures from other sources, such as the consumption of marine fish.
Arsenic
EPA and EPRI both evaluated potential exposures to arsenic through pathways other than inhalation. The focus was on inorganic arsenic, which is believed to be much more toxic than organic arsenic. This distinction is important because arsenic can accumulate in fish and shellfish, but usually in the organic form. Inorganic arsenic deposited on soil that can be taken up in crops is of greater concern. With the exception of high exposures and calculated risks to children
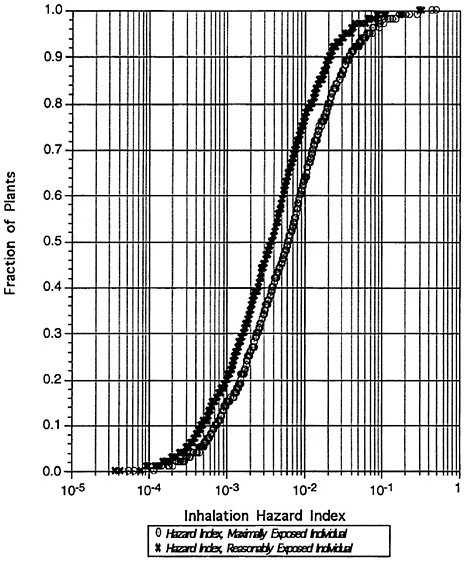
FIGURE 8 Inhalation hazard index for all plants. Source: EPRI, 1994.
with pica (a disorder that causes them to eat large amounts of dirt), the lifetime cancer risks from arsenic were typically in the range of one in a million or less. EPA further noted that, even after 30 years of accumulated deposition, the arsenic contributions to soils near power plants would be around 10 percent of average background concentrations. Thus EPA concluded that power-plant emissions make a relatively small contribution to arsenic exposure in the United States.
Radionuclides
Prior to the study mandated by the Clean Air Act Amendments of 1990, EPA had evaluated the risks from, and need for regulation of, radionuclide emissions from coal-fired power plants at roughly five-year intervals going back to 1979. Each time, EPA had concluded that regulation was not necessary to protect public health. However, EPA had set NESHAPs for emissions of radionuclides from other sources, such as phosphate mines and U.S. Department of Energy sites, with a limitation on exposure of 10 millirems (mrem) per year (0.1 millisievert [mSv] per year).
In the assessments of radionuclide risks from power plants, EPA used CAP93-PC, a modified version of CAP88-PC. Both versions were designed to assess doses and risks to individuals and populations from specified releases of radionuclides to the atmosphere. The model includes a version of the Industrial Source Complex model used by EPA and EPRI for the inhalation analyses. With local meteorological data, CAP93-PC is capable of modeling emissions from power plant stacks. The model can perform calculations of exposures through inhalation, through ingestion of food, through incidental consumption of soil, through drinking water, through external radiation, through immersion in radionuclides in air, and through radionuclides deposited on the ground.
EPA ran this model for all U.S. plants, considering emissions of uranium and uranium decay-chain radionuclides, thorium and thorium decay-chain radionuclides, and potassium-40. These analyses resulted in the highest risk estimates in EPA’s study; 17 plants were estimated to produce exposures resulting in maximum individual lifetime risks greater than 1 × 10⁻⁵. For each of these 17 plants, the dominant exposure pathway was external radiation from radionuclides deposited on the ground surface through wet deposition from the plume. Because the concentrations in the plume are highest near the stack, ground concentrations were also calculated to be highest near the stack. Given the number of plants that had to be assessed, it was not possible to get actual data for the actual locations of the nearest residents around each plant. In general, the risk reported was for a person living 200 meters from the power plant stack in the direction of the prevailing wind.
The U.S. power plant industry, through the Utility Air Regulatory Group (UARG), conducted a reanalysis of the top 17 plants in EPA’s study using the actual location of the nearest neighbors, typically determined by aerial photographs of the plant and surrounding area. Most of the plants were in rural locations, many with no residents living within a few thousand meters of the plant. UARG’s review revealed that in several cases the point of maximum risk in EPA’s analysis was inside the plant boundary, for example, on a coal pile or cooling pond. In discussions between the industry and EPA, it was agreed that the EPA analyses were conservative, but because EPA showed no interest in regulating radionuclide emissions, it was not considered important to get more refined and accurate risk estimates.
EVENTS SINCE THE STUDIES WERE PUBLISHED
Based on the air toxics study and the companion mercury study report to Congress, EPA concluded that, with the exception of mercury emissions, power plant emissions of toxic substances did not require regulation to protect public health or the environment. However, because power plants are the largest sources of anthropogenic mercury emissions in the United States, EPA concluded that controls to reduce mercury emissions from power plants are justified. EPA is in the process of determining the limitations on mercury in power-plant emissions. In EPA’s analyses of mercury exposures, data on fish consumption, when combined with data on the mercury concentration in fish, indicated that a significant number of people in the United States were exposed to methylmercury at higher levels than the EPA RfD. Most of this exposure was from the consumption of commercially purchased marine fish, but some people were thought to be over-exposed through the consumption of self-caught freshwater fish. The mercury content of marine fish is primarily from global background concentrations of mercury and would not be affected by changes in U.S. power plant emissions. There is a stronger relationship between U.S. emissions and the concentration of methylmercury in freshwater fish.
At the time these studies were conducted, exposure limits for methylmercury were based on an episode of acute poisoning in Iraq, in which methylmercury used as a fungicide on seed grain was accidentally consumed. Because these were high exposures of short duration, some people in the toxicology community were concerned that they were not a sufficient basis for setting exposure limits for the consumption of methylmercury in fish. In addition, all of the studies of mercury exposures in populations that consume large amounts of fish have been found to have significant limitations. Two new large epidemiological studies, one in the Seychelles and one in the Faeroe Islands, to evaluate the neurological development of children born to mothers who consume large amounts of methylmercury were under way to provide better information. In response to a congressional requirement, EPA funded a study by the National Academies of health risks associated with methylmercury exposure (NRC, 2000). The study supported the continued use of the methylmercury RfD of 0.1 µg/kg-day, based largely on the results of the Faeroe Islands study. The population of most concern is pregnant women.
Another data gap at the time of the studies was actual exposure levels to methylmercury. Exposures were based on food diary studies coupled with measured concentrations of methylmercury in fish tissue. The primary diary study was the Continuing Study of Food Intake by Individuals (SCFII), a three-day diary study conducted by the U.S. Department of Agriculture. Unfortunately, a three-day study is not a good way to estimate the upper tail of the distribution curve for consumption of fish, which is eaten infrequently. This is particularly true for wild freshwater fish, which Americans consume, on average, less often than marine fish and which is often not included in food statistics because it is not
bought or sold commercially. As a result, uncertainties regarding the upper tail of the exposure distribution were high, with the largest uncertainties associated with exposures from the consumption of freshwater fish. Farm-raised fish are not sources of significant methylmercury exposure because they are not subject to the normal bioaccumulation processes.
An alternative to fish consumption surveys is biomarker data because methylmercury exposures can be determined through measurements of mercury concentrations in hair or blood. Data released in June 2002 from the federal National Health and Nutrition Examination Survey (NHANES) provided an opportunity to evaluate blood levels of mercury in 1,709 women of childbearing age and 705 children between the ages of one and five. As part of the study, the women were also asked about their fish consumption.
The NHANES study results, when weighted to adjust for demographic factors, indicated that about 7.7 percent of women in the United States aged 16 to 49 have blood levels of methylmercury above the RfD. The fish consumption survey of the NHANES study did not have the resolution necessary to determine the contribution of wild freshwater fish to exposures at the upper tail of the exposure distribution.
REFERENCES
EPA (Environmental Protection Agency). 1994. Integrated Risk Information System. Available online at: http://www.epa.gov/iris/.
EPA. 1997. Mercury Study Report to Congress. R-452/R-97-003. Washington, D.C.: Office of Air Quality Planning and Standards and Office of Research and Development, Environmental Protection Agency.
EPA. 1998. Study of Hazardous Air Pollutant Emissions from Electric Utility Steam Generating Units: Final Report to Congress. EPA-453/R-98-004a. Washington, D.C.: Office of Air Quality Planning and Standards, Environmental Protection Agency. Also available online at: http://www.epa.gov/ttn/oarpg/t3/reports/eurtc1.pdf; the appendices are available at http://www.epa.gov/ttn/oarpg/t3/reports/eurtc2.pdf.
EPRI (Electric Power Research Institute). 1994. Electric Utility Trace Substances Synthesis Report. Volumes 1–4. EPRI TR-104614-V1 through V4. Palo Alto, Calif.: Electric Power Research Institute.
NHANES (National Health and Nutrition Examination Survey). 2000. NHANES 1999–2000: Data Files, Documentation/Codebook and SAS Code. Available online at: http://www.cdc.gov/nchs/about/major/nhanes/NHANES99_00.htm.
NRC (National Research Council). 2000. Toxicological Effects of Methylmercury. Washington, D.C.: National Academies Press.
Philadelphia Department of Public Health. 2004. History of Air Pollution Control in Philadelphia. Available online at: http://www.phila.gov/health/units/ams/pdf/History.pdf (accessed May 2004).


