
3
Water Quality in the Region
Surface water and groundwater in southwestern Pennsylvania often contain many different pollutants from a variety of sources. This chapter provides an overview of the types of water quality problems in the region. Specifically, it provides an introduction to water quality standards, an overview of aquatic pollutants by broad classes, and a summary of current water quality conditions in the Pittsburgh region. In doing so, it provides the background needed to understand the causes of water quality impairment discussed in Chapter 4.
WATER QUALITY STANDARDS
The health of waterbodies across the United States is determined by comparing certain measured physical, chemical, and biological parameters within those waters to water quality standards. In this regard, water quality standards are currently the foundation of the water quality-based control program mandated by the federal Clean Water Act (CWA).1 These standards are set individually by states2 in accordance with the CWA. Each water quality standard consists of two primary and distinct parts: (1) designated beneficial use(s) of the waterbody and (2) narrative and numeric water quality criteria for biological, chemical, and physical parameters that measure attainment of designated use(s). For example, a water quality standard for dissolved oxygen in surface waters would list the various oxygen concentrations required for waterbodies meeting different uses. New or revised water quality standards are subject to review and approval by the U.S. Environmental Protection Agency (EPA). The CWA also authorizes the EPA to promulgate superseding federal water quality standards. Designated uses represent not only scientific understanding but also value judgments about what a waterbody can and should be used for, whereas criteria reflect only scientific information.
Designated Uses
The CWA requires states to designate a use for each waterbody in their jurisdiction. The primary goal of the CWA, and the minimum that should be attained in all states, is that surface
|
1 |
See Box 1-1 and http://www.epa.gov/waterscience/standards/ for further information. |
|
2 |
The term “state” collectively includes territories, American Indian tribes, the District of Columbia, and U.S. interstate commissions. |
waters in the United States should be “fishable and swimmable.”3 These two broad uses have been significantly elaborated on by the states, such that in Pennsylvania all surface waters have been designated for uses that include warm-water fish and other aquatic life use, recreational use, and drinking water supply. In addition to these uses, some waters are of exceptional quality (designated as high quality or exceptional value waters), and some of these may be protected for cold-water fish. As described later, water designated for these higher-end uses must meet more stringent water quality criteria. The most common designated uses are described below, with particular attention to drinking water uses of waters in southwestern Pennsylvania.
Drinking Water
Public health depends on provision of adequate quantities of drinking water free of harmful concentrations of human pathogens and chemical pollutants. Provision of clean, safe drinking water depends on the quality of both the source water and the treatment and distribution systems. Thus, assigning the appropriate use designation and then meeting water quality standards in source waters is the first step in providing safe drinking water (EPA, 2002a).
In southwestern Pennsylvania, drinking water is taken from a variety of sources. While the urban core in Allegheny County (see Chapter 6 for further information) is served predominately by public water services utilizing surface water sources, other counties in the area rely more heavily on public and private groundwater sources. Figure 3-1 shows the distribution of sources by population served for each county. Because population density for the region is highest in Allegheny County, which relies heavily on surface water, the majority of people in the region rely on treated surface water for their drinking water (see Figure 3-2). Major surface water sources of drinking water in the region include the Allegheny River, the Monongahela River, the Ohio River, the Youghiogheny River, Beaver Run, and Indian Creek.
Section 1453 of the Safe Drinking Water Act (SDWA) Amendments of 1996 requires states to develop a Source Water Assessment and Protection (SWAP) program to assess the drinking water sources (not “finished” waters already treated to meet various drinking water standards) serving public water systems for their susceptibility to pollution.4 A state’s SWAP is required to (1) delineate the boundaries of the areas providing source waters for all public water systems, and (2) identify (to the extent practicable) the origins of regulated and certain unregulated contaminants in the delineated area to determine the susceptibility of public water systems to such contaminants. The key objective for conducting source water assessments is to support the development of local, voluntary source water protection programs. In conducting such assessments, each state must use all reasonably available hydrologic information (such as water flow, recharge, discharge) and any other information deemed necessary to accurately delineate the source water assessment areas.
In order to protect public health, treatment of surface waters used for drinking water is mandated. Large water service suppliers in the region that utilize surface water are listed in Table 3-1. While these large systems provide significant populations with water, there are also many smaller water service providers in the region, many of which rely heavily on groundwater
|
3 |
It should be noted that exceptions to the fishable, swimmable use exist. For example, in Pennsylvania a portion of the Delaware Estuary and water in the vicinity of the harbor at Erie do not fully support and are not expected to support the “fishable and swimmable” goal of the CWA. |
|
4 |
Further information on SWAP can be found at http://www.epa.gov/safewater/protect/swap.html. |
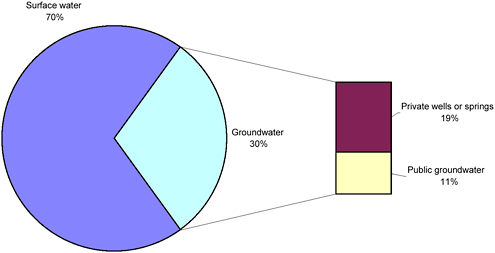
FIGURE 3-1 Percentage of southwestern Pennsylvania county populations served by groundwater and surface water. SOURCE: USGS, 1995.
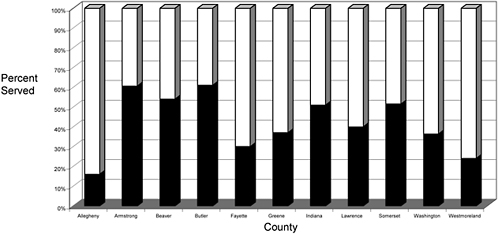
FIGURE 3-2 Source waters for drinking water in southwestern Pennsylvania by percentage served.
NOTE: Black represents groundwater; white represents surface water. SOURCE: USGS, 1995.
as sources. Table 3-2 indicates that nearly 90 percent of the community water systems in Pennsylvania serve fewer than 10,000 persons. Nationally, about 94 percent of community water systems in the United States (more than 54,000 systems nationwide) served populations of 10,000 or fewer in 1993, but only 21 percent of the U.S. population was served by systems providing water to 10,000 or fewer people (NRC, 1997). About two-thirds of the small systems in southwestern Pennsylvania serve 500 or fewer persons, which has contributed to a proliferation of management and operational organizations across the region (as discussed in Chapter 6). The smallest systems often lack the financial resources and technical skills
TABLE 3-1 Public Water Systems Serving Populations of 100,000 or More in Southwestern Pennsylvania
|
Water Supplier |
Principal County Served |
Population Served |
|
Pennsylvania-American Water Company-Pittsburgh |
Allegheny |
569,300 |
|
Pittsburgh Water & Sewer Authority |
Allegheny |
250,000 |
|
Westview Borough Municipal Authority |
Allegheny |
200,000 |
|
Wilkinsburg-Penn Joint Water Authority |
Allegheny |
120,000 |
|
Westmoreland County Municipal Authority, Youghiogheny Plant |
Fayette |
130,000 |
|
Westmoreland Municipal Authority, Sweeney Plant |
Westmoreland |
140,000 |
|
SOURCE: Derived from EPA Safe Drinking Water Information System Data, available on-line at www.epa.gov/safewater/dwinfo/pa.htm. |
||
TABLE 3-2 Community Water Systems in Southwestern Pennsylvania
|
County |
Number of Active Systems Serving Populations of 10,000 or More |
Total Number of Active Community Water Systems |
|
Allegheny |
15 |
41 |
|
Armstrong |
0 |
23 |
|
Beaver |
5 |
38 |
|
Butler |
2 |
64 |
|
Fayette |
5 |
29 |
|
Greene |
1 |
7 |
|
Indiana |
1 |
32 |
|
Lawrence |
2 |
29 |
|
Somerset |
0 |
45 |
|
Washington |
2 |
15 |
|
Westmoreland |
3 |
21 |
|
Total |
36 |
344 |
|
SOURCE: Derived from EPA Safe Drinking Water Information System Data, available on-line at www.epa.gov/safewater/dwinfo/pa.htm. |
||
necessary to cope with drinking water regulations that are increasingly complex, and they may have difficulty dealing with problems of source water contamination, should these occur.
An EPA (2001a) survey of drinking water infrastructure needs lists Pennsylvania’s statewide need for providing adequate drinking water as $3.148 billion for transmission and distribution, $940 million for treatment, $800 million for storage, $314 million for source needs, and $56 million for other needs. Notably, Pennsylvania’s total drinking water infrastructure needs ($5.258 billion) are the highest in EPA Region III and are more than double the dollar needs of Virginia—the second-ranking state in the region ($2.068 billion). Furthermore, these dollar needs are often conservative estimates, because it is difficult to tally comprehensively the small system needs.
Despite the strong reliance in the region’s urban core on surface water sources, a substantial population (30 percent, or approximately 800,000 residents) is served by public or private wells. It is important to note, however, that the CWA does not directly address groundwater or water quantity issues (i.e., there is no designated use of groundwater as a source of drinking water). Wellhead protection, required under Section 1428 of the SDWA, was established to protect public groundwater sources from contamination, and Pennsylvania’s
Wellhead Protection Program5 forms the cornerstone of its SWAP. Similar to a SWAP assessment, wellhead protection involves the delineation of the area contributing water and an inventory of potential contaminant sources in that area with the ultimate goal of developing a voluntary, community-based drinking water protection program.
Currently, the only national microbiological standard for groundwater quality is the Total Coliform Rule,6 which applies only to groundwater used in public water systems and only in the distribution system. However, in 2000, EPA proposed the Ground Water Rule (GWR) in response to the SDWA Amendments of 1996 that mandate the development of regulations for the disinfection of groundwater systems in order to protect human health (EPA, 2000a). The proposed regulation (the final rule has been expected since spring 2003) will establish multiple barriers to protect groundwater drinking water sources from bacteria and virus contamination and will establish a targeted strategy to identify groundwater systems at high risk for fecal contamination. The proposed GWR will apply to public groundwater systems that have at least 15 service connections or regularly serve at least 25 individuals at least 60 days a year. Notably, the GWR does not apply to privately owned wells (nationally approximately 15 percent of Americans rely on private wells; in southwestern Pennsylvania the number is 19 percent), although EPA recommends that private well owners test for coliform bacteria at least once a year. Furthermore, although the state Water Well Drillers License Act (Act 610)7 requires licensing of water well drillers and filing of well records, the Commonwealth of Pennsylvania does not regulate the construction of or water quality in private wells (PADEP, 2003).
Because construction of and water quality in private wells are unregulated in Pennsylvania, these wells may pose a threat to aquifers due to poor construction and maintenance. Additionally, many older private wells predate the 1956 Act 610, which requires filing of well information with the Pennsylvania Geological Survey; thus, no information is available regarding their construction or location. No regional data were available to assess this potential threat or the public health ramifications posed by unsafe private wells in southwestern Pennsylvania. Anecdotal information about the high rate of on-site sewage treatment and disposal system (OSTDS), or “septic system,” failure (described later) suggests that private wells may be at risk of contamination. Similar problems exist in other rural regions of the country, and programs such as the Statewide Rural Wellwater Survey and the Grants to Counties Program in Iowa can serve as a model of cooperative programs designed to protect public health and the environment (see Box 3-1).
Contact Recreation
Because of the importance of outdoor recreation to local economies and social well-being, many waters in Pennsylvania are designated for this purpose and have correspondingly strict water quality criteria. The 2001 Pennsylvania Survey of Fishing, Hunting and Wildlife-
|
5 |
Further information on Pennsylvania’s Wellhead Protection Program can be found at http://www.dep.state.pa.us/dep/deputate/watermgt/wc/subjects/srceprot/source/WHPPOVER.htm. |
|
6 |
For further information on the Total Coliform Rule, see NRC (2004) or http://www.epa.gov/safewater/tcr/tcr.html#coliform. |
|
7 |
The implementing regulations for Act 610 (the Water Well Drillers License Act) are found in 17 Pennsylvania Code § 47 and are available on-line at http://www.pacode.com/secure/data/017/chapter47/chap47toc.html. |
|
BOX 3-1 Iowa is a rural state with 90 percent of the land under chemically intensive cultivation. The resulting threats to surface and groundwater have become a cause of concern as nitrate levels have risen and pesticides contaminate streams. Recreational waterbodies increasingly fail to meet EPA body contact guidelines for Escherichia coli. Many rural residents live on farms that have multiple wells in various states of repair, including shallow, hand-dug, brick-lined wells more than 100 years old; bored, cement-tile-cased wells; and drilled, steel cased wells. In addition, sand point wells are common along alluvial aquifers. The collective threat to groundwater and risks to individual and public health prompted the State of Iowa to pass the Groundwater Protection Act of 1987. In the 1990s, Iowa’s Grants to Counties Program was used to fund the identification and capping of thousands of abandoned wells, upgrades to existing wells requiring maintenance to meet current construction standards, and maintenance and improvements of septic systems adversely impacting groundwater. Counties were encouraged to apply for grant money and to provide oversight for well inspection, sampling, and testing and for sanitary surveys and improvements for septic systems. The program was highly successful because it was administered locally and preceded by an intensive public awareness program to inform stakeholders and potential participants. The program concept served as the basis of a subsequent Nine States Study supported by EPA and the Centers for Disease Control and Prevention to extend the program to the region (see http://www.cdc.gov/nceh/emergency/wellwater/default.htm for further information). When Iowa was settled in the 1800s, there were considerable expanses of wetlands. Farmers sought to recover this land for agriculture by installing drainage tiles that carried surface water to nearby streams or piped surface water to boreholes called agricultural drainage wells. As chemical-intensive farming practices became dominant, these tiled fields became a serious threat to surface and groundwater. Several programs have been implemented to seal these wells; however, substantial numbers of Iowa fields are still tiled to drain into surface streams. This threat to the aquatic environment and groundwater is not unlike combined sewer overflow events in urban southwestern Pennsylvania, and perhaps some of the approaches that have been successful in Iowa could be applied to the Pittsburgh region. Iowa has an extensive county extension service operated by Iowa State University. The extension service provides a local point of contact for information on health-related issues associated with drinking water and septic systems. Iowa has adopted state-of-the-art requirements for well construction and septic system construction and maintenance, and state law requires these programs be administered through local county health departments, according to regulations and guidelines provided by the Iowa Department of Public Health. The Commonwealth of Pennsylvania seems to lack programs similar to those described above. Existing sanitation regulations are often not enforced or are unenforceable, and there is an apparent need for modernization of sanitation and zoning laws in southwestern Pennsylvania. |
Associated Recreation estimates that 1.3 million anglers spent 18.3 million days fishing in the state (DOI and DOC, 2002). Fishing expenditures were estimated at $580 million (DOI and DOC, 2002). Estimates of fishing are not available for counties in the region, but there are extensive resources for fishing, boating, and swimming managed by the Pennsylvania Fish and Boat Commission and Department of Natural Resources and Conservation.8 Bacteriological indicator data (as described below) are used to assess attainment of contact recreational use criteria in the Commonwealth of Pennsylvania. Sampling is conducted during the swimming
|
8 |
See http://www.fish.state.pa.us/ and http://www.dcnr.state.pa.us/ for further information about these programs. |
season (May 1 through September 30) and is based on indicator organisms that suggest pathogenic organisms may be present and present a health risk to individuals during contact recreation.
Human Health—Fish Consumption
An important activity directly related to recreation is fish consumption, which often drives the specific use designation for surface waters. Water quality impairment can contaminate fish that may be caught from degraded rivers and streams, sometimes to levels that are considered unhealthy for public consumption. The Pennsylvania Fish Tissue Sampling and Fish Advisories Program is responsible for assessment of the attainment of human health use criteria in Pennsylvania waterways. Fish tissue samples are collected during low flow between August and October. Fish tissue concentrations are compared to standards, and decisions regarding fish advisories are made based on a mixture of risk assessment-based methods and U.S. Food and Drug Administration (FDA) Action Levels. Currently, Pennsylvania has a statewide health advisory for recreationally caught sport fish. This advisory recommends no more than one meal of sport fish per week and is based on concerns regarding unidentified contaminants in untested fish. Specific to southwestern Pennsylvania, there are fish advisories in the Ohio River valley related to polychlorinated biphenyls (PCBs), mercury, and chlordane. Advisories cover the main rivers (Allegheny, Monongahela, and Ohio) as well as a number of smaller tributaries, reservoirs, and lakes. Some advisories recommend restricted consumption at one or two meals per month, while others are “do not eat” advisories.
Aquatic Life Use
A final common designated use category, aquatic life use, specifically targets ecosystem health rather than human health and use. Water quality impairment can limit the diversity of aquatic life in an ecosystem, which many states, including Pennsylvania, have determined is of intrinsic importance and also has indirect effects on human health through recreation and fish consumption. Specifically, Pennsylvania uses aquatic life use data (habitat and biological indicator data) to assess the ability of its waterbodies to maintain and/or propagate fish species and additional flora and fauna that are indigenous to aquatic habitats in the state. Habitat is assessed visually using procedures from the Standardized Biological Field Collection and Laboratory Methods manual (as described in PADEP, 2004). Biological indicator data are collected through a biosurvey. Within lakes in the state, aquatic life use attainment decisions are based primarily on the ecological integrity of fish communities.
Water Quality Criteria
Ambient water quality criteria allow states to determine if their surface waters are impaired for designated uses and, if so, to develop total maximum daily loads (TMDLs) for these waters to ensure future attainment of water quality consistent with the designated use (see NRC, 2001, for a full explanation of the TMDL process). Table 3-3 summarizes EPA’s published
TABLE 3-3 Selected National Recommended Water Quality Criteria
water quality criteria for some chemical constituents. These national criteria were established to provide guidance for states, which are authorized to establish their own water quality standards (no less strict than national standards) to protect human health and aquatic life.
The Commonwealth of Pennsylvania through its Department of Environmental Protection (PADEP) has established numerical ambient water quality criteria for chemical constituents.9 Pennsylvania’s general information on water quality criteria states the following:
Water may not contain substances attributable to point or nonpoint source discharges in concentration or amounts sufficient to be inimical or harmful to the water uses to be protected or to human, animal, plant or aquatic life. In addition to other substances listed within or addressed by this chapter, specific substances to be controlled include, but are not limited to, floating materials, oil, grease, scum and substances which produce color, tastes, odors, turbidity or settle to form deposits.
As noted previously, water quality criteria are the numeric concentrations, levels, or surface water conditions that must be maintained or attained to protect existing and designated uses. In addition, a few distinct use designations require even more stringent water quality criteria. For example, waters designated by the Commonwealth of Pennsylvania for cold water fish use or for
|
9 |
See 25 PA Code § 93.6 for further information; available on-line at http://www.pacode.com/secure/data/025/chapter93/chap93toc.html. |
trout stocking as high quality, or as exceptional value waters, must meet the statewide water quality criteria plus lower permissible temperatures and higher standards for dissolved oxygen.
It should be noted that some of the Pennsylvania criteria may be superseded for the Delaware Estuary, Ohio River basin, Lake Erie basin, and Genesee River basin under interstate and international compact agreements with the Delaware River Basin Commission, the Ohio River Valley Water Sanitation Commission (ORSANCO), and the International Joint Commission, respectively. Southwestern Pennsylvania surface water is part of the Ohio River basin and is governed by water quality criteria developed by ORSANCO (see Chapter 6 for further information about ORSANCO). Table 3-4 lists surface water quality criteria as promulgated by ORSANCO. Notably, many of the criteria are stricter than the corresponding national water quality criteria summarized in Table 3-3.
Water quality criteria for bacteria were published by EPA in 1986 and updated in 2002 (EPA, 1986, 2002c). Because of the enormous number and types of pathogens to which humans could potentially be exposed, water quality criteria for human recreational contact specify allowable levels of certain indicator organisms, such as fecal coliforms and Escherichia coli (described later). The national criteria were selected based on epidemiological work suggesting that body contact at the target level would result in eight gastrointestinal illnesses per 1,000 swimmers in freshwater and 19 illnesses per 1,000 swimmers at marine beaches (EPA, 1986; NRC, 2004). “Excessive amounts of fecal bacteria in surface water used for recreation have been known to indicate an increased risk of pathogen-induced illness to humans. Infection due to pathogen-contaminated recreational waters includes gastrointestinal, respiratory, eye, ear, nose, throat, and skin diseases” (EPA, 2001b).
TABLE 3-4 Water Quality Criteria Promulgated by ORSANCO for Three Common Designated Uses
Water designated for human contact recreation is considered unimpaired if levels of indicator organisms do not exceed the water quality criteria summarized in Table 3-5. Water containing higher levels of indicator organisms is considered unsafe due to the likely presence of fecal bacteria and other waterborne pathogens, leading to contact recreational risk. Although the EPA recommends the use of E. coli and enterococci as indicator organisms, Pennsylvania has retained fecal coliform as the indicator of recreational water pollution. See NRC (2004) for further information on the use of indicators for waterborne pathogens.
Finally, as noted previously, not all water quality criteria are numeric. For many contaminants of concern such as nutrients, the criteria exist as narrative statements, which can make interpretation and thus determinations of attainment difficult (NRC, 2001).
WATER QUALITY MONITORING PROGRAMS IN PENNSYLVANIA
In order to determine the health of its surface waters and the extent to which its water quality standards are being met, each state has developed a comprehensive monitoring program. Section 305(b) of the CWA requires states to compile and summarize water quality information collected by their monitoring programs every two years. In 2002, EPA released the National Water Quality Inventory: 2000 Report—the thirteenth installment in a series beginning in 1975 that uses state 305(b) reports to identify widespread water quality problems of national significance and to describe various protection and restoration programs (EPA, 2002d). Furthermore, Section 303(d) of the CWA requires states to list streams and other waterbodies having “impaired” water quality. In 2000, EPA reported that about 21,000 river and stream segments, lakes, and estuaries encompassing more than 300,000 assessed stream-miles and 5 million lake-acres were impaired (EPA, 2000b). In 2004, Pennsylvania’s 305(b) and 303(d) reports were published together in a combined document entitled 2004 Pennsylvania Integrated Water Quality Monitoring and Assessment Report (PADEP, 2004).
TABLE 3-5 Water Quality Criteria for Bacterial Indicators by Recreational Designated Uses (CFU/ 100 mL)
|
|
|
Single Sample Maximum |
|||
|
Bacteria |
Steady State, 30-Day Geometric Meana |
Designated Beach Area |
Moderate, Full Body Contact Recreation |
Lightly Used, Full Body Contact Recreation |
Infrequently Used, Full Body Contact Recreation |
|
Fecal coliform |
200b |
|
|||
|
Enterococci |
35, 33c |
61 |
89 |
108 |
151 |
|
E. coli |
126 |
235 |
298 |
406 |
576 |
|
NOTE: CFU = colony forming units. aFive samples in a 30-day period. bNot more than 10% of the total samples may exceed 400 per 100 mL for samples from May through September. For the balance of the year the standard is 2,000 per 100 mL (25 PA Code § 93.7). cThe criterion for enterococci is 35 CFU/mL in freshwater and 33 CFU/mL in marine waters. SOURCE: EPA, 1986. |
|||||
The PADEP maintains a system of 120 water quality monitoring stations throughout the commonwealth called “routine stations.” At these stations, water quality sampling is conducted bimonthly for streamflow, physical analysis (e.g., temperature), and chemical analysis (e.g., dissolved oxygen) and annually for biological evaluation (including macroinvertebrate and fish tissue sampling). Routine stations are located at or near the mouths of streams with drainage areas of about 200 square miles or larger. Another 22 stations, called reference stations, have been established to represent ambient waters with minimal influence from human activity or to represent typical waters having quality similar to that of other waters found in the area. These 22 stations are usually sampled monthly for streamflow and physical and chemical analysis and three times per year for biological parameters. Fish tissue is sampled periodically at about 35 water quality network stations per year. Sampling activity is rotated through the network of stations to give complete coverage over time (PADEP, 2004).
Other than bacterial indicators of waterborne pathogens, the preceding section of this chapter does not list specific water quality criteria for biological parameters because bioassessment is an evolving and burgeoning field, with many states only recently adding new biological parameters to their monitoring programs. In some states, a modified version of EPA’s 1989 Rapid Bioassessment Protocol (RBP II)10 is used to determine if a waterbody is impaired for designated aquatic life use. The assessment is performed in “wadeable” streams and rivers where physical examination of the stream or river and biological sample collection can be conducted. The protocol includes an evaluation of the presence of and identification to the family level of one to three groups of biota: typically periphyton (algae) and/or benthic macroinvertebrates such as crustaceans, insects, snails, and shellfish. A habitat assessment is also performed, which includes characterizing the stream with regard to the nature of the channel, bottom materials, vegetative cover overhead (shade trees), riparian vegetation in general, and aquatic vegetation. Presence of tree trunks and limbs in the channel is also noted, because these constitute habitat.
Assessing the water quality of all the streams and rivers in Pennsylvania is not possible using only the 142 stations described above, so other monitoring programs are also conducted. Intensive surveys of streams and rivers are performed by PADEP for a variety of reasons, including the provision of background water quality data and assessing the effects of pollutant discharges on receiving waters. In addition, PADEP has a program to support volunteer monitoring efforts.11 The 2004 Pennsylvania Integrated Water Quality Monitoring and Assessment Report states that more than 180 groups including 11,000 people have taken part in statewide monitoring activities. The PADEP provides workshops and training and quality assurance sessions for volunteer monitors throughout the commonwealth. This kind of volunteer training and education is necessary to help maintain quality control and attain uniformity of reporting when many heterogeneous groups and individuals perform water quality assessments. For the 2004 303(d) process, there were 10 respondents to the PADEP request for data and information from outside sources, and 7 sets of data related to bacteriological monitoring were used to evaluate attainment of recreational uses.
In accordance with the SWAP program, approximately 96 percent of the 14,000 public water systems source waters were assessed by September 2003, with the balance to be completed
|
10 |
Details of the Rapid Bioassessment Protocol are available on-line at http://www.epa.gov/OWOW/monitoring/techmon.html. |
|
11 |
Further information on the volunteer efforts is available on-line at http://www.dep.state.pa.us/dep/deputate/watermgt/wc/subjects/cvmp/default.htm. |
by September 2004 (PADEP, 2004). In addition, PADEP initiated a Statewide Surface Water Assessment Program (SSWAP) for biological assessment in all of the commonwealth’s surface waters. In southwestern Pennsylvania, Watershed Restoration Action Strategy (WRAS) reports12 have been issued for the Redbank Creek watershed (Allegheny River), the Chartiers Creek watershed (Ohio River), the Raccoon Creek watershed (Ohio River), the Upper Youghiogheny River watershed (Laurel Hill Creek and Indian Creek), the Lower Youghiogheny River watershed, the Stonycreek River and Little Conemaugh River watersheds, the Blacklick Creek and Conemaugh River watersheds, and the Upper Monongahela River watershed (Dunkard, Big Sandy, Georges, and Whiteley Creeks) (see Figure 6-2 for a map of state-delineated watersheds in southwestern Pennsylvania).
In 2001, PADEP initiated a pilot project for monitoring 23 miles of stream segments believed to be at risk for recreational contact use due to bacterial contamination, the results of which were used to inform the 2002 305(b) report. The water contact use support evaluation for the 2002 305(b) report was based on this pilot study of 23 miles, of which 22 miles were found to be impaired. The report notes that this high percentage of impaired streams is due to a selection bias (i.e., the study was targeted at streams where problems were anticipated). The program has since expanded to include 140 miles of streams (PADEP, 2004).
In addition to PADEP, several other governmental and nongovernmental organizations are collecting data related to water quality in southwestern Pennsylvania, including the following:
-
U.S. Environmental Protection Agency
-
U.S. Geological Survey (USGS)
-
U.S. Army Corps of Engineers (USACE)
-
Ohio River Valley Water Sanitation Commission
-
Allegheny County Health Department (ACHD)
-
Allegheny County Sanitary Authority (ALCOSAN)
-
Three Rivers Wet Weather Demonstration Program (3RWW)/3 Rivers 2nd Nature (3R2N)
-
Pittsburgh Water and Sewer Authority (PWSA) and other drinking water providers
-
Water associations, schools, and other nongovernmental organizations
Available water quality data from these sources are discussed below. Some of these sources report their data to EPA’s Storage and Retrieval (STORET)13 computerized environmental data system; others maintain separate hard-copy and computer-based records. Most of these groups focus data collection on physical or chemical parameters of water quality. “Neither US EPA nor the Pennsylvania Department of Environmental Protection nor any other federal or state agency has yet made it a matter of priority to survey the rivers, streams, and creeks of the state for bacterial contamination” (Luneburg, 2004). Private monitoring by volunteer organizations generally does not extend to bacterial testing because of the high cost and professional sophistication of the testing required. Finally, a comprehensive GIS (geographic information system)-linked database of water quality monitoring data for the region does not exist.
|
12 |
WRAS Reports are available online at http://www.dep.state.pa.us/dep/deputate/watermgt/wc/Subjects/Nonpointsourcepollution/Initiatives/Wraslist.htm. |
|
13 |
For further information on STORET, see http://www.epa.gov/storet/. |
POLLUTANTS
The same broad classes of waterborne contaminants that are of concern in much of the country’s water supplies14 are also a concern in southwestern Pennsylvania. These include pathogenic microorganisms, organic carbon compounds, excessive nutrients, sediment, and toxic compounds. Unfortunately, in southwestern Pennsylvania, as in many parts of the nation, it is difficult if not impossible to determine the individual sources of contaminants found in water supply reservoirs, lakes, rivers, and groundwater because most activities and land uses produce multiple and often similar types of contamination. Furthermore, for financial reasons, monitoring tools are rarely deployed in a way capable of tracing a contamination event back to its source. Thus, this section first briefly summarizes the major classes of contaminants, then catalogs the available water quality data for the region. Chapter 4 discusses the types of activities prevalent in southwestern Pennsylvania that are likely sources of impaired water quality.
Pathogens
Nationally, pathogens (as measured by fecal indicator bacteria; see more below) are the leading cause of impairment in assessed rivers and streams (EPA, 2002d). Most waterborne pathogens of public health concern are not native to the surface waterbodies and groundwater of southwestern Pennsylvania and enter ambient waters from various point and nonpoint sources. Pathogenic microorganisms from human and animal waste have the potential to enter surface and groundwaters via a number of different mechanisms and to affect human health through one or more different exposure routes. Cryptosporidium parvum and Giardia lamblia are protozoan pathogens receiving increased public health and regulatory attention in the past few decades (NRC, 1999a). Giardiasis is a protozoan parasitic disease infecting primarily children, especially in developing nations and institutional settings (Ali and Hill, 2003). The trophozoite (free-living) form of Giardia lamblia does not survive in the ambient environment; however, the cyst stage (sporozite form) is relatively resistant to environmental conditions and persists in an infective state for weeks to months (Rose and Shifko, 1999). A wide variety of both feral and domesticated animals and pets carry Giardia spp. (Marshall et al., 1997). Similarly, free sporozites of Cryptosporidium may be shed from a variety of mammals, including humans (O’Donoghue, 1995); they are obligate intracellular parasites, requiring a host to reproduce, while the oocyst stage of Cryptosporidium spp. is highly resistant to environmental conditions, including disinfection levels typically used in drinking water treatment (Robertson et al., 1992). Cryptosporidium spp. infect livestock, humans, and other animals, although host specificity restricts human infections to Cryptosporidium parvum Genotypes 1 and 2 (Rose et al., 2002). Although cryptosporidiosis is self-limiting in immunocompetent hosts, it causes devastating disease in immunocompromised individuals, and it is a leading cause of death in AIDS patients (Guerrant, 1997).
Waterborne pathogenic microorganisms of concern in southwestern Pennsylvania also include bacteria. Escherichia coli O157:H7 is one of many toxigenic strains of E. coli that cause
gastroenteritis in humans. It is frequently detected in livestock, shed in cattle manure, and thus a component of agricultural runoff. E. coli O157 has been isolated from deer, and experiments infecting deer with the organism have demonstrated shedding similar to that in cattle; it has also been isolated from dogs and swine (Feder et al., 2003; Hammermueller et al., 1995)
Although disease outbreaks of E. coli are usually associated with ground meat products and improper handling or eating of undercooked beef, waterborne outbreaks of this microbe have occurred from sewer contamination of potable water lines, from manure contamination of surface waters used for recreation, and from contamination of well water used for drinking (Geldreich et al., 1992; O’Connor, 2002). Other waterborne bacterial pathogens of public health concern include Campylobacter, Helicobacter, and Salmonella. Shigellosis (from Shigella spp.) is one of the most common diseases associated with recreational exposure to untreated surface water. Shigella spp. are unique to humans, and their presence in the recreational environment is indicative of human fecal contamination from infected individuals or of sewage or septic tank origin.
A third major class of pathogenic microorganisms important in waterborne disease is viruses. For example, human caliciviruses, which cause diarrheal illness, are thought to be present in sewage and discharged into surface waters in wastewater effluents and during combined sewer overflow (CSO) events, where they could threaten drinking water sources, recreational bathing beaches, and shellfish growing areas (Schaub and Oshiro, 2000). In some cases, viruses have been reported to cause waterborne disease outbreaks, including recreational waterborne disease (Lee et al., 2002; Levy et al., 1998). Lastly, waterborne disease outbreaks resulting in acute gastrointestinal illness of unknown etiology are widely thought to be caused by viruses (NRC, 2004). However, calicivirus concentrations are generally not known in surface water, the efficacy of their removal during sewage treatment has not been determined, and little is known about their persistence and survival in the environment.
Because it is impractical to test waters for all possible pathogenic organisms, the microbiological quality of water is often assessed through the use of indicator microorganisms (usually bacteria) to monitor potable water sources and recreational waters and to determine the treatment efficacy of drinking water and wastewater treatment plants (for a recent comprehensive review of indicators, see NRC, 2004). Two bacterial groups (coliforms15 and enterococci) are commonly used as indicators of possible fecal contamination. Although these groups are typically not pathogenic, fecal indicator bacteria are used to provide an estimation of the amount of feces and, indirectly, the presence and quantity of fecal pathogens in water. Total coliforms indicate the presence of fecal microorganisms that should not be present in the finished water and must have entered through contamination or failure in the treatment process. However, total coliforms are not typically used to evaluate surface waters because they can come from sources other than fecal contamination. Instead, fecal coliforms are generally used to assess the microbial quality of surface and recreational waters. Enterococci are present in the digestive systems of mammals and have been used as an indicator organism since the 1950s, albeit less frequently than fecal coliforms. EPA (2002c) recommends using E. coli and enterococci—the latter also known as fecal streptococci and intestinal enterococci—as better microbial indicator organisms of human health risk when monitoring surface waters, particularly marine recreational waters (WHO, 2000).
Unfortunately, fecal indicator bacteria monitoring is generally considered insufficient to reliably detect viruses and protozoan parasites in drinking water sources or ambient (recreational) waters (NRC, 2004). However, bacteriophages, or viruses that infect bacteria—especially in groundwater—may be useful as indicator organisms and surrogates for viral transport and attenuation. That is, viruses exhibit transport and attenuation behavior distinct from that of bacteria because of size, adsorption characteristics, and other physical factors (Azadpour-Keeley et al., 2003; Higgins et al., 2000; Pesaro et al., 1995). EPA has also supported recent research to determine whether coliphages (viruses that infect E. coli) may be a suitable indicator of fecal-contaminated waters.
Nutrients and Organic Carbon
One of the leading water quality issues associated with agriculture, urban stormwater discharges, and domestic wastewater discharges in the United States is nutrient pollution—particularly excessive nitrogen and phosphorus. Nationally, nutrient pollution is the leading cause of impairment in lakes, ponds, and reservoirs (EPA, 2002c). These and other nutrients are routinely applied to cropland in manufactured fertilizers and animal manures to increase yields. In areas with highly intensive livestock production such as animal feeding operations, manure may be applied to cropland primarily to dispose of the waste and secondarily as a fertilizer. Nutrients are also found in some common household products as well as in human waste and can thus end up in wastewater treatment plants, septic systems, and their receiving waterbodies (if not properly treated). Nitrogen in the form of nitrate is easily soluble in water and is transported in runoff, in agricultural tile drainage, and with septic system leachate. Phosphate is only moderately soluble and, relative to nitrate, is not very mobile in soils. However, erosion can transport considerable amounts of sediment-adsorbed phosphate to surface waters.
Excessive nutrients in waterbodies have been shown to cause eutrophication, a process in which increasing nitrogen and phosphorus levels stimulate excessive algae growth, with dramatic (usually adverse) effects on the aquatic ecology. Following an algal bloom, decaying algae are degraded by aerobic microorganisms that deplete the water column of dissolved oxygen, endangering fish and other aquatic life. Algal blooms can also block the sunlight needed by aquatic vegetation, causing the vegetation to die off. This loss in vegetation often leads to subsequent death of fish and other aquatic life higher up the food chain. Eutrophication of freshwater is usually due to phosphates, while nitrates are usually the cause of coastal water eutrophication (NRC, 1992, 1993).
Organic carbon can cause eutrophication via similar mechanisms. When biodegradable organic matter is discharged into receiving waters, bacteria utilize it as a food source and, at the same time, use oxygen in their life processes. As bacteria multiply and more bacteria use the food source, oxygen consumption increases. Eventually, if sufficient biodegradable organic matter is present, all of the oxygen in a stream, river, or lake may be consumed and the water becomes anaerobic. Even if surface water does not become completely anaerobic, oxygen depletion at depth may be sufficient to harm or kill aquatic organisms such as fish. Biodegradable organic matter may occur as dissolved substances, such as sugars or starches from food processing wastes, or in particulate form, such as fecal matter discharged from a malfunctioning septic tank or an overflowing storm sewer or sanitary sewer.
Excessive organic carbon in surface water sources of drinking water can also constitute a public health risk. When certain types of organic carbon react with disinfectants associated with conventional drinking water treatment, potentially carcinogenic disinfectant by-products may result (see EPA, 2003, and NRC, 1987, for further information).
Sediment
A variety of land uses, from agriculture to urban and suburban development, can increase rates of sediment transport from the land to adjacent waterbodies. Disturbing the soil through tillage and cultivation or altering its vegetative cover, especially riparian vegetation adjacent to waterbodies, increases the rate of soil erosion. Dislocated soil particles carried in urban stormwater and agricultural runoff can impair the water quality of streams, rivers, lakes, reservoirs, and wetlands. Excessive sediment causes various types of damage to water resources. For example, accelerated reservoir siltation reduces the useful life of reservoirs. Sediment can clog roadside ditches and irrigation canals, block navigation channels, and increase dredging costs. Sediment can also destroy and degrade aquatic wildlife habitats by covering fish eggs and smothering benthic organisms, reducing diversity and damaging commercial and recreational fisheries. High concentrations of suspended solids can also prevent sunlight from reaching plants in deep water and thus reduce their growth or even result in their death (Livingston et al., 1998). Finally, suspended solids in water cause turbidity, which can increase the cost of water treatment for municipal and industrial water uses. In the United States, sediment is the second leading cause of impairment of rivers and streams and the third leading cause of impairments in lakes, ponds, and reservoirs (EPA, 2002c).
Sediment also provides a delivery mechanism for phosphorus and other pollutants that adhere strongly to sediment particles. Many toxic materials can be tightly bound to clay and silt particles, including some nutrients, pesticides, industrial wastes, metals from mine spoils, and radionuclides (Osterkamp et al., 1998). Depending on the conditions of the receiving water, these compounds may desorb from sediment particles and constitute a threat to both ecological receptors and humans. Furthermore, resuspension of sediment in stream and lake beds can release nutrients and entrained microorganisms (both pathogens and indicator organisms) into the water column (Medema et al., 1998; Schallenberg and Burns, 2004).
Monitored bacterial indicator levels are sensitive to suspended solids, such that indicator concentrations rise sharply with resuspension of sediment (Jensen et al., 2002; VADEQ, 2000). Regrowth of bacteria can occur in sediment and has been documented in several studies conducted in warmer climates (Desmarais et al., 2002; Jensen et al., 2002), and researchers at Gannon University are conducting studies to determine regrowth potential in temperate climate beach sediments on Lake Erie.16 Concerns about bacterial regrowth potential and impacts of sediment loading are issues raised in the American Society of Microbiology’s comments on EPA’s proposed policy on National Pollutant Discharge Elimination System (NPDES) permit regulation for wet weather discharges (ASM, 2004).
|
16 |
See http://www.gannon.edu/resource/dept/enviro/research.html for further information. |
Pesticides and Other Chemicals of Concern
Pesticide residues reaching surface water systems may harm freshwater and marine organisms and damage recreational and commercial fisheries (Pait et al., 1992). Aquatic species and their predators can suffer chronic adverse effects from low levels of exposure to pesticides over prolonged periods. Pesticides can also accumulate in the fatty tissue of animals such as shellfish to levels much higher than in the surrounding water (bioaccumulation), and consumption of these animals may lead to chronic effects in predators (biomagnification). These processes are responsible for the damaging effects of dichlorodiphenyltrichloroethane (DDT), which led to its ban in 1972. Herbicides and insecticides in the aquatic environment can also harm birds and other wildlife that feed on the chemicals’ target plants and insects.
Many pesticides are probable or possible human carcinogens (Engler, 1993) and could pose risks to human health via ingestion of drinking water. Although the overall state of knowledge about chronic effects of pesticides on human health is quite limited, concerns have been raised about the consequences of low exposures over long periods of time. For example, there is a higher incidence of lung and other types of cancer in farmers and farm workers involved in the handling and application of pesticides (WHO, 1990). In addition to cancer, questions have been raised about other possible effects of pesticide exposure. Thus, regulation of public water supplies requires additional treatment when certain pesticides exceed established health safety levels in drinking water supplies. Box 3-2 describes the effects of some relevant toxic compounds in both fish and humans, which is of considerable concern in the southwestern Pennsylvania region given the significant role of recreation in the regional economy (described later). Box 3-3 summarizes the presence of endocrine disruptors, pharmaceuticals, and personal care products in the aquatic environment.
Understanding the sources, distribution, and control of pesticides in southwestern Pennsylvania waters, as well as potential threats to recreational waters, requires investigation of both current and past pesticide application practices in both agricultural and urban and suburban environments. Southwestern Pennsylvania agricultural production has been primarily dairy, beef, sheep, and other livestock; pasture; hay and forage crops; truck farming and direct marketing of produce; nursery production; orchard production, and woodlot production (USDA, 1997). With the exception of apples and corn, most of these types of agriculture are relatively less intensive in pesticide use. With increasing consumer awareness, increased EPA controls, adoption of integrated pest management (IPM) practices, and the relatively high cost of commercial and agricultural pesticides, pesticide use in nursery and produce farming has become even less intensive in recent years. Residues of older, banned agricultural pesticides such as DDT may pose a public health problem in some areas (e.g., soil residues of lead and arsenic formerly applied in apple orchards).
A potentially greater concern for pesticide contamination, given the Pittsburgh region’s significant suburban growth in recent decades, may be urban or suburban use of lawn and landscape pesticides (discussed later; Anderson et al., 2000). Unlike agricultural pesticides—which are controlled by EPA and state regulations regarding purchase, application, storage, disposal, applicator certification, worker protection, and record keeping and are often costly enough for economics to dictate prudent use—oversight of household use of pesticides is considerably less stringent. Although the EPA has recently phased out many of the more toxic products for home use and pesticide labels are the law, the reality is that private consumers can purchase and use pesticides virtually indiscriminately. Unlike agricultural settings, where soil
|
BOX 3-2 The health effects caused by ingesting chemically contaminated fish are summarized in fish advisories issued by the EPA, but the text tends to include medical and technical terms that may be unfamiliar to the general public. The Agency for Toxic Substances and Disease Registry (ATSDR) has developed fact sheets (ToxFAQs™) on numerous toxic chemicals, including those found in fish in southwestern Pennsylvania. These fact sheets discuss the toxic chemicals, their sources and effects in the environment, and adverse human health effects. They also summarize the evidence of their carcinogenicity based on information from the Department of Health and Human Services (DHHS), the EPA, and the International Agency for Research on Cancer (IARC). The information on health effects of select chemicals in fish provided below is based on ATSDR fact sheets. Aldrin and Dieldrin Aldrin and dieldrin are insecticides with similar chemical structures. Their use in the United States was banned in 1974, with an exception for termite control. In 1987, all uses of these insecticides were banned by EPA. Because aldrin degrades to dieldrin in the environment, the latter is more commonly found. Dieldrin binds to soil particles and breaks down very slowly in soil and in water. It accumulates in the fat of fish. Thus, one means of human exposure is eating fish contaminated with dieldrin. The ToxFAQs for Aldrin and Dieldrin (ATSDR, 2002a) indicates that persons who ingested large amounts of aldrin or dieldrin have suffered convulsions and some have died. Long-term, moderate exposure by air has led to reports of headaches, dizziness, irritability, vomiting, and uncontrolled muscle movements. The fact sheet indicates that although aldrin and dieldrin have caused liver cancer in mice, the IARC has determined that these chemicals are not classifiable with regard to human carcinogenicity. However, the EPA has determined that they are probable human carcinogens. Chlordane Chlordane was used as a pesticide in the United States from 1948 to 1988, after which it was banned. It adheres strongly to soil particles, so stream and river sediments may contain chlordane. Eating fish and shellfish from water contaminated by chlordane is one means of human exposure. In this regard, the U.S. Food and Drug Administration limits the safe amount of chlordane and its breakdown products to less than 100 parts per billion in fish. The ToxFAQs for chlordane (ATSDR, 1995) states that “chlordane affects the nervous system, the digestive system, and the liver in people and animals.” Headaches, weakness, vision problems, vomiting, diarrhea, and jaundice have occurred in people who breathed air containing high concentrations of chlordane or accidentally swallowed small amounts of chlordane. Large amounts of ingested chlordane can cause convulsions and death in people; however, there is no evidence that chlordane exposure causes cancer. Chlorinated Dibenzo-p-dioxins (“dioxins”) Chlorinated dibenzo-p-dioxins are not manufactured chemicals but are by-products of processes that use chlorine. Dioxins can form during incineration of some types of solid wastes that contain chlorinated compounds, can attach to soil particles, and can be found in lake and stream sediments. One major form of human exposure is ingesting contaminated fish. In this regard, the FDA recommends against eating fish with concentrations of 2,3,7,8-TCDD (tetrachlorodibenzo-p-dioxin) exceeding 50 parts per trillion. The ToxFAQs for chlorinated dibenzo-p-dioxins (ATSDR, 1999a) indicates that chloracne is the most common human health effect, though liver damage may occur in some people. Changes in hormonal levels may be caused by exposure to high concentrations of CCDs. The DHHS has |
|
determined that 2,3,7,8-TCDD may reasonably be anticipated to cause cancer, and the World Health Organization has determined that 2,3,7,8-TCDD is a human carcinogen. DDT, DDE, and DDD DDT was widely used in the United States for mosquito control and as an agricultural pesticide until its use was banned in 1972 because of harm to wildlife. Commercially produced DDT was contaminated with two similar chemicals, DDE (dichlorodiphenyldichlorethylene) and DDD (dichlorodiphenyldichlorethane). DDT breaks down quickly in sunlight but may remain in soil for years because it adheres strongly to soil particles. It can accumulate in fatty tissue of fish, so eating contaminated fish is a potential route of exposure. The ToxFAQs for DDT, DDE, and DDD (ATSDR, 2002b) states that “DDT affects the nervous system. People who accidentally swallowed large amounts of DDT became excitable and had tremors and seizures. These effects went away after the exposure stopped. No effects were seen in people who took small daily doses of DDT by capsule for 18 months. A study in humans showed that women who had high amounts of a form of DDE in their breast milk were unable to breast feed their babies for as long as women who had little DDE in the breast milk. Another study in humans showed that women who had high amounts of DDE in breast milk had an increased chance of having premature babies.” The DHHS has determined that DDT may be reasonably anticipated to be a human carcinogen, and the EPA has determined that DDT, DDE, and DDD are probable human carcinogens. The IARC considers that DDT is a possible human carcinogen. Mercury Mercury enters the environment as a waste from manufacturing plants, as a result of burning coal and solid waste (if the latter includes products containing mercury), from natural deposits and volcanic emissions, and by waste disposal practices. Bacteria in water and soil can convert inorganic mercury to methylmercury. Eating fish or shellfish contaminated with methylmercury is a public health concern. Older and larger fish may contain more methylmercury because it accumulates in fish tissues over time. The FDA has set a maximum permissible concentration of 1 part per million (ppm) for methylmercury in seafood (ATSDR, 1999b). Health effects of methylmercury are described as follows (ATSDR, 1999b): “The nervous system is very sensitive to all forms of mercury. Methylmercury and metallic mercury vapors are more harmful than other forms, because more mercury in these forms reaches the brain. Exposure to high levels of metallic, inorganic, or organic mercury can permanently damage the brain, kidneys, and developing fetus. Effects on brain functioning may result in irritability, shyness, tremors, changes in vision or hearing, and memory problems.” “Short-term exposure to high levels of metallic mercury vapors may cause effects including lung damage, nausea, vomiting, diarrhea, increases in blood pressure or heart rate, skin rashes, and eye irritation.” “Mercury’s harmful effects that may be passed from the mother to the fetus include brain damage, mental retardation, uncoordination, blindness, seizures, and inability to speak. Children poisoned by mercury may develop problems of their nervous and digestive systems, and kidney damage.” The EPA has determined that mercuric chloride and methylmercury are possible human carcinogens, according to the ATSDR. PCBs Polychlorinated biphenyls were manufactured in the United States until 1977 and used as coolants and lubricants in electrical equipment especially transformers. They entered the environment as a result of manufacturing, use, and disposal. PCBs do not break down rapidly in the |
|
environment, and they adhere to soil particles. For these reasons, they are found in the sediments of rivers, streams, and lakes. Contaminated sediments can cause contamination of fish, with concentrations in fish being many times greater than concentrations in water. Eating contaminated fish is a means of exposure. The FDA requires that fish contain no more than 0.2 to 3 ppm of PCBs. The ATSDR ToxFAQs report for PCBs (2001) states that “the most commonly observed health effects in people exposed to large amounts of PCBs are skin conditions such as acne and rashes. Studies in exposed workers have shown changes in blood and urine that may indicate liver damage. PCB exposures in the general population are not likely to result in skin and liver effects.” The fact sheet notes that women who ingested large amounts of fish contaminated with PCBs or who had relatively high levels of exposure at work gave birth to babies weighing slightly less than women who did not have such exposure, and babies born to mothers who ate fish contaminated by PCBs displayed some abnormal responses in infant behavior tests. The DHHS has concluded that PCBs may reasonably be anticipated to be carcinogens, while EPA and IARC have determined that PCBs are probably carcinogenic to humans. |
and vegetation may slow the transport of pesticides to streams, the greater extent of impervious surfaces in more urbanized areas may allow pesticides to travel rapidly in runoff overland to streams or into storm sewers. In some areas of the United States (e.g., Fort Worth, Texas), home use of pesticides such as diazinon and malathion has created water pollution problems severe enough to warrant EPA action in the form of large fines and expensive upgrades to treatment plants.17 As discussed in a later section of this chapter, the USGS National Water Quality Assessment (NAWQA)18 program indicates that certain pesticides detected in a dominantly urban-suburban watershed in the Pittsburgh area may have originated from lawn care sources.
Metals
The status of metals in the Allegheny and Monongahela River basins was discussed in the USGS report on water quality (Anderson et al., 2000; see also Appendix B). Concentrations of metals in bed sediment were measured because contaminated sediments can adversely affect aquatic life. The results were compared to the probable effect level (PEL) values set in Canada (Canadian Council of Ministers of the Environment, 1995) because standards for metals in bed sediment had not been developed in the United States. Arsenic was detected in bed sediment in all 50 sites, and the concentration exceeded the PEL of 17 µg/g in 12 of 50 sites, with a maximum of 52 µg/g. Anderson et al. (2000) noted that land use did not appear to be a factor in arsenic concentrations in sediment.
The presence of other metals in bed sediments did seem to be affected by land use. Zinc and chromium were found in bed sediments at all 50 sites. Zinc exceeded the PEL of 315 µg/g in 15 sites, while chromium exceeded the PEL of 90.0 µg/g at 5 sites. At four of the sites specifically identified and having zinc concentrations higher than the PEL, land use was either mining or mixed land use. Three of those four sites equaled or exceeded the PEL for chromium
|
17 |
See http://ci.fort-worth.tx.us/water/perticidewtrqual/pestFAQ.htm for more information. |
|
18 |
Information about the NAWQA Program is available on-line at http://water.usgs.gov/nawqa/; see also NRC (2002). |
and were among the highest 25 percent of the most degraded sites nationally (Anderson et al., 2000). Other metals found in the sediments and seemingly related to land use were cadmium, lead, and mercury, each of which exceeded the PEL at least once in samples obtained in mixed land use or mined sites. Anderson et al. (2000) noted that although no guidelines exist for cadmium in whole-fish samples, the results from this study were among the highest sampled by NAWQA during 1995-1998.
Anderson and colleagues (2000) noted an effect of surface coal mining on shallow domestic water supply wells, which exceeded secondary maximum contaminant levels for iron and manganese more often than wells in areas not influenced by surface mining. In addition, sulfate concentrations in groundwater usually exceeded the regional background concentrations for sulfate at distances of less than about 1,000 feet from surface coal mines. The importance of coal mining and acid mine drainage to the regions’ water quality is discussed more fully in Chapters 2 and 4.
CURRENT WATER QUALITY CONDITIONS
This section reviews the available water quality data for southwestern Pennsylvania. Data on bacterial indicators and protozoan pathogens in both the main stem rivers and their tributaries demonstrate that water quality standards are often unmet and high pesticides levels in fish have been reported. The most recent 305(b) and 303(d) data (PADEP, 2004) confirm that specific uses including fish consumption, drinking water, and recreational use are restricted due to impairments.
Physical and Chemical Parameters
Table 3-6 shows medians and ranges of values for several common water quality parameters for periods from two to six years in the three main stem rivers in the Pittsburgh region. With the exception of pathogen indicators, water quality in the main stem rivers in southwestern Pennsylvania is acceptable (compare with standards in Table 3-4).
A 1993 study found that all groundwater suppliers were in compliance with primary maximum contaminant levels (Chester Engineering, 1996). The primary contaminants cadmium and trichloroethylene were detected at one location, and the secondary contaminants iron, manganese, color, and dissolved solids were detected at five locations. Adequate treatment was in place for these contaminants at the detected locations. Private wells are not routinely sampled in southwestern Pennsylvania. One study in the Upper Mahoning Creek basin of the Allegheny River watershed (USGS, 1996) found that 76 percent of tested wells had at least one constituent concentration that exceeded one primary or secondary maximum contaminant level (SMCL). Concentrations of iron, lead, manganese, pH, bacteria, and radon were commonly detected in excess of standards, though maximum exceedances for all constituents except bacteria, cadmium, and radon were associated with mining activities.
|
BOX 3-3 In recent years, questions have been raised about the presence of traces of a variety of compounds in natural waters, wastewater, and drinking water. Trace concentrations of endocrine disruptors, pharmaceutical products, and personal care products have been found in the environment. Some are thought to cause problems such as abnormal sexual development in fish. This discussion of trace compounds in water explains what endocrine disruptors are and gives some examples of the kinds of compounds that are known or thought to be endocrine disruptors. In addition, the presence of pharmaceutical products and personal care products in the environment is discussed. Some knowledge of the treatability of these compounds is presented, although information on this is quite limited at present. Endocrine disruptors are chemicals that interfere with endocrine system function in a variety of ways (Trussell, 2001). The endocrine system functions to regulate growth, behavior, and reproduction in living organisms. The endocrine system includes glands that secrete hormones, the hormones themselves, and other cells in the organism that have hormone receptors. The endocrine system can be disrupted by the presence of other compounds that mimic natural hormones and stimulate some action in a cell. A different form of disruption occurs when a compound prevents or blocks the action of a natural hormone, preventing the action in the cell from taking place. The pesticide DDT behaves as a blocker (Trussell, 2001). A variety of persistent chemical compounds that are not readily degraded can be found in wastewater and natural waters. Known or potential endocrine disruptors, personal care products, and pharmaceutical compounds such as prescription drugs and over-the-counter medications have been identified in surface waters in the United States (Kolpin et al., 2002). These include the following:
The presence of such compounds in natural waters, wastewaters, and drinking water has been documented increasingly in recent years as analytical chemistry methods enable scientists to detect ever-decreasing concentrations of such compounds in water. The extent to which the kinds of |
Microbiological Parameters
As discussed previously, levels of “pathogens” (as measured by bacterial indicator organisms) are monitored periodically by the state to assess the potential fecal contamination of Pennsylvania waters and to determine if a waterbody meets its designated use for drinking water (as part of human health) or recreational use. The 2004 Pennsylvania Integrated Water Quality Monitoring and Assessment Report (PADEP, 2004) provides information on impairment of waters related to microbiological contamination; however, it does not provide specific data on concentrations of pathogens or indicator organisms. Statewide, pathogens are implicated in 23 of 1,373 impaired miles for human health use (both drinking water and fish consumption),
|
compounds discussed above act as endocrine disruptors is largely unknown at this time. In 1996 the U.S. Congress directed EPA to develop an endocrine disruptor screening program and to screen endocrine disruptors found in drinking water. The EPA’s Endocrine Disruptor Screening Program is relatively new, and EPA estimates that 87,000 chemicals in commerce might have to be evaluated for potential risks. A report by the National Research Council (NRC, 1999b) indicated that much work needs to be done to address the questions related to endocrine disruptors, or hormonally active agents, as these compounds were referred to in that report. The committee’s recommendations for screening and monitoring endocrine disruptors were “…consistent, in principle, with those of EPA’s Endocrine Disruptor Screening and Testing Advisory Committee.” In a high school research project that won the Grand Laureate at the International Stockholm Junior Water Prize competition, Mulroy (2000) detected penicillin, tetracycline, and vancomycin in water samples from a 44 km segment of the Ohio River near Wheeling, West Virginia, and two tributary streams. All E. coli cultured from sample sites exhibited acquired antibiotic resistance, with the greatest acquired resistance appearing in samples containing the highest concentrations of antibiotics. Mulroy also detected antibiotics in tap water, at lower concentrations than in the stream and river samples, from three municipalities whose sources are in the study area. The concept that pharmaceuticals in municipal wastewater might have adverse environmental effects is not new. Snyder et al. (2003) wrote that Stumm-Zollinger and Fair in 1965 and Tabak and Bunch in 1970 expressed concern that natural and synthetic estrogens could become an ecological threat. Snyder et al. (2003) reviewed the treatability of some persistent compounds that are among the categories of pharmaceuticals, endocrine disruptors, and personal care products. They concluded that coagulation would be expected to remove only those compounds that sorb onto particles or colloidal material having a high content of organic carbon. Activated carbon adsorption would be expected to remove hydrophobic compounds very well, but competition for adsorption sites has not been studied thoroughly in the context of the compounds of interest. Oxidation with ozone would occur more rapidly than with chlorine dioxide or chlorine. Although not mentioned by Snyder et al. in their summary of water treatment, oxidation by ozone or other oxidants may result in a partial degradation of complex organic molecules, and the health effects and endocrine-disrupting capabilities of the degradation products are likely to be unknown. Many pharmaceuticals, endocrine disruptors, and personal care products tend to resist biodegradation and hence have been found in streams, even though they had passed through wastewater treatment plants. This suggests that such compounds may resist degradation in the environment if they are spilled onto the earth’s surface, so some of these compounds may also be found in stormwater runoff. Many of the compounds of concern are excreted by humans after they have been ingested for medicinal purposes or otherwise, so they will be found in wastewater, whether in separate sewer systems or in combined sewer systems. Given the present degree of wastewater treatment generally practiced (secondary or biological treatment), one can expect these compounds to be present in most treated wastewater and in natural waters. |
representing less than 2 percent of the cause of impairment. Overall, 70 percent of the assessed stream-miles are impaired (PCBs are the leading cause). Pathogens are implicated in all of the 127 stream miles that are impaired for recreational use. Statewide, 90 percent of the assessed miles are impaired, though as noted previously, very few (140) miles have been assessed for recreational use—and those were targeted as being at risk from microbial contamination.
Despite the absence of specific data in the integrated 303(d) and 305(b) report for southwestern Pennsylvania, there are many smaller-scale monitoring efforts and studies in the region for which microbial parameters have been measured and documented as described below.
TABLE 3-6 Surface Water Quality of Major Rivers in Pittsburgh Metropolitan Area
|
Parameter |
Median |
Maximum |
Minimum |
|
Ohio River at Sewickley: 11/14/2000 through 09/08/2001 |
|
||
|
Turbidity, NTU |
11.5 |
50. |
2.5 |
|
Dissolved oxygen, mg/L |
9.8 |
14.3 |
7.2 |
|
pH, units |
7.6 |
8.0 |
6.5 |
|
Alkalinity, mg/L as CaCO3 |
40.5 |
50 |
28 |
|
Dissolved organic carbon, mg/L |
2.2 |
3.1 |
1.7 |
|
Sulfate, mg/L |
66.1 |
107 |
44.5 |
|
E. coli, CFU/100 mL |
250 |
3,100 |
<5 |
|
Allegheny River at New Kensington: 12/6/95 through 09/29/2000 |
|
||
|
Dissolved oxygen, mg/L |
10.0 |
14.8 |
7.2 |
|
pH, units |
7.5 |
8.0 |
5.5 |
|
Sulfate, mg/L |
53.2 |
113 |
22.5 |
|
Monongahela River at Braddock: 12/07/95 through 09/27/2001 |
|
||
|
Turbidity, NTU |
14 |
75. |
4.9 |
|
Dissolved oxygen, mg/L |
8.2 |
13.9 |
6.1 |
|
pH, units |
7.5 |
8.1 |
5.8 |
|
Dissolved organic carbon, mg/L |
1.7 |
2.6 |
1.0 |
|
Sulfate, mg/L |
94.5 |
225 |
27 |
|
NOTE: NTU = nephelometric turbidity units; used to measure the clarity of water. SOURCE: Data from http://waterdata.usgs.gov/pa/nwis. |
|||
Surface Water
Drinking Water Providers. Water treatment plants routinely monitor source waters for the presence of microbial contaminants and indicator organisms. Of the 23 water producers in Allegheny County 5 were required to participate in the EPA Information Collection Rule (ICR) pathogen and disinfection by-products data collection activity from 1997 to 1998. No other water providers in southwestern Pennsylvania (either inside or outside Allegheny County) were required to collect pathogen data under the ICR because none served at least 100,000 people. In general and as discussed below, the ICR data19 for Allegheny County show that pathogens are routinely present in source waters for public drinking supplies.
Two water treatment plant sites for the Pennsylvania American Water Company are located on the Monongahela River. Monongahela River source water was found to contain Cryptosporidium (20 of 36 samples) at concentrations from 14 to 309 oocysts per 100 L and Giardia (31 of 36 samples) at concentrations from 18 to 292 cysts per 100 L. It is important to note, however, that these concentrations—or those report below—are not necessarily for viable/infective (oo)cysts. Coliform bacteria were always detected at concentrations that ranged from 40 to 24,000 per 100 mL while viruses were intermittently detectable (8 of 36 samples) in concentrations from 2.1 to 27.9 (most probable number, MPN) per 100 L.
Two water treatment plants are on the Allegheny River (Pittsburgh Water and Sewer Authority [PWSA] and Wilkinsburg-Penn Joint Water Authority). Allegheny River waterways
|
19 |
The ICR data are available on-line at http://www.epa.gov/enviro/html/icr/state/PA.html. |
were found to intermittently contain Cryptosporidium (10 of 36 samples) at concentrations from 5 to 106 oocysts per 100 L, with all but one of the positive values at the PWSA plant. Allegheny River water intermittently contains Giardia (13 of 36 samples) at concentrations ranging from 10 to 263 cysts per 100 L. Coliform bacteria were generally detected (33 of 36 samples) at concentrations ranging from 150 to 23,600 per 100 mL and viruses (20 of 36 samples) at concentrations from 1 to 13.9 MPN per 100 L.
One water treatment plant for the West View Municipal Authority uses Ohio River water as a source. Ohio River water rarely contained Cryptosporidium (3 of 18 samples) at concentrations ranging from 31 to 45 oocysts per 100 L. Giardia was more commonly detected (8 of 18 samples) at concentrations of 13 to 471 cysts per 100 L. Total coliform counts ranged from 500 to 6,100 per 100 mL in the river, while viruses were usually detectable (12 of 18 samples) in concentrations from 1 to 7.1 MPN per 100 L.
The Municipal Authority of Westermoreland County draws water from a variety of local waterways, including the Youghiogheny River, Indian Creek, and Beaver Run. Data collected under the ICR are available for the Indian Creek Treatment Plant. Although Cryptosporidium were not detected in Indian Creek water, Giardia were intermittently detected (7 of 18 samples) at concentrations ranging from 10 to 204 cysts per 100 L. Coliform bacteria were always detected, with concentrations between 10 and 800 per 100 mL, and viruses were detected (9 of 18 samples) at concentrations between 1 and 24.1 MPN per 100 L.
3 Rivers 2nd Nature. The 3RWW20 initiated a project in 2000 entitled 3 Rivers 2nd Nature to assess water quality in surface waters in southwestern Pennsylvania. This study includes dry weather and wet weather monitoring for fecal coliforms and E. coli along with several geochemical parameters. Data for 2000 were collected in the Pittsburgh Pool, which includes the areas of the three rivers encompassing the Point and upstream on the Allegheny and Monongahela Rivers to their first locks and downstream on the Ohio to the first lock. In this monitoring context, pool is defined as the water contained within the three rivers up to the first lock and dam (L/D) on each main stem river (L/D 2 on the Allegheny, L/D 2 on the Monongahela, and the Emsworth L/D on the Ohio; see Figure 3-3). In 2001 and 2002 the project focused on the Monongahela and Allegheny Rivers upstream of the Pittsburgh urban area, respectively, and in 2003 it focused on the Ohio River downstream of the City of Pittsburgh. Figure 3-4 shows 3R2N’s water quality testing points from 2000 to 2004 for rivers, streams, and watersheds.
In 2000, the 3R2N study concluded that the main river dry weather fecal coliform data were equal to or lower than the 400 CFU/100 mL (EPA, 1986) standard for incidental contact in recreational waters. The E. coli level in the main rivers was also less than or equal to the standard of 126 CFU/100 mL. For all three rivers in wet weather conditions, data showed that fecal coliform concentrations increase and remain high for days after a rainfall (Knauer and Collins, 2001, 2002, 2003). The maximum observed fecal coliform concentration in the main stem rivers was 103 per 100 mL and in the tributaries was 104-105 per 100 mL. Maximum E. coli levels were 102-103 per 100 mL in the main stem rivers and 2,500 per 100 mL in the tributaries. It was also observed that the edges of the rivers have higher bacterial concentrations and are slower to recover than the middles of the rivers. This finding is relevant in terms of public
|
20 |
For further information on 3RWW, see http://3riverswetweather.org/index.htm; for information on 3R2N, see http://3r2n.cfa.cmu.edu/index.html. |
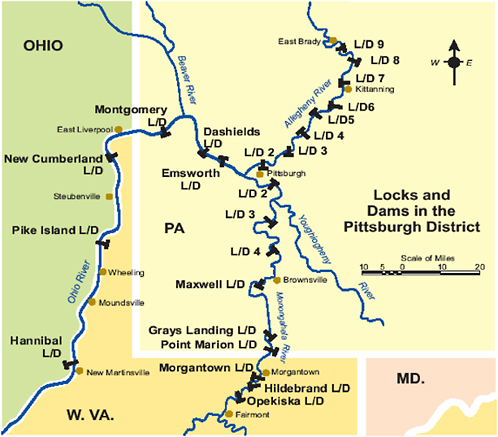
FIGURE 3-3 Lock and dam structure of the Three Rivers.
access, since most people are in contact with river water while fishing at the edge (Knauer and Collins, 2001).
In 2001, the 3R2N study concluded that during dry weather, sites on the Monongahela River are below regulatory levels for fecal coliforms. During dry weather, tributaries to the Monongahela are higher than regulatory limits, with stream values varying from less than 200 CFU/100 mL to greater than 105 CFU/100 mL. Wet weather river water quality generally does not exceed regulatory limits in Pool 3 (the stretch of river between L/D 3, 23.8 miles upstream of the confluence, and L/D 4, 41.5 miles upstream of the confluence [see Figure 3-3]) on the Monongahela; however, Pool 2 (the stretch of the river between L/D 2, 11.2 miles upstream of the confluence, and L/D 3) sites show higher coliform levels in wet weather. The Pittsburgh Pool sites were higher in coliforms than sites in Pools 2 and 3 (Knauer and Collins, 2002).
In 2002, the 3R2N study concluded that during dry weather, sites on the Allegheny River in Pools 2, 3, and 4 are below regulatory levels for fecal coliforms and E. coli. However, during dry weather, some tributaries exceed regulatory limits. In Pool 2, Plum Creek, Indian Creek, and Squaw Run exceed the recreational contact standard of 400 CFU/100 mL for fecal coliforms and of 126 CFU/100 mL for E. coli. In Pool 3, Baileys Run and Clarks/Crawford Run exceed fecal
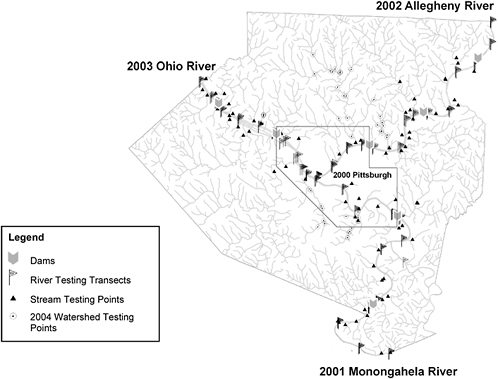
FIGURE 3-4 3 Rivers 2nd Nature integrated water quality testing points, 2000-2004
SOURCE: Adapted and reprinted, with permission, from 3 Rivers 2nd Nature. © 3 Rivers 2nd Nature.
coliform and E. coli standards in dry weather. Although all Pool 3 tributaries exceed the E. coli standard in dry weather, the single tributary monitored in Pool 4 (Buffalo Creek) was below regulatory limits during dry weather. Wet weather event sampling indicated that locations in the Pittsburgh Pool have high concentrations of fecal coliforms after rain events. In the upper pools, locations near CSO structures have higher indicator concentrations following precipitation (Knauer and Collins, 2003).
In 2003, the 3R2N evaluated sites on the Ohio River and its tributaries, but the results have not yet been released.
Allegheny County Sanitary Authority. ALCOSAN has collected data on bacterial indicator organisms in surface water in southwestern Pennsylvania. From 1993 to 1996, the Allegheny River, Monongahela River, Ohio River, Chartiers Creek, Saw Mill Run, Turtle Creek, and Thompson Run were monitored both upstream and downstream of the ALCOSAN service area. These data are not directly available; however, they were reviewed by the Third Party Review Committee (TPRC, 2002; see Chapter 5 for further information). According to the TPRC report
(2002), downstream fecal coliform levels are greater than upstream by a factor of 10 for these rivers. Upstream levels are greater than the maximum standard of 400 CFU/100 mL 30 percent of the time in the Allegheny River and 50 percent of the time in the Monongahela River. Data exceeded the geometric mean of 200 CFU/100 mL at both upstream locations. The creek data are similar in that downstream data are higher than upstream data, but not all values meet standards. Maximum upstream fecal coliform levels are approximately 103-104 CFU/100 mL in the main rivers and 104-105 CFU/100 mL at the downstream stations. In the tributaries, maximum levels were reported to be 104-105CFU/100 mL upstream and 105-106CFU/100 mL at downstream stations. The TPR report concluded that high dry-weather bacteria levels in the tributaries may indicate dry weather overflow, illegal direct connection of sanitary sewers to stormwater systems, or groundwater and/or upstream sources (lying outside of the ALCOSAN service area) (TPRC, 2002). High downstream and wet weather levels indicate SSOs and CSOs related to wet weather collection system overloads. However, in most cases there is insufficient information to determine the sources of the bacterial indicator organisms.
Allegheny County Health Department and U.S. Geological Survey. In 2001, the ACHD in collaboration with the USGS (Water Resources Division, Pittsburgh, Pennsylvania) began collecting data on fecal indicators in the three main stem rivers near the City of Pittsburgh. The goal of this data collection effort is to develop a sampling protocol, to sample indicator bacteria in accordance with 25 PA Code § 93.721 (which requires a specific number of samples within a defined time frame for validity) and to develop a decision tool for issuing and lifting river advisories. Three sets of indicator organisms were evaluated—fecal coliforms, E. coli, and enterococci. The samples were collected weekly and for several successive days after three wet weather events in the summer of 2001 at five sampling locations (two on the Monongahela; two on the Allegheny; one on the Ohio). Raw data for this sampling are available on-line.22 While the ACHD analysis of the data is still ongoing regarding conclusions that can be made about the bacterial quality of the three rivers in Allegheny County, preliminary analysis of the raw data shows that all indicator organism levels exceed water quality standards some of the time in these rivers, with total counts increasing in response to wet weather.
U.S. Army Corps of Engineers. Pittsburgh District Office. The USACE has conducted two studies related to bacterial water quality (Koryak and Reilly, 2000; USACE, 1997). For Montour Run (USACE, 1997), fecal coliform were collected in September 1996 at four locations on Montour Run and at the mouths of 14 of its largest tributaries. The Montour Run watershed is in western Allegheny County, with much of the basin within 10 miles of Pittsburgh. Notably, the basin contains the Pittsburgh International Airport and was under significant development during the USACE study. Conversion of agricultural and woodland uses to suburban housing and retail complexes was significant. Fecal coliform bacterial concentrations were highest in the western portion of the watershed (in the headwaters) and ranged from 650 to 4,600 CFU/100 mL. In the eastern part of the watershed, fecal coliform concentrations were all below 20 CFU/100 mL. The report speculates that high levels in the western portion of the watershed are related to malfunctioning on-site septic systems discharging partially treated effluent.
|
21 |
Section 93.7 is available on-line at http://www.pacode.com/secure/data/025/chapter93/s93.7.html. |
|
22 |
For further information see http://pa.water.usgs.gov/ar/wy02/pdfs/cso-proj.pdf. |
Nine Mile Run is a tributary of the Monongahela River in eastern Allegheny County. It enters the Monongahela at river mile 7.6 and encompasses a 7.5 square mile urban watershed with much of the flow through culverts. Total coliform, fecal coliform, and E. coli bacterial samples were collected from six locations along Nine Mile Run in 1999. Results indicate that Nine Mile Run is unsafe for human contact during dry and wet weather; it is seriously degraded by sewage because it is a corridor for SSOs and CSOs for eastern suburbs as well as the east end of Pittsburgh (Koryak and Reilly, 2000). Total coliform counts ranged from 101,000 to 1,311,000 CFU/100 mL, while fecal coliform counts ranged from 125 to 1,051,200 CFU/100 mL. E. coli ranged from 125 to 1,009,800 CFU/100 mL. Wet weather values increase by orders of magnitude. The authors conclude that dry weather exceedances are related to chronic SSOs, while wet weather exceedances are related to CSO events.
Watershed Associations, Schools, and Other Nongovernmental Agencies. Many other groups collect water quality data in southwestern Pennsylvania for a variety of reasons. For example, many public schools participate in Creek Connections.23 This program involves local schools in hands-on, inquiry-based learning through water quality monitoring in local creeks and streams, and data are available on-line. Monitoring parameters include temperature, pH, total dissolved solids, dissolved oxygen, nitrate, phosphorus, alkalinity, turbidity, and biological index. Some studies also include flow measurements and iron, and one high school (North Hills) has collected a few samples for E. coli. As an example, Figure 3-5 shows sampling locations for the Pittsburgh region. The North Hills E. coli sampling program found levels in Girty’s Run that exceeded acceptable levels for contact recreation in seven samples taken from October 2003 to January 2004. The highest levels were seen during wet weather.
The Pennsylvania Organization for Watersheds and Rivers (POWR) is a statewide nonprofit organization that includes individuals, watershed associations, conservation agencies and organizations, and corporations that support watershed science and education. Its web site24 includes a directory of watershed groups active in each county and links to other programs such as the Keystone Watershed Monitoring Network. The directory does not list recorded data directly, but links to individual organizations may provide lists of projects and data for specific programs. In many cases, local organizations in POWR may be the only groups conducting water quality monitoring in rural headwater streams. The extent of monitoring and the available data for bacteria in headwaters streams are uncertain and difficult to ascertain. In the farthest southwestern counties of the study area (Washington and Greene), technical advisers to local watershed alliances were not aware of any local watershed groups conducting bacterial monitoring (Ben Stout, Wheeling Jesuit University, personal communication, 2003; Mary Joy Haywood, Carlow College [retired], personal communication, 2003). Box 5-3 discusses an example of a headwaters study in a West Virginia watershed that provides important evidence for watershed conditions both locally and on the larger, main stem stream.
Water quality data collected by independent watershed associations and nongovernmental agencies are poorly catalogued within the region. Data exist, but they may not meet the rigid standards of quality assurance and quality control required for utilization by state regulators. For example, in preparing the 2004 Pennsylvania Integrated Water Quality Monitoring and Assessment Report, the PADEP requested information on available water quality data from
|
23 |
See http://merlin.alleg.edu/group/creekconnections/ for data and further information about the program. |
|
24 |
The POWR website can be found on-line at http://www.pawatersheds.org/index.asp/. |
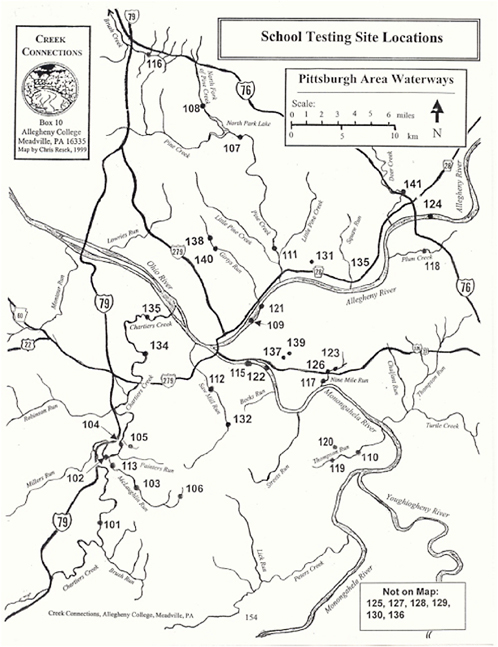
FIGURE 3-5 School testing locations in and around the City of Pittsburgh for the Creek Connections program.
SOURCE: Reprinted, with permission, from http://creekconnections.allegheny.edu/swpamap.html. © 1999 Allegheny College.
hundreds of independent organizations (PADEP, 2004). Ten organizations responded and data from seven of these were used to evaluate the attainment of recreational uses. Specifically, four local community-based water associations provided bacteriological data: Broadhead Creek Watershed Association, Brush Creek Watershed Association, the Schuylkill Chapter of the Pennsylvania Senior Environment Corps, and the Tri-County Conewago Creek Association (PADEP, 2004).
The PADEP encourages citizens’ groups to become trained to conduct water quality monitoring programs. The Citizens’ Volunteer Monitoring Program (CVMP) provides technical support and assistance to organizations that want to collect data for use in the 305(b) listing process. Independent sources of data that do not meet PADEP standards for clear delineation of stream segment and for adequate site location and collection protocols are not used in the 305(b) listing process.
Specific Independent Studies. In addition to large agency-based or sponsored efforts, individual researchers have collected data regarding the water quality in southwestern Pennsylvania. Many of these studies were focused on a specific water quality impairment (e.g., CSO events) and thus are discussed in Chapter 4 with the relevant impairment. The results are summarized here. States et al. (1997) reported on protozoa levels in the Allegheny River, which is the source water for the PWSA treatment plant. In the Allegheny River, they found that 63 percent of the samples were positive for Giardia cysts, with concentrations ranging from 0 to 421 cysts per 100 L of water, and 63 percent of the samples were positive for Cryptosporidium oocysts, with concentrations ranging from 0 to 2,233 oocysts per 100 L of water. In the Youghiogheny River, similar percentages and concentrations were observed (see complete data summarized in Table 4-8). Gibson et al. (1998) found that Giardia and Cryptosporidium were routinely present in Saw Mill Run (an urban stream which is a tributary to the Ohio River) during dry weather, with concentrations of 5-105 oocysts per 100 L and 13-6,579 cysts per 100 L (see complete data summarized in Table 4-9). Both studies found higher levels of protozoa (oo)cysts in CSOs and in surface waters downstream of CSOs during wet weather. Collins et al. (1998) conducted a series of dry weather bacteriological surveys of Nine Mile Run in 1997 using multiple sample locations on a single day. Data were provided at six sampling locations. Fecal coliforms ranged from more than a million per 100 mL to 125/100 mL. Escherichia coli likewise ranged from 125 to more than a million per 100 ml. Total coliforms ranged from 100,000 to 1.3 million per 100 mL.
Groundwater
As part of a joint study by the USGS and PADEP, indicator organisms (total coliforms and E. coli) and specific pathogens (e.g., culturable viruses, the bacterium Helicobacter pylori) were monitored in noncommunity water supply wells in Pennsylvania (Lindsey et al., 2002). Overall, the study found that 62 percent of the wells were positive for total coliforms, while 10 percent were positive for E. coli. Seventeen percent of the samples that were positive for total coliform were also positive for E. coli. Of 60 wells, 4 were positive for H. pylori (although one of these samples had no other indicators or pathogens detected). Culturable viruses were detected in 5 of 60 wells (two of these locations had no other indicators or pathogens detected).
However, these wells were distributed throughout the state (but predominantly in southeastern Pennsylvania) and may not be indicative of well water conditions in southwestern Pennsylvania (see Figure 3-6).
Sharpe et al. (1985) sampled private wells in Pennsylvania and found that 42 percent were positive for coliform bacteria. The USGS (1996) completed a study of 50 wells or springs in the Upper Mahoning Creek basin in Pennsylvania. Mahoning Creek runs through Jefferson, Indiana, and Clearfield Counties in western Pennsylvania and flows into the Allegheny River about 60 miles north of Pittsburgh. Seventy-four percent of the samples were positive for coliform bacteria. The report does not identify specific sources for the contaminated wells; however, it implicates improperly functioning septic systems, improperly sealed wells, and runoff from barnyards as potential sources in general.
Specific Organic Compounds in Water: USGS Studies
Pesticides and Herbicides
Analysis of water samples for pesticides and herbicides is somewhat expensive, so testing for these contaminants is typically conducted less frequently in ambient surface waters than in finished drinking water—especially for the pesticides and herbicides for which enforceable maximum contaminant levels (MCLs) exist in federal drinking water regulations. From 1996 to 1998, the USGS conducted a comprehensive study of water quality in the Allegheny and
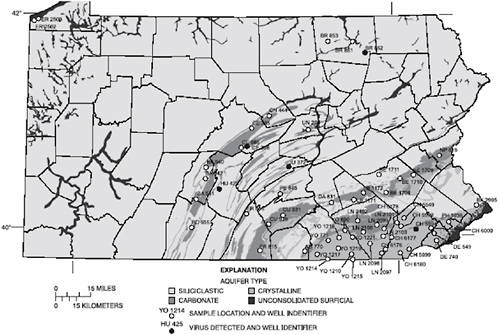
FIGURE 3-6 Sampling locations and detection of viruses in noncommunity supply wells in Pennsylvania.
SOURCE: Lindsey et al., 2002.
Monongahela River basins (called the ALMN Study Unit) as a part of its NAWQA program. A summary of the study unit’s water quality is available in printed form (Anderson et al., 2000; see also Appendix B), and detailed data are available on-line at http://pa.water.usgs.gov/almn/. In this study unit, one surface water site on Deer Creek (see Figure 3-5) near Dorseyville in Allegheny County was selected as an “Intensive Urban/Residential Indicator Fixed-Site.” Samples from this site were collected for comprehensive analysis of water quality, including 83 dissolved pesticides and 87 volatile organic compounds (VOCs), as summarized and discussed below.
South Branch Plum Creek at Five Points, Pennsylvania, an agricultural area about 40 miles northeast of Pittsburgh, was the only other site in addition to Deer Creek that was selected for intensive sampling of pesticides and organic chemicals in the study unit. Although those data are not presented in this discussion, the use of only one other intensive sampling site in the ALMN Study Unit suggests that comprehensive water quality sampling for large numbers of synthetic organic chemicals is not conducted frequently. Anderson et al. (2000) reported that of the 83 pesticides tested for, 25 were detected at least once in Deer Creek, but no pesticide was detected in a concentration greater than its drinking water MCL set by EPA. The authors noted that atrazine, simazine, and metolachlor appeared seasonally, during herbicide applications periods and when increased rainfall occurred in the spring. These chemicals tended to peak in Deer Creek in May and June.
A review of detailed Deer Creek pesticide data from the web site for the Allegheny and Monongahela River basin study was conducted by the committee (see Table 3-7). The herbicide detected in the highest concentrations in water flowing from Deer Creek, a residential-urban watershed, was 2,4-D. Some of the trade names under which this chemical is sold suggest that it finds uses not only in agriculture but also in lawn care, which may explain why it was found at higher concentrations than other herbicides in a watershed where land use was not primarily agricultural (Anderson et al., 2000).
TABLE 3-7 Pesticides Found in Water of Deer Creek During USGS Studya,b
|
Pesticide (Trade Name) |
Concentration Range (µg/L) |
Months Detected/ Months Sampled |
|
Herbicide |
|
|
|
Atrazine (AAtrex, Atrex, Atred, Gesaprim) |
0.004-0.250 |
12/14 |
|
Cyanazine (Bladex, Fortrol) |
0.007-0.14 |
1/14 |
|
2,4-D (Aqua-Kleen, Lawn-Keep, Weed-B-Gone) |
0.17-1.16 |
5/11 |
|
Metolachlor (Dual, Pennant) |
0.005-0.099 |
11/14 |
|
Prometon (Pramitol, Princep) |
0.025-0.355 |
4/14 |
|
Simazine (Princep, Caliber 90) |
0.008-0.092 |
5/14 |
|
Insecticide |
|
|
|
Diazinon (Basudin, Diazotol, Neocidol, Knox Out) |
0.006-0.096 |
6/14 |
|
a Sampling conducted from June 1996 through September 1998. b Table contains only data presented on web site with no qualifiers (i.e., only data method detection limit included, and no data included in which quantitative determination was uncertain). SOURCE: Adapted from data on USGS web site (http://pa.water.usgs.gov/almn/). |
||
Volatile Organic Compounds (VOCs)
Anderson et al. (2000) reported that VOCs related to gasoline and cleaning solvents were found in 24 of 25 samples from Deer Creek. Of the 87 VOCs for which analysis was conducted, 22 were detected at least once, and slightly more than half of those VOCs were compounds related to gasoline. However, no VOC was found at a concentration exceeding its drinking water MCL. Anderson et al. (2000) also noted that VOCs can accumulate on impervious surfaces and be washed off during precipitation events. Analysis of a set of five samples collected from Deer Creek during a storm showed that VOC concentrations peaked as streamflow was increasing, while the lowest VOC concentrations were measured as flow decreased. Anderson and colleagues concluded that the relationship between flow and VOC concentration showed an effect of flushing VOCs from the land surface and into streamflow.
EVIDENCE OF WATERBORNE DISEASE
In addition to analyzing water quality data for chemical and biological parameters and noting water quality impairments, another way to gauge water quality conditions in the southwestern Pennsylvania region is to document cases of waterborne disease. Most states and territories participate in the National Waterborne Disease Outbreak Surveillance System maintained by the Centers for Disease Control and Prevention (CDC), EPA, and the Council of State and Territorial Epidemiologists, by reporting cases of salmonellosis, shigellosis, Escherichia coli O157:H7, hepatitis A, giardiasis, and cryptosporidiosis (NRC, 2004). Some states collect surveillance data on other enteric diseases, such as yersiniosis and campylobacteriosis. Repeated efforts by the committee to procure surveillance data for southwestern Pennsylvania from the state epidemiologist and the Allegheny County Health Department were unsuccessful. In lieu of those data, overall Pennsylvania data on reported drinking water and recreational waterborne diseases were obtained from CDC and are discussed below. It is important to note, however, that these CDC reports do not include all known waterborne disease outbreaks in Pennsylvania (e.g., a drinking water-related outbreak of giardiasis in McKeesport, Pennsylvania, in winter 1983-1984 was not included in these reports; see Box 3-4 for further information).
Between 1971 and 1985, Pennsylvania reported a total of 90 waterborne disease outbreaks resulting in 29,380 cases of illness. This represented 19 percent of reported outbreaks and 26 percent of cases of illness between 1971 and 1985 in the United States, leading the nation in the number of waterborne disease outbreaks and number of cases of illness reported. In a review of waterborne disease surveillance activity between 1946 and 1980 (Lippy and Waltrip, 1984), Pennsylvania reported 0.6 to 1.9 waterborne disease outbreaks per 100 community water systems, with 1 to 20 cases of illness per 10,000 population served by water utilities. The number of illnesses exceeded 10,000 cases during the review period. Only Pennsylvania, New York, Florida, Texas, and California experienced more than 10,000 cases of such illness. Finally, Frost et al. (1995) summarized waterborne disease surveillance practices based on a survey of state and territorial epidemiology programs. Pennsylvania ranked with New York, New Hampshire, Colorado, Missouri, and Minnesota for the highest number of waterborne disease outbreaks reported between 1986 and 1992. Table 3-8 summarizes waterborne illness
TABLE 3-8 Pennsylvania Waterborne Disease Surveillance Data from CDC for Outbreaks Associated with Drinking Water Use: 1983 to 2000
|
Year |
Agent |
Cases |
Deficiency |
Class |
Type of Location |
Source |
|
1983 |
Giardia |
366 |
3 |
C |
16 communities |
Sewage-contaminated watershed |
|
1983 |
Giardia |
135 |
3 |
C |
Community |
Stream |
|
1983 |
AGI |
11 |
2 |
IND |
Camp |
Well |
|
1983 |
AGI |
11,400 |
3 |
NC |
Religious festival |
Well |
|
1983 |
AGI |
25 |
2 |
NC |
Recreation area |
Well |
|
1983 |
AGI |
200 |
2 |
NC |
Resort |
Well |
|
1983 |
AGI |
146 |
2 |
NC |
Recreation area |
Well, spring |
|
1983 |
AGI |
298 |
3 |
C |
Community |
River |
|
1984 |
Giardia |
8 |
2 |
IND |
Picnic |
Well |
|
1984 |
AGI |
34 |
2 |
IND |
Bicycle race |
Private well |
|
1984 |
AGI |
18 |
2 |
IND |
Industry |
Well |
|
1984 |
AGI |
98 |
2 |
NC |
Resort |
Well |
|
1985 |
AGI |
70 |
3 |
NC |
Restaurant |
Well |
|
1985 |
AGI |
275 |
2 |
NC |
School |
Well |
|
1985 |
AGI |
11 |
3 |
NC |
Restaurant |
Well |
|
1985 |
Shigella |
27 |
1 |
NC |
Camp |
Well |
|
1986 |
AGI |
213 |
3 |
NC |
Restaurant |
Well |
|
1987 |
AGI |
53 |
5 |
NC |
Resort |
Well |
|
1987 |
AGI |
22 |
2 |
NC |
Camp |
Well |
|
1987 |
AGI |
? |
2 |
IND |
Home |
Well |
|
1988 |
Giardia |
172 |
3 |
C |
Community |
Lake |
|
1988 |
AGI |
26 |
2 |
NC |
Camp |
Well |
|
1989 |
AGI |
50 |
2 |
NC |
Camp |
Well |
|
1990 |
Hepatitis A |
22 |
2 |
IND |
Homes |
Well |
|
1990 |
Hepatitis A |
3 |
3 |
C |
Community |
Well |
|
1990 |
AGI |
63 |
5 |
C |
Inn |
Lake |
|
1991 |
AGI |
8 |
3 |
NC |
Restaurant |
Well |
|
1991 |
AGI |
170 |
3 |
NC |
Picnic area |
Well |
|
1991 |
Giardia |
13 |
3 |
NC |
Park |
Well |
|
1991 |
Cryptosporidium |
551 |
3 |
NC |
Picnic area |
Well |
|
1991 |
AGI |
300 |
3 |
NC |
Camp |
Well |
|
1992 |
AGI |
5 |
3 |
NC |
Restaurant |
Well |
|
1992 |
AGI |
28 |
5 |
C |
Park |
River |
|
1992 |
AGI |
38 |
2 |
IND |
Home |
Well |
|
1992 |
AGI |
42 |
3 |
NC |
Camp |
Well |
|
1992 |
AGI |
50 |
3 |
NC |
Camp |
Well |
|
1992 |
AGI |
57 |
3 |
NC |
Camp |
Well |
|
1992 |
AGI |
80 |
3 |
NC |
Camp |
Well |
|
1993 |
Giardia |
20 |
3 |
NC |
Trailer park |
Well |
|
1993 |
AGI |
65 |
3 |
NC |
Ski resort |
Well |
|
1994 |
AGI |
200 |
3 |
NC |
Resort |
Well |
|
1995 |
AGI |
19 |
2 |
NC |
Inn |
Well |
|
1996-2000 |
None Reported |
— |
— |
— |
— |
— |
|
NOTE: AGI = acute gastrointestinal illness of unknown etiology; NC = noncommunity, C = community, IND = individual; 1 = untreated surface water, 2 = untreated groundwater, 3 = treatment deficiency, 4 = distribution system deficiency, 5 = unknown or miscellaneous deficiency. SOURCES: Adapted from various CDC reports available on-line at http://www.cdc.gov/ncidod/dpd/healthywater/publications.htm. |
||||||
outbreaks reported to CDC in Pennsylvania due to drinking water sources from 1983 to 2000. Notably, no waterborne disease outbreaks were reported during 1996 to 2000.
The preceding studies and reviews focused on drinking water as the vector of contamination. Identifying and summarizing epidemiological studies of waterborne illness contracted due to recreational exposure is more challenging. Most exposed individuals develop symptoms days after recreational contact, and most infected individuals attribute their illness to food poisoning or flu. Underreporting of gastrointestinal illness associated with recreational water contact (and, indeed, drinking water exposure) is expected to be high (NRC, 2004). Table 3-9 shows waterborne illness outbreaks reported to CDC in Pennsylvania due to recreational water contact during the 1980s and 1990s.
Box 3-4 describes the one well-documented case of waterborne disease (in this case, giardiasis) known to have occurred in southwestern Pennsylvania, an incident related to operational failures at a treatment plant. Because no other specific outbreak data for southwestern Pennsylvania were obtained, it is difficult to extend the preceding findings on waterborne disease to the entire region. For example, no data were produced to suggest that southwestern Pennsylvania experienced more gastrointestinal illness that other parts of the state. Although the fecal indicator and pathogen concentrations released into the environment during wet weather events have exceeded federal guidelines in the past, no related illnesses have been identified. The only documented evidence of a drinking water-related public health problem for the entire state is the number of disease outbreaks in noncommunity drinking water supply wells and through recreational exposure that were caused by acute gastrointestinal illness of unknown etiology (AGI [likely of viral source]) and Shigella. The high viral host specificity indicates that these are likely caused by wells contaminated with human waste.
TABLE 3-9 Pennsylvania Waterborne Disease Surveillance Data from CDC for Outbreaks Associated with Recreational Water Use
|
Year |
Etiologic Agent |
Cases |
Illness |
Source |
Setting |
|
1982 |
Pseudomonas |
127 |
Dermatitis |
Whirlpool |
Motel |
|
1982 |
Pseudomonas |
36 |
Dermatitis |
Whirlpool |
Motel |
|
1982 |
Pseudomonas |
68 |
Dermatitis |
3 pools |
Hotel |
|
1982 |
Pseudomonas |
14 |
Dermatitis |
Pool |
Motel or hotel |
|
1987 |
Pseudomonas |
22 |
Dermatitis |
Hot tub |
Motel |
|
1988 |
Shigella sonnei |
138 |
Gastroenteritis |
Lake |
Recreation area |
|
1990 |
AGI |
60 |
Gastroenteritis |
Lake |
Camp |
|
1991 |
S. sonnei |
203 |
Gastroenteritis |
Lake |
Park |
|
1995 |
AGI |
17 |
Gastroenteritis |
Lake |
Park |
|
1995 |
S. sonnei |
70 |
Gastroenteritis |
Lake |
Beach |
|
1998 |
Cryptosporidium parvum |
8 |
Gastroenteritis |
Lake |
State park |
|
SOURCES: Adapted from various CDC reports available on-line at http://www.cdc.gov/ncidod/dpd/healthywater/publications.htm. |
|||||
|
BOX 3-4 The Outbreak During the winter of 1983-1984, more than 340 cases of waterborne giardiasis occurred in McKeesport, Pennsylvania. In late December 1983, water demand in McKeesport was very high, depleting distribution system water storage and preventing effective backwash of the filters (Logsdon et al., 1985). Demand increased on December 24, and reservoir levels dropped to about half capacity by the 26th. On December 27 and 28, breaks in 3-inch and 6-inch fire lines were discovered at a U.S. steel mill (Stoecker, 1985). An elevated backwash tank at the water treatment plant was out of service at the time, so all backwash water had to come from the distribution system. Filters were run for several days without backwashing until December 31, when backwashing was performed for the first time in a week. (A filter typically is backwashed after operating times of one to three days when filtered water quality goals are met and when head loss through the filter has not reached the maximum allowed). On January 3, the plant had been pumping finished water at the rate of 13 to 13.5 million gallons per day (mgd) since Christmas, whereas normal winter pumping was about 10 mgd (Stoecker, 1985). This high rate of water production and failure to backwash filters for a week led to a large-scale turbidity breakthrough and significant deterioration of the finished water turbidity. Data entered in the plant report from December 25, 1983, through January 14, 1984 (MMWA, 1983-1984), indicate that composite turbidity from the plant rose to 5 nephelometric turbidity units (ntu) on December 29 and was 2.0 ntu or higher for 10 days during this 21-day period. For comparison, the weekly average turbidity of combined filter effluent was 0.24, 0.28, and 0.37 ntu, respectively, during the three weeks before the treatment problems started. After January 11, 1984, filtered water turbidity was generally 1.0 ntu or lower. From December 25 through January 14, free chlorine residual at the plant ranged from 0.7 to1.9 mg/L and was below 1.0 mg/L only twice in 21 days, which is typical of water treatment practices at that time. Total chlorine residual was generally about 0.3 mg/L higher than the free residual at the plant. During the three-week period from November 27 to December 17, 1983, one treatment plant effluent sample had a confirmed total coliform MPN count of 2.2 per 100 mL. From December 27, 1983, through January 30, 1984, five samples had an MPN count of 2.2 per 100 mL, and one sample had an MPN count of 5.1 per 100 mL (Logsdon et al., 1985). Two studies (Jarroll, et al., 1981; Rice et al., 1982) had shown that at 5°C (the approximate temperature of source water at McKeesport at this time) free chlorine is not very effective for inactivating Giardia cysts, but this information had not been publicized widely by the end of 1983 nor did drinking water regulations at that time reflect the findings that chlorination practices that were adequate for inactivation of bacteria were likely to be inadequate for inactivation of Giardia cysts. The high-turbidity episode was followed by an unusually high incidence of giardiasis that became apparent in the second week of February 1984. Microscopic analysis of sediment from large samples of finished drinking water, sampled by cartridge samplers during the week of February 27, 1984, by the EPA’s Health Effects Research Laboratory, later confirmed the presence of Giardia cysts in the raw water, the finished water at the plant, and the water in the distribution system (Logsdon et al., 1985). These results showed that the treatment plant was not performing as expected. Logsdon et al. (1985) reported that a “boil water” notice was issued on February 22, 1984, by the Allegheny County Health Department to all consumers in the affected communities, based on evaluations of 15 cases of giardiasis. The conclusion that the drinking water was the source of the giardiasis in McKeesport was strengthened because the time between the turbidity problem in late December and early January and the subsequent disease outbreak was similar to the incubation period for giardiasis. |
|
Water Quality After the McKeesport giardiasis outbreak, a monitoring program for Giardia cysts in surface water was undertaken (Sykora et al., 1986). From November 1984 through September 1986, 37 samples were collected from the Youghiogheny River at the McKeesport treatment plant. All samples were positive for Giardia cysts. Seventeen of the samples contained between 11 and 100 cysts per 100 gallons (378 L). Ten samples had 101 to 438 cysts per 100 gallons. Ten samples had cysts in the range of 1 to 10 per 100 gallons. At wastewater treatment plants in the Youghiogheny River watershed, samples of raw wastewater and secondary effluent were obtained and analyzed. Raw sewage samples were reported to have Giardia cysts in the range of about 104 to 105 per 100 gallons at five plants, and in activated sludge effluent cysts were in the range of 102 to103 per 100 gallons. The data of Sykora et al. demonstrate that discharge of treated wastewater to surface waters is very likely to contribute Giardia cysts to those waters. Engineering Aspects The McKeesport Municipal Water Authority operated a 9 mgd conventional treatment plant that was constructed in 1907-1908 (Trax, 1916) and served about 51,000 residents in the communities of McKeesport, Versailles, Port Vue, and White Oak. Raw water was obtained from the Youghiogheny River about 0.5 mile (0.8 km) upstream from its confluence with the Monongahela River. Raw water typically had a turbidity of 2.5 to 200 ntu. Clarification processes included hydraulic mixing, baffled flocculation with no direct power input, sedimentation, and filtration. The sand filters at the plant were converted to monomedia anthracite filters in 1960. In the spring of 1984, when filters contained about 30 inches (0.75 m) of media, a core sample was obtained. The EPA’s Drinking Water Research Division performed three separate sieve analyses on the media that showed a mean effective size of 0.92 mm (range 0.89 to 0.93 mm) (Logsdon et al., 1985). This effective size was considerably larger than the size generally used for sand filters (0.5 mm) and was also larger than the fine media used in dual-media or mixed-media filters. Thus, although the bed depth was typical, the grain size was not. |
In response to the potential risk to recreational users of direct body contact with contaminated surface water, the ACHD initiated in 2003 a cross-sectional survey of recreational and competitive rowing organizations in the Three Rivers region. The total affected population is estimated at 10,000 rowers. The goal of the project is to assess whether there is any increased health risk associated with direct contact with river water during periods of wet weather when the microbiological water quality standards in the rivers are not being met. Results of the study are expected in early 2005.
The committee concludes that a thoughtful analysis of the relationship between environmental conditions and disease incidence and morbidity in southwestern Pennsylvania is hampered by the unavailability of both public health and environmental data. Existing public health surveillance systems and environmental water quality monitoring programs lack the sophistication to adequately characterize surface water and groundwater microbial quality in the region.
|
Engineering investigations after the outbreak revealed a number of problems with the treatment plant (ACHD, 1984). Some were related to operation and maintenance, whereas others were related to facilities. Problems included the following:
Summary A combination of factors resulted in the outbreak at McKeesport. Treatment process equipment, including mixing, flocculation, sedimentation, and filtration process facilities had not been maintained adequately. The filter media being used was not as effective as the more commonly used media designs. Certain very important filter control and filter performance monitoring equipment had not been installed or was not working. The plant was unable to produce safe water at the excessive production rates needed to prevent depressurization of the distribution system after the water line breaks had occurred in late December. The chlorination practice was not sufficient for thorough inactivation of Giardia cysts, although this was not known at the time because only limited research data on chlorination of Giardia cysts had become available by the end of 1983. The confluence of numerous adverse factors led to the serious outbreak at McKeesport early in 1984. SOURCES: Based on Stoecker (1985) and Logsdon et al. (1985). |
SUMMARY
Surface waters in southwestern Pennsylvania are impaired for a variety of uses including recreational use due to microbiological indicators and pathogens in surface water, fish consumption due to organic (PCBs) and inorganic (Hg) contamination, and aquatic life use due to metal concentrations and low pH. Inadequacies in the type and extent of water quality dataavailable in the region prevented the committee from assessing the full extent of adverse effects due to pollution. Almost all of the water quality data available to the committee were derived from single studies in specific areas for limited durations. Recently, a variety of agencies have expanded water quality data collection in the region; however, these activities do not appear to be coordinated. As a result, it is difficult to say how extensive and significant the water quality contamination is.
Groundwaters in southwestern Pennsylvania, especially those used directly for drinking through private wells, have not been completely assessed. Limited data suggest that pathogen contamination is not unusual in groundwater. Whereas groundwater used for public drinking supplies generally meets water quality guidelines, private wells show significant variability, and the effects of mining are apparent.
Geochemical parameters in waters in southwestern Pennsylvania do not identify significant problems in the rivers. Water in the three main rivers in southwestern Pennsylvania generally shows adequate dissolved oxygen, is at near-neutral pH, and does not exceed water quality standards for inorganic constituents. Pesticides and volatile organic compounds were detected at levels below maximum contaminant levels in waters in southwestern Pennsylvania.
Microbiological parameters indicate a wet weather contamination problem for the main rivers and a continual microbial problem in tributaries. Wet-weather microbiological water quality in the main stem rivers is demonstrably worse than dry weather microbiological water quality. Microbiological water quality in many tributaries does not meet standards in either wet or dry weather, suggesting the potential for multiple sources of pollution. Pathogenic protozoa and indicator organisms are routinely detected in surface waters used as drinking water sources in the region.
Despite high levels of pathogens and indicators in regional waters, there is no evidence that southwestern Pennsylvania has recently experienced any waterborne disease that would link impaired source water quality with human health effects. However, as with water quality data, significant gaps exist in public health monitoring, thus preventing an adequate assessment of possible endemic waterborne disease occurrences.
REFERENCES
ACHD (Allegheny County Health Department). 1984. Engineering Evaluation of the McKeesport Water Treatment Plant. Draft. Pittsburgh, PA: ACHD.
Ali, S., and D. Hill. 2003. Giardia intestinalis. Current Opinion in Infectious Diseases 16(5):453-460.
Anderson, R., K. Beer, T. Buckwalter, M. Clark, S. McAuley, J. Sams, and D. Williams. 2000. Water Quality in the Allegheny and Monongahela River Basins: Pennsylvania, West Virginia, New York, and Maryland (1996-98). Denver, CO: United States Geologic Survey.
ASM (American Society of Microbiology). 2004. Comments on EPA's Proposed Policy for National Pollutant Discharge Elimination Systems Permit Requirements for Wastewater Treatment Discharges During Wet Weather. Available on-line at http://www.asm.org/Policy/index.asp?bid=24834. Accessed June 15, 2004.
ATSDR (Agency for Toxic Substances and Disease Registry). 1995. ToxFAQs™ for Chlordane. Available on-line at http://www.atsdr.cdc.gov/tfacts31.html. Accessed March 23, 2004.
ATSDR. 1999a. ToxFAQs™ for Chlorinated Dibenzo-p-dioxins (CDDs). Available on-line at http://www.atsdr.cdc.gov/tfacts104.html. Accessed March 23, 2004.
ATSDR. 1999b. ToxFAQs™ for Mercury. Available on-line at http://www.atsdr.cdc.gov/tfacts46.html. Accessed March 23, 2004.
ATSDR. 2001. ToxFAQs™ for PCBs. Available on-line at http://www.atsdr.cdc.gov/tfacts17.html. Accessed March 23, 2004.
ATSDR. 2002a. ToxFAQs™ for Aldrin/Dieldrin. Available on-line at http://www.atsdr.cdc.gov/tfacts1.html. Accessed March 23, 2004.
ATSDR. 2002b. ToxFAQs™ for DDT, DDE, and DDD. Available on-line at http://www.atsdr.cdc.gov/tfacts35.html. Accessed March 23, 2004.
Azadpour-Keeley, A., B. Faulkner, and J. Chen. 2003. Movement and longevity of viruses in the subsurface. EPA 540/S-03/500. Cincinnati, OH: EPA, National Risk Management Research Laboratory.
Canadian Council of Ministers of the Environment. 1995. Protocol for the Derivation of Canadian Sediment Quality Guidelines for the Protection of Aquatic Life. CCME EPC-98E. Winnipeg, Manitoba: Task Group on Water Quality Guidelines.
Chester Engineering. 1996. Comprehensive Water Supply Plan: Allegheny County Pennsylvania. Pittsburgh, PA: Chester Engineering.
Collins, T., D. Dzombak, J. Rawlins, K. Tamminga, and S. Thompson. 1998. Nine Mile Run Watershed Rivers Conservation Plan: Appendix IV: Water Quality Issues in the Nine Mile Run Watershed. Pittsburgh, PA: Studio for Creative Inquiry, Carnegie Mellon University.
Desmarais, T., H. Solo-Gabriele, and C. Palmer. 2002. Influence of soil on fecal indicator organisms in a tidally influenced subtropical environment. Applied Environmental Microbiology 68(3):1165-1172.
DOI (U.S. Deaprtment of the Interior) and DOC (U.S. Department of Commerce). 2002. 2001 National Survey of Fishing, Hunting, and Wildlife-Associated Recreation. FHW/01-NAT. Washington, DC: DOI, U.S. Fish and Wildlife Service, and DOC U.S. Census Bureau.
Engler, R. 1993. Memorandum: Lists of Chemicals Evaluated for Carcinogenic Potential. Washington, DC: EPA Office of Prevention, Pesticides, and Toxic Substances.
EPA (Environmental Protection Agency). 1986. Ambient Water Quality Criteria for Bacteria—1986. EPA 440/5-84-002. Washington, DC: Office of Water.
EPA. 2000a. National Primary Drinking Water Regulations: Ground Water Rule; Proposed Rules. Federal Register 65(91). Available on-line at http://www.epa.gov/safewater/gwr/gwrprop.pdf. Accessed June 16, 2004.
EPA. 2000b. Atlas of America’s Polluted Waters. EPA 840-B-00-002. Washington, DC: Office of Water.
EPA. 2001a. Infrastructure Needs Survey: Second Report to Congress. Washington, DC: Office of Water.
EPA. 2001b. Protocol for Developing Pathogen TMDLs. EPA 841-R-00-002. Washington, DC: Office of Water.
EPA. 2002a. Consider the Source: A Pocket Guide to Protecting Your Drinking Water. EPA 816-K-02-002. Washington, DC: Office of Ground Water and Drinking Water.
EPA. 2002b. National Recommended Water Quality Criteria: 2002. EPA 822-R-02-047. Washington, DC: Office of Water, Office of Science and Technology.
EPA. 2002c. Public Review Draft: Implementation Guidance for Ambient Water Quality Criteria for Bacteria. EPA 823B-02-003. Washington, DC: Office of Water.
EPA. 2002d. National Water Quality Inventory: 2000 Report. EPA 841-R-02-001. Washington, DC: Office of Water.
EPA. 2003. Proposed Stage 2 Disinfectant and Disinfection Byproducts Rule. EPA-815-F-03-006. Washington, DC: Office of Ground Water and Drinking Water.
Feder, I., F. Wallace, J. Gray, P. Fratamico, P. Fedorka-Cray, R. Pearce, J. Call, R. Perrine, and J. Luchansky. 2003. Isolation of Escherichia coli O157:H7 from intact colon fecal samples of swine. Emerging Infectious Diseases 9:380-383.
Frost, F., R. Calderon, and G. Craun. 1995. Waterborne disease surveillance: Findings of a survey of state and territorial epidemiology programs. Journal of Environmental Health 58:6-11.
Geldreich, E, K. Fox, J. Goodrich, E. Rice, R. Clark, and D. Swerdlow. 1992. Searching for a water supply connection in the Cabool, Missouri disease outbreak of Escherichia coli O157:H7. Water Research 26:1127-1137.
Gibson, C., K. Stadterman, S. States, and J. Sykora. 1998. Combined sewer overflows: A source of Cryptosporidium and Giardia. Water Science and Technology 38(12):67-72.
Guerrant, R. 1997. Cryptosporidiosis: An emerging, highly infectious threat. Emerging Infectious Diseases 3(1):51-57.
Hammermueller, J., S. Kruth, J. Prescott, and C. Gyles. 1995. Detection of toxin genes in Escherichia coli isolated from normal dogs and dogs with diarrhea. Canadian Journal of Veterinary Research 59:265-270.
Higgins, J., G. Heufelder, and S. Foss. 2000. Removal efficiency of standard septic tank and leach trench septic systems for MS2 coliphage. Small Flows Quarterly 1(2):26-27, 57.
Jarroll, E., A. Bingham, and E. Meyer. 1981. Effect of chlorine on Giardia lamblia cyst viability. Applied and Environmental Microbiology 41:483-487.
Jensen, P., Y. Su, K. Lee, A. Boer, H. Rifai, S. Payne, R. Stein, and T. Running. 2002. The 2002 Texas Water Monitoring Congress Proceedings: Indicator bacteria monitoring on Houston Bayous. Available on-line at http://www.txwmc.org/2002_TWMC_Proceedings.pdf. Accessed June 16, 2004.
Knauer, K., and T. Collins. 2001. 3 Rivers 2nd Nature Aquatic Report: Pittsburgh Pool, Phase 1—2000, Water Quality. Pittsburgh, PA: STUDIO for Creative Inquiry, Carnegie Mellon University.
Knauer, K., and T. Collins. 2002. 3 Rivers 2nd Nature Aquatic Report: Monongahela River Valley, Phase 2—2001, Water Quality. Pittsburgh, PA: STUDIO for Creative Inquiry, Carnegie Mellon University.
Knauer, K., and T. Collins. 2003. 3 Rivers 2nd Nature Aquatic Report: Allegheny River Valley, Phase 3—2002, Water Quality. Pittsburgh, PA: STUDIO for Creative Inquiry, Carnegie Mellon University.
Kolpin, D., E. Furlong, M. Meyer, E. Thurman, S. Zaugg, L. Barber, and T. Buxton. 2002. Pharmaceuticals, hormones, and other organic wastewater contaminants in U.S. streams, 1999-2000: A national reconnaissance. Environmental Science and Technology 36:1202-1211.
Koryak, M., and J. Reilly. 2000. Nine Mile Run, Allegheny County, Pennsylvania: Aquatic Ecosystem Restoration Water Quality and Aquatic Life Report. Pittsburgh, PA: U.S. Army Corps of Engineers.
Lee, S., D. Levy, G. Craun, M. Beach, and R. Calderon. 2002. Surveillance for waterborne-disease outbreaks—United States, 1999-2000. Morbidity and Mortality Weekly Report 51(SS-8):1-47.
Levy, D., M. Bens, G. Craun, R. Calderon, and B. Herwaldt. 1998. Surveillance for waterborne-disease outbreaks—United States, 1995-1996. Morbidity and Mortality Weekly Report 47(5):1-34.
Lindsey, B., J. Rasberry, T. Zimmerman. 2002. Microbiological Quality of Water from Noncommunity Supply Wells in Carbonate and Crystalline Aquifers of Pennsylvania. Water Resources Investigations Report 01-4268. Washington, DC: DOI, USGS.
Lippy, E., and S. Waltrip. 1984. Waterborne disease outbreaks—1946-1980: A thirty-five year perspective. Journal of the American Water Works Association 6(2):60-67.
Livingston, R., S. McGlynn, and X. Niu. 1998. Factors controlling seagrass growth in a gulf coastal system: Water and sediment quality and light. Aquatic Botany 60(2):135-159.
Logsdon, G., V. Thurman, E. Frindt, and J. Stoecker. 1985. Evaluating sedimentation and various filter media for removal of Giardia cysts. Journal of the American Water Works Association 77(2):61-66.
Luneburg, W. 2004. Where the Three Rivers Converge: Unassessed Waters and the Future of EPA’s TMDL Program: A Case Study (Water Quality Policy and Regulation in Allegheny County, PA). A report for 3 Rivers 2nd Nature, STUDIO for Creative Inquiry, College of Fine Arts, Carnegie Mellon University, Pittsburgh, PA.
Marshall, M., D. Naumovitz, Y. Ortega, and C. Sterling. 1997. Waterborne protozoan pathogens. Clinical Microbiology Reviews 10:67-85.
Medema, G., F. Schets, P. Teunis, and A. Havelaar. 1998. Sedimentation of free and attached Cryptosporidium oocysts and Giardia cysts in water. Applied and Environmental Microbiology 64:4460-4466.
MMWA (McKeesport Municipal Water Authority). 1983-1984. Unpublished Purification Plant Report Data Sheets from McKeesport for Weeks Ending December 31, 1983; January 7, January 14, January 21, and January 28, 1984. McKeesport, PA: MMWA.
Mulroy, A. 2000. Correlating residual antibiotic contamination in public water to drug-resistant Escherichia coli: Is remediation an option? Alexandria, VA: Water Environment Federation 2000 U.S. Stockholm Junior Water Prize.
NRC (National Research Council). 1987. Drinking Water and Health, Volume 7 Disinfectants and Disinfectant By-Products. Washington, DC: National Academy Press.
NRC. 1992. Restoring Aquatic Ecosystems. Washington, DC: National Academy Press.
NRC. 1993. Managing Wastewater. Washington, DC: National Academy Press.
NRC. 1997. Safe Water from Every Tap. Washington, DC: National Academy Press.
NRC. 1999a. Setting Priorities for Drinking Water Contaminants. Washington, DC: National Academy Press.
NRC. 1999b. Hormonally Active Agents in the Environment. Washington, DC: National Academy Press.
NRC. 2001. Assessing the TMDL Approach to Water Quality Management. Washington, DC: National Academy Press.
NRC. 2002. Opportunities to Improve the U.S. Geological Survey National Water Quality Assessment Program. Washington, DC: National Academy Press.
NRC. 2004. Indicators for Waterborne Pathogens. Washington, DC: National Academies Press.
O’Connor, D. 2002. Report of the Walkerton Inquiry: The Events of May 2000 and Related Issues. Part One: A Summary. Toronto: Ontario Ministry of the Attorney General, Queen’s Printer for Ontario.
O’Donoghue, P. 1995. Cryptosporidium and cryptosporidiosis in man and animals. International Journal for Parasitology 25:139-195.
ORSANCO (Ohio River Valley Water Sanitation Commission). 2002. Biennial Assessment of Ohio River Water Quality Conditions for Water Years 2000 and 2001. Cincinnati, OH: ORSANCO.
Osterkamp, W., P. Heilman, and L. Lane 1998. Economic considerations of a continental sediment-monitoring program. International Journal of Sediment Research 13 (4):12-24.
PADEP. 2003. Frequently Asked Questions About Private Water Wells in Pennsylvania. Fact Sheet 3800-FS-DEP2657. Available on-line at http://www.dep.state.pa.us/dep/deputate/watermgt/wc/Subjects/SrceProt/well/questions/default.htm. Accessed March 18, 2004.
PADEP. 2004. 2004 Pennsylvania Integrated Water Quality Monitoring and Assessment Report. Available on-line at http://www.dep.state.pa.us/dep/deputate/watermgt/wqp/wqstandards/303d-report.htm. Accessed June 16, 2004.
Pait, A., A. DeSouza, and D. Farrow. 1992. Agricultural Pesticide Use in Coastal Areas: A National Summary. Washington, DC: U.S. Department of Commerce, National Oceanic and Atmospheric Administration.
Pesaro, F., I. Sorg, and A. Metzler. 1995. In situ inactivation of animal viruses and a coliphage in nonaerated liquid and semiliquid animal wastes. Applied and Environmental Microbiology 61(1):92-97.
Pontius, F.W. (ed.) 2003. Drinking Water Regulation and Health. New York: John Wiley & Sons.
Rice, E., J. Hoff, and F. Schaefer, III. 1982. Inactivation of Giardia cysts by chlorine. Applied and Environmental Microbiology 43(1):250-251.
Robertson, L., A. Campbell, and H. Smith. 1992. Survival of Cryptosporidium parvum oocysts under various environmental pressures. Applied and Environmental Microbiology 58(11):3494-3500.
Rose, J., and T. Shifko. 1999. Giardia, Cryptosporidium, and Cyclospora and their impact on foods: A review. Journal of Food Protection 62(9):1059-1070.
Rose, J., D. Huffman, and A. Gennaccaro. 2002. Risk and control of waterborne cryptosporidiosis. Federation of European Microbiological Societies Microbiology Reviews 26:113-123.
Schallenberg, M. and C. Burns. 2004. Effect of sediment resuspension on phytoplankton production: Teasing apart the influences of light, nutrients, and algal entrainment. Freshwater Biology 49(2):143-159.
Schaub, S., and R. Oshiro. 2000. Pubic health concerns about caliciviruses as waterborne contaminants. Journal of Infectious Diseases 181:S374-S380.
Sharpe, W., D. Mooney, and R. Adamis. 1985. An analysis of ground water quality data obtained from private individual water systems in Pennsylvania. North Eastern Journal of Environmental Science 4:155-159.
Snyder, S., P. Westerhoff, Y. Yoon, and D. Sedlak. 2003. Pharmaceuticals, personal care products, and endocrine disruptors in water: Implications for the water industry. Environmental Engineering Science 20(5):449-469.
States, S., K. Stadterman, L. Ammon, P. Vogel, J. Baldizar, D. Wright, L. Conley, and J. Sykora. 1997. Protozoa in river water: Sources, occurrence, and treatment. Journal of the American Water Works Association 89(9):74-83.
Stoecker, J. 1985. Memorandum: McKeesport Water Quality. Philadelphia, PA: EPA.
Stumm-Zollinger, E., and G. Fair. 1965. Biodegradation of steroid hormones. Journal of Water Pollution Control Federation 37(11):1506-1510.
Sykora, J., S. States, W. Bancroft, S. Boutros, M. Shapiro, and L. Conley. 1986. Monitoring of water and wastewater for Giardia. In Proceedings of the American Water Works
Association Water Quality Technology Conference, Portland, Oregon. Denver, CO: AWWA.
Tabak, H., and H. Bunch. 1970. Steroid hormones as water pollutants. Developments in Industrial Microbiology 11:367-376.
TPRC (Third Party Review Committee). 2002. Third Party Review of the ALCOSAN Regional Long Term Wet Weather Control Concept Plan. Pittsburgh, PA: ALCOSAN.
Trax, E. 1916. A new raw water supply for the City of McKeesport, Pennsylvania. Journal of the American Water Works Association 3:947-958.
Trussell, R. 2001. Endocrine disruptors and the water industry. Journal of the American Water Works Association 93(2):58-65.
USACE (U.S. Army Corps of Engineers). 1997. Montour Run Watershed, Allegheny County, Pennsylvania: Water Quality and Aquatic Life Resources. Pittsburgh, PA: U.S. Army Corps of Engineers.
USDA (U.S. Department of Agriculture). 1997. 1997 Census of Agriculture: Pennsylvania State and County Data. Available on-line at http://www.census.gov/prod/ac97/ac97a-38.pdf. Accessed June 16, 2004.
USGS (U.S. Geological Survey). 1995. The Allegheny-Monongahela River Basin NAWQA Project. Available on-line at http://pa.water.usgs.gov/almn/. Accessed June 16, 2004.
USGS. 1996. Quality of ground water at selected sites in the upper Mahoning Creek basin, Pennsylvania. Fact Sheet 176-96. Available on-line at http://pa.water.usgs.gov/reports/fs_176-96/report.html. Accessed June 16, 2004.
VADEQ (Virginia Department of Environmental Quality). 2000. Fecal Coliform TMDL for Muddy Creek, Virginia: Revised Final Report. Available on-line at http://www.deq.virginia.gov/tmdl/apptmdls/shenrvr/muddyfe.pdf. Accessed November 30, 2004.
WHO (World Health Organization). 1990. The WHO Recommended Classification of Pesticides by Hazard and Guidelines to Classification. Geneva, Switzerland: WHO.
WHO. 2000. Monitoring Bathing Waters: A Practical Guide to the Design and Implementation of Assessments and Monitoring Programmes, J. Bartram and G. Rees (eds.). London: E. and F.N. Spon.


