
9
Health Considerations in the Cape Cod Population
INTRODUCTION
This chapter begins with a discussion of issues in epidemiologic research and then describes the status of disease on Cape Cod. This discussion is followed by an assessment of the sample size and statistical power needed to evaluate health risks of the PAVE PAWS radar. Finally the committee presents a geographical correlation study of health effects associated with exposure to the PAVE PAWS radar in the upper Cape Cod region surrounding the Massachusetts military reserve where PAVE PAWS is located.
The population characteristics of Cape Cod are important in interpretation of observed health effects and evaluation of epidemiological studies and are described briefly here.
Trend in Commuting
The trend in commuting to Boston has risen dramatically over the past 40 years (CCCR 2003). While the population of Barnstable county has tripled, off-Cape commuting has increased 1440 percent. In 2000, approximately 15% of Barnstable County’s working residents commuted off-Cape to work, almost a 50% increase over the number commuting off-Cape in 1990. Nearly half the commuters went to the greater Boston Area.
Age Structure of the Population
The percent of the population on Cape Cod aged 65-plus rose from 22.8% in 1996 to 23.1% in 2000. This represents 36.7% of all households on Cape Cod.
Overall, 26% of Cape households have retirement income (US Census Bureau, Census 2000). Based on analysis of the 2000 Census, all 15 Cape towns saw growth in the 85-plus age group. Barnstable County led the 14 Massachusetts counties with the highest median age of 44.6. Furthermore, 11 Cape towns ranked in the top 20 oldest communities in Massachusetts.
The poverty level of Cape Cod is comparable to the state of Massachusetts as a whole. Overall, for families with children, the demographic poverty level is 3.4% for the state and 3.5% for Cape Cod. For those without children, the corresponding numbers are 2.2% and 2.1%.
Population Growth
Census data from 1980 and 1990 indicate that the growth of the state overall was 1.049% during this decade and for Barnstable County (Cape Cod) it was 1.26%. This reflects the trend of more retired elders moving to the Cape and a growing population commuting to jobs in the greater Boston area, in part with better intrastate road access.
The MISER data resource1 used to project the annual and decade-level growth in future Massachusetts populations indicates that the actual recorded growth from 1990 to 1995 was 1.026% for the state of Massachusetts as a whole and 1.068% for Cape Cod. Furthermore, the projected growth from 1990 to 2000 was 1.053% for the decade for the state as a whole and 1.180% for Barnstable County.
Prevalence of Risk Factors on the Cape
The committee’s access to historic data on risk factors was limited by their availability on BRFSS and insufficient numbers of responders to provide accurate estimates for counties. The Cape does have a lower prevalence of obesity than the state of Massachusetts as a whole through the 1990s (BRFSS data).
ISSUES IN EPIDEMIOLOGIC RESEARCH
Epidemiologic research can encompass a spectrum of strategies and methodological approaches to describe the occurrence of and risk factors for disease. Research designs can include descriptive, ecologic, case series, cross-sectional, case-control, cohort, and clinical trials. The type of information derived from these different strategies typically differs substantially with regard to the metrics obtained and the level of causal inference. Within the context of considering po-
tential health effects from the PAVE PAWS facility, a combination of epidemiologic approaches can be recommended, which will provide information relevant to this issue.
As a general rule, most epidemiologic investigations are hypothesis-related. While the hypothesis focus can be hypothesis generating, the nature of epidemiologic research is typically hypothesis testing. Hypothesis generation is restricted to situations where there exists a lack of substantive data on an underlying mechanism of disease causation. Any observed associations are then evaluated for any existing or speculative mechanisms that may support the observation. One common outcome is the proposal of laboratory- or animal-based experiments that might provide confirmatory data relating to the observed association. Within a hypothesis-generation study, it is possible to define either the exposure(s) or the effect(s) of interest. For example, within a cohort-study design, multiple effects and/or exposure can often be addressed, depending on the cohort characterization and follow-up. In the situation of a case-control study, the hypothesis-generation component would be focused on exposure-specific factors. A subject of importance in research designated as hypothesis generating is the issue of multiple comparisons. That is, when researchers investigate many different factors and/or effects the probability of observing some significant associations increases due to random chance.
Hypothesis testing is within the context of available data to support a tenable biologic mechanism between a given exposure (e.g., PAVE PAWS-related) and a specific health effect. By definition, hypothesis-testing epidemiologic research specifies the exposure and outcome of interest as well as the direction of effect (i.e., increase of risk or protective effect).
Given the lack of sufficient supportive data to propose specific hypotheses to be tested (that is, supported by a reasonable and justified underlying biological rationale) the spectrum of health-related effects that could be considered within the context of the PAVE PAWS is almost unlimited. Thus, associations observed as the result of multiple comparisons must be viewed with extreme caution and considered tentative until reproduced in another population or supported by biologically based evidence. Some examples of possible health effects that might be considered within a hypothesis-generating exercise include cancer, cardiovascular disease, immunodeficiency, autoimmune disease, infertility, pregnancy outcomes, birth defects, attention deficit hyperactivity disorder, autism, depression, dementia, asthma, or endocrinopathies. The ability to conduct scientifically valid research is dependent on (1) the feasibility of complete ascertainment and characterization of disease state(s) of interest, many of which include a heterogeneous group of diseases, (2) a sufficient level of statistical power to detect levels of risk considered to be of importance, and (3) the ability to accurately characterize, in detail, the exposure of interest among the relevant population. Deficiencies in one or more of these attributes can invalidate the results and corresponding conclusions of epidemiologic research.
HEALTH ON CAPE COD
The health of the population can be monitored using a range of measures including the incidence or onset of new cases of disease, the prevalence or frequency of the condition in the population, and mortality, usually reported as the rate of death in the population. Other measures such as a person-years of life lost may be used to rank the impact of conditions on the population. The Massachusetts Department of Public Health produces reports that summarize both the burden of disease and the prevalence of risk factors for chronic conditions for the state as a whole. Data on cancer are reported using the resources of the state tumor registry and birth defects are reported using specialized data collection procedures. Many other conditions, however, are not routinely summarized either for the state as a whole or for smaller subdivisions such as counties or towns. Therefore we have available extensive data on cancer, more recent data on birth defects, and no comparable data on heart disease, stroke, or other major leading causes of disability and death.
Premature Mortality
The overall burden of illness for the state has been summarized in the measure of premature mortality (Eyles and Birch 1993). This is defined as the deaths occurring before age 75, and may be considered to reflect a general measure of the overall health of the population. While premature mortality reflects both the community-level health status and other correlates, such as access to care, it is important to note that the figures also include deaths from external causes (e.g., accidents, suicides, homicides, etc.). Moreover, premature mortality does not give us a source to identify why an area may be high or low, and because it is a general measure of early death, it may not precisely measure overall health. In fact, from time to time, it may obscure important disease burdens in subgroups of the population. The most recently reported data from Massachusetts draw on the reported deaths in 2001.2 The state average premature mortality rate was 347 (95% confidence interval 342 to 352) deaths per 100,000 persons ages 0-74, after adjustment to the age distribution of the 2000 census. The premature-mortality rates for towns on upper Cape Cod are summarized in Table 9-1.
Of note, only one of the towns, Bourne, has a premature mortality rate in 2001 that is higher than the state average of 347 (342-352), though this difference is not statistically significant. Importantly, many factors can contribute to this measure. The reports summarized below focus on the incidence of cancer and birth defects, which are more proximate in time to any environmental exposure than is mortality, except in the situation of natural disasters associated with trauma and death.
|
2 |
Premature Mortality 2001: http://www.state.ma.us/dph/bhsre/death/2001/premtrmortal2001.pdf. |
TABLE 9-1 Age-Adjusted Premature Mortality Rates (deaths per 100,000) for Upper Cape Cod Towns
|
Town |
Premature Mortality Rate (95% Confidence Interval) |
|
Barnstable |
275 (233-324) |
|
Bourne |
388 (307-489) |
|
Falmouth |
333 (276-400) |
|
Mashpee |
332 (241-454) |
|
Sandwich |
288 (218-379) |
|
SOURCE: Premature mortality rates, Massachusetts Department of Public Health. (Premature Mortality 2001, www.state.ma.us/dph/bhsre/death/2001/pretrmortal2001.pdf). |
|
Cancer
From the inception of the Massachusetts Cancer Registry and the initial analysis of cancer incidence by towns, there has been concern that the rates of cancer are elevated in the Cape Cod population. This has led to a range of analyses that the committee has summarized in this section. In December 1987, the Massachusetts Department of Public Health issued a request for proposals to respond to three important public health issues affecting the upper Cape Cod (Barnstable, Bourne, Falmouth, Mashpee, and Sandwich).
Apparent elevations in cancer incidence and mortality were observed for certain kinds of cancer as compared to the statewide averages and the lower Cape Cod region. Consistently elevated mortality rates for lung cancer and leukemia were seen for the towns of Falmouth and Bourne. In addition, since the inception of the Massachusetts Cancer Registry in 1982, statistically significant excesses were seen in the incidence of cancers of the breast, colon and rectum, lung, and blood forming organs, and statistically variable increases were seen for cancers of the pancreas, kidney, and bladder in at least one of the upper Cape towns.
Secondly, there were many known or suspected environmental hazards affecting the upper Cape. These included both groundwater and air contaminants from a variety of sources including the Massachusetts Military Reservation.
Third, there was substantial concern among citizen advocates who pressed forcefully and consistently for an in-depth evaluation of the relationship between the environmental hazards and cancer rates. The upper Cape Cod cancer-incidence study was conducted by Drs. Aschengrau and Ozonoff of Boston University School of Public Health and submitted to the department of public health in September 1991. These investigators undertook a population-based case-control study that evaluated the relationship between exposures to known or suspected environmental hazards and nine types of cancer. Cases consisted of newly diag-
nosed cancers in the years 1983 to 1986 among permanent upper Cape residents. The main environmental exposures considered were air and water pollution associated with the Massachusetts Military Reservation, Canal Electric Plant, the Barnstable airport, and other sources, perchlorethylene in water distribution system pipes, radiofrequency radiation from PAVE PAWS, electromagnetic radiation from 115 kV transmission lines and substations, and possible exposure to pesticides among residents who lived near cranberry bogs.
The study consisted of incident cancer of lung, n = 251, breast, n = 265, colon and rectum, n = 315, bladder, n = 62, kidney, n = 35, pancreas, n = 37, leukemia, n = 36, brain, n = 37, and liver, n = 4, as reported by the Massachusetts Cancer Registry in the years 1983 to 1986. Since many individuals were deceased by the start of the study, the living and deceased upper Cape residents were selected as controls (n = 1285). Trained interviewers queried all subjects or the next-of-kin either by telephone or in person to obtain demographic, occupational, and residential history and information on potential confounding variables such as cigarette smoking. Overall, approximately 81% of cases and 79% of controls were interviewed. The majority of the environmental exposure data was collected independently of the interview and linked to the study subjects using the residential histories.
Each exposure was examined separately in relation to all cancers combined, and then for the individual cancer sites. Most exposures were categorized as dichotomous variables, and then further analyzed according to distance, cumulative duration, and direction. The strength of the association between a particular exposure and each cancer site was measured by the odds ratio. Most analyses were conducted with and without latency to account for the possibility that the exposures under study could be either cancer initiators or a combination of both initiators and promoters.
Few study subjects had potential exposure to drinking-water contaminants from groundwater plumes emanating from various sites on or off the Massachusetts Military Reservation. Those plumes, including the Ashmet Valley plume, do not appear to account for much, if any, of the cancer burden to the population.
Results suggest approximately twofold elevations in the risk of brain cancer among those who ever had a residence supplied with public water on the upper Cape, particularly from the Barnstable Water Company. These findings cannot be considered conclusive because of limitations in the data. These limitations include the lack of details regarding the historical pattern of water contamination in the area and patterns of water use among the subjects, the large number of subjects dropped from these analyses because of missing data, and the almost complete overlap between exposures to the Barnstable Water Company and Barnstable airport for which an elevation in brain-cancer risk is also seen.
The investigators examined another public drinking-water exposure, perchlorethylene (PCE) from the water-distribution pipes, in relation to leukemia, bladder, and kidney cancer. A twofold increase in the risk of leukemia and
bladder cancer among those supplied with water from pipes that leached PCE was observed. These risk estimates were not statistically stable, a reflection of small numbers. For these reasons, the results are consistent with the hazards of PCE contamination in some of the distribution systems of the upper Cape.
Among residents located in proximity to the gun and mortar position on the Massachusetts Military Reservation, the investigators observed associations between possible airborne exposure and the risk of lung and breast cancer. Subjects who lived closer to the gun and mortar positions had a modest increase in the risk of lung cancer. Likewise, there was an increase in risk of breast cancer among subjects who lived closer to the sites. Among residents exposed for more than 20 years, the investigators found an increase in the risk of lung and breast cancer. Non-meaningful elevations were seen for the other cancer sites.
While no association was seen for PAVE PAWS, the exposure data were inadequate for these investigators to draw sound conclusions (greatly enhanced power-density data and modeled power-density estimates became available in 2004 (BSL 2004)). Possible pesticide exposure associated with living near the cranberry bogs was also examined. Again, an increase in risk of brain cancer was seen among individuals who ever lived within half a mile of a bog. The risk remained elevated when subjects with other relevant exposures were excluded. Other potential environmental exposures were also considered, including electromagnetic radiation from transmission lines. Results suggest that extremely low-frequency electromagnetic fields may relate to increases in the risk of bladder cancer and breast cancer. An association was also observed for brain cancer among those who ever swam in Johns Pond and leukemia among those ever swimming in local ponds.
A comparison of the calculated SIR for 5 categories consisting of total cancers, breast, colon, lung, and prostate cancer during 1987-1994 versus 1995-1999 for 5 towns in upper Cape Cod (see Table 9-2) demonstrated no consistent pattern of increase during the latter time period. During these two time periods, a decrease was observed in 15 out of 25 SIRS, no change in 4 out of 25 SIRS, and an increase in 6 out of 25 SIRs, thus suggesting that increasing duration of the presence of the PAVE PAWS radar has not resulted in increased incidence of cancer. Analyses covering longer durations may be required to confirm this initial observation.
In summary, these results across the spectrum of potential environmental exposures point to numerous potential associations that require further investigation as the results were largely inconclusive. The limited number of cases included in the study for each cancer site preclude definitive conclusions.
It should be noted that multiple comparisons are an issue whenever a state tumor registry breaks out incidence data for every town. Data are presented for 351 cities and towns in the Commonwealth of Massachusetts. Rothman and Greenland in their text point to the limitations of using tumor registry data for such descriptive statistics. Smaller towns will have higher variability and be at
TABLE 9-2 Comparison of Standardized Incidence Ratios for Upper Cape Cod During Periods 1987-1994 vs. 1995-1999
|
Town |
Total Cancer |
Breast |
Colon |
Lung |
Prostate |
|||||
|
1987-1994 |
1995-1999 |
1987-1994 |
1995-1999 |
1987-1994 |
1995-1999 |
1987-1994 |
1995-1999 |
1987-1994 |
1995-1999 |
|
|
Barnstable |
113 |
102 |
115 |
101 |
119 |
79 |
123 |
96 |
124 |
125 |
|
Bourne |
114 |
114 |
117 |
101 |
110 |
118 |
123 |
109 |
116 |
114 |
|
Falmouth |
122 |
114 |
119 |
118 |
120 |
101 |
116 |
106 |
154 |
121 |
|
Mashpee |
121 |
151 |
101 |
142 |
113 |
137 |
109 |
155 |
178 |
196 |
|
Sandwich |
109 |
97 |
119 |
110 |
99 |
99 |
104 |
68 |
134 |
106 |
|
SOURCE: Massachusetts Department of Public Health. |
||||||||||
increased risk of reporting significant variation from the state average. Also, adjacent towns are at risk of increased (or decreased) cancer incidence because of autocorrelation among risk factors that are not accounted for in the age-standardized data. (Rothman and Greenland,1998).
The results from the upper Cape cancer-incidence study stimulated additional investigations, of both the health effects associated with environmental exposures from the Massachusetts Military Reservation, and the Silent Spring investigation of breast cancer. In addition, the Bureau of Environmental Health Assessment of childhood cancer incidence on Cape Cod commissioned a study from 1982 for 1994. These are reviewed in sequence.
MASSACHUSETTS MILITARY RESERVATION
Ryan and colleagues (MDPH 2002) employed extensive analytic techniques to explore the possible associations between the Massachusetts Military Reservation and health among upper Cape Cod residents. In particular, they observed that the female lung-cancer rates were higher than expected in the immediate upper Cape area, especially in the vicinity to the south, east, and west of the Massachusetts Military Reservation. Rates of lung cancer begin declining in regions further away from the Massachusetts Military Reservation, although there are isolated areas of apparently high rates. While lung-cancer rates were high in the upper Cape, particularly for females, the excesses occur over a broad area of approximately 20 to 30 square miles, making it unlikely that a single nearby point source of exposure is responsible.
With respect to birth weights, Ryan and colleagues extended analysis over a larger spatial area, and across a 7-year time frame, showed good consistency among different methodologic approaches. Unlike the cancer studies, the analysis showed that additional data added in this analysis attenuated the previous reported associations. Birth weights in the upper Cape appear now, on average, modestly higher than the statewide average. While there has been a downward trend in birth weights across the state of Massachusetts, some of this trend is explained in terms of changes in time periods, particularly an increase in the number of multiple births. The lower than expected birth weights found in the Wareham area and in a few other locations, including Mashpee in the later years, do not suggest any particular relationship with the Massachusetts Military Reservation.
The investigators concluded that lack of a consistent finding between the lung-cancer rates and birth-weight maps leads to the conclusion that although some exposures from the Massachusetts Military Reservation may have contributed to the induction of lung cancers this does not seem to lend support for an association with birth weights.
Breast Cancer
The Massachusetts Department of Public Health awarded funds to the Silent Spring Institute, which conducted a study of breast cancer in relation to environmental risk factors drawing on data from 1982 to 1990. The investigators noted that 9 of the 15 towns in Massachusetts with significantly elevated breast cancer were located on Cape Cod, for the period from 1982 to 1990. Furthermore, towns in the mid-Cape and lower Cape were among those with the highest incidence compared to the rest of the state. Five of these mid- and lower-Cape towns had incidence rates that were 25 to 55% higher than the state average. The Silent Spring study looked in substantial detail at the potential environmental contamination that may relate to risk of breast cancer, focusing on environmental estrogens, PCE exposure, DDT exposure, and the role of the Massachusetts Military Reservation as potential sources of exposure. The investigation concluded that breast-cancer rates on Cape Cod do not appear to be fully explained by the individual characteristics of the women (including, for example, age, family history, reproductive history, alcohol consumption, smoking, and age at onset of menstruation and menopause). A number of specific environmental facilities of concern including the PAVE PAWS radar system, the Massachusetts Military Reservation, Canal Electric Plant, and Pilgrim Nuclear Power Station were considered and fail to explain why breast-cancer rates are elevated Cape-wide. However, the investigators could not rule out localized effects from these various facilities.
Breast cancer is predominantly driven by female hormones (Colditz 1998; Willett and others 2000). While the studies of breast cancer on Cape Cod have considered a number of reproductive risk factors (Aschengrau and others 1998; Coogan and Aschengrau 1998; Coogan and Aschengrau 1999; Aschengrau and others 2003; McKelvey and othes 2004), it appears that in these analyses, the use of postmenopausal estrogens, which significantly increase the risk of postmenopausal breast cancer, were not included. The investigators did, however, note that the use of mammography could not explain the increase in incidence that was observed.
A detailed analysis of residence on Cape Cod and risk of breast cancer (McKelvey and others 2004) included some 1121 cases of breast cancer occurring between 1988 and 1995 and 992 controls. These cases and controls were drawn from the entire Cape. After adjusting for age, family history, parity, age at first birth, education, body mass index, and history of breast cancer, longer duration of residence on Cape Cod was associated with increased risk of breast cancer. In general, after excluding women with a history of breast cancer, those women who had lived 20 or more years on Cape Cod had significantly elevated risk. For example, those living 40 to 47 years on Cape Cod had an adjusted relative risk of 1.57 (95% CI 1.07 to 2.29). Although uncontrolled confounding cannot be ruled out, it is unlikely that duration of residence is related to use of postmenopausal hormones or other established risk factors. Importantly, this elevated
risk of breast cancer is not limited to the upper Cape, or other defined sub-region on the Cape.
Upper Cape Cod Cancer-Incidence Review, 1986 to 1994
The Massachusetts Department of Public Health, Bureau of Environmental Health Assessment, reported the cancer rates for towns in Cape Cod through the “Upper Cape Cod Cancer Incidence Review, 1986-1994” released in June 1999. The study population for the statistical review included individuals who were residing in the Massachusetts towns of Barnstable, Bourne, Falmouth, Mashpee, and Sandwich between January 1986 and December 1994. Those five towns are collectively referred to as upper Cape Cod. The 1990 United States census data were used to represent the population of those towns for the year 1990. Cases were identified through the Massachusetts Cancer Registry. A total of 6244 primary-cancer cases were diagnosed between 1986 and 1994 among residents of the five upper Cape towns.
Cancer cases were selected for inclusion based on the reported address of residence, not the address of the diagnosing hospitals. Massachusetts residents diagnosed at out-of-state hospitals were also included in the series because of the Massachusetts Cancer Registry’s reciprocal reporting agreements with states where Massachusetts residents may be diagnosed including Connecticut, Florida, Maine, New Hampshire, New York, and Rhode Island. It is estimated that the Massachusetts Cancer Registry files contain data on 90 to 95% of reportable cases.
To estimate the standardized incidence ratios (SIRs) for each town, the incidence in the town is compared to the incidence for a given cancer in the state as a whole, which is used to represent the cancer experience of a comparable “normal” population. Thus the expected number of cases was estimated using standard approaches, within age-specific strata, of age, and then summed across age groups, to provide the overall expected number of cases for each town.
The descriptive analysis of cancer-incidence data for the upper Cape towns addressed 23 specific cancer types as well as total cancer incidence for the upper Cape as a whole, for each of the five towns, and for each of the 30 census tracts that compose the upper Cape. Cancer incidence for cancer types combined for the upper Cape as a whole was elevated significantly compared to the Massachusetts statewide experience. Cancer, however, is not one disease but rather a collection of different diseases, with distinct etiologies. The majority of cancers among upper-Cape residents were diagnosed in the lung, breast, prostate, and colorectal organs. These four cancer sites comprise slightly more than half of all cancers observed both on Cape Cod and in the United States overall. For the five upper-Cape towns combined, statistically significant elevations were observed for female breast cancer, colorectal cancer among males and both sexes combined, female lung cancer, and prostate cancer. In addition, statistically significant el-
evations were seen for melanoma. No statistically significant elevations for the upper Cape as a whole were seen in the other leading specific cancer types evaluated in this study (see Table 9-3).
The overall excess incidence of cancer in the upper Cape towns was 11% (SIR = 111; 95% CI 108-113). This was consistent for men (SIR = 112) and for women (SIR = 110).
It is of note that there is no common risk factor for breast, prostate, lung, and colorectal cancer other than increasing age. Breast and prostate cancers are largely hormonal in origin, cigarette smoking predominantly causes lung cancer, and colorectal cancer has many lifestyle factors that reflect a western lifestyle (including lack of physical activity, obesity, alcohol, low folate intake, height, etc.).
TABLE 9-3 Cancer Cases Diagnosed on Upper Cape Cod, 1986-1994, and Standardized Incidence Rate Ratios (SIR)
|
Type |
Male |
Female |
Total |
SIR |
95% CI |
|
Bladder |
167 |
57 |
224 |
102 |
(89-116) |
|
Brain |
50 |
46 |
96 |
99 |
(80-121) |
|
Breast |
5 |
935 |
940 |
110 |
(103-117) |
|
Cervical |
0 |
62 |
62 |
118 |
(90-151) |
|
Colon/rectum |
491 |
427 |
918 |
112 |
(105-120) |
|
Esophagus |
42 |
21 |
63 |
97 |
(74-124) |
|
Hodgkins |
28 |
15 |
43 |
116 |
(84-156) |
|
Kidney |
81 |
57 |
138 |
106 |
(89-125) |
|
Larynx |
66 |
9 |
75 |
103 |
(81-129) |
|
Leukemia |
68 |
33 |
101 |
105 |
(85-127) |
|
Liver |
21 |
11 |
32 |
99 |
(68-139) |
|
Lung & bronchus |
497 |
417 |
916 |
112 |
(105-120) |
|
Melanoma (skin) |
96 |
76 |
172 |
135 |
(116-157) |
|
Mouth and pharynx |
96 |
52 |
149 |
101 |
(86-119) |
|
Multiple myeloma |
20 |
25 |
45 |
90 |
(66-121) |
|
NHL |
86 |
94 |
180 |
95 |
(82-110) |
|
Ovary |
0 |
101 |
101 |
100 |
(81-122) |
|
Pancreas |
62 |
66 |
128 |
112 |
(93-133) |
|
Prostate |
1001 |
0 |
1001 |
130 |
(122-139) |
|
Stomach |
67 |
38 |
105 |
93 |
(76-112) |
|
Testis |
33 |
0 |
33 |
122 |
(84-172) |
|
Thyroid |
12 |
35 |
47 |
107 |
(79-143) |
|
Uterus |
0 |
146 |
146 |
94 |
(79-110) |
|
Other |
221 |
201 |
422 |
102 |
(93-112) |
|
Total |
3210 |
2927 |
6137 |
111 |
(108-113) |
|
SOURCE: Upper Cape Cod Cancer Incidence Review 1986-1994. Final Report Volume 2. Appendix C. Mass. Department of Public Health, Bureau of Environmental Health Assessment, Environmental Epidemiology Unit, June 1999. |
|||||
TABLE 9-4 Standardized Incidence Ratios, 1995-1999, for Upper Cape Cod Towns
|
Town |
Total Cancer |
Breast (f) |
Colon (total) |
Lung (total) |
Prostate (m) |
|
Barnstable |
102 |
101 |
79 (p < 0.01) |
96 |
125 (p < 0.001) |
|
Bourne |
114 (p < 0.01) |
101 |
118 |
109 |
114 |
|
Falmouth |
114 (p < 0.001) |
118 (p < 0.05) |
101 |
106 |
121 (p < 0.001) |
|
Mashpee |
151 (p < 0.001) |
142 (p < 0.05) |
137 |
155 (p < 0.001) |
196 (p < 0.001) |
|
Sandwich |
97 |
110 |
99 |
68 (p < 0.001) |
106 |
|
SOURCE: Cancer Incidence In Massachusetts 1995-1999: City and Town Supplement. |
|||||
This raises concern that the estimation of the expected number of cases of cancer may be distorted due to the population characteristics of Cape Cod residents, the distribution of age within any five-year age group, and the general construct of the definition of residents. For this definition of residence, for example, is a resident defined for the Massachusetts Cancer Registry the same as a resident defined for the United States Census?
The Massachusetts Department of Public Health updated information of cancer incidence and mortality with its report “Cancer Incidence and Mortality in Massachusetts 1996-2000.” Through 2000, total cancer-mortality rates declined significantly while incidence rates varied according to cancer site. The City and Town Supplement reports the cancer data for towns and is most recently available for the period 1995-1999.3 Data for upper Cape Cod towns are summarized in Table 9-4.
These updated data indicate that the incidence of cancer remains elevated in three of the five upper Cape towns, breast cancer in two, and prostate cancer in three. On the other hand, significantly lower than expected rates of colon cancer are observed in Barnstable, while lung cancer is significantly elevated in Mashpee but significantly reduced in Sandwich. While the small number of cases in each town may contribute to this variability, it is clear that the picture of elevated incidence across these four leading cancers has changed considerably in these more recent data.
Childhood Cancer
The Bureau of Environmental Health Assessment of the Massachusetts Department of Public Health released a report in September 1999 “Assessment of
Childhood Cancer Incidence on Cape Cod, Massachusetts, 1982 to 1994.” This report addressed cancer among children up to and including age 19 at the time of diagnosis on Cape Cod. All cancers diagnosed in children between 1982 and 1994 and reported through the Massachusetts Cancer Registry were included. The purpose of the evaluation was to discuss the types of cancer that were occurring among Cape Cod children and to identify areas with a greater than expected occurrence of childhood cancer. Like other health evaluations, this investigation was initiated at the request of Cape Cod citizens who were concerned that childhood cancer might be a problem on Cape Cod.
Each cancer case was geocoded to the location of the child’s residence at the time of diagnosis. Standardized incidence ratios were calculated to estimate the number and types of cancers diagnosed among children, and determine if this was different from what was expected based upon statewide childhood cancer rates.
A total of 101 cancers were diagnosed among children on Cape Cod between 1982 and 1994. Overall, this total represents 19% more cancer than would have been expected over this 12-year period. In absolute terms, this is 17 excess cases. The three most common types of cancer diagnosed were lymphomas (n = 26), leukemias (n = 23), and central nervous system tumors (n = 17) (other cancers were renal 8, soft tissue 10, carcinoma 9, other 7). The observed elevation in total cancer was mostly due to elevations in lymphomas and leukemia among mid-Cape children, and to a lesser extent leukemia among lower-Cape residents (see Table 9-5). Childhood cancer did not appear to concentrate in specific areas within towns or within specific time periods over the 12 years of data accumulation. In addition, the types of cancer most commonly observed in the ages of diagnosis generally followed patterns observed elsewhere in Massachusetts. These results do not suggest common environmental factors being responsible for the observed excess childhood cancer.
Birth Defects
In 1996, the Centers for Diease Conrol and Prevention awarded five years of funding to the Massachusetts Department of Public Health to establish the Massachusetts Center for Birth Defects Research and Prevention. An active birth defects surveillance system involves trained personnel who validate passive reports of birth defects cases to the Department, and actively seek cases in hospitals and other health facilities. This approach provides more complete ascertainment of cases, more accurate data on cases, and more rapid reporting of cases. The center collected data on birth defects in the eastern part of Massachusetts from October 1997 to October 1998. Since October 1998, the surveillance program has been collecting cases statewide from the 53 birth hospitals and Children’s Hospital, Boston. The report of 1999 statewide data represents the first full year of surveillance data (MDPH 2001).
All cases represent diagnoses before the infant reached one year of age. The
TABLE 9-5 Standardized Incidence Rates, Childhood Cancer, Cape Cod, 1982-1994
|
|
Observed |
Expected |
SIR (95% CI) |
|
All of Cape Cod |
|||
|
Leukemia |
23 |
20.5 |
112 (71-169) |
|
Lymphoma |
26 |
13.3 |
195 (127-286) |
|
CNS |
17 |
21.3 |
80 (46-128) |
|
Upper Cape Cod |
|||
|
Leukemia |
12 |
13.0 |
92 (48-192) |
|
Lymphoma |
11 |
8.3 |
132 (66-236) |
|
CNS |
10 |
13.5 |
74 (35-136) |
|
Mid Cape Cod |
|||
|
Leukemia |
7 |
5.9 |
120 (48-246) |
|
Lymphoma |
13 |
3.9 |
332 (177-568) |
|
CNS |
7 |
6.1 |
114 (46-235) |
|
Lower Cape Cod |
|||
|
Leukemia |
4 |
1.6 |
Nca |
|
Lymphoma |
2 |
1.1 |
Nc |
|
CNS |
0 |
1.7 |
Nc |
|
aNot calculated. |
|||
infant or fetus must have a structural defect that met diagnostic criteria, and the infant was live born, or the fetus was stillborn with gestational age greater than or equal to 20 weeks or with a weight of at least 350 grams.
Overall for Massachusetts in 1999, 1.1% of births in the state had one or more birth defects. The rate of birth defects per 10,000 births was 108.2 (95% confidence interval 101.2 to 115.5). This was based on a total of 875 diagnosed and reported birth defects. The most common defects among live births and still-births in 1999 were atrial septal defect (95 cases), ventricular septal defect (71 cases), cleft lip with and without cleft palate (69 cases), trisomy 21 (Down syndrome, 67 cases), hypospadias (2nd and 3rd degree, 49 cases), cleft palate without cleft lip (44 cases), obstructive genitourinary defect (42 cases), pulmonary valve atresia and stenosis (34 cases), coarctation of the aorta (25 cases), and endocardial cushion defects (25 cases).
When the rate is evaluated by region in the state, the lowest rate is reported for the southeast, a region that includes the Cape and islands and extends north to encompass a total population generating 15,000 births. The 130 cases of birth defects diagnosed in 1999 represents a rate of 86.1 per 10,000 births (95% confidence interval 71.9 to 101.5). The apparently lower rate may be because of some births being delivered in Rhode Island where Massachusetts surveillance was not
conducted. The limited number of birth defects each year precludes firm conclusions and requires accumulation of additional years of surveillance data to generate stable estimates of rates.
SAMPLE SIZE AND STATISTICAL POWER TO INVESTIGATE HEALTH RISKS OF THE PAVE PAWS RADAR
Introduction
When investigating the occurrence of disease within a defined population, it is important to recognize the inherent limitations that may be encountered when making a determination of whether or not there is an excess in the number of expected cases. Disease rarely occurs in a uniform manner within the general population. That is, disease within a defined population can, by random chance, vary in occurrence according to time and place. Thus, in order to evaluate if disease is occurring in excess, one must take into consideration the random variation that can occur. This is done by statistically considering the probability that a given observation may occur by chance alone. Conversely, one is often faced with the question of what level of excess can be ruled out with some reasonable level of confidence.
The concept of statistical power refers to the ability to detect a given level of excess within a defined population. Calculation of statistical power requires assumptions and/or estimates of the (1) expected incidence of disease, (2) proportion of the population exposed to the factors of interest, (3) size and composition of the population, and (4) level of risk one would like to detect/rule out. Consider the following example. Prior to embarking on a study to determine if there is two-fold or greater occurrence of a specific disease among the residents of a designated city, a researcher calculated the statistical power to be 0.75. This means that if a twofold excess truly does exist the researchers will have a 0.75 (i.e., 3 out of 4) chance of detecting the twofold difference.
Power Calculations
Using cancer as an example, the following calculations have been made for the upper Cape Cod population assuming (1) cancer rates for the United States obtained from the Surveillance, Epidemiology and End Results Program, (2) 12% of the residents in upper Cape Cod reside in a location that results in exposure to the sidelobes of the PAVE PAWS radar beam, (3) the population size and composition of upper Cape Cod is that obtained for the 2000 U.S. Census (see Figure 9-1) and would be observed over a 10-year period, and (4) alpha = 0.05 for a two-sided test. The power calculations have been made for a spectrum of risk, ranging from 1.1 (i.e., 10% increase) to 2.5 (250% increase).
However, it is not likely that any single-source exposure would etiologically
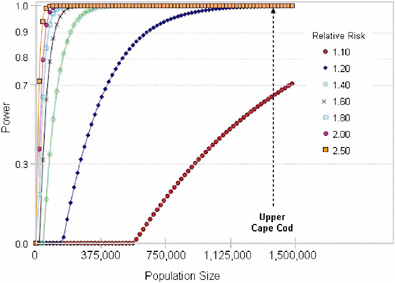
FIGURE 9-1 Power to detect total cancer (excluding non-melanoma skin cancer) occurrence.
be associated with an increase in the broad spectrum of malignancies seen in the general population. Rather, it is more likely that if the PAVE PAWS radar is associated with an increase in cancer risk, there will be some level of specificity as to the types/forms of malignancy. Therefore, it is important to consider statistical power within a cancer-specific context.
Summarized in Table 9-6 is the diagnosis-specific power calculation for the upper Cape Cod population. Highlighted are those cancer-specific groups where power would be considered sufficient to detect a modest level of risk (i.e., less than twofold).
Concerns have been raised regarding the potential excess of malignancies among the pediatric population in the upper Cape. Since the incidence of cancer in children under the age of 15 years is relatively low, compared to rates among the adult populations, it is not surprising that the power to detect anything except extremely large (i.e. >100-fold) risks does not exist. Even when considering all diagnoses combined, there would be 80% power to detect a 9-fold (900% increase). As with adult malignancies, it is unlikely that a single exposure (e.g., radar) would increase the occurrence of multiple types of malignancy. Accordingly, it is not possible to study increases of specific pediatric cancers in the upper Cape Cod in order to rule out risks less than 100-fold in excess.
For the residents of Cape Cod, it is unclear what minimal level of risk would provide sufficient assurance that the PAVE PAWS facility is not adversely impacting health. If the answer is 99% assurance that there is not an increase of
TABLE 9-6 Minimum Relative Risk Detectable in Population Followed for 10 Years, Assuming 12.5% of the Population Exposed, and Background SEER Cancer Incidence Rates 1975-2001 (All Ages), Alpha = 0.05 Two-Sided Test
|
|
Total population (25,300) |
Males (13,000) |
Females (12,300) |
|||
|
Power =. 8 |
Power = .9 |
Power =. 8 |
Power =. 9 |
Power= . 8 |
Power = .9 |
|
|
Any Cancer |
1.12 |
1.14 |
1.18 |
1.21 |
1.17 |
1.20 |
|
Colon & Rectum |
1.42 |
1.49 |
1.69 |
1.84 |
1.65 |
1.78 |
|
Lung & Bronchus |
1.38 |
1.45 |
1.62 |
1.75 |
1.59 |
1.70 |
|
Breast |
1.34 |
1.40 |
>100.00 |
>100.00 |
1.35 |
1.41 |
|
Corpus Uteri |
— |
— |
— |
— |
3.11 |
4.01 |
|
Ovarian |
2.89 |
3.64 |
— |
— |
5.09 |
8.30 |
|
Prostate |
— |
— |
1.55 |
1.65 |
— |
— |
|
Testicular |
— |
— |
78.52 |
>100.00 |
— |
— |
|
Bladder |
1.81 |
2.00 |
2.49 |
2.99 |
2.37 |
2.81 |
|
Kidney & Renal Pelvis |
2.33 |
2.73 |
3.81 |
5.34 |
3.53 |
4.78 |
|
Hodgkin Lymphoma |
3.80 |
22.18 |
>100.00 |
>100.00 |
62.79 |
>100.00 |
|
Non-Hodgkin Lymphoma |
1.85 |
2.06 |
2.59 |
3.13 |
2.46 |
2.93 |
|
Lymphoid Leukemia |
3.94 |
5.62 |
10.67 |
33.84 |
9.00 |
23.22 |
|
Myeloid Leukemia |
3.53 |
4.78 |
8.43 |
20.33 |
7.28 |
15.33 |
|
Myeloma |
3.63 |
4.99 |
8.96 |
23.01 |
7.69 |
16.99 |
|
Pancreas |
2.34 |
2.75 |
3.84 |
5.41 |
3.55 |
4.83 |
|
Liver |
3.94 |
5.62 |
10.67 |
33.84 |
9.00 |
23.22 |
|
Soft Tissue |
7.81 |
17.49 |
70.25 |
>100.00 |
43.74 |
>100.00 |
|
Bone & Joint |
>100.00 |
>100.00 |
>100.00 |
>100.00 |
>100.00 |
>100.00 |
greater than 1%, then research would not be able to satisfactorily address such concerns. Using cancer as an example and assuming 10 years of observation of the population, one could reasonably anticipate that well-designed and well-conducted research, either prospective or retrospective in design, could address moderately low levels of risk (i.e., between 1.4 and 2.0) for some of the more common cancers (i.e., colo-rectal, lung, breast, prostate, bladder, and non-Hodgkin’s lymphoma). For other diagnoses the ability to address less than a twofold risk would require extended length of observation of exposed residents.
STATISTICAL ANALYSES
Introduction
To characterize challenges inherent in the epidemiological assessment of the health effects associated with exposure to the PAVE PAWS radar, we conducted a geographical correlation study within the upper Cape Cod region surrounding the Massachusetts Military Reservation (MMR) where PAVE PAWS is located. Our statistical analysis focused mainly on the 30 census tracts in five towns shown in Map 1, and it was organized as follows. First, we conducted an exposure-
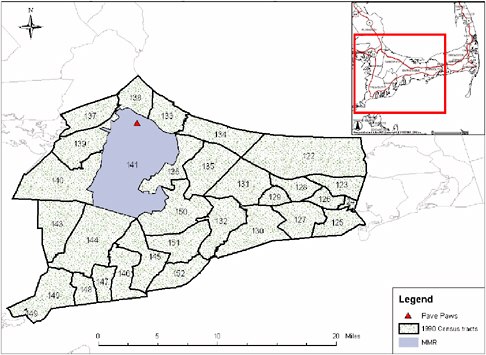
MAP 1 Location of 30 census tracts in upper Cape Cod region studied in statistical analysis.
assessment study where we estimated: (a) the percent of the population in the Cape that is exposed to the PAVE PAWS radar by age and gender; and (b) the power-density exposure (average and peak) from three different sources at each census tract weighted by population density. Second, we performed a geographic correlation study to estimate associations between Standard Incidence Ratios (SIR) and estimated exposure to PAVE PAWS adjusted by socio-economic status and other spatially correlated factors.
EXPOSURE ASSESSMENT STUDY
Percent of Population Exposed to PAVE PAWS Radar Beam
We first estimated the geographical areas in the Cape that had a non-zero exposure to the PAVE PAWS radar beam. Those areas were identified by taking into account: (a) that exposure occurs only in the area with direct line of sight to the radar, and (b) the operating triangle of the radar (an area has direct line of sight to the PAVE PAWS radar only if there is no higher ground in between). Because the main beam of the radar ends at 0.1 degree above the horizontal, these areas are exposed to the power radiated primarily by the sidelobes of the radar, which have much lower power densities than the main beam. We determined regions with line of sight to the PAVE PAWS radar by using a digital elevation map (Map 2) from the GeoComm International corporation.4
We then further refined the calculations by taking into account the total height of the radar (105 feet) and the PAVE PAWS radar scanning angle (347 degrees to 227 degrees). The regions with non-zero exposure are shown in Map 3. Map 4 shows the estimates areas with non-zero exposures as provided bo use by MITRE.
To estimate the percent of the population exposed to the PAVE PAWS radar beam we proceeded as follows. First, we used the 1990 and the 2000 census-bureau data to determine the population size by age and gender at each location. Because of the small sample size within each census block, we aggregated the population density by census-block group (Map 5).
Within each census-block group, we estimated the number of persons exposed to the radar by multiplying the population in that census-block group by the proportion of area within that census block group with non-zero exposure. We then summed the estimated number of persons exposed across the 117 census-block groups (102 census-block groups in year 2000), and divided the sum by the total population. Overall we estimated that in 1990, 11.8% of the population living in upper Cape Cod was exposed to the PAVE PAWS radar beam. Percentages of the total population exposed to the PAVE PAWS radar beam by age and gender are presented in Table 9-7.
|
4 |
http://gisdatadepot.com/dem May 2004. |
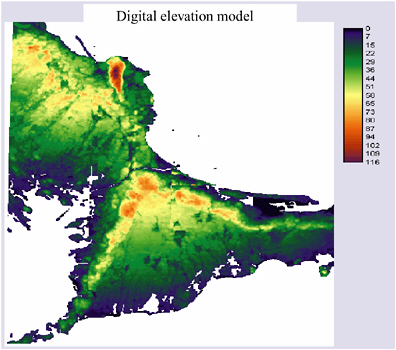
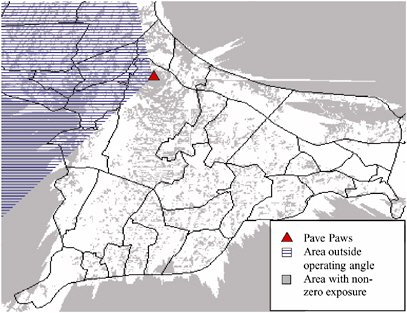
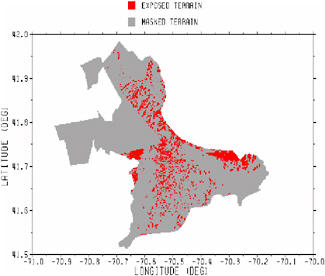
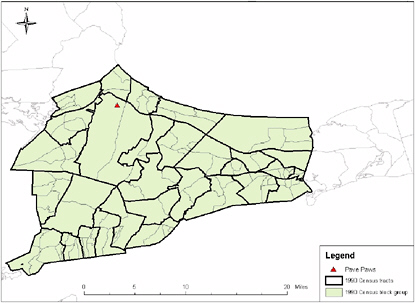
TABLE 9-7 Estimated Proportion of Population Living Under the Line of Sight of PAVE PAWS Radar
|
Age Group |
1990 Census |
2000 Census |
||||||
|
Male |
Female |
Male |
Female |
|||||
|
Population Size |
Proportion Exposed |
Population Size |
Proportion Exposed |
Population Size |
Proportion Exposed |
Population Size |
Proportion Exposed |
|
|
All ages |
51,759 |
11.8% |
56,481 |
11.8% |
63,213 |
12.4% |
69,071 |
12.4% |
|
0-4 |
3,989 |
12.3% |
3,774 |
12.5% |
3,736 |
13.5% |
3,505 |
13.8% |
|
5-14 |
6,959 |
12.5% |
6,757 |
12.7% |
9,216 |
13.4% |
8,819 |
13.2% |
|
15-24 |
6,478 |
10.3% |
5,970 |
11.1% |
6,649 |
11.0% |
5,949 |
11.6% |
|
25-34 |
8,238 |
11.6% |
8,841 |
11.7% |
6,507 |
12.1% |
7,128 |
12.3% |
|
35-44 |
8,226 |
12.5% |
8,653 |
12.2% |
10,282 |
12.6% |
11,259 |
12.5% |
|
45-54 |
5,010 |
12.0% |
5,469 |
11.8% |
9,283 |
12.4% |
10,149 |
12.5% |
|
55-64 |
4,851 |
11.8% |
5,754 |
11.3% |
6,593 |
12.3% |
7,805 |
12.3% |
|
65-74 |
5,113 |
11.8% |
6,227 |
11.7% |
6,302 |
12.3% |
7,323 |
11.9% |
|
75-84 |
2,348 |
11.8% |
3,617 |
10.7% |
3,751 |
12.0% |
5,161 |
11.9% |
|
85+ |
547 |
10.3% |
1,419 |
9.7% |
894 |
11.2% |
1,973 |
11.3% |
There was little difference in exposure between each age and gender group. Based on 2000 census data, the estimated proportion of population living in the area exposed to the PAVE PAWS radar beam increased slightly to 12.4%. The changes in population distribution in the past decade had little effect on the proportion of population living under the line of sight from the PAVE PAWS radar.
Average and Peak Power-Density Assessment
Because cancer-incidence data was made available to us only at census-tract level, to carry out a geographic correlation study and to estimate association between cancer incidence and exposure to the PAVE PAWS radar beam, we needed to estimate average and peak power density at each census tract. Three sets of power-density data were used in this analysis. The first set was calculated based on two simple assumptions. The first assumption was that only the area with direct line of sight to the radar and under the radar’s operation angle would be exposed to the radar beam. The second assumption was that power density decreased as the distance from the radar increased. This relationship was estimated by fitting a power curve between the average power-density obtained from the MITRE Technical Report (MITRE 2000) and the distance to the radar. The fitted curve is equal to average power density (µW/cm2) = 8972*distance−1.325(meters).
With these two assumptions, we calculated both average and peak power-density at locations 180 meters apart within the study region (Map 6).
The committee is aware that these are very simplistic assumptions. Nonetheless, this first dataset provided a good basis for validating datasets from other sources. In this report, we refer to this estimated exposure to the PAVE PAWS beam as “simple.”
The second estimated power-density dataset was provided by MITRE Corporation at locations 200 meters apart (Map 7).
Detailed descriptions of the PAVE PAWS radar power-density calculations can be found in the MITRE technical report (MITRE 2000). The third dataset was obtained from Broadcast Signal Lab (BSL) (Map 8).
To estimate the radiofrequency exposure from the PAVE PAWS radar in each census-block group on Cape Cod (BSL 2004), BSL utilized “the ComStudy propagation modeling software” in conjunction with an analytical model of the PAVE PAWS antenna supplied by the MITRE Corporation. We obtained power-density estimates at locations 140 meters apart in the east-west direction and 188 meters apart in the north-south direction (Map 8).
We then estimated exposure at each census tract by weighting power-density values in µW/cm2 at each location by the corresponding population density at the census block (Map 9).
Population density was calculated by dividing the number of individuals living in the census block in 2000 by total square miles of dry land. The 2000 census data were used because the census bureau did not provide 1990 census informa-
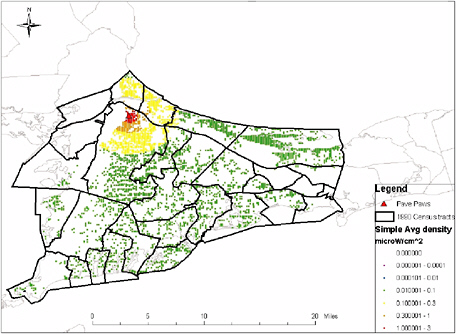
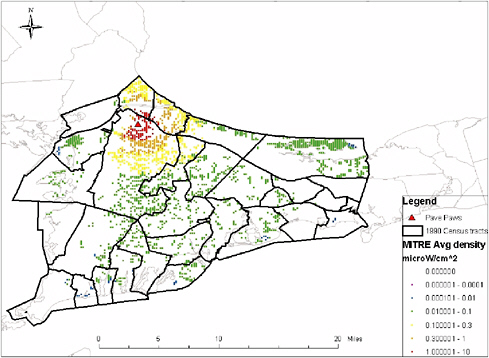
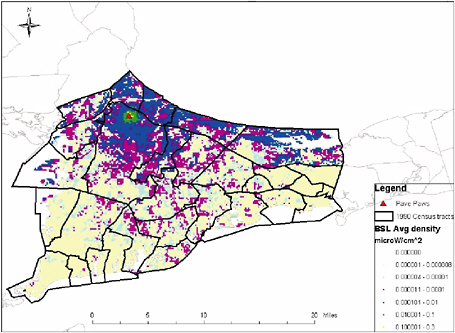
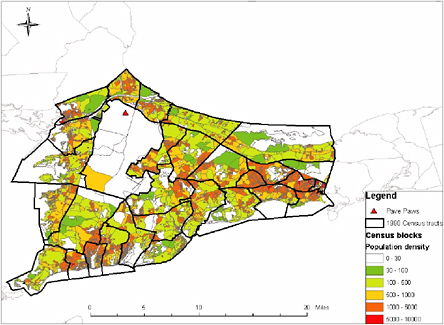
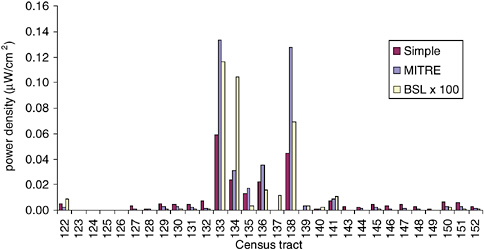
FIGURE 9-2 Average density estimate comparison.
tion at the census-block level. We then aggregated the exposure estimates at each location to obtain average and peak power-density exposures in each census tract in 1990. The resulting average power-density exposure estimates at the census-tract level from the three data sources are shown in Figure 9-2. (Note that results shown for BSL are magnified by a factor of 100.)
As expected, since the “simple” exposure estimates partly depended on MITRE power-density estimates, these two set of results were very similar. Although BSL predicted non-zero exposure in almost the whole study region, its resulting estimates were generally lower than those from MITRE. Most census tracts having high exposure estimates from the MITRE dataset also had relatively high estimates from the BSL dataset. For census tract 137, the difference was due to a large proportion of its area being situated outside the PAVE PAWS operating angle and that BSL estimates took into account reflection of the radar signal in this region. It is important to notice that the absolute magnitude of the density estimates would not affect the statistical significance of the variable of interest in our geographic-correlation study.
Socio-economic Factor Adjustment
In the period of 1986-1994, total-cancer incidence was 11% higher in upper Cape Cod compared to the state of Massachusetts (SIR 95% CI: 108-113; see Table 9-2). This elevated SIR might be caused by three potential confounding factors: age distribution, smoking behavior, and socio-economic status (SES). Confounding due to age distribution can be controlled in the calculation of the expected cancer-incidence counts. In the upper Cape Cod cancer-incidence re-
view, the expected counts were calculated using 10 age categories in lieu of 6 age categories used by Massachusetts Cancer Registry in its 1997 report. These additional age groups provided extra precision in the calculation of the expected cancer-incidence count, addressing the concern of confounding by age. Since smoking has been identified as a risk factor of multiple cancers, it is important to find out if differences in smoking behavior exists between the population in upper Cape Cod and in the state of Massachusetts. Results from Massachusetts Behavioral Risk Factor Surveillance System (BRFSS) for the period 1999 to 2001 estimated similar proportions of current smokers with 19% and 20% in upper Cape Cod and the state of Massachusetts, respectively. The small sample size in this study (304 in upper Cape Cod) provides little statistical power to demonstrate any difference in the estimates. In the Health Risks and Preventive Behaviors report that combined BRFFS results from 1994 to 1999, the estimate of current smokers in the Cape and islands was 18.3% (95% CI 14.8%-21.7%) compared to 21.2% (95% CI 20.4%-21.9%) in Massachusetts. This difference is not statistically significant. The last concern is the difference in SES between the population in upper Cape Cod and in the state of Massachusetts that may change the expected number of cancer incidences. For example, if one type of cancer has a higher detection rate in a population with high socio-economic status due to better access to health care and one supposes that a wealthy population lives in upper Cape Cod, then one should expect to see more cancer diagnosed in upper Cape Cod. Failing to adjust for this higher than expected number of cancer incidences will over-estimate the SIR. To assess the potential confounding due to SES disparity, we examined the percentage of population older than 18 years living below the line of poverty from the 1990 census data.
Upper Cape Cod has 6.5% of its population living below the poverty line compared to 8.3% in Massachusetts (see Figure 9-3). This difference required the
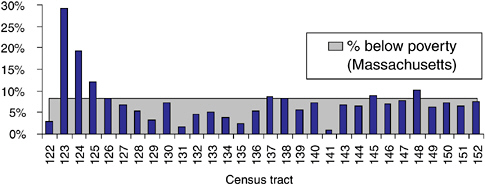
FIGURE 9-3 Percent population (18 years +) living below line of poverty 1990.
|
Model 1 Oc : observed number of cancer incidence in census tract c Ec : expected number of cancer incidence in census tract c
|
adjustment of the cancer SIR by socio-economic status in addition to the standard adjustment by age and gender.
Model 1 describes the indirect adjustment made to obtain SIR further adjusted by socio-economic status. One important data requirement is the knowledge of the cancer incidence rate for a particular age, gender, and poverty group in Massachusetts. However, limited SES-related information is collected by the Massachusetts Cancer Registry.
Because of data unavailability for indirect SES adjustment on cancer-incidence ratios, we explored the potential association of SES and cancer SIR using data from the “Upper Cape Cod Cancer Incidence Review, 1986-1994” and SES data from the Census Bureau. Since 62% of all cancer incidences in upper Cape Cod during that period were one of the four major cancer types (colo-rectal, breast, lung, prostate cancer), we used the SIR of these four major cancer types as response variable, and the percentage of population older than 18 living below the poverty line as a measure of socio-economic status. These data were fitted using a log-linear model (Model 2) taking into account unobserved explanatory variables that are assumed to be spatially correlated (MDPH 2002). The parameter γ in this model represents the association between SIR and SES, namely how SIR varies with respect to changes in SES. This association will be presented as per-
|
Model 2 Oi|µi ~Poisson (µi) i = census tracts log µi = log Ei + α0 + γ*SESi + bi α0 : overall log relative risk γ : log relative risk of cancer incidence associated with SES bi : spatial correlation |
TABLE 9-8 Association Between Socio-economic Status and Cancer Incidence Ratio
|
Cancer Types |
% Change in Relative Risk per 1% Increase in Population Below Poverty |
95% C.I. |
|
Colo-rectal cancer |
2.48 |
0.54 - 4.57 |
|
Breast cancer |
−1.04 |
−2.72 - 0.59 |
|
Prostate cancer |
−0.90 |
−3.79 - 1.90 |
|
Lung cancer |
1.49 |
−0.78 - 3.53 |
cent change in relative risk of cancer incidence for each percent increase in population above age 18 living below the line of poverty.
All models were implemented in WinBUGS 1.4 statistical programming language. We employed a standard procedure reporting small coefficient estimates γ and α1 as a percent change in relative risk per unit change in SES and exposure, respectively. Besides colo-rectal cancer, our analyses of cancer incidence on upper Cape Cod demonstrated little association between socioeconomic factors and the standardized incidence ratio of three major cancer types (see Table 9-8).
In the case of colo-rectal cancer, data showed 2.5% increase in relative risk (95% CI: 0.5-4.6%) per 1% additional population living below poverty. This suggested that colo-rectal cancer SIR could be understated for higher-income census tracts with higher-income levels.
Furthermore, if these higher-income census tracts had higher exposure, then we might underestimate the association between exposure and SIR. Plotting SES by exposure (Figure 9-4) revealed no strong relationship between these two variables; hence, results from our geographic correlation study should not be sensitive to the SES adjustment.
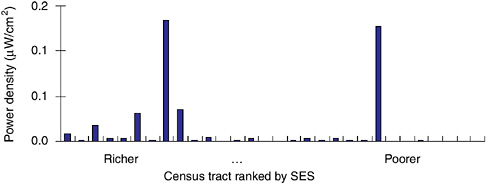
FIGURE 9-4 Census tract MITRE average-density exposure by SES ranking,
GEOGRAPHIC CORRELATION STUDY
To measure the association between the estimated PAVE PAWS power-density exposure (average and peak) and cancer incidence at census-tract level, we fitted a log-linear model taking into account spatial correlation for unobserved variables. In addition, we controlled for SES by introducing the percentage of population over 18 years of age living below the poverty level in our model (Model 3). For each of the four major cancer types, the cancer incidence data revealed little evidence of association with our estimated exposure and we determined that controlling for SES did not lead to qualitative changes in the relative rate estimates (Figure 9-5).
|
Model 3 Oi|µi ~Poisson (µi) i = census tracts log µi = log Ei + α0 + α1* Exposurei + γ*SESi + bi α0 : overall log relative risk α1 : log relative risk of cancer incidence associated with PAVE PAWS density exposure γ : log relative risk of cancer incidence associated with SES bi : spatial correlation |
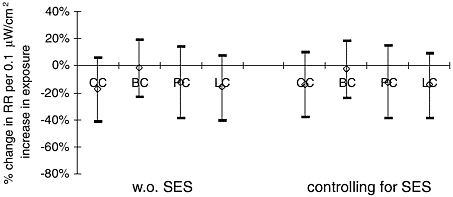
FIGURE 9-5 Association between MITRE average power-density exposure and cancer incidence with/without controlling for SES. CC—colo-rectal cancer, BC—breast cancer, PC—prostate cancer, LC—lung cancer.
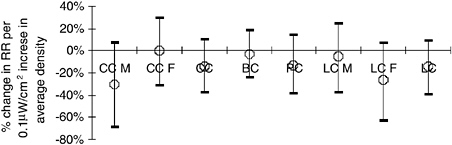
FIGURE 9-6 Association between MITRE average density exposure and cancer incidence. CC—colo-rectal cancer, BC—breast cancer, PC—prostate cancer, LC—lung cancer. M = male, F = female.
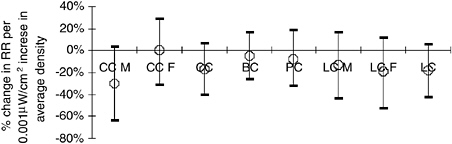
FIGURE 9-7 Association between BSL average density exposure and cancer incidence. CC—colo-rectal cancer, BC—breast cancer, PC—prostate cancer, LC—lung cancer. M = male, F = female.
Based on Model 3, we found no statistically significant association between MITRE average power-density exposure estimates and any of the four major cancer types (Figure 9-6). We also conducted a sensitivity analysis by fitting the same model using BSL average power-density exposure estimates (Figure 9-7) and MITRE peak power-density exposure estimates (Figure 9-8). We found that our result was not sensitive to the choice of exposure estimates.
Due to the large power-density estimates at census tracts 133-6 and 138, results in Figures 9-6 to 9-8 might be highly influenced by these few census tracts. We, therefore, refitted the statistical model by using BSL average power-density expressed in decibels with respect to microwatts per centimeter square (dBµW/cm2) where exposure in dBµW/cm2 = 10*log10 exposure in µW/cm2. Similar to the spatial correlation analysis conducted in the µW/cm2 scale, after controlling for SES, the associations between exposure and cancer incidence were not statistically significant for all four major cancers (Figure 9-9).
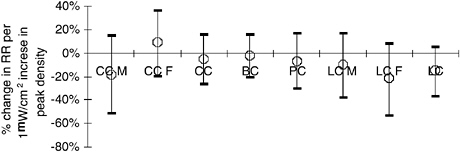
FIGURE 9-8 Association between MITRE peak-density exposure and cancer incidence. CC—colo-rectal cancer, BC—breast cancer, PC—prostate cancer, LC—lung cancer. M = male, F = female.
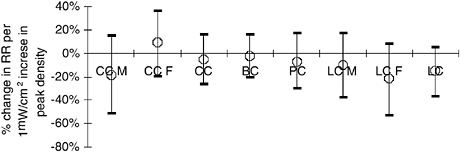
FIGURE 9-9 Association between BSL average density exposure (decibel) and cancer incidence. CC—colo-rectal cancer, BC—breast cancer, PC—prostate cancer, LC—lung cancer. M = male, F = female.
Geographic Correlation Study Summary
To combine evidence of all 24-cancer types, we fit a hierarchical model as specified in Model 4. Neither of the two exposure estimates showed statistically significant association with cancer incidence between 1986 and 1994. For peak-density exposure, we estimated a 6.5% decrease in relative risk (95% CI: −14.2 -1.2%) per 1 µW/cm2 increase in the level of peak exposure. In addition, we estimated a 6.6% decrease in relative risk (95% CI: −11.8 - 0.1%) per 0.1 µW/cm2 increase in average-density exposure.
Findings of the National Research Council committee’s geographical correlation study by census tract of exposure to PAVE PAWS radar and cancer incidence should be interpreted with caution. First, because of the lack of sufficient health-related statistics and confounders at a geographical resolution smaller than a census tract, our results could be affected by ecological and confounding bias. In addition, as in most environmental risk-assessment studies, our census-tract
|
Model 4
α1: overall log relative risk of cancer incidence associated with PAVE PAWS density exposure |
exposure estimates could be affected by exposure-measurement error. In fact, census-tract exposure estimates are residential and might not represent the actual personal exposures. Epidemiological studies that use health-related statistics (mortality, morbidity, and pregnancy outcomes) and potential confounders (smoking, pollution, SES) at a smaller level of spatial aggregation (i.e., census-block group) and that take into account daily activity patterns in the exposure assessment would provide a more precise and comprehensive assessment of the potential health effects associated with an exposure to the PAVE PAWS radar.
SUMMARY
-
Evaluation of previously reported data demonstrates that:
-
In general, there is an absence or lack of sufficient health-related statistics available for Cape Cod residents to allow for a detailed descriptive analysis within smaller and more specific subdivisions such as counties, towns, census tract, and census block. Population-based data are available only for outcomes relating to cancer, birth defects, birth weight, and premature mortality, although the size of the population within geopolitical areas of interest does not always allow for a sufficient number of outcomes to allow adequate evaluation.
-
The observed elevated cancer-incidence rates among residents of Cape Cod have not been adequately explained through subsequent investigations.
-
While previous case-control and ecologic correlation studies have not provided compelling evidence for elevated cancer risk associated with exposure to the PAVE PAWS radar, it cannot be concluded from these studies that the PAVE PAWS radar is not associated with cancer risk. The previous studies have limitations relating to cancer-specific sample size and detailed exposure assessment.
-
Because of the limited population of upper Cape Cod, it will not be
-
possible to conduct cancer-specific research studies with statistical power to rule out small or moderate levels of increased risk related to exposure to the PAVE PAWS radar beam.
-
The International Epidemiology Institute has proposed a study at the county level using counties west of PAVE PAWS (out of PAVE PAWS operating angle) as a control. This study proposes to evaluate health outcomes before and after the startup of the PAVE PAWS radar, which should strengthen any association, or lack thereof, of health effect with the PAVE PAWS radar.
-
Geographical correlation by census tract of exposure to PAVE PAWS radar and cancer incidence (analysis conducted by this NRC committee):
-
Using available information on population density, topography, and direction of the PAVE PAWS radar beam it is estimated that about 16,400 people in Cape Cod reside in the sidelobes of the main PAVE PAWS beam.
-
Analysis of the occurrence of specific cancers, including colorectal, breast (female), prostate, and lung, did not identify any significant association with estimated peak or average power-density exposure to the PAVE PAWS beam.
-
Statistical adjustment for socioeconomic status, utilizing the percent of population below the poverty level, had little impact on the observed correlations. The lack of census-tract level information on confounding factors such as smoking and diet remains a limitation of our geographical correlation study. However, for a confounding factor to have significant effect on the results, it needs to be strongly related to the cancer incidence and inversely correlated with exposure estimates.
REFERENCES
Aschengrau, A., C. Paulu, and D. Ozonoff. 1998. Tetrachloroethylene-contaminated drinking water and the risk of breast cancer. Environ Health Persp 106 (Suppl 4):947-953.
Aschengrau, A., S. Rogers, and D. Ozonoff. 2003. Perchloroethylene-contaminated drinking water and the risk of breast cancer: additional results from Cape Cod, Massachusetts. Environ Health Persp 111:167-73.
BSL (Broadcast Signal Lab). 2004. Draft Final Test Report on a Survey of Radio Frequency Energy Field Emissions from the Cape Cod Air Force Station PAVEPAWS Radar Facility, Broadcast Signal Lab, Medfield, MA.
CCCR (Cape Cod Commission Reporter). April 17, 2003. Vol 13, no 4.
Colditz, G. 1998. Relationship between estrogen levels, use of hormone replacement therapy, and breast cancer. J Natl Cancer I 90:814-823.
Coogan, P.F. and A. Aschengrau. 1998. Exposure to power frequency magnetic fields and risk of breast cancer in the Upper Cape Cod Cancer Incidence Study. Arch Environ Health 53:359-367.
Coogan, P.F. and A. Aschengrau. 1999. Occupational physical activity and breast cancer risk in the Upper Cape Cod Cancer Incidence Study. Am J Ind Med 36(2):279-285.
Eyles, J. and S. Birch. 1993. A population needs-based approach to health care resource allocation and planning in Ontario: a link between policy goals and practice. C J Public Health 84:112-117.
McKelvey, W., J.G. Brody, A. Aschengrau, and C.H. Swartz. 2004. Association between residence on Cape Cod, Massachusetts, and breast cancer. Ann Epidemiol 14(2):89-94.
MDPH (Massachusetts Department of Public Health). 1999. Upper Cape Cod Cancer Incidence Review, 1986-1994 Final Report Appendices. Bureau of Environmental Health Assessment Environmental Epidemiology Unit. Boston: Boston University School of Public Health.
MDPH. 2001. Massachusetts Birth Defects, 1999. Bureau of Family and Community Health, Bureau of Health Statistics Research and Evaluation. Boston: Boston University School of Public Health.
MDPH. 2002. Technical Advisors’ 3rd Report (2000-2001). Research on Health and Environmental Exposure Massachusetts Military Reservation, Louise Ryan, Joel Schwarz, Robert Goble, and Dale Hattis. Boston: Harvard School of Public Health.
MDPH. 2003. Cancer incidence and Mortality in Massachusetts 1996-2000: statewide report. Boston: Massachusetts Department of Public Health.
MITRE. 2000. MITRE technical report RF power density exposure at ground level for the PAVE PAWS radar at Cape Cod—questions and answers. MITRE Corporation, Bedford, MA.
Rothman, K.J. and S. Greenland. 1998. Modern Epidemiology. Philadelphia: Lippincott Williams and Wilkins.
US Census Bureau. Census 2000. http://www.census.gov/main/www/cen2000.html (November 2004).
Willett, W.C., B. Rockhill, S.E. Hankinson, D.J. Hunter, and G.A. Colditz. 2000. Epidemiology and nongenetic causes of breast cancer. Pp. 175-220 in Diseases of the Breast, Second Edition. J.R. Harris, M.E. Lippman, M. Morrow, and C.K. Osborne, eds. Philadelphia: Lippincott Williams & Wilkins.
ANNEX 9-1: DATA SOURCES
-
Cancer incidence data from 1986 to 1994 for 24 cancer types in 30 census tracts in upper Cape Cod (Upper Cape Cod Cancer Incidence Review 1986-1994[3])
-
Peak and average PAVE PAWS power density from MITRE (Map4&7)
-
Average PAVE PAWS power density from Broadcast Signal Lab—PAVE PAWS Average Exposure.RMX [Map 8]
-
Digital elevation model (DEM) downloaded from the GeoComm International Corporation (http://gisdatadepot.com/dem [Map 2 & Map 3])
-
Total population in 1990 and 2000 by gender and by age at block group level—Census bureau (web Table QT-P1A & P12) [Map 5 & Table 1]
-
Total population in 2000 by census block in the form of GIS Datalayer from Massachusetts Geographic Information System (http://www.state.ma.us/mgis/cen2000_blocks.htm [Map 9])
-
Poverty status in 1989 by gender and by age—Census bureau (web Table P118) [Figure 2 & Figure 3]
ANNEX 9-2: GEOBUGS CODE
Model association between cancer incidence and MITRE peak exposure controlling for SES
{
# X : exposure
# S : SES
for (i in 1 : N) {
O[i] ~ dpois(mu[i])
log(mu[i]) ← log(E[i]) + alpha0 + alpha1 * X[i] + gamma*S[i]+ b[i]
RR[i] ← exp(alpha0 + alpha1 * X[i] + gamma*S[i]+ b[i])
SIR[i] ← 100*O[i]/E[i]
SIR.smooth[i] ← 100*mu[i]/E[i]
}
# CAR prior distribution for random effects:
b[1:N] ~ car.normal(adj[], weights[], num[], tau)
for(k in 1:sumNumNeigh) {
weights[k] ← 1
}
# Other priors:
alpha0 ~ dflat()
alpha1 ~ dnorm(0.0, 1.0E-5)
gamma ~ dnorm(0.0, 1.0E-5)
tau ~ dgamma(0.0001, 0.0001) # prior on precision
sigma ← sqrt(1 / tau) # standard deviation}


