
E
COMMISSIONED PAPER
A COST-BENEFIT ANALYSIS OF INCREASING CORD BLOOD INVENTORY LEVELS
David H. Howard, Martin Maiers, Craig Kollman, Brent Logan, Loren Gragert, and Michelle Setterholm
INTRODUCTION
In establishing a national cord blood bank program, the Health Resource and Services Administration will have to decide how many cord blood units to place in inventory. The larger the inventory, the greater the likelihood that transplant candidates will match to a stored unit. Processing new cord blood units is costly, however, so the access benefits must be weighed against the storage costs. The purpose of this study is to estimate the benefits and costs associated with increasing the cord blood inventory. We express the results in terms of the incremental cost per life year gained for inventory sizes in the range of 50,000 to 300,000 cord blood units. Creation of a national banking program is partly motivated by a desire to increase access for minority patients, so we also consider the impact of bank size and racial and ethnic composition on disparities in match probabilities between groups.
Previously, several studies have used quantitative models to explore the costs and benefits of increasing the number of marrow donors (Beatty et al., 2000; Kollman et al., 2004) and cord inventory (Sirchia et al., 1999). We build on these analyses by modeling patients’ preferences over adult unre-
lated donor versus cord blood stem cell sources and explicitly modeling the cost structure of a cord blood bank.
PATIENT SURVIVAL TIME
Match Probabilities
Cord blood inventory size affects patient survival times through its impact on the likelihood that a transplant candidate matches a stored unit. The first step in estimating the benefit associated with various inventory levels is to determine the corresponding match probabilities by match level (six of six, five of six, or four of six human leukocyte antigen [HLA] matches [referred to as 6/6, 5/6, and 4/6 matches, respectively]). These were calculated by (1) estimating the population frequency of HLA types by racial/ethnic group (“racial groups” for short, hereafter), based on the distribution of HLA phenotypes in the National Marrow Donor Program registry, (2) calculating separately for each HLA type the likelihood of matching to an adult unrelated donor or cord unit, assuming that the HLA types in the registry and cord bank are the same as in the general population, and (3) summing over HLA types separately for each racial group (Kollman et al. [2004] provide a detailed description of the algorithm). We calculated nationally representative estimates by taking a weighted sum of the racial group-specific probabilities based on the racial distribution of patients conducting searches of the National Marrow Donor Program registry in the second half of 2001, as reported in Kollman et al. (2004). These are shown in Table E-1. Matching is defined at the antigen level for HLA-A and B and at the allele level for HLA-DRB1.
For marrow match probabilities, the model assumes that only a fraction of matched donors will be available and willing to donate, based on historical patterns among each racial group. For cord unit match probabilities, the model uses the cell count distribution of cord units in the National Marrow Donor Program database and the empirical weight distribution of transplant candidates to estimate probabilities for a given minimum cell dose threshold. In the baseline analysis, we assume a threshold of 2.5 × 10⁷ total nucleated cells per kilogram of body weight (TNC/Kg) and that cord units are collected from each racial group in proportion to the number of births among each group in 2002 (Martin et al., 2003). We further assume that transplants occur with one and only one cord unit. In some cases, heavier transplant candidates may receive more than one cord unit to achieve the minimum cell dose, but this is not standard practice.
Table E-1 displays estimated match probabilities for patients ≥20, averaged over weight deciles and racial groups, for cord blood inventories in the range of 50,000 to 300,000 units. Table E-2 displays probabilities for
TABLE E-1 Match Probabilities for Adults Age ≥20
patients <20. Differences in match probabilities between adults and children reflect differences in the underlying weight distributions. Because younger patients are lighter, they are more likely to match to a cord unit with a volume of at least 2.5 × 10⁷ TNC/Kg.
The current inventory of cord units in the United States is about 80,000, but the effective inventory may be much lower because many units were not collected and stored properly. We believe results for a 50,000-unit inventory most closely approximate the current situation. Going from a 50,000-unit inventory to a 300,000-unit inventory increases the likelihood that an adult patient will match to a cord blood unit at 6/6 antigens from 7 to 17 percent, the likelihood of matching on 5/6 antigens from 40 to 65 percent, and the likelihood of matching on 4/6 antigens from 84 to 96 percent.
TABLE E-2 Match Probabilities for Pediatric Patients Age <20
Given that bone marrow transplantation is the more established therapy, one could argue that the appropriate end point is the impact of an increase in inventory size on the marginal likelihood of finding a matched source of stem cells. Rows 8, 11, and 14 of Tables E-1 and E-2 show the impact of increasing inventory size on the proportion of patients who have a 6/6, 5/6, and 4/6 cord unit match but lack a 6/6 adult unrelated donor match, respectively. Moving from a 50,000 to a 300,000 inventory increases the probability of a 5/6 cord match for adults by 7 percentage points and a 4/6 cord match by 8 points. Patients unable to find a perfectly matched (6/6) adult unrelated donor are unlikely to find a perfect 6/6 cord match, regardless of inventory level.
Number of Transplants
Using the match probabilities, we calculated the impact of inventory size on the number of patients who would receive a transplant by match level and transplant type (marrow versus cord). There are several ways to estimate the number of potential transplant candidates. The first is to simply determine the number of patients who initiate formal donor searches with the National Marrow Donor Program. The drawback of this approach is that not all searchers are suitable transplant candidates; many initiate searches early in the course of their disease while they are simultaneously considering other treatment options. The second method is to estimate the number of transplant candidates based on the number of adult related donors. If it is assumed that 30 percent of all transplant candidates have an HLA-matched adult related donor (Kollman et al., 2004) and that there are 3,500 adult related donor transplants annually, then the number of transplant candidates without an unrelated adult donor is 8,200 (= 3,500 × 0.70 ÷ 0.30). We prefer this approach because it is based on transplants that actually occur. We assume that one-third of candidates are age <20 years (hereafter referred to as “pediatric” candidates) and that two-thirds are age ≥20 years (hereafter referred to as “adult”candidates), based on a recent analysis of International Bone Marrow Transplant Registry (2004) data reporting the breakdown of allogeneic marrow transplants by age group (≥20 versus <20).
Many patients will match to both adult unrelated donors and cord units. To estimate the number of cord unit transplants, we need to assume how patients (and their physicians) choose among stem cell sources when multiple matches are available. We start by assuming that search strategies differ between adult and pediatric patients, and then by medical urgency within each of these groups (the time from search to transplant is less for cord blood). Search strategies for adult and pediatric patients are depicted graphically in Figures E-1 and E-2, respectively. These strategies are not literal representations of the search and transplant process. Rather, they attempt to capture probabilistically how transplant candidates arrive at the terminal states. We assume that for pediatric patients 4/6 cord blood transplants are preferred to 5/6 adult unrelated marrow donor transplants. The probability that a pediatric patient matches on 4/6 antigens to a cord unit with a sufficient cell dose for an inventory of 50,000 cord units is very high (>99 percent), so we do not explicitly model the number of pediatric patients who, failing to obtain a 4/6 cord match, seek a 5/6 adult unrelated marrow donor.
We assume that 25 percent of patients are urgent, based on an unpublished National Marrow Donor Program survey of transplant centers. However, the figure may be as high as 40 percent (General Accounting Office
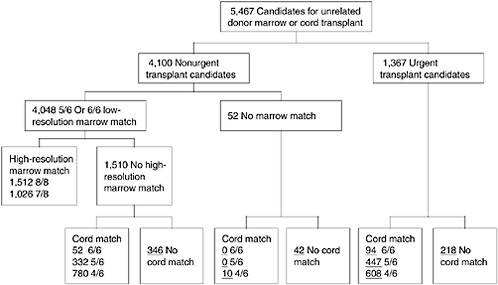
FIGURE E-1 Search strategy for patients age ≥20.
NOTE: Underlined numbers reflect match probabilities for a 50,000 cord unit bank and a minimum cell dose of 2.5 × 10⁷ TNC/Kg. Numbers may not add up to total due to rounding.
2002). As an approximation to the limited options facing urgent patients, we assume they consider cord blood transplants exclusively. The time from search to transplant for cord blood transplants is about one month shorter than for adult unrelated marrow donor transplants (Barker et al., 2002). In reality, urgent patients probably search for both matched cord blood units and adult unrelated marrow donors.
We assume that following an initial low-resolution typing, potential adult unrelated marrow donors undergo a high-resolution typing for the HLA-A, -B, -C, and DR antigens and that adult unrelated donor transplants are considered only if the donor matches to the recipient on at least 7/8 antigens. The probabilities of a 8/8 or 7/8 high-resolution match for HLA-A, -B, -C, and DR conditional on a 6/6 or 5/6 low-resolution match for HLA-A, -B and DR were based on data reported in Flomenberg et al. (2004). For example, the probabilities that a patient has an 8/8 or 7/8 high-resolution match conditional on having a 6/6 low-resolution match are 56 and 26 percent, respectively.
Not all transplant candidates who theoretically match to a bone marrow donor or cord blood unit undergo transplantation. Some never initiate a donor or cord blood search, some die before the transplant occurs, and others select alternative therapies. We have little information with which to estimate the relevant probabilities from historical practice. Instead, we cali-
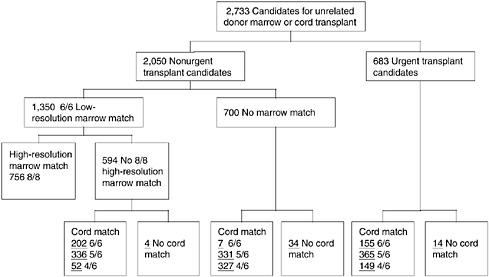
FIGURE E-2 Search strategy for patients age <20.
NOTE: Underlined numbers reflect match probabilities for a 50,000 cord unit bank and a minimum cell dose of 2.5 × 10⁷ TNC/Kg. Numbers may not add up to total due to rounding.
brate these probabilities so that with a 50,000-cord blood-unit inventory the model yields estimates of total bone marrow and total cord blood transplants that are close to the actual figures of around 2,000 bone marrow and 600 cord blood transplants, two-thirds of which occur in pediatric patients. The corresponding transplant probabilities, representing the likelihood of transplant conditional upon obtaining a suitable match, are: 65 percent for marrow matches (adult and pediatric), 10 percent for adult cord matches, and 20 percent for pediatric cord matches. We do not allow transplant probabilities to vary by match strength. Realistically, patients who match to a cord unit on 6/6 antigens are probably more likely to pursue transplantation than patients who match on only 4/6 antigens. However, even with constant transplant probabilities, our estimated distribution of cord transplants by match level for an inventory of 50,000 units is similar to the empirical distribution (Institute of Medicine, 2005).
The numbers in Figures E-1 and E-2 indicate the numbers of patients through the search process for the case of a cord inventory of 50,000 units. For example, of the 5,467 adult transplant candidates without an adult related donor, 4,100 are nonurgent and 4,048 match on at least 5/6 antigens to an adult unrelated donor at low resolution. Of these, 1,512 match at 8/8 antigens and 1,026 match at 7/8 antigens at high resolution, 1,164 do not match at high resolution but do match to a cord unit at 6/6 antigens (52), 5/6 antigens (332), or 4/6 antigens (780), and 346 do not match to an
TABLE E-3 Projected Number of Annual Transplants by Cord Blood Inventory Level
adult unrelated donor or a cord unit. Note that transplant centers use varying criteria for what constitutes an acceptable match, and so these figures may differ from actual experience of a cohort of patients at a specific center. Also note that not all of the patients who match to a marrow donor or cord unit will undergo transplantation. For example, of the 1,512 adult patients matching on 8/8 antigens to a marrow donor, we assume that 983 (= 1,512 × 0.65) will be transplanted.
Table E-3 displays the number of patients who would receive cord blood transplants at various cord blood inventory levels. The number of patients receiving bone marrow transplants does not vary, but the number undergoing transplantation with cord blood increases from 617 with an inventory of 50,000 units to 670 with an inventory of 300,000 units. Increasing inventory from 50,000 to 300,000 units also improves match quality; the number of 6/6-matched cord blood transplants increases by 84 and the number of 5/6 cord transplants increases by 57, but the number of
4/6 cord transplants decreases by 88. On net, there are 53 additional transplants.
Life Years Gained
Using data from the International Bone Marrow Transplant Registry on adult unrelated bone marrow transplants occurring between 1988 and 1996 (Flomenberg et al., 2004), we calculated 5-year survival rates by match level and age group. The results are as follows: patients ≥20, 8/8 match, 36 percent [95 percent cumulative incidence (CI): 32 percent, 40 percent]; patients ≥20, 7/8 match, 25 percent [95 percent CI: 20 percent, 30 percent]; patients <20, 8/8 match, 49 percent [95 percent CI: 42 percent, 56 percent]; patients <20, 8/8 match, 41 percent [95 percent CI: 33 percent, 49 percent].
We use two different scenarios to model the degree to which survival rates for cord transplants vary by match level. In the first, we assume that cord blood transplant survival rates vary by match level. Specifically, we assume that 5 year survival rates for 6/6 and 5/6 cord transplants are equal to those for 8/8 and 7/8 marrow transplants, respectively. This assumption is supported by several recent studies of long-term survival rates in adult recipients (Laughlin et al., 2004; Rocha et al., 2004). We assume that survival rates for 4/6 cord transplants are 20 percent in adults and 33 percent in children, based on the relative survival rates reported in the Statistical Report (Institute of Medicine, 2005). In the second scenario, we assume that survival rates for cord transplants do not vary by match level. Instead, we assume that survival rates for all cord transplants are equal to the age group-specific 7/8 marrow transplant rate. These scenarios represent extreme cases. We further assume that the 5 year survival rate for patients who do not undergo transplantation is 15 percent, based on data reported in Appelbaum and Kopecky (1997).
We computed using the International Bone Marrow Transplant Registry data the average survival time for patients who die within 5 years. We assume that average survival time for patients who die within 5 years but do not receive a transplant is 6 months. For patients who live at least 5 years, we computed survival time based on mortality rates in U.S. life tables (Arias, 2004), assuming that adults are transplanted at age 40 and children at age 5 and that relative mortality rates for transplant patients are five times higher than in the general population (Socié et al., 1999) from year 5 through year 20 post-transplant and normal thereafter. Using these conditional survival times and the survival rates, we computed unconditional survival times by transplant and match type. Results are displayed in Table E-4.
TABLE E-4 Life Years Gained from Marrow and Cord Transplantation
We computed total life years for each inventory level (including life years for patients receiving unrelated donor marrow transplants and patients who do not receive any transplant) by multiplying the survival times in Table E-4 by the numbers of patients in each category from Table E-3. Results are displayed in Figure E-3. Results differ by scenario. Total life years start out higher for scenario 2, but increase more rapidly under scenario 1. Increasing the cord blood inventory from 50,000 to 300,000 units is associated with a gain of 1,039 life years under scenario 1 and 259 life years under scenario 2. The benefit in life years of expanding cord blood inventory size primarily reflects (1) a greater number of transplants among urgent patients, (2) a greater number of transplants among patients who match to an unrelated marrow donor on 6/6 or 5/6 antigens at low resolution but have more than one mismatch at high resolution, and in scenario 1 only (3) increased longevity among patients who are able to obtain a 6/6 or 5/6 cord match with a large inventory but would receive a poorer match at a low inventory level.
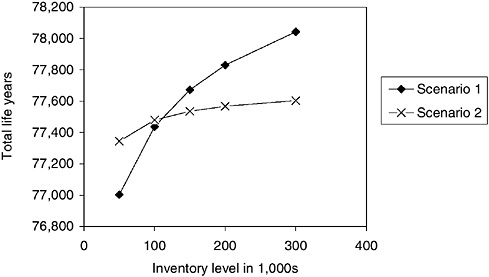
FIGURE E-3 Total life years for 8,200 transplant candidates as a function of cord inventory.
NOTE: Total life years includes survival time following cord and unrelated marrow transplantation and survival time for patients who do not receive transplants of either type. Scenario 1: Survival rates vary by cord match level. Scenario 2: Survival rates do not vary.
COSTS
The Cost Model
A cord blood bank will incur costs for the collection and processing of new cord blood units, the storage of existing units, and administration. Each year, the bank must collect units to replace transplanted units, T, and units discarded from the inventory because they have reached the “expiration date” of y years. A portion of the collected units, λ, are discarded prior to storage because they do not meet the minimum standards. Thus, many more units must be collected than ultimately end up in storage. The total number of units that must be collected, U, to ensure a stable inventory of size N is:
[1]
Note that the number of transplanted units is itself a function of the inventory level, as shown in Table E-2.
By letting cPS represent the cost of processing a stored unit, cPD the cost
of processing a unit that is discarded prior to storage (so that cPD < cPS), cS the annual cost of storing a unit, and A the annual cost of administration, the annual costs for a cord blood bank are:
[2]
The bank must incur a one-time expense for the collection of units to bring the current inventory, N0, up to the target level of N:
[3]
We assume that collection occurs instantaneously, although, realistically it would take a few years to reach inventory levels greater than 100,000 units.
For purposes of calculating the incremental cost per life year gained of a cord bank, we calculate total costs, TC, as the sum of annual costs, annuitized start-up costs, and the direct costs of transplantation, cT:
[4]
where r is the interest rate. The incremental cost-effectiveness ratio, ICER, or the incremental cost per life year gained, associated with increasing inventory from N to N′ is then:
[5]
where LY(·) represents life years as a function of the inventory, as shown in Figure E-3.
Another quantity of interest is the per-cord unit fee, f, that the bank must charge to break even, defined as the fee such that the net present value of revenues plus an initial endowment from Congress, E, minus the net present value of costs equals 0:
[6]
The fee depends on inventory size through T, C0, and C.
Parameter Values
The goal of the analysis is to examine how transplants and costs vary with inventory size, N. Parameter values are summarized in Table E-5 and described below in order of appearance in the model.
TABLE E-5 Cost Model Parameters
|
Parameter |
Description |
Value |
Unit |
|
Inventory parameters |
|||
|
N0 |
Initial inventory |
50,000 |
cord units |
|
λ |
Discard rate |
0.50 |
proportion |
|
y |
Length of storage before discard |
20 |
years |
|
Cost parameters |
|||
|
cPS |
Cost of initial processing, stored unit |
$1,500 |
dollars |
|
cPD |
Cost of initial processing, discarded unit |
$500 |
dollars |
|
cS |
Cost of storage, annual |
$50 |
dollars |
|
cT |
Cost of transplantation |
$220,000 |
dollars |
|
E |
Endowment |
$9,000,000 |
dollars |
|
A |
Annual administrative cost |
$1,000,000 |
dollars |
|
r |
Discount rate |
0.03 |
proportion |
Discard Rate (λ)
In the Cord Blood Banking and Transplantation (COBLT) study 47 percent of collected units were discarded prior to storage. Thus, we assume a discard rate of 50 percent. However, several Institute of Medicine committee members suggested that the discard rate could be much higher than 50 percent, possibly as much as 90 percent. In particular, we would expect the discard rate to increase if the committee recommends a higher minimum transplantable cell dose.
Storage Length (y)
Little is known about the durability of stored cord blood units. In their analysis of Milano Cord Blood Bank costs, Sirchia et al. (1999) assume that units are discarded after 10 years. However, committee members indicated this figure is probably too conservative and that units can be stored for longer periods. In the absence of definitive evidence, we assume that units are discarded after 20 years.
Collection and Storage Costs (cPS, cPD, cS)
We assume that cPS = $1,500, cPD = $500, and cS = $50. These figures are based on an informal survey by Institute of Medicine staff of public and private blood banks. Note that cPD is an average processing cost for discarded units and includes units that are discarded prior to HLA-typing as well as those that undergo HLA-typing prior to discard. More stringent
processing requirements will probably lead to increased costs, so we have assumed processing costs toward the higher end of the range reported. We have not adjusted for the impact of economies of scale on the collection costs incurred by a national bank.
Cost of Transplantation (cT)
We assume that transplanted patients incur costs of $220,000 over a one year period, based on figures reported in Lee et al. (1998). We lack the data to compute net lifetime costs for these patients.
Administrative Costs (A)
The collection and storage cost estimates from the blood bank survey are average costs and thus include overhead costs. However, we assume that a national cord bank will incur additional administrative costs for oversight, research, and analyses such as this one. We assume that A = $1,000,000.
Discount Rate (r)
We assume that r = 0.03, based on the recommendation of the Panel on Cost-Effectiveness in Medicine and Health (Gold et al., 1996).
Initial Inventory (N0)
Based on data listed on www.bmdw.org, there are approximately 80,000 cord blood units currently in storage in the United States. However, the quality of these units is uncertain because many were processed and stored using protocols that would not meet the standards likely to be adopted by the committee. Thus, the existing inventory is below 80,000 units, although it is difficult to say by how much. For this analysis, we assume that the initial, usable inventory is 50,000 units.
Initial Endowment (E)
Congress has appropriated $9,000,000 for establishing a national cord bank.
Cost Estimates
Table E-6 displays the results of the cost analysis. We estimate that the break-even fee for an inventory level of 50,000 units is $15,336. This figure
TABLE E-6 Cost Estimates by Inventory Level
|
|
Cord Inventory |
|||||
|
|
50,000 |
100,000 |
150,000 |
200,000 |
300,000 |
|
|
Cord blood transplants |
617 |
643 |
655 |
662 |
670 |
|
|
Annual cord collection (U) |
6,234 |
11,287 |
16,310 |
21,324 |
31,340 |
|
|
Costs (millions) |
||||||
|
Annual bank costs (C) |
$10 |
$17 |
$25 |
$32 |
$47 |
|
|
Direct treatment costs (cTN) |
$136 |
$142 |
$144 |
$146 |
$147 |
|
|
Start-up costs (C0) |
$0 |
$100 |
$200 |
$300 |
$500 |
|
|
Total costs (TC) |
$146 |
$162 |
$175 |
$187 |
$210 |
|
|
Break-even per cord fee (f) |
$15,336 |
$31,107 |
$46,613 |
$62,014 |
$92,675 |
|
closely matches what public banks currently charge for a transplanted unit. If a national cord bank maintained an inventory of 150,000 units, the break-even fee could easily triple. Total costs range from $146 million for an inventory of 50,000 units to $210 million for an inventory of 300,000 units. Direct transplant costs account for at least 70 percent of total costs in all of the inventory scenarios.
INCREMENTAL COST-EFFECTIVENESS
Table E-7 displays the incremental cost per life year gained for each inventory level and scenario. For example, under scenario 1, an increase in the inventory from 200,000 to 300,000 units is associated with an additional cost of $23 million and a gain of 212 life years. The incremental cost per life year gained is $106,948 = ($23 million ÷ 212). The difference between scenarios 1 and 2 reflects the fact that in scenario 1 much of the gain in life years from expanding inventory is due to a shift toward better-quality cord blood matches among transplanted patients, rather than a greater absolute number of transplants. Failing to take account of how survival rates vary by match level ignores the survival gains from this first effect.
EQUITY
Equity between racial groups is an important motivation behind the establishment of a national cord bank. We examine the impact of increasing cord inventory on equity by comparing match probabilities and life years gained per patient between African Americans and Caucasians. For
TABLE E-7 Cost per Life Year Gained as a Function of Cord Inventory
|
|
Cord Inventory |
||||
|
|
50,000 |
100,000 |
150,000 |
200,000 |
300,000 |
|
Total costs (millions) |
|||||
|
Total |
$146 |
$162 |
$175 |
$187 |
$210 |
|
Incremental |
NA |
$16 |
$13 |
$12 |
$23 |
|
Scenario 1: Cord survival varies by match level |
|||||
|
Life years gained |
|||||
|
Total |
77,003 |
77,437 |
77,672 |
77,830 |
78,042 |
|
Incremental |
NA |
434 |
234 |
158 |
212 |
|
Incremental cost per life year |
NA |
$37,667 |
$55,873 |
$75,953 |
$106,948 |
|
Scenario 2: Cord survival does not vary by match level |
|||||
|
Life years gained |
|||||
|
Total |
77,344 |
77,479 |
77,536 |
77,568 |
77,603 |
|
Incremental |
NA |
135 |
56 |
32 |
36 |
|
Incremental cost per life year |
NA |
$121,231 |
$232,680 |
$376,385 |
$639,402 |
this analysis, we use the scenario 1 assumptions for cord blood survival rates. Increasing inventory size reduces the absolute difference between groups in the likelihood of obtaining a 4/6 cord blood match from 20 to 8 percentage points. Life years gained per patient are lower for African Americans at all inventory levels, but the incremental gains from increasing inventory size are larger.
The baseline model assumes that cord units are collected from racial groups in proportion to the number of births within each group. Other collection strategies ought to be considered, however, in light of the goal of reducing disparities. We re-estimated match probabilities under the assumption that cord unit collections from non-Caucasian donors are doubled, with collections among Caucasian donors reduced proportionately. Results are shown in the bottom half of Table E-8. Compared to a proportional collection strategy (i.e., the baseline model), overcollection increases match probabilities among African Americans and decreases match probabilities among Caucasians. The same pattern holds for life years gained per patient. In general, though, differences in match probabilities and life years are surprisingly small. A more thorough analysis of the trade-offs entailed in various collection strategies awaits future research.
TABLE E-8 Match Probabilities by Race
SENSITIVITY ANALYSES
We re-estimated incremental cost per life years gained and racial differences in match probabilities under the following assumptions, using scenario 1 assumptions for cord blood survival rates.
-
Assume 40 percent of patients are urgent (instead of 25 percent).
-
Assume that the 5 year survival rate for patients who do not receive transplants is 30 percent.
-
Assume cord blood collections from non-Caucasian donors are doubled, with collections among Caucasian donors reduced proportionately (as discussed in the previous section).
Results are displayed in Table E-9. In general, cost-effectiveness ratios from the sensitivity analyses are qualitatively similar to those from the scenario 1 baseline analysis.
TABLE E-9 Sensitivity Analyses
CONCLUSION
The decision about how many cord units to place in inventory entails weighing the benefits in terms of increased transplants and life years against costs. The degree to which cord blood transplant survival rates vary by match level is a key determinant of the benefits of storing additional cord blood units. In the absence of definitive evidence, we estimated cost-effectiveness ratios under two scenarios, representing extreme cases. In the first, cord transplant survival rates vary by match level, mirroring differences in marrow transplant survival rates. The corresponding cost per life year of increasing inventory from 50,000 to 100,000 units is $37,667. In the second, survival rates do not vary by match level. The corresponding cost per life year of increasing inventory from 50,000 to 100,000 units is $121,231. Under either scenario, the fee charged to patients and insurance companies for each transplanted cord unit will have to rise substantially for a national cord bank to break even at larger inventory levels.
Estimates of the economic value of a life year vary widely, from $24,777 to $428,286 (Hirth et al., 2000). However, for purposes of gauging the economic benefits of health interventions, estimates in the range of $100,000 to $160,000 are used most often (Cutler and McClellan, 2001; Vigdor, 2003). Based on these values, this analysis suggests that it is cost-effective to increase the cord blood inventory size beyond current levels. For example, the cost per life year gained of increasing inventory from 50,000 to 100,000 units under scenario 1, $37,667, is well below the $160,000 threshold. However, better estimates of long-term survival with cord blood transplants are necessary to properly evaluate the cost-effectiveness of largescale increases in cord blood inventory levels.
There is a large degree of uncertainty about most of the parameters in this model, and even those we are fairly confident about are likely to change over time as technology evolves. Many of our assumptions will lead us to overestimate the benefits of increasing cord blood inventory. For example, we assume that survival rates are the same for urgent and nonurgent patients when, realistically, urgent patients will experience poorer post-transplant outcomes. Also, we ignore the availability of cord blood from banks outside the United States. Other assumptions may lead us to underestimate the benefits of storing cord blood. For example, the estimates of the probabilities of a 8/8 or 7/8 high-resolution match for HLA-A, -B, -C, and DR conditional on a 6/6 or 5/6 low-resolution match for HLA-A, -B, and DR were based on a study of transplanted patients (Flomenberg et al., 2004). A sample that also included nontransplanted patients would probably yield lower estimates, thus increasing the role for cord blood as an alternative source of transplantable stem cells. Also, we do not account for the fact that larger inventories will increase the number of patients transplanted with
higher cell volumes, leading to improved outcomes at any given level of HLA matching. Given the uncertainty we face, this analysis should best be seen as a template for an ongoing study of cord bank inventory to be continually updated as circumstances change and new information becomes available.
We thank Tanya Warren of the Center for International Blood & Marrow Transplant Research and Shira Fischer of the Institute of Medicine for providing valuable assistance with this analysis
REFERENCES
Appelbaum FR, Kopecky KJ. 1997. Long-term survival after chemotherapy for acute myeloid leukemia. The experience of the Southwest Oncology Group. Cancer. 80(Suppl.): 199–204.
Arias E. 2004. United States life tables, 2001. National Vital Statistics Reports; Volume 52, Number 14. Hyattsville, MD: National Center for Health Statistics.
Barker JN, Krepski TP, DeFor TE, Davies SM, Wagner JE, Weisdorf DJ. 2002. Searching for unrelated donor hematopoietic stem cells: Availability and speed of umbilical cord blood versus bone marrow. Biology of Blood & Marrow Transplantation. 8(5): 257–260.
Beatty PG, Boucher KM, Mori M, Milford EL. 2000. Probability of finding HLA-mismatched related or unrelated marrow or cord blood donors. Human Immunology. 61: 834–840.
Cutler DM, McClellan M. 2001. Is technological change in medicine worth it? Health Affairs. 20: 11–29.
Flomenberg N, Baxter-Lowe LA, Confer D, Fernandez-Vina M, Filipovich A, Horowitz MM, Hurley C, Kollman C, Anasetti C, Noreen H, Begovich A, Hildebrand W, Petersdorf E, Schmeckpeper B, Setterholm M, Trachtenberg E, Williams T, Yunis E, Weisdorf D. 2004. Impact of HLA class I and class II high-resolution matching on outcomes of unrelated donor bone marrow transplantation: HLA-C mismatching is associated with a strong adverse effect on transplantation outcome. Blood. 104(7): 1923–1930.
General Accounting Office. 2002. Bone Marrow Transplants. GA-03-182.
Gold MR, Siegel, JE, Russell LB, Weinstein MC. 1996. Cost-effectiveness in health and medicine. New York, NY: Oxford University Press.
Hirth RA, Chernew ME, Miller E, Fendrick M, Weissert WG. 2000. Willingness to pay for a quality-adjusted life year: In search of a standard. Medical Decision Making. 20: 332–342.
Institute of Medicine. 2005. From Accord to Discord: Establishing a National Cord Blood Stem Cell Bank Program. Statistical Report. Meyer EA, Gebbie EM, eds. Washington DC: The National Academies Press.
International Bone Marrow Transplant Registry. Current use and outcome of blood and marrow transplantation 2004. [Online] Available: http://www.ibmtr.org/newsletter/sums_update.html. [Accessed: December, 2004].
Kollman C, Esteban A, Baitty T, Beatty P, Chakraborty T, Christiansen C, Hartzman RJ, Hurley CK, Milford E, Nyman J, Smith T, Switzer G, Wada R, Setterholm M. 2004. Assessment of optimal size and composition of the U.S. national registry of hematopoietic stem cell donors. Transplantation. 78(1): 89–95.
Laughlin MJ, Eapen M, Rubinstein P, Wagner JE, Zhang M, Champlin RE, Stevens C, Barker JN, Gale RP, Lazarus HM, Marks DI, van Rood JJ, Scaradouvou A, Horowitz MM. 2004. Outcomes after transplantation of cord blood or bone marrow from unrelated donors in adults with leukemia. New England Journal of Medicine. 22: 2265–2275.
Lee SJ, Anasetti C, Kuntz KM, Patten J, Antin JH, Weeks JC. 1998. The costs and cost-effectiveness of unrelated donor bone marrow transplantation for chronic phase chronic myelogenous leukemia. Blood. 92: 4047–4052.
Martin JA, Hamilton BE, Sutton PD, Ventura SJ, Menacker F, Munson ML. 2003. Births: Final Data for 2002. National Vital Statistics Reports; Volume 52, Number 10. Hyattsville, MD: National Center for Health Statistics.
Rocha V, Labopin M, Sanz G, Arcese W, Schwerdtfeger R, Bosi A, Jacobsen N, Ruutu T, de Lima M, Finke J, Frassoni F, Gluckman E, Acute Leukemia Working Part of European Blood and Marrow Transplant Group, Eurocord-Netcord Registry. 2004. Transplants of umbilical-cord blood or bone marrow from unrelated donors in adults with acute leukemia. New England Journal of Medicine. 22: 2276–2285.
Sirchia G, Rebella S, Tibaldi S, Lecchi L. 1999. Cost of umbilical cord blood units released for transplantation. Transfusion. 39: 645–650.
Socié G, Veum Stone J, Wingard JR, Weisdorf D, Henslee-Downey PJ, Bredeson C, Cahn JY, Passweg JR, Rowlings PA, Schouten HC, Kolb HJ, Klein JP. 1999. Long-term survival and late deaths after allogenic bone marrow transplantation. New England Journal of Medicine. 341(1): 14–21.
Vigdor ER. 2003. Coverage does matter: The value of health forgone by the uninsured. In: Committee on the Consequences of Uninsurance. Hidden Costs, Value Lost: Uninsurance in America. Washington DC: The National Academies Press.


