
F
COMMISSIONED PAPER
HLA OVERVIEW
An analysis prepared for the Institute of Medicine, of the National Academies, for the Committee on Establishing a National Cord Blood Stem Cell Bank.
Carolyn Katovich Hurley, Ph.D.
Department of Oncology
Georgetown University Medical Center
Washington, DC
January 3, 2005
KEY OBSERVATIONS ON HLA AND HEMOTOPOIETIC STEM CELL TRANSPLANTATION
The following bulleted list is a summary of key facts about HLA that are described in more detail in the paragraphs below.
-
Major histocompatibility complex encodes proteins, HLA molecules, that control tissue rejection.
-
The genes that encode HLA molecules are highly polymorphic and the majority of nucleic acid substitutions alter the protein sequences in the key functional regions of the resultant HLA molecules.
-
Even single amino acid differences between HLA proteins can have a profound effect on their ability to present antigen, interact with T lymphocytes, and stimulate allorecognition (transplant rejection or graft vs host disease).
-
The frequencies of specific HLA alleles and haplotypes (alleles on one chromosome) differ in different racial/ethnic groups but approximately two-thirds of the alleles and most theoretical haplotypes are rare.
-
HLA typing uses either DNA-based methods to define which potential alleles are carried or serology to define which proteins are expressed by an individual.
-
The ability of DNA-based typing to identify alleles varies depending on the method and reagents used. Typing of new volunteers for a registry is usually at low to intermediate resolution, narrowing down the potential alleles carried by an individual. Typing of a patient for transplant usually defines specific alleles carried by the patient. This is a newer method, and an increasing number of volunteer donors are typed by these methods.
-
Serologic typing is low resolution; it does not define which of many alleles might be carried by an individual. Large numbers of volunteer donor typings on registries were obtained with this method.
-
-
Seventy percent of patients with fatal blood diseases treated with hematopoietic stem cell transplant require an unrelated donor and are served by registry and cord blood banks around the world.
-
A registry/bank must possess sophisticated algorithms for storing and matching to address the complexity of HLA assignments received on volunteer donors/cord blood units. Quality control of typing is also critical.
-
While transplant centers differ in their definition of a “match,” the National Marrow Donor Program, has recommended matching for alleles at 4 HLA loci, HLA-A, -B, -C, -DRB1. When possible, DQB1 matching may provide additional benefit.
-
The average patient searching the >5 million NMDP registry has an 85 percent chance of finding a 6 of 6 antigen match. Of the 6 of 6 antigen matches undergoing transplant, the probability of finding a 6 of 6 allele match is about 72 percent, a 10 of 10 allele match is about 50 percent, and a 12 of 12 match is 11 percent. The chance of finding a 6 of 6 antigen match for minorities is lower: 65 percent for an African American patient, and probability of allele matching has not yet been evaluated.
-
The probability of match depends on allele and haplotype frequencies.
-
Registries should possess the ability to evaluate the HLA characteristics of the database to improve knowledge of the HLA system and to enhance their ability to identify suitable donors for all patients.
THE HLA SYSTEM
MHC-Encoded HLA Proteins
In humans, proteins that controlled tissue compatibility were first detected on the surface of white blood cells using human-derived antibodies and were named human leukocyte antigens (HLA)(4, 13, 39, 76). Genes encoding these cell surface molecules are located in a cluster on chromosome 6 named the major histocompatibility complex (MHC) (Figure F-1). Two types of MHC-encoded (or HLA) molecules have been described, class I and class II. Class I molecules are expressed on the surface of essentially all nucleated cells. Humans express three different class I molecules: HLA-A, HLA-B, HLA-C. The class I molecules each consist of a single polypeptide encoded within the MHC, which associates with beta 2 microglobulin encoded on another chromosome (5). Class II molecules are expressed on the surface of cells of the immune system and they can be induced on some other cell types. Humans express three different class II molecules, HLA-DR, HLA-DQ, HLA-DP. Each class II molecule is comprised of an alpha and a beta polypeptide encoded within the MHC.
Although the class I and class II molecules are composed of different polypeptide chains, they assume a very similar structure on the cell surface. The amino terminal residues of the MHC-encoded polypeptides form two alpha helices and a beta sheet, creating a groove that binds peptides. It is this region of the HLA molecule that performs the functions attributed to these proteins (5).
Antigen Presentation Function
The normal role of MHC molecules is to bind short peptides within their antigen binding grooves and to carry these peptides to the cell surface for recognition by T lymphocytes (40, 41). The peptides are found within the endoplasmic reticulum (endogenous peptides, class I) or in the endocytic pathway (exogenous peptides, class II) and derive from the degradation of normal cellular proteins or from any pathogens encountered by the cell. T cell recognition of peptides from pathogens or malignant cells triggers a cellular immune response. T lymphocytes usually ignore self peptides bound to an MHC molecule.
Each MHC molecule binds a single peptide for transport to the cell surface. The peptides that bind to a particular MHC molecule must share common characteristics to allow the peptide to “fit” within the antigen binding cleft of the MHC molecule. Thus, only a subset of peptides are bound by the set of MHC molecules expressed by an individual. Since only a subset of peptides from any given pathogen will be bound by MHC and
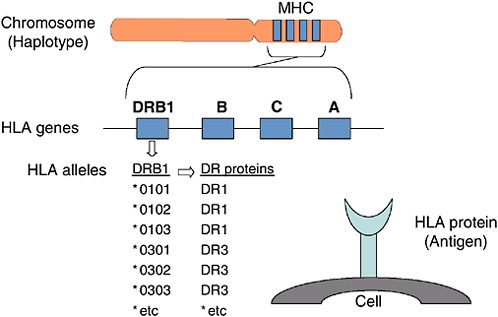
FIGURE F-1 Human histocompatibility genes.
targeted for T cell recognition, individuals may vary in their ability to mount immune responses to pathogens depending on the MHC molecules that they express (11).
HLA Genes
The genes for the HLA-A, -B, -C, -DR, -DQ, and -DP molecules are found next to one another within the MHC on chromosome 6 (68). The alpha (or heavy) chains of the class I molecules are encoded in the MHC; the second class I polypeptide chain, beta-2 microglobulin, is encoded on another chromosome. The genetic information needed to make a class II molecule is found in two different genes, a class II A (alpha) and a class II B (beta) gene. For example, a DQA1 gene and a DQB1 gene together provide the information needed to make a DQ molecule. Other class II A and B gene pairs include: DPA1 and DPB1, and DRA and DRB1. Some versions of chromosome 6 carry a second DRB gene, DRB3, DRB4, or DRB5. Its product can also associate with DRA to form a second DR molecule. Thus some individuals carry a copy of chromosome 6 that encodes two different DR molecules.
TABLE F-1 Alleles Identified at Each HLA Locus as of January 2005 (37)
|
Gene |
Alleles |
Gene |
Alleles |
Gene |
Alleles |
Gene |
Alleles |
|
A |
338 |
DRA |
3 |
DRB4 |
13 |
DQB1 |
59 |
|
B |
617 |
DRB1 |
383 |
DRB5 |
18 |
DPA1 |
22 |
|
C |
179 |
DRB3 |
41 |
DQA1 |
28 |
DPB1 |
111 |
HLA Alleles
HLA loci are the most polymorphic known in man (37). Several hundred alleles have been defined at some MHC-encoded loci (e.g., HLA-A, -B, -DRB1) (Figure F-1, Table F-1). The majority of these alleles carry nucleotide substitutions that change the amino acid sequence of the resultant protein which alters the antigen binding groove and T cell receptor contact residues of the MHC molecule (5). The extensive repertoire of alleles is likely due to the evolution of antigen presenting diversity at the level of the human population (46, 81).
The majority of the polymorphism is hypothesized to have arisen by mutation followed by nonreciprocal exchange of short polymorphic regions among alleles. The latter process, referred to as gene conversion, spread the variations in nucleotide sequence among alleles. As a result, the HLA alleles are patchworks of polymorphic sequences, each sequence shared by some of the other alleles at the locus, embedded in a conserved framework (46).
HLA Haplotypes
Because the HLA genes are clustered on chromosome 6, the alleles on one chromosome are usually inherited as a haplotype. Any two children in a family have a one in four chance of receiving the same two chromosomes from their parents. Children receiving the same chromosome from one parent, but a different chromosome from the other parent, are haploidentical.
The two chromosomes carrying the HLA genes sometimes exchange gene segments to “reshuffle” the HLA-A, -B, -C, -DR, -DQ, and -DP allele combinations that make up haplotypes. The frequency of recombination across the MHC from HLA-A to HLA-DPB1 is 2 to 2.5 percent, although recombination is concentrated in just a few segments in that region (e.g., recombination occurs between B and DRB loci but is unusual between DR and DQ loci) (12).
An HLA typing result provides a genotype (HLA alleles carried) or
phenotype (HLA antigens expressed) but doesn’t identify which alleles are linked together on the chromosome as a haplotype. The only way to know for sure is through family segregation analysis. When family data are not available, the EM algorithm has been used to predict haplotypes (45,52).
When two or more genes are on the same chromosome, they are said to be linked. When alleles of linked genes occur in haplotypes more frequently than would be expected on the basis of chance alone, those genes are said to be in linkage disequilibrium. The HLA gene complex is in linkage disequilibrium (7, 10). Apparently high disequilibrium across the DR-DQ subregion coupled with a lack of recombination have resulted in specific associations between DQA1 and DQB1 alleles and between DRB1 and DQ alleles.
These associations may differ among individuals of different racial/ethnic backgrounds. At the level of class I–class II associations, the best known example of linkage disequilibrium is the HLA-A1, -Cw7, -B8, -DR3, -DR52, -DQ2 haplotype, which occurs approximately four times more frequently than would be expected by chance. It is thought that combinations such as this one (often called extended haplotypes) account for at least 30 percent of HLA allele combinations in whites.
Allele and Haplotype Frequencies
The frequencies of HLA alleles and haplotypes found in individuals differ among ethnic/racial groups (9,38,43,77). Some alleles and haplotypes are common to several populations; others may be predominantly confined to one particular population group. Most of the alleles are rarely observed. For example, in the United States, DRB1*03 (or DR3) is carried by 10–23 percent of four U.S. population groups (Table F-2) (77). The allele DRB1*0301 is common to most population groups, but DRB1*0302
TABLE F-2 DRB1*03 Allele Frequencies in Various U.S. Populations
|
DRB1*03 allele |
U.S. Whites |
African Americans |
U.S.Hispanics |
Asian Americans |
|
DRB1*0301 |
100% |
54% |
83% |
98% |
|
DRB1*0302 |
|
46% |
15% |
1% |
|
DRB1*0304 |
|
|
|
1% |
|
DRB1*0305 |
|
|
1% |
|
|
DRB1*0307 |
|
|
1% |
|
|
DRB1*0316 |
|
|
1% |
|
|
Other DRB1*03 |
|
|||
|
Frequency DRB1*03 |
23% |
25% |
17% |
10% |
|
NOTE: The 22 other DRB1*03 alleles not found are present at <1 percent of the population (77). |
||||
is found primarily in the African American population. Most of the 28 DRB1*03 alleles (22 out of 28, 79 percent) were not observed in the testing, suggesting that they will be found in less than 1 percent of the population.
The frequencies of HLA haplotypes found in individuals differ among ethnic/racial groups. Some haplotypes are common to several populations; others may be predominantly confined to one particular population group. Most of the theoretical haplotypes are rarely observed. The most common haplotype in whites (A1,B8,DR3) is the second most frequent haplotype in African Americans and the third most frequent haplotype in Latinos, but it is the 54th most frequent haplotype in Asian Americans (52). It is likely that not all potential haplotypes will be found. When large databases of HLA typed individuals are analyzed, only a small percent of potential HLA phenotypes are found. Using serologic assignments from the National Marrow Donor Program, of the predicted 19,536,660 HLA-A, -B, -DR phenotypes, only 1.6 percent were observed (52).
Information of the frequencies of specific alleles and haplotypes (defined at allele level) in specific populations is limited (72). Populations have been studied through the International Histocompatibility Workshops, but the typing methods and resolution of testing have been inadequate to detect the full extent of HLA diversity (38, 42). Lack of allele level data seriously impacts our ability to predict the probability of finding an allele matched donor for patients and our ability to determine the most effective size for a registry or bank (44, 45).
Understanding common haplotypes or allele associations is useful for predicting which alleles are most likely to be present in donors who have only low resolution typing information and no family data to define haplotypes. For this reason, information on the ethnic background of the volunteer donors is often provided in registries and umbilical cord blood banks.
TISSUE TYPING
Clinical Testing and Quality Control
Testing to identify HLA allelic differences among individuals is classified as a high complexity assay by Clinical Laboratory Improvement Amendments (CLIA) guidelines (http://www.fda.gov/cdrh/CLIA/categorization.html). The complexity arises from the need to detect multiple loci, the similarity among loci and alleles, the complex nature of the polymorphism (multiple polymorphic motifs shared among alleles define an allele), and the continuing discovery of new alleles. HLA testing is routinely carried out by laboratories using either commercial and/or “home-made” reagents.
The American Society for Histocompatibility and Immunogenetics (ASHI), the European Federation for Immunogenetics (EFI) and other orga-
nizations have standards for DNA-based HLA typing and an accreditation process (75). For example, extensive guidelines for quality control and quality assurance related to all stages of DNA-based HLA testing are described in the ASHI Standards for HLA Testing (ASHI, http://www.ashihla.org) (1). Additional ASHI guidelines apply for laboratories performing high-volume (>50,000 tests per year) HLA testing (i.e., large-scale registry typing). The ASHI program has accredited over 200 histocompatibility laboratories. The Health Care Financing Administration (HCFA), Joint Commission on Accreditation of Healthcare Organizations (JCAHO), National Marrow Donor Program (NMDP), SouthEastern Organ Procurement Foundation (SEOPF), United Network for Organ Sharing (UNOS); and the states of California, Florida, Oregon, and Washington grant deemed status to ASHI accredited labs.
HLA Assignments—Nomenclature
HLA assignments, testing methods, and reagents were developed through a series of International Histocompatibility Workshops, which began in 1964 and continue today (the 14th workshop is scheduled for December 2005; http://www.microbiol.unimelb.edu.au/micro/14ihiws/). The World Health Organization HLA Nomenclature Committee is responsible for the naming of HLA “types,” and their assignments are included on a web site (http://www.anthonynolan.org.uk/HIG) (50, 69). The names are based on the method of testing used to define HLA “types.” The naming system arose historically so that the nomenclature is difficult to understand.
Testing Methodology—Serology
The first method used for HLA typing was serology, and its use continues today (47). Serology detects different forms of the HLA proteins on the surface of peripheral blood lymphocytes. The assay uses antibodies, predominantly human alloantisera, in a microcytotoxicity assay. The alloantisera are obtained from humans who have been sensitized to HLA antigens by pregnancy or previous transplant. These antibodies are used as reagents to identify serologic specificities (or HLA types). The antibodies react with the HLA molecules present on the cell surface. The serologic specificities of the HLA antigens, HLA-A, -B, -C, -DR, and -DQ can be found on a Web site (http://www.anthonynolan.org.uk/HIG). Antibodies defining HLA-DP antigens are rare, so DP is not identified by serologic typing. Alloantisera are complex reagents containing multiple antibodies; they can react with more than one serologic epitope making interpretation of the results more of an “art.” Most serologic epitopes are thought to lie in the antigen binding region of the HLA molecule.
Each serologic specificity (or HLA type) is designated by a letter indi-
cating the HLA antigen group and a number (e.g., A2, A34, B7, DR4). The number indicates the order in which the type was discovered. For example, B7 is a serologic specificity localized on an HLA-B molecule, while DR4 is a serologic specificity localized on an HLA-DR molecule. Some serologic specificities have been subdivided, defining broad and split classifications (e.g., B5 was subdivided into B51 and B52; DR6 into DR13 and DR14). Some antisera recognize amino acid sequences shared among allelic products. For example, B5-specific sera recognize a shared serologic epitope on molecules carrying either B51 or B52 serologic specificities. Because these serologic types were named as they were discovered, the naming system is confusing.
The limited availability of alloantisera and the implementation of more powerful techniques to detect HLA differences among individuals (DNA-based typing) have resulted in the decision by the HLA community to discontinue the definition of new HLA serologic specificities. This means that a cell expressing a new HLA allele with unique serologic epitopes must be defined using pre-existing serologic types (e.g., B*8201 is defined as a combination of B45 and B22 serologic specificities).
Testing Methodology—DNA-Based Methods
Most of the DNA-based assays rely on the polymerase chain reaction to amplify the HLA genes and the detection of nucleotide sequence differences among HLA alleles to predict “HLA types” (51). Techniques for testing include use of sequence specific oligonucleotide probes (SSOP), sequence specific primer (SSP) typing, and DNA sequencing (SBT, sequence based typing). Where SSOP and SSP typing methods only assess polymorphic regions of the amplified gene, SBT methods assess both the polymorphic and the invariant regions of the gene. SSOP and SSP are techniques used for testing of volunteer donors in a registry at the time of recruitment, while SBT is more often used for patient and potential donor typing. Most typing systems focus on polymorphisms in the gene encoding the antigen binding region of the MHC molecules.
Depending on the two alleles carried by an individual and on the reagents, methods, and strategies used for the testing, a single individual tested in different laboratories may receive a variety of typing results. Even the same individual tested in the same laboratory at different times may receive differing assignments depending on how the reagents in the typing kit have changed over time and on the set of HLA alleles known to exist at the time that the test result was interpreted.
Each HLA allele is designated by the name of the gene, followed by an asterisk and a four- to eight-digit number indicating the allele (http://www.anthonynolan.org.uk/HIG). For example, B*2701 is an allele of the HLA-B
gene. The first two numbers in the numerical designation of each allele are based on the similarity to other alleles and sometimes on the serologic type of the resultant protein molecule. For example, the HLA-A molecule expressed by the A*02010101 allele bears the A2 serological specificity defining the HLA-A2 molecule (or antigen). The A*0226 allele has a similar DNA sequence to other A*02 alleles; however, the HLA-A molecule specified by A*0226 has not been characterized using serology so no information is available on its serologic specificity. The second example illustrates an allele whose name is based on its similarity to other alleles, in this case, similarity to A*02010101, A*0202, A*0203 and so forth. New alleles which appear significantly different in nucleotide sequence from previously described alleles may receive a unique WHO assignment for the first two digits of their name. Thus, B*8101, which was frequently serologically typed as B7, received a unique designation setting it apart from the B*07, allele family. The third and fourth digits in an allele designation refer to the order in which the allele was discovered. For example, DRB1*030101 was the first DRB1*03 allele to be discovered and DRB1*030201 was the second.
Some combinations of alleles share the first four digits of a six-digit designation (e.g., DRB1*110101 and DRB1*110102). The digits indicate that the two alleles differ in DNA sequence, but that the amino acid sequence of the HLA proteins specified by the two alleles do not differ (i.e., differing by silent or synonymous substitutions). Some combinations of alleles are identified by eight-digit designations (e.g., DRB4*01030101 and DRB4*01030102). These alleles differ in DNA sequence only outside of their protein coding sequences (e.g., intron or 3’UTR differences). In some cases, these differences may affect the expression of the alleles. In the case of DRB4*0103102, the allele is not expressed due to a defect in a mRNA splice site. The addition of an AN@ indicates the presence of an allele which is not expressed as a normal HLA protein at the cell surface. The N may not always be included but is implied (ie., DRB4*01030102N = DRB4* 01030102). Other letters indicate HLA products that might be secreted (B*44020102S) or expressed at a low level (A*24020102L).
Most DNA-based typing results narrow down but do not define the precise alleles carried by an individual. The results are various alternative genotypes (combinations of two alleles at a locus). Unfortunately, computer matching programs cannot accommodate listings of different possibilities for the allele present on a single chromosome, so registries such as the NMDP have adopted a “shorthand” nomenclature to indicate this typing result. Thus, in the NMDP database, the intermediate type DRB1*1101 or DRB1*1104 is labeled DRB1*11AD where AD is a code specifying 01 or 04. A Web site (http://www.nmdpresearch.org) lists this shorthand code.
Comparison of Typing Methods
Serology was initially used for HLA typing. DNA-based typing was implemented in the late 1980s with the advent of the polymerase chain reaction and the availability of the nucleotide sequences of many HLA alleles. The advantages of DNA-based testing over the long-established serology assay are summarized in many publications (6, 57, 59). DNA-based assays are favored because they utilize synthetic reagents, use reagents of well defined specificity, do not require viable cells, and can detect all HLA diversity. For example, different HLA alleles defined by DNA typing can specify HLA proteins which are indistinguishable using serology. For example, an individual carrying the B*070201 allele would have the same serologic type (B7) as an individual carrying the B*0705 allele (B7). Because serologic reagents that are specific enough to define this subdivision (or Asplit@) are not available, serology can not distinguish between the two proteins specified by the two alleles, B*070201 and B*0705 (Figure F-1). There are many, many other examples of alleles defined using DNA typing which can not be individually identified using protein-based typing methods.
Because serologic HLA typing had limitations in the consistency of test results, searches for potential HLA matched donors might have to include alternative phenotype searches to identify donors who may have been serologically mistyped. This will become less common as more and more DNA-typed donors are listed in the registry files.
Because the transition in typing methodology has taken place over a number of years, databases of HLA types (such as bone marrow registries) contain a mixture of serologic and DNA assignments. Some volunteer donor HLA types are a mixture of both serology and DNA assignments.
Testing Resolution
The ability to identify which HLA alleles are carried by an individual depends on the testing method and reagents used. Examples of the relationships among assignments are shown in Table F-3.
Low Resolution at Serologic Broad
The level of testing is achieved by serologic testing. A broad specificity is one that can be split further into two or more subtypes (or splits). For example, DR3 is a broad assignment that has been split into DR17 and DR18.
TABLE F-3 Examples of Relationships Between Serologically Defined Antigens and DNA-Defined Types
|
Serology |
DNA-Based Testing |
|||
|
Broad |
Split |
Low Resolution |
Intermediate Resolution |
High Resolution |
|
A2 |
— |
A*02 (A*02XX)a |
A*0202 or A*0206 or A*0211 or A*0220 |
A*0202 |
|
B15 |
B62 |
B*15 (B*15AAA) |
B*1501 or B*1504 or B*1505, etc. |
B*1501 |
|
Cw7 |
— |
Cw*07 (Cw*07XX) |
Cw*0702 or Cw*0704 or Cw*0708 |
Cw*0702 |
|
DR3 |
DR17 |
DRB1*03 (DRB1*03XX) |
DRB1*0301 or DRB1*0304 or DRB1*0305 or etc. |
DRB1*0301 |
|
aThe National Marrow Donor Program has a 2–4 letter code that includes specific alleles. XX means all alleles in an allele group (e.g., A*02XX includes about 67 alleles, A*0201, A*0202, A*0203, through and including A*0267). |
||||
Low Resolution at Serologic Split
The level of testing is achieved by serologic testing. A split is a subdivision of a broad specificity. For example, DR17 and DR18 are splits of the broad specificity DR3. Many volunteer donors on registries are typed at this level of resolution.
Low Resolution (Generic or Serologic or Antigen) Level
This is DNA-based typing that produces results that are similar in appearance and detail to serologic types. For example, the DRB1*11 (or DRB1*11XX) DNA type is the equivalent to the DR11 serologic type. The “XX” indicates that the allele was not further defined. At this level of resolution, it is not possible to determine which of the over 50 DRB1*11 alleles is carried by the individual being tested. Many volunteer donors on registries are typed at this level of resolution.
Intermediate Resolution Level
DNA-based typing can reduce the number of possible alleles but lists several different alleles as being candidates for the type of an individual. For example, an individual who was typed as DRB1*11XX at low resolution, might be typed as DRB1*1101 or DRB1*1104 at intermediate resolution. Registries such as the NMDP have adopted a “shorthand” nomenclature to indicate this typing result (http://www.nmdpresearch.org). Thus, in the
NMDP database, DRB1*11AD is used. AD is a code specifying 01 or 04. Many volunteer donors on registries are typed at this level of resolution.
High Resolution Level
DNA-based typing identifies the specific allele carried by an individual (e.g., DRB1*1104) or may narrow down the possibilities to one highly likely allele and one to several rare alleles (e.g., A*0201 or A*0209 or A*0243N). This level of typing is not routinely carried out during the typing of new volunteers because of the cost and manpower involved. High-resolution testing is frequently carried out by the transplant center to determine the degree of the HLA match between a patient and a specific potential donor.
Allele Level
DNA-based typing identifies the specific allele carried by an individual (e.g., DRB1*1104). This level of typing is not routinely carried out during the typing of new volunteers because of the cost and manpower involved. High resolution testing is frequently carried out by the transplant center to determine the degree of the HLA match between a patient and a specific potential donor.
Cost of Typing
The cost of typing varies depending, in part, on the method, reagents, resolution, and volume of testing. For clinical HLA typing laboratories performing high numbers of new volunteer donor typing for a registry, the approximate cost is $55 to assign intermediate assignments at three loci (A, B, DRB1). (Price does not include phlebotomy.) For testing of 5 loci (A, B, C, DRB1, DQB1) at allele resolution in a laboratory performing large-volume testing, the assay may cost approximately $800–$1000. The cost will be higher in laboratories that perform testing on a smaller scale, for example, only for their own hospital.
Impact of Allele Discovery and Genotype Summarization on Test Interpretation
Approximately two new HLA alleles are reported each week (50). With the continued increase in the number of known HLA alleles, primary HLA testing data (nucleotide polymorphisms detected as present or absent) should be obtained and stored in addition to interpreted assignments (26, 27, 28, 49). This is particularly important for typing data which is used
over a long period of time (e.g., bone marrow registry, cord blood bank). Inclusion of these data are key to prevent the data from being outdated, to provide a list of genotypes for future matching strategies, and to facilitate the search for rare/newer alleles. This is often key for patients with uncommon alleles who do not have many potential donors. In these situations, tools to facilitate the selection of donors with the greatest potential to carry the rare allele are essential to save time and conserve resources.
Correlation of DNA-Based and Serologic Types
Although a single serologic specificity was once thought to define the product of a single HLA allele, we now know that a single serologic specificity is associated with multiple allelic products (Table F-4) (73). For example, the serologic type HLA-A2 is found on over 60 different allelic products. Today, many cells carrying newly described alleles have not been rigorously serologically tested and a neural network approach has been used to predict the serologic assignments (48). Also, because the typing method is predominantly by DNA based methods, allelic products encoding apparently unique serologic specificities are not assigned new serologic specificities.
The nomenclature used to assign DNA-based HLA types is based on that used in serology; however, there are many examples where the assignments applied to an allele and to its product appear to differ from one another (for example, a protein with a B62 serologic determinant is encoded by the allele B*1501). These differences are often the result of the complex nature of serologic testing and the nomenclature system used to assign allele names. In addition, some allelic products carry new combina-
TABLE F-4 Examples of Alleles Which Encode Specific HLA Proteins (or Antigens)
|
Serologic Assignment |
Allelic Products Which Carry Serologic Typea |
|
A2 |
A*0201, A*0202, A*0203, A*0204, A*0205, A*0206, etc. |
|
B7 |
B*0702, B*0703, B*0704, B*0705, B*0706, B*0707, etc. |
|
B62 |
B*1501, B*1504, B*1505, B*1506, B*1507, B*1520, etc. |
|
None assigned |
B*8301 |
|
DR3 |
DRB1*0301, DRB1*0302, DRB1*0303, DRB1*0304, etc. |
|
aNot all alleles in the group encode the antigen. For example, some of the A*02 alleles, e.g., A*0215N and A*0232N, do not encode a protein product. For example, not all alleles with names beginning B*15 encode proteins with the B62 serologic type. Other alleles in this group encode B63, B71, B72, B75, B76, B77 antigens. |
|
TABLE F-5 Examples of the Types of Volunteers Carrying the Same Allele, A*0201
|
Assignment |
Typing Method, Resolution |
|
A2 |
Serology, low or antigen |
|
A*0201 |
DNA-based, allele |
|
A*02AJCH = A*0201, A*0207, A*0215N, A*0218, A*0220, A*0224, A*0225, A*0229, A*0230, A*0231, A*0232N, A*0233, A*0239, A*0242, A*0243N, A*0252, A*0253N, A*0259, A*0260 |
DNA-based, intermediate |
|
A*02ACVV = A*0201, A*0204, A*0207, A*0209, A*0215N, A*0217, A*0218, A*0220, A*0224, A*0225, A*0226, A*0229, A*0230, A*0231, A*0232N, A*0233, A*0239, A*0242, A*0243N, A*0249, A*0252, A*0253N, A*0259, A*0260 |
DNA-based, intermediate |
|
A*02AD = A*0201, A*0204 |
DNA-based, intermediate |
|
A*02XX |
DNA-based, low |
tions of serologic determinants which do not fit within previously defined serologic specificities. These allelic products would be serologically typed as “blanks” or might be identified as carrying one of two or more specificities. For example, the allele B*8301 does not have a serologic assignment.
Even the same individual typed in different laboratories or typed by the same laboratory over time will likely receive a variety of HLA assignments. For example, the assignment A*0201, a very common allele, can be found within 844 different assignments within the NMDP registry (Table F-5).
HLA IN DISEASE AND TRANSPLANTATION
Disease
Specific HLA alleles have been associated with disease susceptibility (8, 17, 21, 23, 67). For example, when patients with the autoimmune disease multiple sclerosis are typed for HLA, the majority of patients carry a specific DRB1 allele, DRB1*1501. A study of many autoimmune diseases shows a similar association. The disease association will also discriminate among closely related alleles, for example, alleles of DRB1*04 differ in predisposition to type 1 diabetes. Although more difficult to detect, differences in disease susceptibility have also been shown with infectious diseases. Individuals who carry particular B*35 subtypes, e.g., B*3502,
B*3503, are more likely to progress to AIDS compared to individuals carrying other B*35 subtypes, B*3501 and B*3508 (20).
Allorecognition
Nobel prize winning studies by Drs. Snell, Dausset, and Benacerraf identified molecules that play a predominant role in the rejection of transplanted tissue (4, 13, 24, 76). Tissues from one individual transplanted into a patient are detected as foreign by the immune system. This recognition process is controlled in part by the major histocompatibility molecules, HLA. In hematopoietic stem cell transplantation, the immune response may be directed against the graft (patient’s immune system rejecting the graft) or against the recipient (donor’s immune cells rejecting the patient’s cells, termed graft versus host disease).
T lymphocytes can respond to foreign HLA molecules either by direct recognition of the foreign HLA molecule or by indirect recognition of a self HLA molecule presenting a peptide from a foreign HLA molecule (19,78). Polymorphic molecules other than HLA may stimulate the immune system when presented by HLA molecules and are termed minor histocompatibility antigens (14). The impact of these “minor” responses on transplant is not yet clear. Natural killer (NK) cells have also been implicated in allorecognition responses, activated by missing HLA molecules (64). HLA alloantibodies synthesized by B lymphocytes have been associated with graft rejection (62). Although each of these immune cell types may affect transplant outcomes, current evidence suggests that T lymphocytes play the dominant role.
Since most HLA alleles encode proteins which differ from one another in the amino acid sequence of the antigen binding domains, most are theoretically capable of stimulating alloreactive T cells.
SOURCES OF HEMATOPOIETIC STEM CELL DONORS
Related Donors
In order to avoid allorecognition, physicians attempt to identify hematopoietic stem cell donors who are “HLA compatible” with their donors. Any two children in a family have a one in four chance of receiving the same two HLA gene-bearing chromosomes from their parents. Thus, within the United States, about 30 percent of patients identify an HLA compatible family donor. The remaining individuals must seek a histocompatible unrelated donor through registries of adult volunteer donors or through cord blood banks.
International Registries and Cord Blood Banks
About 90 registries and cord blood banks of HLA typed potential donors have been established in 41 countries and include over 9 million individuals/units (25, 79, 80). These registries/banks range in size from 42 units in a small cord blood bank to over 5 million adult volunteer donors in one registry. The HLA phenotypes available worldwide are summarized within the database of Bone Marrow Donors Worldwide (BMDW; http://www.bmdw.leidenuniv.nl). In 2002, worldwide registries received over 77,000 preliminary search requests and processed over 29,000 activated searches. There is, for example, an average of 7,000 patients searching the world’s largest registry, the NMDP, at any given time.
While an unrelated donor search usually begins within the country of origin of the patient, searches failing to identify a donor can extend to foreign registries/banks. Of the almost 5,900 unrelated transplants worldwide, about one-third involved stem cells from a donor in another country. For the NMDP, approximately equal numbers of hematopoietic stem cells were provided from overseas donors to U.S. patients (1,700) as were provided by U.S. donors for patients abroad (1,946). An international voluntary organization of registries worldwide, the World Marrow Donor Association (WMDA; http://www.worldmarrow.org), has published policies and procedures for these international exchanges and WMDA working groups such as the Information Technology Working Group, are focused on standardizing data elements, forms and processes for international exchanges (18, 22, 30, 63).
DONOR SELECTION
Defining a “Match”
There is no single accepted definition of a “match” in regards to a specific transplant donor. The match can be at allele level or at antigen level. For example, a patient and donor sharing the alleles at the DRB1 locus, DRB1*0101, DRB1*0302, are said to be allele matched. Sharing DRB1*01, DRB1*03 (low resolution DNA typing) or DR1,DR3 (serologic assignment) would be defined as an antigen match. At the lower level of resolution, the donor and recipient are actually potentially matched at the allele level since they each carry one of 11 alleles of DRB1*01 and one of 25 alleles of DRB1*03. The probability of the two individuals carrying the same alleles depends on the frequency of the alleles in the racial/ethnic group of each individual. For example, if the patient carries DRB1*0302, the probability of a DRB1*03 positive African American volunteer carrying the same allele is about 46 percent, while the probability of a DRB1*03 positive white individual carrying the allele is 0 percent (see Table F-2).
TABLE F-6 Matches for a Patient Typed as A*0201, A*3201, B*0702, B*1501, Cw*0401, Cw*0702, DRB1*0101, DRB1*0302
|
Match |
Example of HLA Types |
|
6 of 6 antigen |
A2, A32, B7, B62, DR1, DR3 |
|
6 of 6 allele |
A*0201, A*3201, B*0702, B*1501, DRB1*0101, DRB1*0302 |
|
8 of 8 antigen |
A*02, A*32, B*07, B*15, Cw*04, Cw*07, DRB1*01, DRB1*03 |
|
8 of 8 allele |
A*0201, A*3201, B*0702, B*1501, Cw*0401, Cw*0702, DRB1*0101, DRB1*0302 |
|
5 of 6 antigen |
A*02, A*01, B*07, B*15, DRB1*01, DRB1*03 |
The number of loci considered in the definition of a match also varies. A 6 of 6 antigen match is usually referring to matches at HLA-A, -B, and DRB1 (Table F-6). An 8 of 8 antigen match might refer to HLA-A, -B, -C, and -DRB1 loci or HLA-A, -B, -DRB1, -DQB1 loci. Six of 6 refers to matching for 2 assignments at each of 3 loci; 5 of 6 is matching for 5 of the potential 6 assignments. The extent of allele matching within a 6/6 antigen match can vary (Table F-7).
TABLE F-7 Possible Allele Assignment of Individual Typed as a 6 of 6 Antigen Match, A2, A32, B7, B62, DR1, DR3, for a Patient Typed as A*0201, A*3201, B*0702, B*1501, Cw*0401, Cw*0702, DRB1*0101, DRB1*0302
|
Allele Typing of Possible Donor |
Allele Match for Patient |
|
A*0201, A*3201, B*0702, B*1501, DRB1*0101, DRB1*0302 |
6 of 6 allele match, 6 of 6 antigen match |
|
A*0205, A*3201, B*0702, B*1501, DRB1*0101, DRB1*0302 |
5 of 6 allele match, 6 of 6 antigen match |
|
A*0205, A*3202, B*0702, B*1501, DRB1*0101, DRB1*0302 |
4 of 6 allele match, 6 of 6 antigen match |
|
A*0205, A*3202, B*0705, B*1501, DRB1*0101, DRB1*0302 |
3 of 6 allele match, 6 of 6 antigen match |
|
A*0205, A*3202, B*0705, B*1506, DRB1*0102, DRB1*0301 |
0 of 6 allele match, 6 of 6 antigen match |
Defining a Mismatch
The word “mismatch” may be used differently, depending on the level of resolution of matching considered. For example, a 6 of 6 antigen match might contain allele mismatches (Table F-7). The term “low resolution mismatch” might be used for two individuals who differ for broad antigen groups such as DR1 vs DR3 (or DRB1*01 vs DRB1*03). This type of mismatch might also be called a “major” mismatch. A high resolution mismatch might refer to individuals who carry the same low resolution assignment but differ at the allele level, for example, DRB1*0102 versus DRB1*0103. This type of mismatch might be called a “minor” mismatch. The evidence supporting the difference between a major and minor mismatch in terms of importance to outcome is limited (16) and so-called “minor” mismatches may actually provoke strong allorecognition.
HLA Matching to Optimize Outcome in Marrow Transplantation
There are 12 HLA loci that could potentially impact outcome: A, B, C, DRA, DRB1, DRB3, DRB4, DRB5, DQA1, DQB1, DPA1, DPB1. Various studies on marrow transplants using allele level typing for a subset of these loci to evaluate their impact on transplant outcome have somewhat different results (16, 54, 65, 66, 70, 74, 82). Differences among studies could arise because of differences in the resolution of HLA testing, the number of HLA loci considered, differences in the types of mismatches observed, study size, and other complex variables (disease, stage, age, treatment, etc.) (33).
Based on a study of transplants through their network and review of the literature, NMDP guidelines for marrow donations recommend matching at the allele level for HLA-A, -B, -C, and -DRB1 (33). For patients who have multiple, highly matched, suitable donors, there might be additional benefit from matching alleles of HLA-DQB1, -DPB1, and -DRB3/4/5. (The association between HLA-DQ and -DP mismatching and survival is controversial; the association of HLA-DRB3/4/5 mismatching and survival has not been studied.) There are no convincing data to show that deliberate HLA mismatching may be beneficial to achieve graft-versus-leukemia effects. Other groups have also proposed matching guidelines (61).
The availability of only HLA partially matched donors is not a contraindication to transplant. Many patients with mismatches can do well; however, there are no clear guidelines for selecting “permissive” mismatches. Limiting the number of mismatches is recommended (33). The latter requires more complex search strategies to identify the best donor.
HLA Testing at Recruitment and at the Time of Donor Selection
Strategies for HLA testing at the time of recruitment/banking are designed to obtain the best resolution for volunteer/unit selection and the greatest accuracy with the lowest possible cost (34, 35, 58). Usually HLA-A, -B and -DRB1 are typed. In general, low to intermediate resolution testing is used (Table F-8). However, with limited access to material for testing in cord units, the level of testing may be higher, since the ability to perform repeat testing may be limited. DNA testing is favored over serologic testing due to its consistency, accuracy, and increased resolution (32, 60). The higher the resolution of the patient typing at the time of search, the more specific the search (15, 33). However, patient searches carrying lower resolution assignments are often performed at the preliminary search stage, when the physician is evaluating alternatives for treatment.
During a search for a specific patient, a list of HLA types from potentially matched volunteers/units is provided by the registry to the patient’s physician. From this list of potential matches, the transplant center selects individual volunteers for additional testing (Table F-9). Since some potential donors are typed only for HLA-A and -B but not for HLA-DR, HLA-DR typing may be required of HLA-A, -B matched potential donors for those patients who do not find an HLA-A, -B, -DR match in their initial search. Additional histocompatibility testing may be performed to include a higher level of resolution for the three primary HLA loci or to test additional histocompatibility loci such as HLA-C and -DQB1. Donors who appear to be potential HLA matches based on transplant center matching
TABLE F-8 Examples of HLA Typing Assignments Carried by Volunteer Donors on Registries
|
Recruitment Typinga |
Typing Method, Resolution |
|
A1,2, B7,8 |
Serology A and B, DR testing not done |
|
A1,2, B7,8, DRB1*03XX, *15XX |
Serology A & B, low resolution DNA-based DRB1 |
|
A*01XX, *02XX, B*07XX, *08XX, DRB1*03XX, *15XX |
Low resolution DNA-based HLA-A, -B, -DRB1 |
|
A*01AB, *02MNK, B*07XX, *08AB, DRB1*03AD, *15MN |
Low (XX) to intermediate resolution (AB, MNK, AD, MN) DNA-based HLA-A, -B, -DRB1 |
|
aNational Marrow Donor Program defined allele codes, where AB, A*0101 or *0102; MNK, A*0202 or *0215N or *0221 or *0222 or *0223; XX, all alleles in that allele group; AD, DRB1*0301 or *0304; MN, DRB1*1501 or *1502 or *1503. |
|
TABLE F-9 Steps in Donor Selection
|
Steps in Donor Selection |
HLA Assignments |
|
1—Recruitment of new volunteer |
Low to intermediate HLA-A, B, DRB1 |
|
2—Selection of volunteer as potential match |
Typing at time of selection is usually recruitment typing. A transplant center will select several (3–10) potentially matched donors if available and if resources are not limited for additional testing in step 3. |
|
3—Additional HLA testing to evaluate match with patient. This step has various names (highresolution testing, confirmatory typing, DR typing) |
High- or intermediate-resolution DNA-based testing of HLA loci to determine match. Loci might include HLA-A, B, C, DRB1, DRB3/4/5, DQA1, DQB1, DPA1, DPB1; the NMDP recommends high-resolution testing of A, B, C, DRB1 for matching and DRB3/4/5 and DQB1 if possible. The testing might be carried out on a sample from the NMDP DNA repository or on a fresh donor sample. If the sample comes from the repository, a fresh donor sample must be tested to insure identity of the repository sample (see below). The testing may be carried out in stages. Serologic testing of HLA class I as a screen to select the best matched donor and/or to monitor expression of antigens. Some centers use serologic testing as an initial screen to select donors for higher resolution DNA-based testing of HLA loci. In addition, this assay might also be used to monitor the expression of some HLA antigens if null or nonexpressed HLA alleles are expected. Only HLA class I is tested; class II null alleles are usually not evaluated due to the poorer quality of the serology. |
|
4—Workup (time at which a selected donor undergoes medical testing to evaluate if medically fit to donate) |
A fresh donor sample is required to confirm that the donor is indeed the person identified as a potential match and to confirm the HLA assignment. The DNA-based testing may be various levels of resolution for various HLA loci. It may, for example, confirm the identity using low resolution A, B, DRB1 testing or may retest alleles at these and other loci. The status of the patient might be considered in deciding on the resolution; high-risk patients might require a less stringent check of donor allele identity than low-risk patients because their urgent status indicates a rapid decision regarding transplant. The transplant center will check blood type at the time of transplant to confirm identity. |
criteria are requested for confirmatory typing (CT). At this stage, a fresh blood sample from the donor and the patient are tested to confirm HLA identity.
Quality control of the donor HLA database is critical to speed the search for donors and to identify all suitable matches. This quality control may include requiring HLA typing laboratory accreditation, establishing a registry program for proficiency testing at the time of recruitment typing (32, 60), comparison of recruitment typing to repeat CT (31), use of automated systems for HLA data entry and submission, and reanalysis of primary typing data in the registry (49).
Selection of Potential HLA Matches by Registry Search Algorithms
Two sets of criteria are used to determine the minimal HLA match between patient and a specific donor. The first set contains the criteria a registry or bank might have regarding how closely the donor must be matched to the patient to allow the donor to be used for transplant. In general, these guidelines are meant to protect the adult volunteer donor from undergoing the risks of donation for a transplant that is likely to fail. This also prevents cord blood units from being used for a transplant that is likely to fail. A second set of match criteria are dictated by the transplant center protocols and are usually more stringent than those used by the registry or bank.
Since a volunteer donor or unit might be HLA typed several times (Table F-9), the registry must have an approach to incorporate and prioritize the updated information while maintaining older information in a history file. Since the newer HLA typing is usually, but not always, at a higher resolution, a computer algorithm (supplemented by staff review) should prioritize which HLA assignment to use in the match algorithm. For example, data for additional HLA loci may be added or the resolution of existing HLA types may be altered during confirmatory typing.
Since an HLA typing may be obtained by serology or DNA and at various levels of resolution, comparison of patient and donor assignments is a complex process (45, 53, 55). As an example, the allele A*0201 can be found within 844 different assignments submitted to the NMDP registry (Table F-10). Often the HLA typing result is converted into an assignment called a search determinant to provide a rapid comparison for finding a potentially matched donor (36). The goal is to identify all potentially matched donors yet to keep the list short and exclude suboptimal donors. The report listing potential donors is often sorted so that the best matched donors might be easily identified. Strategies to identify and prioritize mismatched donors on search reports are also complex.
PROBABILITY OF FINDING AN ALLELE MATCH FOR HLA LOCI
The probability of finding an allele match for specific patients varies dramatically (2, 53). Patients with common alleles and common haplotypes will find many allele matched donors. The probability of a low resolution typed volunteer selected as a potential match carrying the same alleles as one of these patients is very high. In contrast, some patients have fairly common HLA alleles but they have uncommon haplotypes (the collection of alleles carried on a chromosome). In these cases it can be extremely difficult to find matched donors. Some patients have rare alleles and these are also difficult to find matches for unless the allele is found in a conserved haplotype.
Within the NMDP registry, it is calculated that 85 percent of individuals find 6 of 6 antigen matches (31). In an evaluation of 1422 NMDP transplants matched at the 6/6 antigen level, 28 percent carried allele mismatches at HLA-A, -B and/or -DRB1 and most carried mismatches at other HLA loci, predominantly DP (29) (Table F-10). Selection of six antigen matched donors did not result in allele matching throughout the HLA complex in 92 percent of the cases, in 50 percent if DP was ignored (29). Of the 6 of 6 antigen matches undergoing transplant, the probability of finding a 6 of 6 allele match is about 72 percent, a 10 of 10 allele match is about 50 percent, and a 12 of 12 match is 11 percent. The chance of finding a 6 of 6
TABLE F-10 Summary of HLA Matches at Each Locus in 6/6 Antigen Matched Donor-Recipient Pairs (n = 1422) from NMDP (29)
|
|
|
Mismatched at Allele Level (%)b |
||
|
Locus |
Matched at Allele Level (%)a |
Total Mismatchesb |
1 Allele Mismatched |
2 Alleles Mismatched |
|
A |
1355 (92) |
107 (8) |
105 (7) |
2 (0) |
|
B |
1217 (86) |
205 (14) |
192 (14) |
13 (1) |
|
C |
986 (69) |
436 (31) |
382 (27) |
54 (4) |
|
DRB1 |
1225 (86) |
197 (14) |
184 (13) |
13 (1) |
|
DQA1d |
1258 (88) |
164 (12) |
154 (11) |
10 (1) |
|
DQB1d |
1183 (83) |
239 (17) |
224 (16) |
15 (1) |
|
DPA1d |
791 (56) |
631 (44) |
563 (40) |
68 (5) |
|
DPB1d |
192 (14) |
1230 (86) |
794 (56) |
436 (31) |
|
aBoth alleles at the locus are identical in donor and recipient. bOne or both alleles are mismatched. NOTE: These are patients with common types who may have undergone further testing to select the best donor. |
||||
TABLE F-11 Summary of HLA Matches at Each Locus in 5/6 Antigen Matched Donor-Recipient Pairs (n = 429) (29)
|
|
Matched at Allele Level (%)a |
||||
|
|
|
Antigen Mismatched Locusb |
|||
|
Locus |
Total |
HLA-A (n = 203) |
HLA-B (n = 186) |
HLA-DRB1 (n = 40) |
|
|
A |
180 (42) |
0 (0) |
146 (78) |
34 (85) |
|
|
B |
178 (41) |
151 (74) |
0 (0) |
27 (68) |
|
|
C |
136 (32) |
106 (52) |
14 (8) |
16 (40) |
|
|
DRB1 |
328 (76) |
183 (90) |
145 (78) |
0 (0) |
|
|
DQA1 |
338 (79) |
184 (91) |
150 (81) |
4 (10) |
|
|
DQB1 |
299 (70) |
165 (81) |
130 (70) |
4 (10) |
|
|
DPA1 |
224 (52) |
107 (53) |
96 (52) |
21 (53) |
|
|
DPB1 |
45 (10) |
23 (11) |
17 (9) |
5 (13) |
|
|
aBoth alleles at the locus are identical in donor and recipient. bThe mismatched antigen giving rise to the 5/6 match status. When the pairs were intentionally mismatched at a locus, there were no allele matches at that locus (e.g., the 203 pairs with HLA-A antigen mismatches had no pairs matched for HLA-A alleles). |
|||||
antigen match for minorities is lower, 65 percent for an African American patient, and probability of allele matching has not yet been evaluated.
The level of allele matching in the 5/6 matched pairs is lower than 6/6 antigen matched pairs; however, the lower percentage of matching did not derive solely from the known mismatch. For example, in the 5/6 matched pairs in which the known mismatch was at the HLA-A locus (n = 203), only 74 percent of the HLA-B and 52 percent of the C loci were matched for both alleles (Table F-11). Likewise, in the 5/6 matched pairs with a known HLA-B antigen mismatch (n = 186), only 78 percent of the pairs were matched at the HLA-A locus and 8 percent at the HLA-C locus (29).
Optimizing Registry Size to Find a Match
Defining the optimal size of a registry is a public policy decision (44). Competing goals have to be balanced: (1) maximizing the number of patients who find a suitably matched donor, (2) providing comparable access to transplantation for patients regardless of race, and (3) containing costs. Definition of a “suitable match” must be defined based on the clinical outcome literature. The resolution of the registry typing will determine how accurately the probability of a match for searching patients can be predicted.
The extensive diversity of HLA alleles and haplotypes makes it very
unlikely that a patient will match any given unrelated individual. This diversity requires a large donor registry to provide suitably HLA-matched donors for patients. If cord blood allows more mismatching, the required size of such a bank will likely be smaller (3). Even with over 9 million volunteer donors worldwide, there are still significant numbers of patients who fail to identify a donor (31). Racial/ethnic minority patients have a lower likelihood of finding an unrelated donor, resulting in part from a small number of minority volunteer donors available in registries and the greater HLA polymorphism for some of these groups (2). In the United States, there are more white patients than minorities failing to find a matched donor.
Unfortunately, each additional volunteer added to a registry is less likely to carry a new set of HLA assignments and is more likely to carry a type already found in the registry (56). As a result, continued recruitment does improve the likelihood of finding an HLA-matched donor but still leaves many patients without a match. The number of patients without a donor will depend on the level of match required for a successful outcome. Published studies on the probability of finding a match are based on matching at a low resolution level, since most volunteers are typed at this level. These studies likely overestimate the likelihood of finding matches because, in practice, many transplant centers define an acceptable match at an allele level of resolution.
RESEARCH
Registries/Cord Blood Banks as Repositories of Extensive HLA Data
As large repositories of HLA and often clinical data, registries/banks should have the resources to analyze this information to direct registry recruitment (e.g., evaluate HLA diversity to serve searching patients), to refine search and matching algorithms, to create search tools, and to define matching requirements for optimal outcome (52, 71, 72). Access to expertise in informatics, population genetics, and histocompatibility is essential to capitalize on this wealth of information.
REFERENCES
1. American Society for Histocompatibility and Immunogenetics Laboratory Manual, A. B. Hahn, G. A. Land, and R. M. Strothman, eds. American Society for Histocompatibility and Immunogenetics, 2000. New York.
2. Beatty, P. G., M. Mori, and E. Milford. 1995. Impact of racial genetic polymorphism on the probability of finding an HLA-matched donor. Transplantation 60:778–783.
3. Beatty, P. G., K. M. Boucher, M. Mori, and E. L. Milford. 2000. Probability of finding HLA-mismatched related or unrelated marrow or cord blood donors. Human Immunology 61:834–840.
4. Benacerraf, B. 1981. The role of MHC gene products in immune regulation and its relevance to alloreactivity. In Nobel Lectures, Physiology or Medicine, 1971–1980. J. Lindsten, ed. World Scientific Publishing Co., Singapore, 1992. Available at: http://nobelprize.org/medicine/laureates/1980/benacerraf-lecture.html.
5. Bjorkman, P. J. and P. Parham. 1990. Structure, function, and diversity of class I major histocompatibility complex molecules. Annu. Rev. Biochem. 59:253–288.
6. Bozon, M. V., J. C. Delgado, A. Selvakumar, O. P. Clavijo, M. Salazar, M. Ohashi, S. M. Alosco, J. Russell, N. Yu, B. Dupont, and E. J. Yunis. 1997. Error rate for HLA-B antigen assignment by serology: implications for proficiency testing and utilization of DNA-based typing methods. Tissue Antigens 50:387–394.
7. Bugawan, T. L., W. Klitz, A. Blair, and H. A. Erlich. 2000. High-resolution HLA class I typing in the CEPH families: analysis of linkage disequilibrium among HLA loci. Tissue Antigens 56:392–404.
8. Bugawan, T., W. Klitz, and H. A. Erlich. 2002. The association of specific class I and class II alleles with Type 1 diabetes among Filipinos. Tissue Antigens 59:452–469.
9. Cao, K., J. Hollenbach, X. Shi, W. Shi, M. Chopek, and M. Fernandez-Vina. 2001. Analysis of the frequencies of HLA-A, B, and C alleles and haplotypes in the five major ethnic groups of the United States reveals high levels of diversity in these loci and contrasting distribution patterns in these populations. Human Immunology 62:1009–1030.
10. Carrington, M., J. C. Stephens, W. Klitz, A. B. Begovich, H. A. Erlich, and D. Mann. 1994. Major histocompatibility complex class II haplotypes and linkage disequilibrium values observed in the CEPH families. Human Immunology 41:234–240.
11. Carrington, M., M. P. Martin, T. Kissner, D. Vlahov, J. J. Goedert, R. Kaslow, S. Buchbinder, K. Hoots, and S. J. O’Brien. 1999. HLA and HIV-1: heterozygote advantage and B*35-Cw*04 disadvantage. Science 283:1748–1752.
12. Carrington, M. 1999. Recombination within the human MHC. Immunol. Rev. 167: 245–256.
13. Dausset, J. 1981. The Nobel Lectures in Immunology. Lecture for the Nobel Prize for Physiology or Medicine, 1980: The major histocompatibility complex in man. Past, present, and future concepts. Science 213:1469–1474.
14. Falkenburg, J. H., L. van de Corput, E. W. Marijt, and R. Willemze. 2003. Minor histocompatibility antigens in human stem cell transplantation. Experimental Hematology 31:743–751.
15. Fischer, G. 2002. Immunogenetic selection of donors for haematopoietic stem cell transplantation: an approach. Transpl. Immunol. 10:223–225.
16. Flomenberg, N., L. A. Baxter-Lowe, D. Confer, M. Fernandez-Vina, A. Filipovich, M. Horowitz, C. Hurley, C. Kollman, C. Anasetti, H. Noreen, A. Begovich, W. Hildebrand, E. Petersdorf, B. Schmeckpeper, M. Setterholm, E. Trachtenberg, T. Williams, E. Yunis, and D. Weisdorf. 2004. Impact of HLA class I and class II high resolution matching on outcomes of unrelated donor bone marrow transplantation: HLA-C mismatching is associated with a strong adverse effect on transplant outcome. Blood 104:1923–1930.
17. Fotenot, A. P., M. Torres, W. H. Marchall, L. S. Newmann, and B. L. Kotzin. 2000. Beryllium presentation to CD4+ T cells underlies disease-susceptibility HLA-DP alleles in chronic beryllium disease. Proc Natl Acad Sci USA 97:12717–12722.
18. Gahrton, G., J. J. van Rood, and M. Oudshoorn. 2003. The World Marrow Donor Association (WMDA): its goals and activities. Bone Marrow Transplant 32:121–124.
19. Game, D. S., and R. I. Lechler. 2002. Pathways of allorecognition: implications for transplantation tolerance. Transpl. Immunol. 10:101–108.
20. Gao, X., G. W. Nelson, P. Karacki, M. P. Martin, J. Phair, R. Kaslow, J. J. Gaedert, S. Buchbinder, K. Hoots, D. Vlahov, S. J. O’Brien, and M. Carrington. 2001. Effect of a single amino acid change in MHC class I molecules on the rate of progression to AIDS. N Engl J Med 344:1668–1675.
21. Gebe, J. A., E. Swanson, and W. W. Kwok. 2002. HLA class II peptide-binding and autoimmunity. Tissue Antigens 59:78–87.
22. Goldman, J. M. 1994. A special report: bone marrow transplants using volunteer donors—Recommendations and requirements for a standardized practice throughout the world—1994 update. Blood 84:2833–2839.
23. Gregerson, P. K., J. Silver, and R. F. Winchester. 1987. The shared epitope hypothesis. An approach to understanding the molecular genetics of susceptibility to rheumatoid arthritis. Arthritis Rheum. 30:1205–1213.
24. Groth, C. G., L. B. Brent, R. Y. Calne, J. Daussert, R. A. Good, J. E. Murray, N. E. Shumway, R. S. Schwartz, T. E. Starzl, P. I. Terasaki, E. D. Thomas, and J. J. van Rood. 2000. Historic landmarks in clinical transplantation: conclusions from the consensus conference at the University of California, Los Angeles. World J. Surg. 24:834–843.
25. Hansen, J.A. 1996. Development of registries of HLA-typed volunteer marrow donors. Tissue Antigens 47:460–463.
26. Helmberg, W. 2000. Storage and utilization of HLA genomic data—new approaches to HLA typing. Rev. Immunogenetics 2:468–476.
27. Helmberg, W., J. Hegland, C. K. Hurley, M. Maiers, S. G. E. Marsh, C. Muller, and E. H. Rozemuller. 2000. Going back to the roots: effective utilisation of HLA typing information for bone marrow registries requires full knowledge of the DNA sequences of the oligonucleotide reagents used in the testing. Tissue Antigens 56:99–102.
28. Hurley, C. K. 1997. Acquisition and use of DNA-based HLA typing data in bone marrow registries. Tissue Antigens 49:323–328.
29. Hurley, C. K., M. Fernandez-Vina, W. H. Hildebrand, H. J. Noreen, E. Trachtenberg, et al. A high degree of HLA disparity arises from limited allelic diversity: analysis of 1874 unrelated bone marrow transplant donor-recipient pairs, in preparation.
30. Hurley, C. K., and C. Raffoux. 2004. World Marrow Donor Association: international standards for unrelated hematopoietic stem cell donor registries. Bone Marrow Transplant 34:103–110.
31. Hurley, C. K., M. Fernandez-Vina, and M. Setterholm. 2003. Maximizing optimal hematopoietic stem cell donor selection from registries of unrelated adult volunteers. Tissue Antigens 61:415–424.
32. Hurley, C. K., M. Maiers, J. Ng, D. Wagage, J. Hegland, J. Baisch, R. Endres, M. Fernandez-Vina, U. Heine, S. Hsu, M. Kamon, Y. Mitsuishi, D. Monos, H. Noreen, L. Perlee, S. Rodriguez-Marino, A. Smith, P. Stastny, M. Trucco, S. Y. Yang, N. Yu, R. Holsten, R. J. Hartzman, and M. Setterholm. 2000. Large-scale DNA-based typing of HLA-A and HLA-B at low resolution is highly accurate specific and reliable. Tissue Antigens 55:352–358.
33. Hurley, C. K., L. A. Baxter-Lowe, B. Logan, C. Karanes, C. Anasetti, D. Weisdorf, and D. L. Confer. 2003. National Marrow Donor Program HLA-matching guidelines for unrelated marrow transplants. Biology of Blood and Marrow Transplantation 9: 610–615.
34. Hurley, C. K., J. A. Wade, M. Oudshoorn, D. Middleton, D. Kukuruga, C. Navarette, F. Christiansen, J. Heglund, E. C. Ren, I. Anderson, S. A. Cleaver, C. Brautbar, C. Raffoux. 1999. A special report: histocompatibility testing guidelines for hematopoietic stem cell transplantation using volunteer donors. Human Immunol. 60:347–360.
35. Hurley, C. K., J. Hegland, M. A. Fernández-Vina, M. Maiers, A. Lazaro, R. J. Hartzman, K. Cao, J. Ng, M. Janzen, and M. Setterholm. 2003. Designing a typing system for a hematopoietic stem cell registry. In: HLA 2002: Immunobiology of the Human MHC. J. A. Hansen and B. Dupont, eds. IHWG Press, Seattle, WA.
36. Hurley, C. K., M. Setterholm, M. Lau, M. S. Pollack, H. Noreen, A. Howard, M. Fernandez-Vina, D. KuKuruga, C. R. Muller, M. Venance, J. A. Wade, M. Oudshoorn, C. Raffoux, J. Enczmann, P. Wernet, and M. Maiers. 2004. Hematopoietic stem cell donor registry strategies for assigning search determinants and matching relationships. Bone Marrow Transplantation 33:443–450.
37. Anthony Nolan HLA nomenclature. Available at: http://www.anthonynolan.org.uk/HIG/nomen/nomen_index.html.
38. Imanishi, T., T. Akaza, A. Kimura, K. Tokunaga, and T. Gojobori. 1992. Allele and haplotype frequencies for HLA and complement loci in various ethnic groups. In: HLA 1991. Volume 1. K. Tsuji, M. Aizawa, and T. Sasazuki, eds. Oxford University Press, New York, pp. 1065–1220.
39. Janeway, C., P. Travers, M. Walport, and M. Shlomchik. 2005. Immunobiology, 6th edition. New York: Garland Publishing.
40. Klein, J., and A. Sato. 2000. The HLA system. First of two parts. N. Engl. J. Med 343:702–709.
41. Klein, J., and A. Sato. 2000. The HLA system. Second of two parts. N. Engl. J. Med 343:782–786.
42. Klitz, W. 2004. Resolution of testing for disease/anthropology studies—how do statistics impact the typing strategy? In: HLA 2002: Immunobiology of the Human MHC. J.A. Hansen and B. Dupont, eds. IHWG Press, Seattle, WA.
43. Klitz, W., M. Maiers, S. Spellman, L. A. Baxter-Lowe, B. Schmeckpeper, T. M. Williams, and M. Fernandez-Vina. 2003. New HLA haplotype frequency reference standards: high-resolution and large sample typing of HLA DR-DQ haplotypes in a sample of European Americans. Tissue Antigens 62:296–307.
44. Kollman, C., E. Abella, R. L. Baitty, P. G. Beatty, R. Chakraborty, C. L. Christiansen, R. J. Hartzman, C. K. Hurley, E. Milford, J. A. Nyman, T. J. Smith, G. E. Switzer, R. K. Wada, and M. Setterholm. 2004. Assessment of optimal size and composition of the U.S. National Registry of hematopoietic stem cell donors. Transplantation 78:89–95.
45. Kollman, C., et al. An Extended Version of the EM Algorithm to Estimate HLA-A, B, DRB1 Haplotype Frequencies Using a National Registry of Volunteer Donors, in preparation.
46. Little, A.-M., and P. Parham. 1999. Polymorphism and evolution of HLA class I and class II genes and molecules. Rev. Immunogenetics 1:105–123.
47. Lou C. D., et al. Histocompatibility testing by immunologic methods: humoral assays. In: N. R. Rose, E. Conway de Macario, J. D. Folds, et al., eds. Manual of Clinical Laboratory Immunology. Washington, DC: ASM Press; 1997:1087–1097.
48. Maiers, M., G. M. T. Schreuder, M. Lau, S. G. E. Marsh, M. Fernandez-Vina, H. Noreen, M. Setterholm, and C. K. Hurley. 2003. Use of a neural network to assign serologic specificities to HLA-A, -B and -DRB1 allelic products. Tissue Antigens 62: 21–47.
49. Maiers, M., C. K. Hurley, L. Perlee, M. Fernandez-Vina, J. Baisch, D. Cook, P. Fraser, U. Heine, S. Hsu, M. S. Leffell, D. Maurer, H. Noreen, T. Tang, M. Trucco, S. Y. Yang, N. Yu, R. J. Hartzman, M. Setterholm, T. Winden, D. Shepherd, and J. Hegland. 2001. Maintaining updated DNA-based HLA assignments in the National Marrow Donor Program bone marrow registry. Rev. Immunogenetics 2:449–460.
50. Marsh, S. G. E., E. D. Albert, W. F. Bodmer, R. E. Bontrap, B. Dupont, H. A. Erlich, D. E. Geraghty, J. A. Hansen, B. Mach, W. R. Mayr, P. Parham, E. W. Petersdorf, T. Sasazuki, G. M. Schreuder, J. L. Strominger, A. Sveijgaard, and P. T. Terasaki. 2002. Nomenclature for factors of the HLA system, 2002. Tissue Antigens 60:407–464.
51. Middleton, D. 1999. History of DNA typing for the human MHC. Rev. Immunogenetics 1:135–156.
52. Mori, M., P. G. Beatty, M. Graves, K. M. Boucher, and E. L. Milford. 1997. HLA gene and haplotype frequencies in the North American population—The National Marrow Donor Program Donor Registry. Transplantation 64:1017–1027.
53. Mori, M., M. Graves, E. L. Milford, and P. G. Beatty. 1996. Computer program to predict likelihood of finding an HLA-matched donor: methodology, validation, and application. Biol. Blood Marrow Transplant. 2:134–144.
54. Morishima, Y., T. Sasazuki, H. Inoki, T. Juji, T. Akaza, K. Yamamoto, Y. Ishikawa, S. Kato, H. Sao, H. Sakamaki, K. Kawa, N. Hamajima, S. Asano, and Y. Kodera. 2002. The clinical significance of human leukocyte antigen (HLA) allele compatibility in patients receiving a marrow transplant from serologically HLA-A, HLA-B, and HLA-DR matched unrelated donors. Blood 99:4200–4206.
55. Muller, C. R. 2003. Computer applications in the search for unrelated stem cell donors. Transpl.Immunol. 10:227–240.
56. Müller, C. R., G. Ehninger, and S. F. Goldman. 2003. Gene and haplotype frequencies for the loci HLA-A, HLA-B, and HLA-DR based on over 13,000 German blood donors. Human Immunology 64:137–151.
57. Mytilineos, J., M. Lempert, S. Scherer, V. Schwarz, and G. Opelz. 1998. Comparison of serological and DNA PCR-SSP typing results for HLA-A and HLA-B in 421 black individuals—a collaborative transplant study report. Human Immunology 59:512–517.
58. Navarrete, C. High Throughput Systems for HLA Typing Bone Marrow and Cord Blood Donors of the British Bone Marrow Registry. In: HLA 2002: Immunobiology of the Human MHC. J. A. Hansen and B. Dupont, eds. IHWG Press, Seattle, WA.
59. Noreen, H. J., N. Yu, M. Setterholm, M. Ohashi, J. Baisch, R. Endres, M. Fernandez-Vina, U. Heine, S. Hsu, M. Kamoun, Y. Mitsuishi, D. Monos, L. Perlee, S. Rodriguez-Marino, S. Smith, S. Y. Yang, K. Shipp, J. Hegland, and C. K. Hurley. 2001. Validation of DNA-based HLA-A and HLA-B testing of volunteers for a bone marrow registry through parallel testing with serology. Tissue Antigens 57:221–229.
60. Ng, J., C. K. Hurley, C. Carter, L. A. Baxter-Lowe, D. Bing, M. Chopek, J. Hegland, T. D. Lee, T. C. Li, S. Hsu, D. KuKuruga, J. M. Mason, D. Monos, H. Noreen, G. Rosner, B. Schmeckpeper, B. Dupont, and R. J. Hartzman. 1996. Large-scale DRB and DQB1 oligonucleotide typing for the NMDP registry: progress report from year 2. Tissue Antigens 47:21–26.
61. Ottinger, H. D., C. R. Muller, S. F. Goldmann, E. Albert, R. Arnold, D. W. Beelen, R. Blasczyk, D. Bunjies, J. Casper, W. Ebell, G. Ehniger, T. Eierman, H. Einsele, A. Fauber, S. Ferencik, J. Finke, B. Hertenstein, A. Heyell, T. Klingebiel, A. Knipper, B. Kremens, H. J. Kolb, K. Kolbe, E. Lenartz, M. Lindemann, C. A. Muller, J. Mytilineos, D. Wiederweiser, J. Runde, H. Sayer, U. W. Schaefer, W. Schmitz, S. Schroder, R. Schalze-Roth, R. Schwerdtfeger, W. Siegert, B. Thiele, A. R. Zander, and H. Grosse-Wilde. 2001. Second German consensus on immunogenetic donor search for allotransplantation of hematopoietic stem cells. Ann Hematol 80:706–714.
62. Ottinger, H. D., V. Rebmann, K. A. Pfeiffer, D. W. Beelen, B. Kremens, V. Runde, U. W. Schaefer, and H. Grosse-Wilde. 2002. Positive serum crossmatch as predictor for graft failure in HLA-mismatched allogeneic blood stem cell transplantation. Transplantation 73:1280–1285.
63. Oudshoorn, M., A. van Leuuwen, H. G. v.d. Zanden, and J. J. van Rood. 1994. Bone Marrow Donors Worldwide: a successful exercise in international cooperation. Bone Marrow Transplant 14:3–8.
64. Parham, P., and K. L. McQueen. 2003. Alloreactive killer cells: hindrance and help for haematopoietic transplants. Nat Rev Immunol 3:108–122.
65. Petersdorf, E. W., C. Anasetti, P. J. Martin, and J. A. Hansen. 2003. Tissue typing in support of unrelated hamatopoietic cell transplantation. Tissue Antigens 61:1–11.
66. Petersdorf, E. W., J. A. Hansen, P. J. Martin, A. E. Woolfrey, M. Malkki, T. Gooley, B. Storer, E. Mickelson, A. Smith, and C. Anasetti. 2001. Major-histocompatibility-complex class I alleles and antigens in hematopoietic-cell transplantation. N. Engl. J. Med. 345:1794–1800.
67. Ramos, M., and J. A. Lopez de Castro. 2002. HLA-B27 and the pathogenesis of spondyloarthritis. Tissue Antigens 60:191–205.
68. Rhodes, D. A., J. Trowsdale. 1999. Genetics and molecular genetics of the MHC. Rev. Immunogenetics 1:21–31.
69. Robinson, J., M. J. Waller, P. Parham, J. G. Bodmer, and S. G. E. Marsh. 2001. IMGT/HLA database—a sequence database for the human major histocompatibility complex. Nucleic Acids Res. 29:210–213.
70. Schaffer, M., A. Aldener-Cannava, M. Remberger, O. Ringden, and O. Olerup. 2003. Roles of HLA-B, HLA-C and HLA-DPA1 incompatibilities in the outcome of unrelated stem-cell transplantation. Tissue Antigens 62:243–250.
71. Schipper, R. F., M. Oudshoorn, J. D’Amaro, H. G. van der Zanden, P. De Lange, J. T. Bakker, J. Bakker, and J. J. Van Rood. 1996. Validation of large data sets, an essential prerequisite for data analysis: an analytical survey of the Bone Marrow Donors Worldwide. Tissue Antigens 47:169–178.
72. Schipper, R. F., J. D’Amaro, J. T. Bakker, J. J. Van Rood, and M. Oudshoorn. 1997. HLA gene and haplotype frequencies in bone marrow donors worldwide registries. Human Immunology 52:54–71.
73. Schreuder, G. M. Th., C. K. Hurley, S. G. E. Marsh, M. Lau, M. Maiers, C. Kollman, and H. J. Noreen. 2001. The HLA dictionary 2001: a summary of HLA-A, -B, -C, -DRB1/3/4/5, -DQB1 alleles and their association with serologically defined HLA-A, -B, -C, -DR, and -DQ antigens. Human Immunology 62:826–849.
74. Shaw, B. E., M. N. Potter, N. P. Mayor, A. L. Pay, C. Smith, J. M. Goldman, H. G. Prentice, S. G. Marsh, and J. A. Madrigal. 2003. The degree of matching at HLA-DPB1 predicts for acute graft-versus-host disease and disease relapse following haematopoietic stem cell transplantation. Bone Marrow Transplant 31:1001–1008.
75. Smith, A. J. Quality Control in the HLA Typing Laboratory In HLA 2002: Immunobiology of the Human MHC. J. A. Hansen and B. Dupont, eds. IHWG Press, Seattle, WA.
76. Snell, G. D. 1992. Lecture for the Nobel Prize for Physiology or Medicine, 1980: Studies in histocompatibility. Scand. J. Immunol. 36:513–526.
77. Tang, T. F., J. Wang, R. Slack, Y.-S. Lin, L. Li, U. Heine, J. Ng, R. J. Hartzman, and C. K. Hurley. 2002. DRB1*03 diversity and DRB3 associations in five major population groups in the United States. Human Immunology 63:221–228. (example of allele frequency study)
78. Whitelegg, A., and L. D. Barber. 2004. The structural basis of T-cell allorecognition. Tissue Antigens 63:101–108.
79. World Marrow Donor Association. 2003. Donor Registries Annual Report 2002, 6th edition.
80. World Marrow Donor Association and NetCord. 2002. Unrelated Cord Blood Registries/Banks Annual Report 2001, 3rd edition.
81. Yeager, M., and A. L. Hughes. 1999. Evolution of the mammalian MHC: natural selection, recombination, and convergent evolution. Immunol. Rev. 167:45–58.
82. Zino, E., G. Frumento, S. Marktel, M. P. Sormani, F. Ficara, S. Di Terlizzi, A. M. Parodi, R. Sergeant, M. Martinetti, A. Bontadini, F. Bonifazi, D. Lisini, B. Mazzi, S. Rossini, P. Servida, F. Ciceri, C. Bonini, E. Lanino, G. Bandini, F. Locatelli, J. Apperley, A. Bacigalupo, G. B. Ferrara, C. Bordignon, and K. Fleischhauer. 2004. A T-cell epitope encoded by a subset of HLA-DPB1 alleles determines nonpermissive mismatches for hematologic stem cell transplantation. Blood 103:1417–1424.


