
9
Medical Screening
In this chapter and the next, the committee turns to issues of screening in the context of the Radiation Exposure Screening and Education Program (RESEP), which is administered by the Health Resources and Services Administration (HRSA) in the Department of Health and Human Services. The broader framework is the role that RESEP plays relative to the Radiation Exposure Compensation Act (RECA) and its amendments, as administered by the Department of Justice (DOJ).
HISTORICAL CONTEXT OF SCREENING IN RESEP
The original 1990 RECA legislation does not mention screening for the diseases it covers. The omission may have arisen because RECA’s primary purpose is compensation. The inaccessibility to services for determining eligibility for compensation led to a change in the original RECA statute, but Sec. 2, “Findings” of the RECA amendments of 2000, still does not explicitly mention screening. However, screening could be construed as implied in Congress’ sixth finding (Public Law 106-245 [S. 1515] July 10, 2000 Radiation Exposure Compensation Act Amendments of 2000 106 PL 245; 114 Stat. 501) that
it should be the responsibility of Federal Government in partnership with State and local governments and appropriate healthcare organizations, to initiate and support programs designed for the early detection, prevention and education on radiogenic diseases in approved States to aid the thousands of individuals adversely affected by the mining of uranium and the testing of nuclear weapons for the Nation’s weapons arsenal. (emphasis added)
Sec. 4 of the RECA amendments gives an explicit requirement for screening. The HRSA administrator must make competitive grants available “for the purpose of carrying out programs to screen individuals described under section 4(a)(1)(A)(i) or 5(a)(1)(A) of the Radiation Exposure Compensation Act (42 U.S.C. 2210 note) for cancer as a preventative health measure” (PL 106-245 Sec. 417C(b)(1)) (emphasis added). In other words, RECA, as amended, does require cancer screening as a preventive health intervention for the purpose of early detection (CFR, Vol. 67, No. 83, page 21256).
To carry out that mandate, HRSA created RESEP and announced the first fiscal-year competitive application cycle on April 30, 2000, in the Federal Register. In its announcement, HRSA described the legislation as providing the authority for competitive grants for “individual cancer screening” (CFR, Vol. 67, No. 83, page 21257). Although the amended legislation might be read as linking screening to cancer, this CFR section provides for the “availability of $3.0 million to eligible entities for the purpose of carrying out programs to screen eligible individuals for cancer and other radiogenic diseases” (ibid) (emphasis added). Because RECA legislation covers both nonmalignant and malignant radiogenic diseases, RESEP is consistent with the overall intent of the amended RECA in not limiting screening to cancer.
HRSA charges its Bureau of Primary Health Care with administering the RESEP grant program. On May 2, 2002, and June 5, 2003, HRSA published a program information notice providing guidance to potential grantees about the RESEP competitive process. This guidance includes eligibility requirements, program expectations, review criteria, and award factors for the grants.
RESEP grantees are expected to pursue multiple core activities: education, screening and early detection, referrals for medical treatment, eligibility assistance, quality assurance, staffing, data collection, finance, performance reports, and outreach. We examine only the screening and early detection component here.
Screening and Early Detection in RESEP
HRSA treats screening and early detection as a single activity. The notice did distinguish between nonmalignant and malignant radiogenic diseases. RESEP identifies basic screening protocols and differentiates basic screening and an array of steps collectively considered referrals for medical treatment (advanced testing, diagnosis, evaluation, and treatment), as follows:
Screening and early detection:
-
Basic screening protocols.
Referrals for medical treatment:
-
Advanced testing.
-
Diagnosis.
-
Evaluation.
-
Treatment.
Table 9.1 lists the HRSA requirements for a screening and early detection program with the basic screening protocols for both nonmalignant and malignant diseases as the agency categorized them. Not all the tests listed (in the table), however, detect clinical diseases and processes that have been associated scientifically with exposure to radiation.
Referrals for Medical Treatment
If basic screening protocols reveal abnormalities in patients, then the providers must refer the patients to a hospital, a special clinic or an imaging center, or doctor’s office for advanced testing. Table 9.2 elucidates what HRSA means by advanced testing
THE NATURE OF SCREENING
For our purposes, screening is of at least two different types: (1) screening for medical reasons, with the underlying purpose of improving health outcomes; and (2) screening to identify persons who may be eligible for compensation under RECA. This committee distinguishes these two concepts with respect to the underlying purposes of RESEP, using medical screening for the former and compensational screening for the latter. This distinction is not traditional but is required because RESEP specifies screening for some diseases not traditionally recommended for medical screening to improve health outcomes. Because a term is required to describe this RESEP concept, we coin the term compensational screening.
This chapter is concerned largely with epidemiologic and statistical factors related to medical screening, the limitations of medical screening, and the implications for screening in RESEP. We comment as well on future research, and we introduce issues that extend beyond the purely technical questions of screening itself. Chapter 10 discusses these findings in the context of RECA and RESEP, which are oriented more toward compensation than toward medical interventions.
Screening Definitions
Screening has numerous meanings. One general meaning is sifting or filtering objects to separate what is wanted or desirable from what is not, as when a miner during the Alaskan gold rush screened for gold. In medical contexts, screening is commonly directed at groups of individuals who are asymptomatic, using relatively speedy, inexpensive tests and procedures. Such screening is
TABLE 9.1 Screening Protocols in RESEP
|
Screening Protocols |
Compensable Nonmalignant Radiogenic Diseases |
Compensable Malignant Radiogenic Diseases |
|
Medical and occupational history |
Must include date of exposure, place, duration of employment, and tobacco use |
Must include date of exposure, place, duration of employment; special attention to symptoms of and risk factors for primary cancers or other diseases covered by RECA; should also include tobacco, alcohol, and caffeine use |
|
Physical examination |
Emphasis on pulmonary, cardiovascular, and renal systems |
Complete examination to include all cancers covered by RECA |
|
Chest radiography |
Standard posterior-anterior view chest radiograph for presence of radiologic fibrosis, silicosis, or pneumoconiosis |
As indicated by physician |
|
Pulmonary-function testing |
As needed, can include spirometry, lung volumes, arterial blood gases, and DLCOa |
See physical examination |
|
Routine testing |
Other routine laboratory work and electrocardiography as required |
Routine laboratory work as indicated by physician |
|
Other Program Requirements Included in Screening and Early Detection |
|
|
|
Followup |
Patient contact via telephone; report results to patient, primary care physician, or both; periodic re-evaluation |
See case management below |
|
Case management |
Not required |
Extensive followup to ensure that care was received; documented monitoring of patient progress; all operative, consultative, procedural, and pathology reports and physician, hospital, and healthcare facility discharge summaries maintained |
|
aDLCO, the diffusing capacity of the lung for carbon monoxide (CO), i.e., measurement of carbon monoxide transfer from inspired gas to pulmonary capillary blood (American Thoracic Society, 1995). |
||
TABLE 9.2 Advanced Testing Protocols in RESEP
|
Advanced Testing for Compensable Nonmalignant Radiogenic Diseases |
Advanced Testing for Compensable Malignant Radiogenic Diseases |
|
|
generally intended to distinguish people with some undiagnosed and even unsuspected ailment or pathologic condition from those who are well (at least with respect to that ailment or condition). Screening may also be used to detect risk factors for disease that may give individuals a higher than average probability of illness; it may also be directed at individuals who are known or suspected to have risk factors.
Typically, medical screening is directed at large numbers of apparently well individuals (for example, the public at large) with the aim of finding those who have undiagnosed problems, genetic traits, or other characteristics that may benefit from medical intervention. The underlying assumption is that early detection can improve outcomes through early treatment or changes in lifestyle. Screening is used to facilitate appropriate care early in a disease, before serious signs, symptoms, or complications develop. An Institute of Medicine (IOM) committee stated that such screening for cancer “refers to the early detection of cancer or premalignant disease in persons without signs or symptoms suggestive of the target condition (the type of cancer that the test seeks to detect)” (IOM, 2003b, p. 156). Positive results from screening tests are usually not conclusive, so confirmatory tests are needed before a diagnosis is established; if such a diagnosis is made, then followup, referral, and treatment would typically be expected to ensue.
Other terms are sometimes used in conjunction with or as synonyms for medical screening. Among them are case-finding and early detection, although these terms have not been used with total consistency.
The distinction rests on whether such testing is done in the context of an established provider-patient relationship. We use patient screening to refer to testing within such a relationship and case-finding if the person screened and the testing program or provider have no established relationship. Thus, this distinction refers to the context of the screening program. Much of the discussion in this chapter and the rest of this report applies to both contexts. When what we say refers properly to both contexts, we simply use the term screening.
PRINCIPLES OF SCREENING
Basic Tenets
Several principles should guide an analysis of screening and case-finding, whether for medical purposes, for compensation, or both.
First, screening asymptomatic individuals presumes that efficacious and effective therapies exist for treating the disease either in its early (preclinical) stages or at later stages upon clinical detection (that is, upon diagnosis in patients with signs or symptoms). If that is not the case, then either screening is needless or treatment should await clinical detection.
Second, screening always carries some risk of harm. These risks arise from the tests themselves, from diagnostic labeling (whether accurate or not), and from false-positive results that lead unnecessarily to further tests and possibly therapeutic interventions. These risks or harms must be balanced against the assumed benefits of screening. This balancing is especially important because medical tests almost always carry a risk of physical, social, or psychological harm; in the RESEP context, these harms must be weighed against the possibility of compensation. At low probabilities of disease, screening engenders substantial risk of false-positive results and their consequences. Screening for more than one disease amplifies that problem. Screening for one disease using multiple tests is also problematic.
Third, particularly for compensational purposes, medical screening tests are appropriate only after the individuals are fully informed of the risks that these tests pose (see Chapter 8).
Fourth, screening may provide useful information about related diseases. One example is screening for diabetes among people who have high blood pressure or high blood lipid concentrations but not symptoms or signs of diabetes (Harris et al., 2003); positive results of diabetes screening (especially impaired glucose tolerance or impaired fasting glucose) may call for changes in the management of the other conditions (perhaps more than for the possible diabetes itself).
Fifth, if publicly supported screening programs are to be effective, ethical, and equitable, some means must be available for screened populations to gain access to appropriate followup, diagnosis, and therapy.
Sixth, once a person is screened, he or she should, in general, be informed of any clinical information that the test revealed. Screening, even for compensational purposes, may provide information that should be linked to actions that might improve the medical situation for the person screened. Once screening for compensational purposes has been done, the patient has already been exposed to the risks of the test and of a possibly false-positive result. Having undertaken this risk, the screened individual should have the opportunity to receive whatever medical benefit such information might provide.
Stated another way, in general once a person is screened, he or she should be informed of any clinical information that the test revealed. In most medical circumstances, withholding incidentally discovered information would be unethical (see Chapter 8). This principle, however, must also reflect some sensitivity to the screened individual’s culture, background, and preferences for receiving information (especially bad information). Individuals of different cultural backgrounds evince different preferences for information (Blackhall et al., 1995). For example, traditional Navajo culture takes a worldview that language shapes reality and that revealing negative information (truth telling) may “cause” those bad outcomes to occur. Moreover, an important element of traditional Navajo culture is to think and speak in a positive way and to avoid thinking or speaking in a negative way (Carrese and Thodes, 1995; Gostin, 1995).
Seventh, screening programs must use reliable and valid tests and procedures. Of particular importance are sensitivity, specificity, and positive and negative predictive values. Increasingly, policy makers, clinicians, and others concerned with screening issues are called on to deal with odds ratios, likelihood ratios, and receiver operating characteristic (ROC) curves.
Eighth, in specific populations, judgments about the feasibility of screening must consider access to health care and health insurance.
To summarize, for general screening to be useful on a population basis, certain circumstances must exist (Frame and Carlson, 1975; Eddy, 2004):
-
The condition must be present in the population and have an important effect on the quality and length of life.
-
The incidence of the condition must be sufficient to justify the risks of the screening.
-
Acceptable methods of treatment or prevention in the preclinical or early stage of disease must be available.
-
The condition must have an asymptomatic period during which detection and treatment would substantially improve clinical outcomes, such as reducing morbidity or mortality.
-
A screening protocol or test that is sufficiently accurate and acceptable to patients and that has reasonable costs must be available to detect the condition in the asymptomatic period.
-
The benefits of screening must exceed its harms.
-
The benefits of a screening program must justify its costs (including its induced costs) and its use of resources.
-
The health care system must be able to provide referral services that address followup (further evaluation and continuing care) of patients identified by screening.
-
Patients who choose to participate must be fully informed of the risks posed by screening and the benefits of screening and freely consent to be screened.
Applications to RESEP
The committee believes that in the RECA-RESEP legislation screening aims principally not at diagnosing and treating patients but rather at facilitating compensation for the harms caused by uranium mining and related activities and by the aboveground nuclear tests of the 1950s (discussed in Chapters 2 and 7). Although the legislation speaks to screening for the purpose of improving medical outcomes, early diagnosis of the majority of diseases identified for RESEP screening (such as lung cancer, pancreatic cancer, and ovarian cancer) improves health outcomes little or not at all. Furthermore, the current RESEP screening protocols include tests, such as pulse oximetry and spirometry, that have not been shown to improve health outcomes in asymptomatic populations.
Most tests used for screening are also those used to establish a medical diagnosis. When a patient’s signs or symptoms are the reasons, or part of the reason, for using a given test, the procedure is more properly called medical diagnosis than screening. The hallmark of a screening program is identification of preclinical (that is, undiagnosed) disease. Patients or populations that are screened do not have clinical evidence of disease or, if they do, then neither the patients nor their health care providers have yet appreciated that evidence. The target for which the screening is undertaken can be a propensity or risk factor (presumably modifiable) for developing a disease, a disease itself, or a complication of a disease that the patient is known to have. For convenience and readability, we use the term disease to refer to all three entities.
In many screening scenarios, the likelihood of the disease that the screening program seeks to identify is relatively low (low pretest probabilities). Moreover, most tests and screening protocols are imperfect in that their specificity is less than 100% (meaning that their ability to rule out disease is not infallible). Because of those two factors, screening can produce substantial numbers of false-positive results; depending on the aftermath of screening when false-positive results occur, the potential benefits of screening may be decreased (or may even not outweigh the risks of error). Because screening tests commonly have sensitivity below 100%, false-negative results will also occur, but these errors may be far less problematic in the screening setting (see discussion later in this chapter). Nonetheless, a negative screening test does not
guarantee that the patient does not have the disease, risk factor, or condition being sought.
As discussed later in this chapter, a tradeoff often exists between false-positive and false-negative results. Typically, for a given test, altering the test or its interpretation to decrease one of these errors will increase the other. Thus, establishing the criterion for or definition of a positive test result requires well-reasoned balancing of the consequences of each kind of potential error and the frequency of the disease in the population to be screened.
CONTEMPORARY SCREENING PROTOCOLS
General Issues
Many groups have explored traditional medical screening, especially screening for various forms of cancer. Among the authoritative sources are the US Preventive Services Task Force (USPSTF) (Harris et al., 2001; http://www.ahrq.gov/clinic/uspstfix.htm) and (until mid-2004) the Canadian Task Force for Preventive Health Care. Appendix E presents current information on cancer screening tests of interest to this committee; some are for RECA-designated diagnoses and others for nonradiogenic cancers; as a more complete context for considering medical screening in primary care, we also present there a fuller account of the types of screening tests the USPSTF recommends or strongly recommends for general populations other than RECA populations. As seen in Appendix E, relatively few screening tests for cancer have been recommended for widespread use. The limited number or nature of such recommendations turns on several issues.
In many instances, no effective treatment for preclinical disease exists or a treatment appears more effective than it truly is. A common issue that arises here is lead time bias, which refers to an apparent improvement in survival if survival is measured from the detection of disease and not from the onset of disease. Some authors argue that such early identification can be beneficial even if overall survival is unchanged, because a patient and his or her family might be able to plan better for the patient’s limited lifetime. A common counterargument is that such early labeling of a patient as having cancer (or another serious ailment) may diminish quality of life during the lead time. The benefit or the loss is surely very patient-specific. Thus, screening should be predicated on extensive counseling and informed consent for both practical and ethical reasons.
The effectiveness of a treatment can be overestimated because of length bias, which refers to the fact that disease that develops more slowly (such as a slow-growing or relatively benign cancer) may be more likely to be detected by a screening test, whereas a rapidly progressive disease is more likely to present clinically. These patterns mean that a substantial proportion of disease that is found on screening (as contrasted with disease that presents clinically with signs
or symptoms) will be, on average, less aggressive. Sometimes, screening might detect disease that might never become clinically evident. This problem is well recognized when screening for cancers of the prostate, lung, thyroid, and brain; in fact, the term “incidentaloma” is sometimes used to describe the detection of such disease. The patients detected by screening have an excellent prognosis, of course. Such patients inflate survival rates for patients with disease identified by screening but overall unnecessarily consume society’s resources and generate unreasonable anxiety and potential complications for the patient without substantial benefit.
Another common reason that cancer-screening programs receive unfavorable recommendations rests on the occurrence of false-positive results (or, said another way, on the imperfect specificity of almost all medical tests). Because clinicians must inform patients about each positive result and because they often recommend additional diagnostic studies, such false-positive results carry substantial risks. They include the risk of physical harm during the additional studies (the workup, which not infrequently can involve invasive diagnostic testing). Other issues include psychologic harm (from anxiety and from labeling, insofar as patients consider themselves as “damaged goods” and societal harm and discrimination (in employability and insurability). The same psychologic and societal harms may affect family members as well. In addition, identifying disease that benefits little from treatment (lung or pancreatic cancer, for example) can lead to futile surgery, which can engender major costs, pain, disability (from reduced lung volume in the case of pulmonary neoplasms), and surgical mortality.
Although most screening tests are themselves of low risk and noninvasive, some screening tests expose individuals to ionizing radiation. Such exposure itself can be oncogenic (cancer-causing). Recently, investigators have calculated that the oncogenic risks posed by some radiographic studies outweigh potential benefits from screening (Brenner and Elliston, 2004).
The third common reason for unfavorable recommendations about medical screening has rested (openly or covertly) on economic arguments. Our world of limited resources is increasingly constrained with respect to health care and faces many competing demands. Thus, committees that produce clinical practice guidelines, insurers that fund medical care, and even providers that treat individual patients may consider the relatively high cost of some proposed screening programs in light of other uses to which the resources might be applied (the opportunity costs of health care services forgone). Whether these issues are dealt with formally or informally is a matter for the groups in question, but all decision-makers need to consider how best to deal with such tradeoffs in resource-constrained circumstances.
The economic cost incurred as a result of false-positive tests is important. One recent article documents that a large proportion of persons screened for cancer (43%, higher among men than among women) had at least one false-
positive result, and more than four of five of these patients had followup care (Lafata et al., 2004). Medical costs in the year after the screening were statistically significantly higher among those with false-positive tests than among those with negative tests (on average, about $1,000 higher).
The economic costs of a screening program thus extend well beyond the screening test itself. They include the required infrastructure for providing the test and the followup for abnormal results, the counseling that must be undertaken before the screening test is performed and when informing patients about abnormal results, and the choices they then must make. (Note that we use the term patients here for both patient screening and for case-finding because, even in the latter context, once clinicians inform individuals about an abnormal result, they become patients and require a provider-patient relationship.) Economic costs of the screening program must also include the costs of the therapeutic or preventive intervention to be undertaken in patients whose positive results are confirmed. In settings in which the benefit of treating a patient with a disease that has been detected early is small, therapeutic costs may not be economically reasonable for society to undertake.
Prevalence and Benefit
In assessing the therapeutic benefit of a screening program, one must consider the perspective of the population that is screened, not the subpopulation that is identified as having disease and then treated because of the program. In the population to be screened, disease prevalence can markedly limit benefit.
Consider a screening program for a single cancer for which early detection provides a huge therapeutic benefit of 10 years of added life expectancy, as illustrated in Table 9.3. Assume that a screening test has a high sensitivity of 90% and that the prevalence of disease in the population to be screened is 2 cases per 1,000 individuals. Further assume (theoretically) that the screening test has perfect specificity (100%—a positive result is pathognomonic of disease). In a population of 10,000 patients screened, 20 will have the cancer and 18 will be identified and treated early. These 18 patients will gain 180 years overall (10 years of life per patient detected). The 20 patients who have cancer will, on average, gain only 9 years of life (180/20). The 10,000 patients who
TABLE 9.3 Effect of Perspective on Benefit of Good Treatment
|
Group |
Years of Life Saved |
Number of Individuals |
Gain per Individual |
|
Patients identified |
180 |
18 |
10 years |
|
Individuals with disease |
180 |
20 |
9 years |
|
Screened individuals |
180 |
10,000 |
0.018 years = 6.6 days |
are screened will gain, on average, only 0.018 years, or 6.6 days of life, per patient screened.
All persons screened are subjected to the risks posed by testing and costs of this testing. Thus, decisions about implementing screening programs must include a comparison of the (perhaps large) benefits to the few persons with disease to the much smaller benefits that would accrue, on average, to all persons screened and to the far more numerous risks and costs that would accrue to patients free of disease. Of course, the details would depend on the magnitude of those benefits, risks, and costs.
Issues Related to Cancer Screening
For all these reasons, relatively few cancer screening programs have been endorsed in toto; of those endorsed, many are typically constrained to particular age groups or categories defined by other risk factors or variables. Annual screening for cervical cancer was long a standard of care (see Appendix E), but annual testing in low-risk women who have had several prior negative tests is no longer thought to be necessary in many settings. Mammography has been shown to detect breast cancer early enough for outcomes to be improved, but the frequency of such screening and the age at which it should begin (or end) have engendered much discussion. Colonoscopy has been shown to be effective in finding colon cancer early enough to improve prognosis; it may even be a preventive measure if premalignant lesions (adenomas) are removed before they evolve into cancer. However, some debate remains about whether colonoscopy will remain the first choice for colorectal cancer screening—especially if costs are taken into account (Pignone et al., 2002).
A particularly thorny example that has been carefully examined in the literature involves routinely screening men for prostate cancer with the serum prostate-specific antigen (PSA) test (Harris and Lohr, 2002). This protocol is controversial for several reasons. First, more prostate cancers are slow-growing than fast-growing (aggressive), and many more men die with prostate cancer than of prostate cancer. Second, the PSA test has a substantial false-positive rate; most men who get a positive (abnormal) PSA test will get further workup (such as biopsy), but because biopsies may not reliably distinguish between slow- and fast-growing cancers, most men will receive treatment. Finally, standard treatments (such as surgery and radiation) have substantial morbidity (such as impotence and incontinence). Recent studies have raised the issue of false-negative results, the occurrence of histologically proven cancer in men with low serum PSA (Thompson et al., 2004). For these reasons, some groups have recommended PSA screening only after extensive discussion with each patient. This view reflects the ethical principles introduced in Chapter 8 and the tenets of shared decision-making taken up later in this chapter. Similar issues arise in medical screening for most RECA-compensable diseases
(although the negative consequences on patients’ quality of life have not been as carefully studied) because most patients with those diseases have not been shown to derive substantial health benefit from screening.
Routine screening of asymptomatic individuals for lung cancer, pancreatic cancer, ovarian cancer, gastric cancer, and many other conditions in the RECA has not been recommended (see Appendix E). More directly related to the RESEP program is an IOM committee’s recommendation against routine screening for thyroid cancer in populations downwind of the Nevada Test Site (NTS) (IOM-NRC, 1999).
EPIDEMIOLOGIC, STATISTICAL, AND CLINICAL ISSUES OF SCREENING TESTS
The complexities of interpreting the risks posed by and the results of screening tests (whether in general or for RESEP) are not widely understood. To address the gap, we present a brief primer to assist policy-makers, clinicians, and potential screenees in evaluating the desirability and feasibility of the types of medical screening or case-finding implemented by or contemplated for RESEP. This material, only hinted at in the committee’s interim report, forms a critical basis of our later recommendations about screening. We hope that this material will be useful to anyone considering obtaining any screening test.
Probabilities, Odds, Prevalence, and Incidence
To interpret the meaning of any test result, one must know what the likelihood of disease was in an individual before the result if that test was known. One can estimate a pretest likelihood in many ways: from a clinical study, from a database, from a prediction rule or a logistic regression equation, or on the basis of clinical judgment. When it is taken from an epidemiologic study of a population of presumably similar individuals, it is often called prevalence. It represents an estimate in a population at a given time (see Chapter 3).
If the individual to be screened was known to be free of the disease at some time in the past (that is, if the individual has had a negative screening test N years before), then the relevant pretest likelihood is the incidence of (newly diagnosable but undiagnosed) disease in those N years. If disease incidence in a population of similar individuals were Y cases per year, then one would expect the pretest probability of disease to be its interval incidence or 1 − e−YxN, if we ignore those individuals who present clinically or who have died (of any cause) in the interim. If both Y and N are small, then the interval incidence can be approximated by Y × N.
As explained in Chapter 4, probabilities of disease can also be expressed in terms of odds (omega, Ω), which are more convenient for some calculations. Odds are the number of persons with an event or feature divided by the number
without the event or feature—that is, the ratio of positive to negative outcomes that are either observed or predicted. Probability (a proportion) and odds (a ratio) can be easily converted to each other through simple formulas: if p is a probability and if Ω is the corresponding odds, then ![]() .
.
What Is a Positive Screening Test?
Throughout this chapter and this report, we use the terms positive and abnormal to describe a test result. We consider here how those terms might be defined.
Many laboratory tests produce quantitative results, such as a hematocrit of 33%, a PSA of 5 nanograms per milliliter (ng/ml), or an oxygen saturation of 80%. Such results are often categorized as either normal or abnormal on the basis of a defined normal range or some criterion of positivity. Even imaging studies can have an associated threshold criterion of detection; for example, one might choose to report as abnormal a thyroid ultrasonographic examination or a helical chest computed-tomography scan with a nodule greater than 3 mm in diameter but choose not to report smaller lesions, perhaps because they are unlikely to be meaningful.
Some laboratories define the normal range for each test they perform according to results in a population free of known disease. Many such test results are normally distributed; the so-called normal range is the mean plus or minus two standard deviations. Such definitions of normality, however, ignore the distribution of test results in patients with a given disease. In most circumstances, the distributions of results in patients with disease and in healthy patients overlap. In these cases, any criterion of positivity means that some patients free of disease will have an abnormal result (a false positive); conversely, some patients with disease will have a normal result (a false negative).
Moreover, many tests provide information on more than a single disease. That means that a single rational, mathematically proper criterion of optimization (a tradeoff of false-positives and false-negatives results) may not be possible to design. In such circumstances, laboratories are most likely to report a normal range.
In Figure 9.1 and later figures, we display a probability density distribution (vertical axis) of test results (horizontal axis) for different populations. In Figure 9.1, the populations represent patients with no disease, patients with disease 1, and patients with disease 2. We display patients with no disease along a negative vertical axis to provide visual separation from the populations with disease.1
In all three distributions, the greater the distance from the horizontal (zero) axis, the higher the probability. The two vertical lines delineate the normal range,
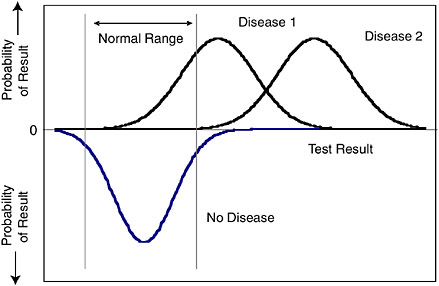
FIGURE 9.1 Probability distributions of laboratory normal range and two diseases.
here set as the mean plus or minus two standard deviations in the normal population, encompassing 95% of patients without disease. The number of individuals with disease 1 and disease 2 who have an abnormal test result (which is a result greater than or to the right of the upper cutoff) will depend on the overlap of the distributions of results in disease 1 and disease 2 and the normal population. Such laboratory-based definitions of normality may create different degrees of overlap for different diseases.
When one reports quantitative test results of this type as either positive or negative, one is discarding what could be useful information. For example, a PSA of 5 ng/ml carries different information about the likelihood of cancer of the prostate (apart from the issue of slow- or fast-growing disease) than does a PSA of 8 ng/ml. However, having a simple criterion of positivity allows clinicians to interpret the meaning of the result more readily in the context of a particular patient who may have a particular pretest likelihood of disease, which often will be based on clinical presentation, history, demographics, and even physical examination or other known test results.
With a criterion of positivity, the performance of a test can be described on the basis of two characteristics: sensitivity and specificity (Figure 9.2). Sensitivity describes a test’s performance in patients known to have disease; it is the likelihood of a positive result given disease. It is also known as the true-positive rate; the false-negative rate is its complement. Specificity describes a test’s performance in patients known not to have disease; it is the likelihood of a negative result given the absence of disease. It is also known as the true-negative rate; the false-positive rate is its complement.
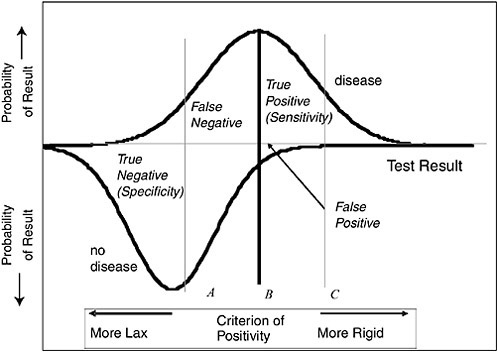
FIGURE 9.2 Probability distributions of diseases and test results.
Figure 9.2 displays test results on the horizontal axis, and the probability of a given test result on the vertical axis for patients with disease (going up) and patients with no disease (going down). The three vertical lines display three different potential cutoffs or criteria of positivity, A, B, and C. The heavy line B is a middle ground that represents a compromise between sensitivity and specificity.
The line to the left (A) represents a more lenient—“lax”—definition of positivity; this definition increases sensitivity (including a greater proportion of patients with disease to the right of the criterion) while decreasing specificity (including a greater proportion of patients without disease to the right of the criterion). The line to the right (C) represents a more strict—“rigid”—definition of positivity; this definition decreases sensitivity (including a smaller proportion of patients with disease to the right of the criterion) while increasing specificity (including a smaller proportion of patients without disease to the right of the criterion). Those performance characteristics can be transformed into a variety of interpretation aids, of which the receiver operator characteristic (ROC) curve is particularly useful.
The Receiver Operator Characteristic Curve for a Test
A critical question in interpreting screening tests is how and where to establish a criterion of positivity—that is, the cutoff (cutpoint) for that particular test as
being either positive (abnormal) or negative (normal). That is especially relevant in a screening situation in which the test is applied to many similar patients and the purpose of the test is to categorize patients into two subsets: those with positive results, who will be referred for evaluation or treatment (or both), and those with negative results, who will be reassured.
The optimal cutpoint depends critically on the extent to which the distributions of results in healthy individuals and in those with disease overlap. It also depends on several other factors, including the prevalence of disease in the population to be screened, the importance of early identification of individuals with disease (so that they might receive the benefit of early treatment or, in the case or RECA, compensation), and on the burden of falsely classifying healthy individuals as persons requiring further evaluation or treatment. Viewed from a different perspective, the benefit of early treatment is just an alternative way of expressing the burden of having treatment delayed.
These comparisons typically presume that a test is to be performed. The determination of an optimal cutpoint is applied to interpreting a test. If we broaden the decision problem to include whether to perform the test at all (Pauker and Kassirer, 1980), the situation becomes more complex. Although arguably the optimization decision should include that perspective, clinicians usually do not take that perspective when establishing a cutoff. More typically, clinicians select an optimal cutoff, thereby establishing the test’s operating characteristics, and only then do patients and clinicians choose whether to perform the test.
Typically, distributions of screening tests overlap. Often, the relationship between the false-positive rate and the true-positive rate is monotonic: increasing one increases the other. That relationship defines the ROC curve (Figure 9.3).
In Figure 9.3, the horizontal axis displays the false-positive rate for a given criterion of positivity; the vertical axis displays the true-positive rate corresponding to the same criterion of positivity. A perfect test (i.e., one for which the false-positive and false-negative rates are both zero) would have an ROC curve that rises along the vertical axis from the origin until the point corresponding to a true-positive rate of 1.0 and a false-positive rate of zero (upper left corner of the graph) and then passes to the right along the upper border of the graph to the upper right hand corner. The degree to which an ROC curve departs from this ideal is a measure of the general reliability of the test. This can be represented as the area between the test’s ROC curve and a 45 degree diagonal line corresponding to a test whose true-positive rate equals its false-positive rate for all possible cutoff criteria. Such a test would carry no information.
The three hypothetical criteria shown in Figure 9.2 correspond to the three points (A, B, and C) on the ROC curve in Figure 9.3. Criteria that are more lax (criteria toward the left in Figure 9.2) fall toward the upper right end of the ROC curve; criteria that are more strict (criteria toward the right in Figure 9.2) fall toward the lower left end of the ROC curve.
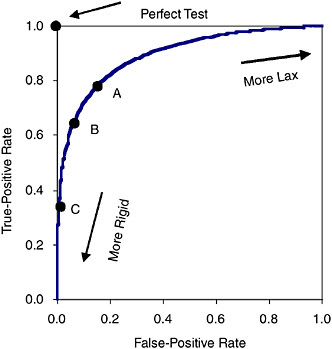
FIGURE 9.3 Receiver operating characteristic (ROC) curve.
For example, consider criterion C, which is rather strict. The area under the no-disease curve to the right of that line (the false-positive rate) in Figure 9.2 is roughly 1% and is plotted on the horizontal axis in Figure 9.3 as corresponding to point C. The area under the disease curve to the right of that line (the true-positive rate) in Figure 9.2 is roughly 35% and corresponds to the vertical axis value of point C in Figure 9.3.
The mathematics of optimization are complex (and discussed further in Appendix D). One can visually identify the optimal operating point (corresponding to the criterion of positivity or cut point that minimizes the combined burden of false-negative and false-positive results in a given population) as the point where the slope of the ROC curve (or its tangent) is numerically equivalent to
The burden of a false-positive result is defined as the degree to which an individual without disease but with a falsely positive test result is less well off (on some outcome scale) than a similar individual without disease but with a truly negative test result. Similarly, the burden of a false negative is defined as the degree to which an individual with disease but with a falsely negative test result
is less well off (on some outcome scale) than a similar individual with disease but with a truly positive test result.
In another formulation of the criterion for the optimal cutoff, the reciprocal of the slope of the ROC curve (or its tangent) should be numerically equivalent to the burden ratio. In this case, the reciprocal of the slope equals Ωdisease × BurdenRatio, where Ωdisease is the odds of disease and BurdenRatio is BurdenFalseNegative/BurdenFalsePositive. Some authors call the burden of a false-positive result the “cost of a false positive” (C) and the burden of a false-negative result the “benefit of a true positive” (B). This approach yields an optimal cutoff at the point on the ROC curve where the reciprocal of the slope equals Ωdisease × B/C, the benefit-cost ratio. The reason is that a false negative—a test that should have been positive—causes the loss of the benefit of a true positive (the ability to treat the disease early or in the case of compensational screening in RECA populations, the ability to successfully seek compensation).
At high benefits of early detection, high prevalence of disease, or low burdens of false-positive results, the ratio will be small and the best cutoff point will lie along the flat area to the right of the ROC curve, where both the true-positive and the false-positive rates are high. This point corresponds, in other words, to the spot at which the criterion of positivity is lax or toward the left in Figure 9.2. Conversely, at low benefits of early detection, low prevalence of disease, or high burdens of false-positive results, the ratio will be large, and the best cutoff point will lie along the steep area to the left of the ROC curve, where both the true-positive and the false-positive rates are low; this point corresponds, in other words, to the spot at which the criterion of positivity is rigid or toward the right in Figure 9.2.
Thus, as one considers medical screening tests for the RESEP populations, one should consider the prevalence of disease in each case. Doing so implies a program that is administratively far more complex than RESEP (or HRSA grantees) now follows. Nonetheless, for the specialized purposes of RESEP and the populations it is supposed to serve, establishing different criteria for test positivity in different populations or even in different geographic areas—for which prevalence rates of compensable disease might vary—might be scientifically more appropriate and ethically more defensible.
For example, in a geographic area with little fallout, an unusually high proportion of screenees would turn out to be false positives; in fact, if no case of compensable disease were detected, all the positives would be false positives. The costs of those false positives might pose a major challenge that might be mitigated by choosing a more rigorous criterion of positivity. Although in principle an analogous argument might be made about false negatives, the only way that a high proportion (or all) of the negatives could be false negative is for the prevalence of the RECA-compensable disease for which screening is undertaken to be very high, certainly higher than 50%. That circumstance would be quite unlikely.
Gold Standards
When we consider the performance of a diagnostic test in establishing the presence or absence of a disease, the underlying assumption is that, separate from the test in question, a “gold standard” (sometimes called a reference standard) or definition exists that can classify the population to be tested into individuals with disease and individuals without disease. Sometimes this simple concept is not unambiguously met, because no clear external diagnostic gold standard exists (at least for many patients). Rather, the gold standard for some tests can be the clinical diagnosis, but that diagnosis itself sometimes depends on the results of the test being evaluated, and this leads to a kind of circular reasoning.
When the gold standard for diagnosis changes, the assessments of the performance of a diagnostic test may also change. The effects differ depending on whether the gold standard for diagnosis is made more strict or more lax.
If a newer or revised gold standard is stricter than a former one, then patients whom the newer standard classifies as having disease will tend to have more severe disease than would previously have been the case. Moreover, a diagnostic test being measured against the new gold standard is more likely to be positive in this smaller set of diseased patients. Thus, the test’s sensitivity will increase. For example, if the stricter gold standard excludes very small cancers, such as cancer in situ or very localized disease, then a diagnostic test that depends on tumor mass will be more likely to be positive in this small subset of patients.
In addition, a stricter gold standard will tend to classify patients who have mild or minimal disease as not having disease. Hence, a diagnostic test being measured against the new gold standard is more likely to be (falsely) positive in the larger set of patients without disease, because the enlarged set of patients said to be free of the disease will actually include more patients who have mild or minimal disease. Thus, the test’s specificity will decrease. Finally, making the gold standard stricter also decreases the measured (or estimated) prevalence of disease.
The opposite effects will occur if the revised gold standard that defines the presence of disease is made more lax. The sensitivity of a test measured against this revised gold standard will decrease because the group of patients classified as having disease will include more mild or minimal cases. Necessarily, the specificity of a test measured against this revised gold standard will increase because the group of patients classified as not having disease will include fewer mild or minimal cases. Making the gold standard more lax also increases the prevalence of disease.
These are complex and important relationships. Early in this chapter, we used the terms strict and lax to describe criteria for defining a positive test. In this section, we use the same terms to describe the criteria for defining the presence or absence of disease. Many gold standards are not fixed (that is, they also can vary); this fact complicates the analysis of relative test performance.
Consider the example shown in Figure 9.4A-D. Figure 9.4A shows the likelihood of a given test result in three populations of patients: those with severe disease, those with mild disease, and those with no disease. In Figure 9.4B, these three populations have been merged into two groups—patients with disease and patients with no disease—by defining disease to be only severe disease. The no-disease category now includes some patients with mild disease, and patients in this category are more likely to have a positive test result than are patients in the
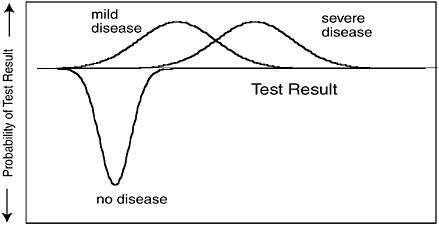
FIGURE 9.4A Probability of test result in three populations defined by presence and severity of disease.
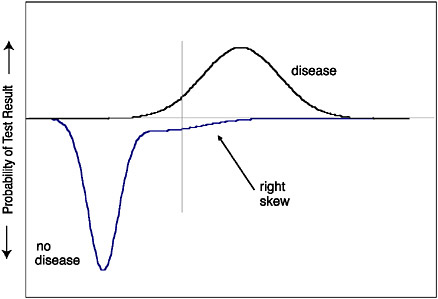
FIGURE 9.4B Probability of disease in two populations: mild disease is classified as no disease.
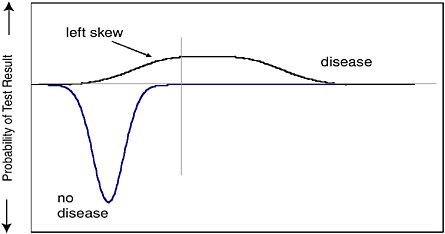
FIGURE 9.4C Probability of disease in two populations: mild disease is classified as disease.
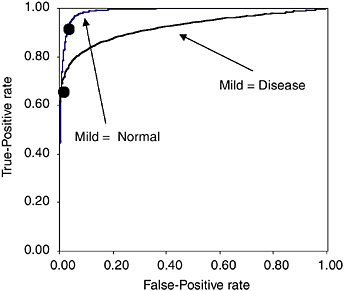
FIGURE 9.4D Two ROC curves: mild disease classified as disease, and mild disease classified as no disease.
original no-disease population. With this classification, test specificity will decrease (for a given criterion of positivity) compared to just looking at the test in patients who have no disease at all. In contrast, test sensitivity will increase compared to a mix of patients with mild and severe disease because all patients now classified as having disease will have severe disease and therefore be more likely to have a higher test result.
The opposite circumstance arises in Figure 9.4C, in which patients with disease include patients with both mild and severe disease. In this case, test specificity will be higher because the population of patients with no disease no longer includes patients with mild disease. Similarly, with this new classification, patients with “disease” now include patients with less severe disease, and patients in this category are less likely to have a test result above the same criterion of positivity. For that reason, test sensitivity will be lower. These effects are summarized in the corresponding ROC curves (Figure 9.4D). The dot on each curve corresponds to the same criterion of positivity.
If the test under consideration is itself the gold standard for diagnosis, then it is by definition perfect. That is, a positive result establishes the diagnosis and a negative result excludes it, both with certainty. The specificity and the sensitivity of the test are both 100%. (These points are taken up further in Chapter 10 in the discussion of the RECA gold standard.)
The Meaning of a Positive Test
Sensitivity, specificity, and ROC curves apply to two populations: individuals without disease and individuals with disease. In contrast, the task that the clinician interpreting a screening test faces deals with an individual who is not known to be a member of either population. Rather, that individual is known to have some chance (the pretest probability) of being in one population or the other.
Faced with a positive test result, the clinician and the patient must consider what it means. The effect of a positive test is to increase the probability of disease from the pretest likelihood (often the population-based likelihood or prevalence) to a revised, posttest probability. Calculating a revised probability of disease depends on three factors: the pretest probability or prevalence of disease, the test’s sensitivity, and the test’s specificity.
Consider, as shown in Figure 9.5, 1,000 patients screened, of whom 1% (10) have disease. If test sensitivity is 80%, 8 of the 10 will have a positive test result. Of the 990 patients without disease, if the test specificity is 70%, 30% or 297 patients will also have a positive test result. Thus, 305 patients will have positive test results; of these, 8 or 2.6% will actually have disease (the revised probability of disease). Thus, a positive test result increases (in this case, more than doubles) the probability that the patient has the disease from 1% (the state before testing) to 2.6%; a negative result decreases it (in this case, reduces by two-thirds) from the original 1% to 0.3%.
Clinicians, patients, and policymakers can legitimately ask: Is 2.6% high enough to justify the risks and costs of further workup? Is 0.3% low enough to forego further workup and reassure the patient that no disease has been detected? Answers to these critical questions depend on a host of other, nonstatistical matters, such as the benefits, risks, and costs of treatment, and the risks and costs of further diagnostic evaluation (Pauker and Kassirer, 1980).
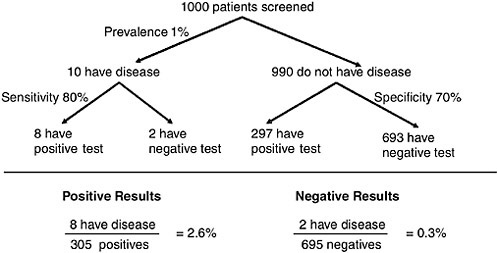
FIGURE 9.5 The meaning of a positive test.
These three factors are combined in a process known as Bayesian analysis. In the simple case of a test that is either positive or negative and a disease that is either present or absent, the revised or posterior (posttest) probability (also known as the positive predictive value) is calculated as
For example, as in Figure 9.5, if the prevalence were 1%, the sensitivity 80%, and the specificity 70%, then the revised or posterior probability of disease after a positive test would increase to
In the screening situation (when the prior or pretest probability of disease is low), the major drivers of the posttest probability are the test’s specificity and the disease prevalence. If one assumes that the test’s sensitivity is reasonably high, one can approximate the posttest probability as
This simple approximation allows the clinician or the patient who was or will be screened to judge quickly the meaning of a positive test result.
The above reasoning applies to single screening tests that are looking for a single disease. The issue is far thornier when one considers the simultaneous application of several screening tests that are looking for several diseases.
The Conundrum of the False-Positive Cascade
RESEP proposes screening for 20 malignant conditions in downwinders and onsite participants, seven malignant and nonmalignant conditions in uranium millers and ore transporters, and six other conditions in miners. The specificity of each of the proposed screening tests for these separate conditions is likely to be well below 95%. For instance, the specificity of CA-125, a tumor marker that is often present in the peripheral blood of patients with ovarian cancer is limited; CA-125 is high in 88% of patients who have endometriosis, a far more common entity, as well as in right heart failure, cirrhosis and tuberculous ascites. Similarly, the fecal occult blood test (a screening test for colon cancer) and breast self-examination, clinical breast examination by a clinician, and mammography (screening tests for breast cancer) have low specificity.
Since Galen and Gambino (1975) described the effect of panels of clinical chemical tests, physicians have understood that obtaining a battery of tests is highly likely to produce false-positive results—“red herrings” that demand further study that can lead to various good and bad consequences. The general public may not understand that principle as clearly, however. Consider a typical laboratory test for which the normal range is defined in a healthy population as the test’s mean plus or minus two standard deviations—meant to encompass 95% of the healthy population. That definition corresponds to a test specificity of 95% and a false-positive rate of 5%; this point is shown in Table 9.4, first row, columns 2 and 3 (in bold face).
Complicating this point is the fact that some laboratory tests do not define a normal range (an upper and a lower limit of normal). Rather, they specify either an upper or a lower limit. In that case, the likelihood of a false positive may not be 5%. Nevertheless, if the chance of a false positive in each test of a panel is not zero, a cascade of false positives will still develop as the number of tests in the panel increases.
Now consider a pair of two such independent tests applied to a healthy individual (Table 9.4, second row). Using our main example, the likelihood that both tests will be normal (what might be called joint specificity) is 95% times 95%, or 90.25%; the joint false-positive rate is 9.75% (100% - 90.25%). If three tests were performed on a healthy individual, the joint specificity would be 85.7% (95% times 95% times 95%) and the joint false-positive rate 14.3% (100% -85.7%). For 12 such independent tests, the joint specificity would be 54% and the likelihood of at least one (falsely) positive result 46% (100% - 54%). Of course, if the tests are not independent, then this simple multiplication must be adjusted for the degree of positive or negative correlation among the tests.
TABLE 9.4 The False-Positive Cascade: Effect of Number of Tests and Specificity on Probability of Positive Test Results
|
Number of Tests |
|
Level of Specificitya Equals |
|||||||||||
|
95% |
90% |
85% |
80% |
||||||||||
|
Probability That None, One, or Two Results Are Positive in a Healthy Population |
|||||||||||||
|
N = |
0 |
1 |
2 |
0 |
1 |
2 |
0 |
1 |
2 |
0 |
1 |
2 |
|
|
1 |
|
0.9500 |
0.0500 |
|
0.9000 |
0.1000 |
|
0.8500 |
0.1500 |
|
0.8000 |
0.2000 |
|
|
2 |
0.9025 |
0.0950 |
0.0025 |
0.8100 |
0.1800 |
0.0100 |
0.7225 |
0.2550 |
0.0225 |
0.6400 |
0.3200 |
0.0400 |
|
|
3 |
0.8574 |
0.1354 |
0.0071 |
0.7290 |
0.2430 |
0.0270 |
0.6141 |
0.3251 |
0.0574 |
0.5120 |
0.3840 |
0.0960 |
|
|
4 |
0.8145 |
0.1715 |
0.0135 |
0.6561 |
0.2916 |
0.0486 |
0.5220 |
0.3685 |
0.0975 |
0.4096 |
0.4096 |
0.1536 |
|
|
5 |
0.7738 |
0.2036 |
0.0214 |
0.5905 |
0.3281 |
0.0729 |
0.4437 |
0.3915 |
0.1382 |
0.3277 |
0.4096 |
0.2048 |
|
|
6 |
0.7351 |
0.2321 |
0.0305 |
0.5314 |
0.3543 |
0.0984 |
0.3771 |
0.3993 |
0.1762 |
0.2621 |
0.3932 |
0.2458 |
|
|
7 |
0.6983 |
0.2573 |
0.0406 |
0.4783 |
0.3720 |
0.1240 |
0.3206 |
0.3960 |
0.2097 |
0.2097 |
0.3670 |
0.2753 |
|
|
8 |
0.6634 |
0.2793 |
0.0515 |
0.4305 |
0.3826 |
0.1488 |
0.2725 |
0.3847 |
0.2376 |
0.1678 |
0.3355 |
0.2936 |
|
|
9 |
0.6302 |
0.2985 |
0.0629 |
0.3874 |
0.3874 |
0.1722 |
0.2316 |
0.3679 |
0.2597 |
0.1342 |
0.3020 |
0.3020 |
|
|
10 |
0.5987 |
0.3151 |
0.0746 |
0.3487 |
0.3874 |
0.1937 |
0.1969 |
0.3474 |
0.2759 |
0.1074 |
0.2684 |
0.3020 |
|
|
11 |
0.5688 |
0.3293 |
0.0867 |
0.3138 |
0.3835 |
0.2131 |
0.1673 |
0.3248 |
0.2866 |
0.0859 |
0.2362 |
0.2953 |
|
|
12 |
0.5404 |
0.3413 |
0.0988 |
0.2824 |
0.3766 |
0.2301 |
0.1422 |
0.3012 |
0.2924 |
0.0687 |
0.2062 |
0.2835 |
|
|
13 |
0.5133 |
0.3512 |
0.1109 |
0.2542 |
0.3672 |
0.2448 |
0.1209 |
0.2774 |
0.2937 |
0.0550 |
0.1787 |
0.2680 |
|
|
14 |
0.4877 |
0.3593 |
0.1229 |
0.2288 |
0.3559 |
0.2570 |
0.1028 |
0.2539 |
0.2912 |
0.0440 |
0.1539 |
0.2501 |
|
|
15 |
0.4633 |
0.3658 |
0.1348 |
0.2059 |
0.3432 |
0.2669 |
0.0874 |
0.2312 |
0.2856 |
0.0352 |
0.1319 |
0.2309 |
|
|
16 |
0.4401 |
0.3706 |
0.1463 |
0.1853 |
0.3294 |
0.2745 |
0.0743 |
0.2097 |
0.2775 |
0.0281 |
0.1126 |
0.2111 |
|
|
17 |
0.4181 |
0.3741 |
0.1575 |
0.1668 |
0.3150 |
0.2800 |
0.0631 |
0.1893 |
0.2673 |
0.0225 |
0.0957 |
0.1914 |
|
|
18 |
0.3972 |
0.3763 |
0.1683 |
0.1501 |
0.3002 |
0.2835 |
0.0536 |
0.1704 |
0.2556 |
0.0180 |
0.0811 |
0.1723 |
|
|
19 |
0.3774 |
0.3774 |
0.1787 |
0.1351 |
0.2852 |
0.2852 |
0.0456 |
0.1529 |
0.2428 |
0.0144 |
0.0685 |
0.1540 |
|
|
20 |
0.3585 |
0.3774 |
0.1887 |
0.1216 |
0.2702 |
0.2852 |
0.0388 |
0.1368 |
0.2293 |
0.0115 |
0.0576 |
0.1369 |
|
|
aThe joint specificity is the probability of having no positive test results when a set of N tests is applied to a healthy population. NOTE: Items in boldface correspond to examples in the text. |
|||||||||||||
The classic lesson of the false-positive cascade is taught to medical students: a panel of screening tests is likely to include at least one false-positive result. Each test’s specificity and the number of tests performed affect these values, of course, and one can calculate them from the binomial distribution. If 20 tests were performed on a downwinder (as in some of the current RESEP programs) and if each test has a specificity of 80% (a value not atypical of the RESEP screening tests; Table 9.4, row 20, columns 11-13), then the likelihood that all 20 will be negative in an individual who does not have any of diseases being sought is only 1.15% or roughly 1 in 90. As shown, 5.8% of individuals truly without disease who are screened will have a false-positive result on one test, and roughly 14 percent will have false-positive results in two tests. Not shown in Table 9.4: roughly 20% will have false-positive results on three or four tests, roughly 18% on five tests, 11% on six, 5% on seven, and 2% on eight. An example of this phenomenon is reported in the results of the Prostate, Lung, Colorectal and Ovarian (PLCO) Screening Trial (Lafata et al., 2004), in which the joint specificity of four screening tests was 49.11% among men and 64.0% among women.
In general, joint specificity equals
or, if all the specificities are the same 1 − SpecificityN. Even modest declines in specificity (moving across Table 9.4 from left to right) cascade into substantial increases in the likelihood of one or more false-positive results. In large measure, this phenomenon explains the great loss of enthusiasm for multiphasic screening, an approach popular in the 1970s (Olsen et al., 1976).
Multiple Tests for a Single Disease
In this section, we consider the case in which more than one test is used to look for the same disease; in this scenario each test has its own sensitivity (for example, sensitivity1 and sensitivity2) and its own specificity (for example, specificity1 and specificity2). Each of these operating parameters is less than unity because no test is perfect. The implication of such a screening approach, involving two or more steps, depends on how a positive screen is defined (Figure 9.6).
Definitions of a positive screen may center on whether one applies an “AND” or an “OR”2 criterion and then judges test performance in terms of sensitivity, specificity, and positive predictive value. We discuss these points below, using the percentages in Table 9.5 to illustrate the argument.
If denoting the screening protocol as positive and proceeding to the next step (informing the patient, referring the patient, and beginning a confirmatory work-
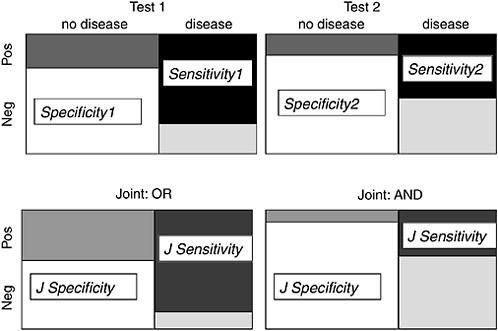
FIGURE 9.6 Multiple tests: AND versus OR.
up) together require that both tests be positive—a criterion often called the AND criterion—then the joint sensitivity of the testing pair is less than either individual sensitivity, and the joint specificity is higher than either individual specificity. If the tests are statistically independent, then the joint sensitivity will be Sensitivity1 × Sensitivity2, and the joint specificity will be 1 − [1 − Specificity1) × (1 − Specificity2)].
Of course, many tests are not statistically independent of one another; instead, they may depend on the stage of disease. In such cases, the joint specificity of two or more tests interpreted by the AND criterion may not be as high as this expression might predict. As a special case, consider the circumstance in which the second test is a repeat of the first, perhaps even on the same tissue or blood sample. In that case, the two results would be very dependent, and one would not
TABLE 9.5 Interpretation of Two Diagnostic Tests
|
Parameter |
Individual |
Joint |
||
|
Test 1 |
Test 2 |
AND |
OR |
|
|
Sensitivity |
70% |
80% |
56% |
94% |
|
Specificity |
90% |
95% |
99.5% |
85.5% |
|
Positive Predictive Value |
||||
|
Disease Prevalence 1% |
6.6% |
13.8% |
52.8% |
6.1% |
|
Disease Prevalence 20% |
58.6% |
76.2% |
95.7% |
56.5% |
expect the joint specificity to increase at all, save perhaps to account for truly stochastic laboratory variation. In general, if the two tests are correlated, then their joint specificity must be adjusted to account for the degree of positive or negative correlation.
For example, if the two sensitivities are 70% and 80% and the two specificities are 90% and 95%, then the joint sensitivity will be 56% and the joint specificity 99.5%. In a screening setting with low prevalence of disease, a higher specificity will probably produce an improved posterior (posttest) probability—that is, a higher positive predictive value. Such improved specificity with the AND criterion of combination might be useful if the prevalence of disease were low or if the burden of false-positive results were high, that is, when excluding the presence of a disease may have a high priority. If those tests were applied in a population in which the prevalence of disease is 1%, the positive predictive value if test 1 alone were positive would be 6.6%, the positive predictive value if test 2 alone were positive would be 13.8%, but the positive predictive value if both were positive would be 53%. In contrast, if the tests were to be applied in a population in which the prevalence of disease is 20%, the positive predictive value if test 1 alone were positive would be 59%, the positive predictive value if test 2 alone were positive would be 76%, but the positive predictive value if both were positive would be 96%.
Conversely, if denoting a screening protocol as positive and proceeding to the next step requires only that either test be positive—a criterion often called the OR criterion—then the joint sensitivity of the testing pair is higher than either individual sensitivity and the joint specificity is lower than either individual specificity. If the tests are independent, then the joint sensitivity will be 1 − [1 − Sensitivity1) × (1 − Sensitivity2)], and the joint specificity will be Specificity1 × Specificity2.
Using the same example as above, the joint sensitivity will be 94% and the joint specificity will be 85.5%. In a screening setting with low prevalence, a lower specificity will probably produce a lower positive predictive value. Again, in a population in which the prevalence of disease is 1%, the positive predictive value after either test was positive would be only 6.1%. In contrast, in a population in which the prevalence of disease is 20%, the positive predictive value after either test was positive would be 57%. The improved sensitivity of the OR criterion of combination might be useful if the burden of false-positive results were low and if finding a disease had high priority. As seen in Table 9.5, the difference between the AND criterion and the OR criterion is proportionally greater in the low-prevalence setting that is typical of screening.
Multiple Diseases and Conditional Probabilities
For simplicity, we have been dealing up to this point with a single disease and a cutoff criterion that classifies all test results into one of four categories: true
positive, false positive, true negative, and false negative. That allows us to think in terms of the summary measures sensitivity and specificity. Unfortunately, the real world does not always support this simplification.
Consider a circumstance with three diagnostic possibilities: disease 1, disease 2, and no disease. Assume that we perform a test to establish the presence of disease 1 but that the likelihood of a positive test is different among patients with disease 2 than among patients with no disease. In such circumstances, the “specificity” of the test cannot be defined, because it depends on the relative likelihood of disease 2 and of no disease among patients who do not have disease 1. These factors make the mathematics a bit more complicated because one needs to think in terms of conditional probabilities (for example, the conditional probability of a positive test given the presence of disease 2). One can, however, derive unexpectedly useful diagnostic information by doing so. A negative test (presumably for disease 1) can actually change the relative likelihoods of disease 2 and no disease (Gorry et al., 1978).
Imaging Studies
The situation becomes substantially more complex if one considers imaging studies, such as chest x rays, computed tomography scanning (CT scans), magnetic resonance imaging (MRI), or nuclear scanning. For each of those studies, one does not have a single parameter or axis of results, such as an ejection fraction, a PSA concentration, or an oxygen saturation. Rather, the person interpreting the image can identify any of a large number of abnormalities; these might be a pulmonary nodule, a diffuse pattern of fibrosis, a pulmonary infiltrate, or an enlarged cardiac silhouette.
For most imaging studies, interpreters do not limit their reports to a single criterion of positivity, such as a pulmonary nodule of at least 5 mm in diameter or a renal mass. Instead, they typically report one or more of a substantial number of incidental findings if for no other reason than to protect themselves from an accusation of missing a cancer, one of the more common reasons for malpractice actions. For adrenal, pituitary, and thyroid images, these tiny lesions have sometimes been called incidentalomas.
Thus, estimating the specificity (true negative rate) of an imaging study is difficult. The literature can provide information about specific findings, for instance, how often a solitary pulmonary nodule larger than 5 mm in diameter is present in the absence of cancer. It does not tell us how often a radiograph of a healthy individual is reported as completely normal. In part, these decisions depend on how hard the imager looks. Because many incidental findings will generate further workup and anxiety among individuals screened with imaging techniques, the false-positive cascade and its burden will increase considerably if a screening protocol includes several imaging studies.
Repeated Studies
Our discussion of screening has implicitly considered a screening test or battery of tests at a single time. Many RECA diseases, however, evolve, either developing a new manifestation or reaching the threshold of detectability. That threshold may vary from test to test for a specific disease (see the discussion above of lead time bias and the inherent biases of using more sensitive screening tests).
Thus, we can ask, if an initial screening test for a disease is negative, should the test be repeated in the future? If so, when? The many groups that have recommended only a limited number of screening tests have not uniformly analyzed the complex question of retesting. They often address it informally or in terms of expert opinion.
For the initial screening test, the appropriate measure of pretest probability is the prevalence of disease in the population. If a screening test is to be repeated, then the pretest probability of disease is usually the interval incidence of disease, a number almost always lower than the prevalence. The interval incidence of disease refers to individuals known not to have the disease at the beginning of a period (because of a prior negative evaluation at that time) who develop the disease by the end of that period. If the initial screening test is negative, one may well be selecting a subset of the population with a lower-than-average propensity for developing the disease.
In such repeat screening scenarios, the pretest likelihood is often far lower for the second and later screens than for the first. Arguably, the evidence for repeating a test must be even stronger than it was for the initial screen. Some experts pose counterarguments, however. On the one hand, for instance, one might say that disease identified on a repeated screen is more likely to be rapidly developing, although whether more aggressive disease is more or less amenable to the benefit of early treatment is not clear. On the other hand, one might argue that disease identified on the repeated screen may be more likely to have existed in an earlier stage and thus be more amenable to early treatment. Answers must lie in scientific evidence and in studies that compare outcomes of various frequencies of repetition of screening. Few such studies have been reported.
Conclusions of Other Groups
As mentioned above, various advisory bodies have considered screening options for many diseases, and relatively few have been recommended for routine screening. We have presented a fairly extensive listing in Appendix E to convey where the current view of medical screening for primary care; materials there are taken from recommendations of the second or third Guide to Clinical Preventive Services of the USPSTF or, where appropriate, recommendations of the equivalent Canadian task force. We have included all “recommendation and
rationale” statements concerning neoplastic diseases, whether they are specifically RECA conditions or not; we have also developed a listing of other “A” and “B” recommendations (respectively, strongly recommend and recommend) from the USPSTF for a variety of other conditions. The intent is to convey the extent of coverage of clinical preventive services as they apply to screening, to underscore the point that very few diseases are at present amenable to screening (in asymptomatic populations) with reliable and valid tests in which the benefits of screening likely outweigh the risks or harms of such screening.
We note, for example, that screening for cancers of the cervix, breast, and colon is recommended; screening for cancer of the prostate receives mixed reviews, and extensive discussion with the patient is suggested before it is undertaken. Screening for cancers of the lung, pancreas, ovaries, and thyroid is not recommended, in part because prevalence is low (ovary and thyroid) and in part because the therapeutic benefit is small (lung, pancreas, thyroid).
To modify those recommendations in RECA populations, one would need to believe that the prevalence of those diseases that offer some benefit of early detection and treatment is substantially higher than it is in other populations. As explained in other chapters, that proposition probably does not hold. First, we are now many years after exposure, so that the excess relative risk of the cancers has declined. Second, some downwinders had had relatively low exposures to the radiation particles that would be expected to induce most of the cancers. Of course, for many cancers and geographies the data about exposure include substantial uncertainties. Third, as the exposed population ages and comorbidities develop, the medical benefit of early detection in improving life expectancy wanes.
Thus, for downwinders and onsite participants, little rationale can be advanced for expanding medical screening recommendations in the RECA populations beyond contemporary recommendations for the general population (as in Appendix E) that are based on an assumption of achieving improved health outcomes through early detection and on an acceptable balance of benefits and harms.
For miners, millers, and transporters who were exposed to dust and silica, the same issues arise as in mining for other materials, for example, exposure to silica. In general, silicosis and coal workers’ pneumoconiosis (CWP) are progressive diseases managed by minimizing exposure.3 Few data suggest that early identification and treatment can modify prognosis, save once the fibrotic lung disease is established, save to decrease further exposure to silica (Sharma et al., 1991; Bates et al., 1992; Banks et al., 1993; Banks, 2005). Small trials of systemic or bronchoalveolar lavage with steroids have shown modest statistical but not clinical improvement (Sharma et al., 1991). Thus, early identification of silicosis in
|
3 |
Black lung is a common term for coal worker’s pneumoconiosis caused by excessive exposure to coal mine dust. Silicosis is related to the excessive quartz dust exposure (http://www.thoracic.org/news/atsnews/news0197.html#ats9, accessed for this purpose 10/2/2004). |
asymptomatic individuals who are no longer actively employed as miners would be of limited medical benefit.
Silicosis is, however, associated with an increased prevalence of mycobacterial disease. Performing a purified protein derivative (PPD) or tuberculin test to screen former miners, millers, and ore transporters for tuberculosis is a rational approach. Such skin testing need not be predicated on demonstrating silicosis on a chest x ray. If the skin test were positive, following up with a chest x ray, and perhaps with other appropriate tests to confirm the presence of active disease (if the x ray were suspicious) would be the current standard of care. Offering prophylactic antituberculosis therapy to patients with positive skin reactions who do not have active disease might be valuable as well. The demonstration of silicosis on chest x ray might improve compliance with early treatment for latent mycobacterial infections. Some data suggest that lung cancer to have a somewhat increased frequency in patients with silicosis, but the data are inconsistent; moreover, early detection does not appear to confer much, if any benefit.
Several groups, including the National Institutes of Health and the National Kidney Foundation, suggest screening for early evidence of chronic renal disease in populations at risk for renal failure, such as patients with diabetes and hypertension. Recently, those recommendations have been extended to include a far broader population (Levey et al., 2003; National Kidney Foundation, 2002). If chronic renal dysfunction is identified early, various interventions such as angiotensin-converting enzyme [ACE] inhibitor drugs, diet modification, and lipid-lowering therapies, can slow the progression of renal disease with substantial benefit. Recent data suggest that the “MDRD” glomerular-filtration-rate (GFR) calculator, developed as a part of the modification of diet in renal disease study (Levey et al., 2003; http://www.nephron.com/mdrd/default.html, accessed 3/13/ 2005), is probably the most accurate means of identifying such patients. Because of the putative relationship between exposure to soluble uranium salts and renal failure (perhaps more acute than chronic) and because chronic renal disease is a RECA-covered disease for some uranium workers, screening millers and ore transporters for renal dysfunction is reasonable.
The committee finds insufficient supporting evidence to support additional medical screening or medical case-finding in the RECA populations beyond the level and type of screening advised for general populations and persons with occupational exposures similar to those of in miners in general. Specifically the committee recommends that the Health Resources and Services Administration base RESEP medical screening efforts in asymptomatic individuals on robust scientific evidence that such screening improves health outcomes and that its benefits outweigh its risks.
The committee believes that the current legislation and regulations that promulgate screening for the RECA-compensable diseases for the purpose of preventing disease and improving health arise because the distinction between medical screening and compensational screening, as explicated in this chapter, has not
been clear. With that distinction in mind, the committee recommends that HRSA not extend its medical screening beyond the generally accepted screening protocols that apply to the US population at large. However, the committee further recommends that uranium miners, millers and ore transporters also be screened for diseases generally recommended for screening in other mining populations and that uranium millers and ore transporters be screened for chronic renal disease.
In particular, the committee observes that some screening protocols that HRSA grantees now use exceed these guidelines. In our judgment, HRSA should cease funding any medical screening efforts that do not conform to the recommendation. Correspondingly, the committee recommends that, once an individual has been shown to be administratively eligible for compensation under RECA (including employment, residence, or a calculated PC/AS at or above some established cutoff criterion), the individual be offered medical screening recommended in generally accepted protocols that apply to the population at large (see Appendix E-2).
FUTURE RESEARCH
The committee has referred earlier to authoritative screening recommendations from the USPSTF and other groups (see Appendix E). The dozens of systematic reviews prepared for the USPSTF and the related USPSTF statements of recommendations and rationales typically have extensive comments on future research issues, including the reviews of cancer screening technologies. These can be found on the USPSTF website (www.ahrq.gov/clinic/prevenix.htm) and in the peer-reviewed literature.
We briefly raised the question of the costs of screening in general and of the RESEP program in particular. Not much is known about the cost-effectiveness of screening, in part because of the unproven effectiveness of many screening modalities (such that examining cost-effectiveness has little meaning). Very little information is available on the cost-effectiveness of alternative screening strategies; the chief exceptions are screening for colorectal cancer and type 2 diabetes. Insofar as HRSA and RESEP engage in appropriate medical screening in the future, data from strong cost-effectiveness analyses would help HRSA to specify RESEP screening strategies that would optimize use of federal resources. We note in particular the need for more head-to-head comparisons of screening technologies and for collection of cost data for cost-effectiveness analyses. The committee encourages Congress to expand financial support for rigorous studies of diagnostic and screening tests, including cost-effectiveness analyses.
As documented elsewhere in this report, the six current HRSA grantees operate screening programs with quite different orientations. Some do screening similar to a broad-based annual physical examination, with attention to both
RECA-compensable disorders and to non-RECA ailments typical of the age and sex of patients that they see; their orientation might thus be characterized as more medical than compensational. Others (notably the Indian Health Service RESEP program in Shiprock, New Mexico) apparently direct their focus nearly exclusively to RECA conditions and do not expand their screening efforts beyond that; their orientation might be characterized as more compensational than medical. The committee believes that such variation poses problems of inequity that HRSA should investigate in more detail; one aim of such a study is to determine whether some individuals are receiving more services than others for equivalent expenditures of public dollars in RESEP. On the other hand, the best practices among current grantees are not clear. It would not be unreasonable for HRSA to undertake a trial to establish which protocols are most effective. Of course, participation in such a trial should also be predicated on obtaining informed consent for the trial from each participant.
The RECA populations being screened by HRSA grantees with RESEP funding are an interesting group to study insofar as they comprise individuals with presumably greater than average risks of disease. The sensitivity, specificity, and positive and negative predictive values (or reliability and validity) of a variety of screening tests may well differ in those populations from the values in populations of either average or low risk. Epidemiologic and clinical studies might well be undertaken to clarify the yield from various screening tests; such work would shed light on the utility of the individual tests and combinations of tests under those circumstances.
HEALTH-CARE ISSUES BEYOND SCREENING
Evolution of Technology
Apart from the issues we have raised above about medical and compensation screening, we note that some testing, particularly diagnostic testing, must and will continue. For uranium miners, for example, the increased risk of lung cancer and restrictive lung disease can be addressed through traditional services, such as pulmonary function tests and chest x-rays. Those methods have been applied to studies of underground miners (for example, of coal workers’ pneumoconiosis in the United States and uranium miners in many countries) and can be said to be appropriate current practice as carried out by the current HRSA grantees.
However, as new imaging and sputum-cytology methods emerge, the HRSA grantees should be encouraged to consider new and better tests (especially those with test properties better than those of traditional screening or diagnostic tests) and abandon tests that appear to be less effective. Such evolution should, however, be based on evidence. The committee would generalize that point by saying that both HRSA and the medical professions more broadly must be sensitive to
the evolution of useful technologies, adopting those of improved performance and discontinuing use of those approaching obsolescence.
Screening Recommendations from Other Groups
As reflected in this chapter and Appendix E-1, the committee used the USPSTF guidelines to help develop recommendations on medical or compensational screening of RECA populations. As the clinical and research communities develop new or improved screening methods and put them into practice, the USPSTF and other professional or clinical bodies will review such guidelines and, as appropriate, revise them.
The Institute of Medicine instituted a modern-day understanding of clinical practice guidelines as the behest of the then Agency for Health Care Policy and Research (IOM, 1990a; IOM, 1992; Lohr, 1998, 1999; Lohr et al., 1998). This evolution in clinical-practice guidelines since that time for both primary and specialty or referral care, may have implications for both RECA populations and the RESEP program. Updates to clinical practice guidelines of all sorts can be found through the National Guidelines Clearinghouse supported by the Agency for Healthcare Research and Quality (AHRQ) (www.guideline.gov) and, specifically for the USPSTF, through the AHRQ Preventive Services Web site (www.ahrq.gov/clinic/prevenix.htm) and the Put Prevention into Practice program (www.ahrq.gov/clinic/ppipix.htm).
The committee recommends that HRSA regularly monitor and follow screening guidelines developed by the US Preventive Services Task Force and published by the Agency for Healthcare Research and Quality
Psychologic Issues in Exposed Populations
Of concern to the committee are psychologic disorders potentially present among downwinders who at various times have not been fully informed about the risks, although small, of exposure to fallout from the NTS tests. Major depression is a particular concern because of the already high prevalence of depression in the general population, its serious potential consequences (such as suicide), and its responsiveness to treatment if it is identified. Generalized anxiety disorder, posttraumatic stress disorder, and a more chronic concern among these populations about their view of living in a “contaminated environment” (Kuletz, 1998, p336), has been called “chronic environmental stress disorder” (IOM, 1999), and it may be associated with NTS activity and its aftermath over the past 50 years. In the end, the committee could not amass sufficient scientific data or develop a plausible chain of reasoning to include these conditions as compensable under RECA.
In the setting of a nuclear accident or other catastrophic event, rapidly pro-
viding the public with accurate information can minimize the mental health effects (IOM, 1999, p106). For a variety of reasons, that was not always the case for downwind RECA populations. Some people who testified at the committee’s information-gathering meetings described experiences and impressions that may place them at risk for some of these disorders. We heard a good deal about chronic emotional pain and sorrow related to the cancer deaths of many family members and friends. We also heard many of those who testified express anger and frustration at the government for (supposedly) misleading them and their predecessors about the dangers of uranium mining, the effects of fallout, and the meaning of the “dust” found on many crops, homes, and other locations. They presumed that this dust was a consequence of the nuclear-weapons tests at the NTS. Finally, many spoke of their strong sense of “not being heard” by either HRSA or DOJ.
Although downwinders were not exposed to a catastrophic threat (such as a nuclear accident), the paucity of accurate information provided to them for many years may have contributed to their psychologic burden. However, even here the committee did not find any scientific studies to validate the contributory effect of this paucity of information. In addition, as noted in Chapter 7, the committee has been unable to identify any data that evaluate the psychologic effects of chronic environmental stressors during either the testing and mining periods or, more recently, among RECA downwinders or other populations with similar radiation-exposure experiences. Hence, the committee does not believe that compensation, as outlined in Chapter 8, is appropriate for downwinders with psychologic disorders.
Nevertheless, the possibility exists that depression and generalized anxiety disorder are more prevalent in RECA populations than in the general population and might have been ameliorated if more complete information had been provided to these populations in the past. Of course, such information must be provided in a culturally sensitive an appropriate manner. The committee notes three important factors: (1) rapid, simple, low-cost screening tests for depression are available and have been validated (Pignone et al., 2002); (2) depression can have serious consequences that can be ameliorated by timely treatment; and (3) the USPSTF recommends screening for depression in the general adult population within the context of the delivery of health care services by institutions or providers with appropriate quality assessment programs in place (http://www.ahrq.gov/clinic/3rduspstf/depressrr.htm).
In sum, screening for depression constitutes good medical practice by providers with good quality-of-care procedures; the link between quality of care and ethics (Lohr, 1995) strengthens this conclusion and is implicit in reports from the Institute of Medicine spanning more than a decade (IOM, 1990b; IOM, 2001). Given the above, HRSA may want to consider screening for depression in their
medical screening protocols. The low-cost, potentially high-benefit strategy of screening for depression, with appropriate referrals and follow through, may ameliorate some psychologic burdens in the RECA population.4,5
CONCLUSION
This chapter has reviewed in depth the conceptual and statistical underpinnings of screening for medical purposes. We have discussed the limitations and risks of screening for diseases for which early detection offers little benefit. We have also shown how screening in low-risk populations and screening for multiple diseases will produce a substantial burden of false-positive results. Finally, we have offered several recommendations to reduce potential harms and mistakes from the use of multiple screening tests among individuals for whom the medical benefits cannot outweigh the harms and the likelihood of compensation may be low. Some recommendations are directed at agents that would need to amend RECA (or RESEP) legislation; others are directed at steps that HRSA can consider without statutory changes. The next chapter picks up on the new issue in RESEP: screening for compensable disease.


