
Appendix D
The Optimal Criterion for Positivity in Screening
Consider a population of individuals composed of two subpopulations: with disease, D, and with no disease, ND. Assume that the prevalence of disease is pdis and that in a representative subset of the population we know, by some gold standard, which individuals have disease and which have no disease.
Consider that a diagnostic test T is applied to the representative subset and yields two distributions of results: one among patients with disease and the other among patients with no disease. Denote the two probability density distributions as Distdis and Distnodis, respectively. Distdis(x) denotes the probability of test result x in patients with disease; Distnodis(x) denotes the probability of test result x in patients without disease. The distribution of test results in the population as a whole, Distpop, is the weighted average of Distdis and Distnodis, with weights pdis and 1 − pdis, respectively. The distributions can be seen in Figure 9.2.
The task in establishing a cutoff criterion (threshold T) for the test—that is, deciding how we classify patients—is in some sense to minimize the burden of misclassification. Among patients with disease, the probability of a positive result (i.e., a result that is > T) is the sensitivity or true-positive rate (TPR) and its complement is the false-negative rate (FNR). Among patients with no disease, the probability of a positive result (i.e., a result that is > T) is the false-positive rate (FPR), and its complement is the specificity.
Define the burden of a false positive as Bfp and the burden of a false negative as Bfn.
We achieve the goal of minimizing the overall burden by minimizing the expression
or
Changing T will change both FNR and FPR in a fashion determined by the shape and the overlap of Distdis and Distnodis. To minimize the overall burden of false-positive and false-negative results combined (with respect to changing T), one can differentiate the expression with respect to T and set the result to zero. That yields
Rearranging, we get:
or
This can be shown to equal:
Another way of thinking about the cutoff criterion is to understand that it is the point t at which Distdis(t) × (p) × Bfn = Distnodis(t) × (1 − p) × Bfp. That is an equivalent formulation of the same equation because dTPR/dT is simply probability density distribution Distdis, and dFPR/dT is simply probability density distribution Distnodis.
Now, if we plot TPR (vertical axis) against FPR (horizontal axis), we have the receiver operating characteristic (ROC) curve of the test. The slope of that curve at any point is simply dTPR/dFPR. Hence, the optimal operating point is the value of T where the slope of the curve (or its tangent) is numerically equivalent to
Some authors use the term cost of false positive (C) in place of burden of false positive and the term benefit of true positive (B) in place of burden of false negative, all being greater than zero. In that case, the optimal operating point is the value of T where the slope of the ROC curve (or its tangent) is numerically equivalent to
The true and false-positive rates (from which one constructs an ROC curve) are the areas under the tails of the corresponding probability density distributions
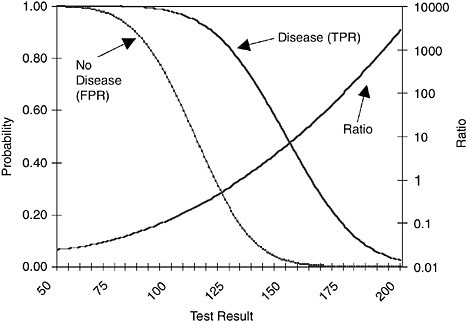
FIGURE D.1 True-positive and false-positive rates as a function of test result. Also shown is ratio of the probability of that test result in patients with disease to probability of that test result in patients without disease (plotted on logarithmic scale).
(or segments of the cumulative probability distributions). The slope of the ROC curve is the ratio of the height of the probability density distribution for patients with disease to the height of the probability density distribution for patients with no disease. If one plots that ratio on the vertical axis against the test result on the horizontal axis, one can determine the cutoff criterion that corresponds to any given slope; if one also plots the corresponding cumulative distributions against the test result, one can also find the corresponding optimal point on the ROC curve (Figure D.1).
AN EXAMPLE
Now consider an example of finding the best operating point (the best criterion of positivity) in a population to be screened. Assume that we are screening for a disease (perhaps a slow growing cancer) for which early detection provides a benefit of 0.5 years of survival; thus, Bfn is 0.5. Further assume that a false-positive result is associated with a risk of 0.05 years (perhaps because the population to be screened has a high prevalence of severe chronic pulmonary disease, which substantially increases the risk posed by surgery), making Bfp 0.05.
If one were considering screening a population in which the prevalence of disease is [subjunctive case is were] 10%, the best criterion for positivity would
be the point on the ROC curve where its slope (or tangent) is [(1 − 0.1) × 0.05]/[0.1 × 0.5] or 0.90, a point near the middle of most ROC curves, with modest true-positive and false-positive rates. If we use the distributions displayed in Figure 9.2 and the ROC curve displayed in Figure 9.3, the optimal criterion of positivity would correspond to a true-positive rate (sensitivity) of 80% and a false positive rate of 17% (a specificity of 83%). However, if one were considering screening a population in which the prevalence of disease is [subjunctive case is were] only 1%, then the best criterion for positivity would be the point on the ROC curve where its slope (or tangent) is [(1 − 0.01) × 0.05]/[0.01 × 0.5] or 9.9, a point nearer to the origin for most ROC curves, with both true-positive and false-positive rates low. Again, if we use the distributions displayed in Figure 9.2 and the ROC curve displayed in Figure 9.3, the optimal criterion of positivity would correspond to a true-positive rate (sensitivity) of 42% and a false-positive rate of 1% (a specificity of 99%).
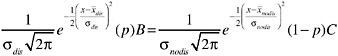
In the special case when both probability density distributions (patients with and without disease) are normal or Gaussian in shape, the slope of the corresponding ROC at any point (the ratio of the heights of the corresponding density distributions) can be solved algebraically, although the equation is fairly complex. Because the normal distribution is
where x is the test result, ![]() is the mean, and σ is the standard deviation, the optimal cutoff criterion will be the value of x where
is the mean, and σ is the standard deviation, the optimal cutoff criterion will be the value of x where
The value of x at which the equality holds can be found by successive approximations or using the “goal seek” function in a spreadsheet program.


