
Appendix C
US Travel and Attitudes Toward the United States
SUMMARY
Our analysis suggests that visiting the United States improves people’s attitudes toward the United States. We used data from the 2002 Pew Global Attitudes Survey to relate respondents’ opinions of the United States to whether they had traveled in the United States and other variables. We describe the variables that we used in our analysis, present our results, and briefly discuss their limitations.
METHODS
Our data come from the Pew Global Attitudes Survey of 2002, which asked respondents in 44 countries about their attitudes toward important geopolitical topics and asked for information about themselves, such as age and education level.1 A list of the countries can be found below. We included several variables in our analysis, all of which are described in greater detail later: a person’s opinion of the United States (USOPINION), a variable representing whether the person has traveled to the United States (USTRAVEL), whether the person admires the United States for its scientific and technologic advances (ADUSST), and the interaction of the previous two variables (USTRADUSST).
Definition of Variables
-
USOPINION: Please tell me if you have a very favorable, somewhat favorable, somewhat unfavorable, or very unfavorable opinion of the United States. 0 = Very unfavorable; 1 = somewhat unfavorable; 2 = somewhat favorable; 3 = very favorable.2
-
USTRAVEL: Have you ever traveled to the United States? 0 = No; 1 = Yes.
-
ADUSST: Which comes closer to describing your view? I admire the United States for its technological and scientific advances, or I do not admire the United States for its technological and scientific advances. 0 = I do not admire the United States for its technological and scientific advances; 1 = I admire the United States for its technological and scientific advances.
-
USTRADUSST = 1 if USTRAVEL = 1 and ADUSST = 1; USTRADUSST = 0 otherwise.
Countries Included in the Dataset
The dataset included Canada, France, the United Kingdom, Italy, Germany, the Czech Republic, the Slovak Republic, Poland, Ukraine, Russia, Bulgaria, Egypt, Uzbekistan, Jordan, Pakistan, Lebanon, Turkey, Guatemala, Mexico, Honduras, Venezuela, Argentina, Brazil, Peru, Bolivia, South Korea, Vietnam, Japan, Indonesia, the Philippines, China, India, Bangladesh, Nigeria, South Africa, Ivory Coast, Senegal, Kenya, Uganda, Ghana, Angola, Mali, and Tanzania.
CORRELATION ANALYSIS
We first examined the raw correlation between one’s opinion of the United States and whether one has visited the United States. About 8 percent of respondents had visited the United States. Among those who had visited the United States, the mean opinion of the United States was 1.82 on a scale, described at the end of this appendix, of 0-3. Among those who had not visited the United States, the mean opinion of the United States was 1.41. This is displayed in Figure C-1.
In light of the events of 9/11, policy makers may be particularly interested in how many of those who have visited the United States have very negative opinions of the United States. The distribution of opinions about
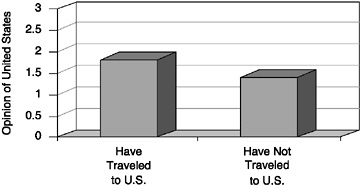
FIGURE C-1 Opinions of the United States.
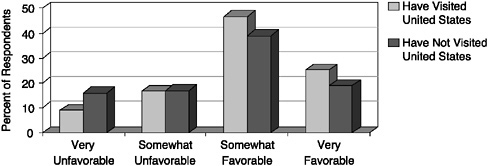
FIGURE C-2 Opinions of the United States of people who have and have not visited the United States.
the United States, by whether a person has visited the United States, is displayed in Figure C-2. Note that people who, when asked their opinion of the United States, responded “Don’t Know” or refused to answer the question were excluded from the analysis.
Of those who have visited the United States, 8.8 percent have a very unfavorable opinion of the United States, but 16.0 percent of those who have not visited the United States have a very unfavorable opinion of the United States. Those who have visited the United States are substantially less likely than average to have a very unfavorable opinion of the United States, but it is important to note that a moderate proportion of people who have visited the United States still have a very unfavorable opinion of it. Visiting the United States does not eliminate very unfavorable opinions.
REGRESSION ANALYSIS
Raw correlations can be misleading, so we have also performed regression analysis to attempt to control for other factors that might influence one’s opinion of the United States In these regressions, the dependent variable is a person’s opinion of the United States, and the independent variables include a variable representing whether one has traveled to the United States and several control variables. The results of the ordinary least-squares (OLS) regressions in which USOPINION is the dependent variable are reported in Tables C-1 and C-2.
Robust t-statistics are stated in parentheses. The right-hand-side variables included in all regressions are dummy variables representing the effect of each country and controls for age, education, and whether the respondents have friends or family in the United States with whom they correspond regularly. “Extra Controls” are controls for the respondent’s opinion of the dominant country in his or her region and whether the respondent has traveled outside his or her own country in the last 5 years. An observation is excluded from the regression if the respondent answered “Don’t Know” or refused to give a response on any of the relevant questions.
Each numbered column represents a different regression. “N” represents the sample size in each regression (the number of people whose responses are included in the regression). “R-Squared,” which can take values from 0 to 1, represents the amount of the variation in the dependent variable that has been accounted for in the regression by the variation in the independent variables. When R-Squared is higher, more of the variation in the dependent variable has been accounted for by the variation in the independent variables.
The Effect of Traveling to the United States on One’s Opinion of the United States
The row labeled “USTRAVEL” displays the estimated effect in each regression (1, 2, and 3) of United States travel on a person’s opinion of the United States. There are three important components of each box in this row. The first number in each box represents the estimated effect of visiting the United States on one’s opinion of the United States.
In regression 1 (Table C-1), OLS regression analysis of responses to the Pew survey indicates that visiting the United States raises one’s opinion of the United States by 0.109, on the scale that runs from 0 to 3. The t-statistic is in parentheses below the first number and represents how precise our estimate is. In regression 1, the t-statistic is 4.00, which is rather high, indicating that our estimate is somewhat precise. Asterisks after the t-statistic indicate whether the estimated coefficient is significantly different
TABLE C-1 Effect of Visiting on Opinions of the United States
|
|
(1) |
(2) |
(3) |
|
USTRAVEL |
0.109 (4.00)*** |
0.122 (4.52)*** |
0.102 (1.98)** |
|
Extra Controls? |
NO |
YES |
YES |
|
Sample |
ALL |
ALL |
At least a college education; age strictly less than 46 yearsa |
|
N |
11,406 |
11,406 |
2,303 |
|
R-Squared |
0.251 |
0.296 |
0.281 |
|
aAll respondents in the Pew dataset were over 18 years old. |
|||
from 0. Two asterisks indicate significance at the 5 percent level; and three stars indicate significance at the 1 percent level.
The coefficient of USTRAVEL is quite significant in regressions (1) and (2). The coefficient is still significant in regression (3), but the t-statistic is somewhat smaller, probably owing in part to the smaller sample.
Our estimate of the effect of traveling to the United States on one’s opinion of the United States is moderately large, but not enormous: A visit to the United States apparently raises a person’s opinion of the United States by about 0.1 point on a scale that runs from 0 to 3.
Attitudes Toward US Science and Technology
Suppose we had a measure of people’s attitudes toward the United States before they visited. We would be able to estimate the effect of visiting the United States on their attitudes much more convincingly. Although we do not have such data, we do have data on whether they admire United States scientific and technological achievements. People in nearly every part the world frequently come into contact with United States scientific and technological achievements (cars, for example), so it is plausible that their feelings about United States scientific and technological achievements (ADUSST) are almost fully formed by repeated experiences with products in their home countries. Perhaps, then, visiting the United States (USTRAVEL) has little effect on attitudes toward United States science and
TABLE C-2 Attitudes toward US Science and Technology
|
|
(1) |
(2) |
(3) |
|
USTRAVEL |
0.14 (5.17)*** |
0.10 (2.00)** |
−0.13 (-1.17) |
|
ADUSST |
0.34 (14.52)*** |
0.26 (4.83)*** |
0.18 (3.06)*** |
|
USTRADUSST |
|
|
0.29 (2.46)*** |
|
Extra Controls? |
YES |
YES |
YES |
|
Sample |
ALL |
At least a college education; age < 46 years |
At least a college education; age < 46 years |
|
N |
10,492 |
2,272 |
2,272 |
|
R-Squared |
0.346 |
0.287 |
0.289 |
technology (ADUSST).3 Moreover, it is plausible that ADUSST is highly correlated with people’s previsit attitudes toward the United States, inasmuch as we would expect people who like the United States in general also to admire United States science and technology.4 We will therefore use ADUSST as an imperfect measure of respondents’ attitudes toward the United States in the absence of visiting the United States. The results of including ADUSST are shown in Table C-2.
The coefficient of USTRAVEL is positive and significant in regressions (1) and (2). Its size—0.14 and 0.10 in regressions (1) and (2), respectively—is close to the size of the coefficient of USTRAVEL in the regressions reported in Table C-1.
In regression (3), we add a term, USTRADUSST, representing the interaction of USTRAVEL with ADUSST. The coefficient of USTRAVEL is now insignificant. It is interesting that the coefficient of USTRADUSST is positive, relatively large (0.29), and quite significant. Our interpretation is that
people who admire United States science and technology and visit the United States improve their attitude toward the United States substantially.
LIMITATIONS
We lack data on how people’s attitudes toward the United States changed when they visited the United States; we have only cross-sectional data on attitudes. It is therefore plausible to argue that despite the controls we have added to our regression, the “US travel” variable is still endogenous. The regressions may suffer from omitted-variable bias: Other variables that we have not controlled for, and that might not even be in our dataset, may affect one’s opinion of the United States and be correlated with whether one travels to the United States. Reverse causality may be at work: Having a good attitude toward the United States may cause travel to the United States, and not the other way around. Because the data do not contain a good instrument for travel to the United States, we have tried to address the issues in the ways discussed above, but our conclusions must still be viewed with caution.


