
1
International Science and Engineering Graduate Students and Postdoctoral Scholars in the United States
Since World War II, the United States has experienced a steadily growing inflow of students and postdoctoral scholars from throughout the world, most rapidly during the 1990s.1 The increases have taken place despite evidence that US graduate schools give preference to domestic applicants.2 From the 1970s, the strongest inflow of graduate students has been from Asian countries (see Table 1-1). From 1985 to 2001, students from China, Taiwan, India, and South Korea earned more than half the 148,000 US science and engineering (S&E) doctoral degrees awarded to foreign students, 4 times the number awarded to students from Europe.
Scholarly visitors gained clear legal status in 1952, when the Immigration and Nationality Act first offered the F visa for those pursuing academic studies and the J visa for exchange visitors. Today, the total number of foreign citizens studying in the United States (including undergraduates) has passed the half-million mark. The percentage of foreign representation is highest at the doctoral level in S&E fields; in 2002, some 130,821, or nearly one-third, of all graduate students enrolled at US universities came from abroad (see Figure 1-1).
TABLE 1-1 Number of US S&E PhDs Awarded by Selected Country of Citizenship, 1966, 1976, 1986, 1996, and 2003a
Despite the growing presence of international S&E graduate students and postdoctoral scholars, the data gathered by different sources on their numbers and activities are difficult to compare (see Box 1-1), permitting only an approximate picture of their career status and contributions. For example, few analyses accurately describe their impact on higher education, their research contributions to US industry (if they stay in the United States), or their accomplishments abroad (if they do not stay).3 Nonetheless, the
|
1986 |
% of Total |
% of Temporary Residents |
1996 |
% of Total |
% of Temporary Residents |
2003 |
% of Total |
% of Temporary Residents |
|
223 |
1.2 |
5.3 |
3074 |
11.3 |
38.8 |
2559 |
10.2 |
30.9 |
|
524 |
2.8 |
12.6 |
1324 |
4.9 |
16.7 |
801 |
3.2 |
9.7 |
|
417 |
2.2 |
10.0 |
987 |
3.6 |
12.4 |
972 |
3.9 |
11.7 |
|
809 |
4.4 |
19.4 |
1198 |
4.4 |
15.1 |
478 |
1.9 |
5.8 |
|
113 |
0.6 |
2.7 |
153 |
0.6 |
1.9 |
187 |
0.7 |
2.3 |
|
65 |
0.4 |
1.6 |
92 |
0.3 |
1.2 |
34 |
0.1 |
0.4 |
|
2151 |
11.6 |
51.5 |
6828 |
25.0 |
86.1 |
5031 |
20.0 |
60.8 |
|
63 |
0.3 |
1.5 |
171 |
0.6 |
2.2 |
196 |
0.8 |
2.4 |
|
84 |
0.5 |
2.0 |
116 |
0.4 |
1.5 |
114 |
0.5 |
1.4 |
|
48 |
0.3 |
1.1 |
75 |
0.3 |
0.9 |
111 |
0.4 |
1.3 |
|
38 |
0.2 |
0.9 |
70 |
0.3 |
0.9 |
89 |
0.4 |
1.1 |
|
92 |
0.5 |
2.2 |
80 |
0.3 |
1.0 |
55 |
0.2 |
0.7 |
|
16 |
0.1 |
0.4 |
29 |
0.1 |
0.4 |
26 |
0.1 |
0.3 |
|
262 |
1.4 |
6.3 |
341 |
1.3 |
4.3 |
591 |
2.4 |
7.1 |
|
18450 |
|
|
27275 |
|
|
25121 |
|
|
|
4174 |
22.5 |
|
7929 |
29.1 |
|
8276 |
32.9 |
|
high level of participation of foreign-born scientists and engineers in US laboratories and classrooms warrants increased efforts to understand this phenomenon and to ensure that policies regarding their movement and activities are adequate. This chapter summarizes some of the effects of international scientists and engineers on the US S&E enterprise, economy, national security, and other national interests.
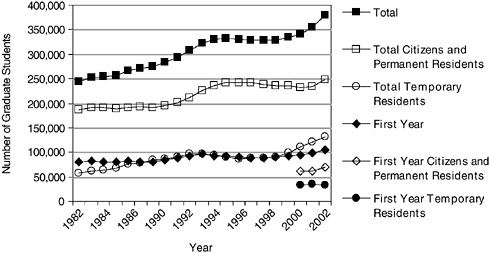
FIGURE 1-1 Total full-time and first-year S&E graduate enrollments, 1982-2002. SOURCE: National Science Foundation. 2004. Survey of Graduate Students and Postdoctorates in Science and Engineering 2002. Arlington, VA: National Science Foundation. Enrollment numbers include medical fields.
TRENDS IN INTERNATIONAL GRADUATE-STUDENT ENROLLMENTS AND POSTDOCTORAL APPOINTMENTS
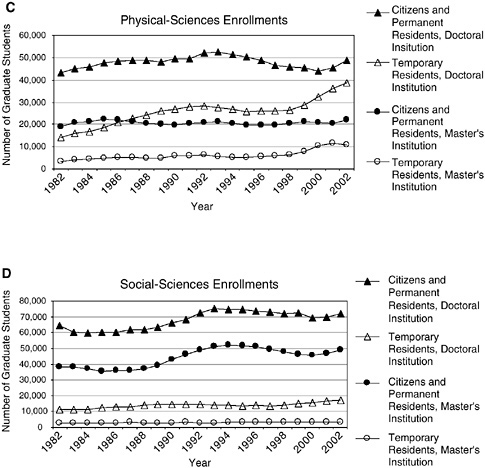
The total number of S&E graduate students in US institutions has grown consistently over the last several decades; within that trend, the share of international graduate students has risen from 23.4 percent in 1982 to 34.5 percent in 2002 (see Figure 1-1). In 2002, international students received 19.5 percent of all doctorates awarded in the social and behavioral sciences, 18.0 percent in the life sciences, 35.4 percent in the physical sciences, and 58.7 percent in engineering4 (see Figure 1-2).
A recent study further delineates the changing demographics of graduate students in US institutions. In 1966, US-born males accounted for 71 percent of science and engineering PhD graduates, and 6 percent were awarded to US-born females; 23 percent of doctoral recipients were foreign-born. In 2000, 36 percent of doctoral recipients were US-born males,
|
BOX 1-1 At least four organizations conduct graduate-enrollment surveys, but their results are difficult to compare. The National Science Foundation (NSF) fields the Survey of Graduate Students and Postdoctorates in Science and Engineering (also known as the Graduate Student Survey, or GSS). The Department of Education fields the Integrated Postsecondary Education Data System (IPEDS); the International Institute of Education (IIE), the Open Doors survey; and the Council of Graduate Schools (CGS), the Graduate Enrollments and Degrees Survey. The surveys use different sampling methods and request different information. IPEDS uses institutional and student self-reported data. NSF, CGS, and IIE use institutional questionnaires; questions cannot be easily compared. The definition of graduate student differs: IIE reports on all master’s, doctoral, and first professional degrees; CGS includes only master’s and doctoral degrees and differentiates by field, degree, and institutional type; IPEDS provides similar but more comprehensive data. NSF surveys graduate departments and counts only master’s and doctoral program enrollment and doctoral degrees. Institutional coverage differs between surveys. Separate fields of study cannot be compared, because some surveys do not report on specific fields, and surveys that do may use different taxonomies. The most recent complete data from IIE are on the graduate class that entered in 2003; 2002 data are available from NSF, CGS, and IPEDS. For this report, we are using enrollment data available from the NSF Division of Science Resources Statistics WebCASPAR database system, http://caspar.nsf.gov. We used the IPEDS Completion Survey to examine master’s degree recipients. Numbers of postdoctoral scholars are available from the GSS. That survey does not provide much demographic information and it provides no information on where the scholars received a doctoral degree. The NSF Survey of Earned Doctorates (SED) provides some information on the proportion of graduate students who intend to go on to postdoctoral appointments, and the NSF Survey of Doctoral Recipients (SDR) provides longitudinal information on careers and conversion to citizenship. However, both the SED and the SDR follow only postdoctoral scholars who earned their PhDs in the United States. For postdoctoral scholars who came to the United States after earning a degree elsewhere—which some estimate at about 50 percent of the total postdoctoral population—there is very little information. We turned to the Sigma Xi National Postdoctoral Survey to get information on this population, but the survey was fielded only in 2004, so longitudinal data are not available. |
25 percent US-born females, and 39 percent foreign-born.5 Among postdoctoral scholars, the participation rate among temporary residents
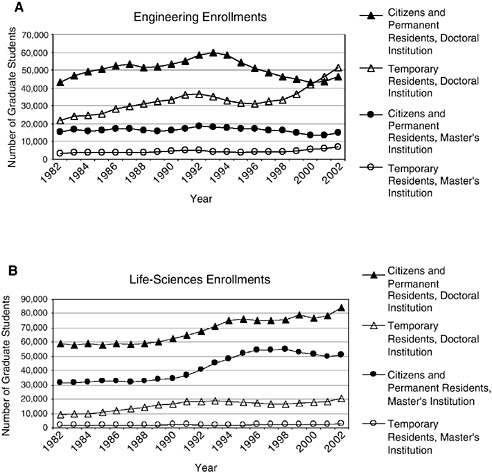
FIGURE 1-2 Enrollments by field, citizenship, and institutional type. SOURCE: National Science Foundation. 2004. Survey of Graduate Students and Postdoctorates in Science and Engineering 2002. Arlington, VA: National Science Foundation.
has increased from 37.4 percent in 1982 to 58.8 percent in 2002 (see Figure 1-3). Similarly, the share of foreign-born faculty who earned their doctoral degrees at US universities has increased from 11.7 percent in 1973 to 20.4 percent in 1999. In engineering fields, the share increased from 18.6 percent to 34.7 percent in the same period.6
|
6 |
National Science Board. 2004. Science and Engineering Indicators 2004 (NSB 04-2). Arlington, VA: National Science Foundation, Appendix Table 5-24. Available at http://www.nsf.gov/sbe/srs/seind02/append/c5/at05-24.xls. |
Quality of International Graduate Students
How can quality of international graduate students be assessed? Several factors play a substantial role in graduate-student admissions decisions. Among them are selectivity of the institution, applicant Graduate Record Examination (GRE) scores and undergraduate grade point average, undergraduate major, prior research experience, and quality of the applicant’s undergraduate institution. The match between the research interests of the applicant and those of departmental faculty also plays a role. Studies show that many admissions committees make implicit adjustments in the GRE verbal score for applicants from non-English-speaking coun-
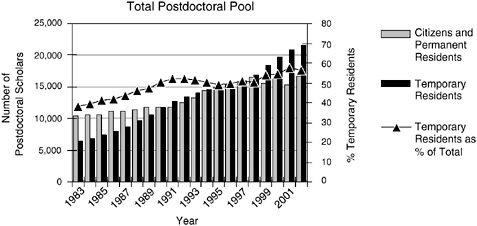
FIGURE 1-3 Academic postdoctoral-scholar appointments in S&E, 1983-2002. SOURCE: National Science Foundation. 2004. Survey of Graduate Students and Postdoctorates in Science and Engineering 2002. Arlington, VA: National Science Foundation. Medical fields are included, but postdoctoral scholars with medical degrees (presumably acting as physicians) are excluded from the analysis.
tries.7 Furthermore, GRE scores offer admissions committees a way to compensate when other measures of quality may not be readily available.8 Whether GRE scores predict success in graduate programs is a subject of some debate. GRE test scores and undergraduate grades have been shown to have similar predictive power for first-year academic success but not necessarily beyond that.9
One measure is to examine enrollments of temporary residents vs citizens and permanent residents in top-ranked graduate programs, which presumably have their pick of the top-ranked candidates, and enrollments at less highly ranked programs. During the 1990s, when overall domestic-student enrollments in S&E graduate programs were decreasing, were top-ranked programs and less highly ranked programs differentially affected? If
domestic students are of higher quality than international students, one would expect (1) proportionately more domestic students in higher-tier graduate programs, which presumably have their pick of students and which students, given the choice, would prefer to attend; (2) a majority of domestic students in higher-tier programs; and (3) under tight supply conditions for domestic students, such as engineering in the late 1990s, an exacerbated difference between higher- and lower-tier programs, so that even fewer domestic students are enrolled in the lower-tier programs.
Using program assessments from the 1995 National Research Council study, Research Doctorate Programs in the United States: Continuity and Change,10 graduate programs in three fields—electrical engineering (EE), biochemistry (BC), and physics (P)—were divided into top-tier (first quartile) and bottom-tier (fourth quartile). Program enrollments from 1992 to 2002 were obtained from National Science Foundation (NSF) data.11 Means ± standard deviations were calculated among programs in each quartile. In the few cases where graduate programs from the Research Council study did not match the NSF departmental data, these programs were excluded from the analysis. Each quartile included 20-30 programs.
The analysis showed that the difference between top- and bottom-tier graduate programs was not statistically significant. For all three fields examined, both top- and bottom-tier programs started the 1990s with about 60 percent domestic students; the proportions decreased similarly throughout the 1990s. One generalizable difference between first- and fourth-quartile programs was the standard deviation of the domestic-student enrollments. First-quartile program enrollments showed a smaller standard deviation for all years than fourth-quartile programs (EE: 1stQ, 18.3-21.3 percent, 4thQ, 18.4-25.3 percent; BC: 1stQ, 14.0-17.4 percent, 4thQ 21.0-28.4 percent; P: 1stQ 15.7-19.5 percent, 4thQ 17.7-29.0 percent).
Because the percentage of domestic students does not vary with program quality and this was not affected by tight supply, one can argue that the quality of domestic graduate students is not higher than that of international students. A caveat: if graduate programs fix, as a matter of policy, the percentage of admissions of domestic students, the proportions may not be a good measure of student quality. The committee found evidence that graduate-program admissions favor domestic students12 but found no evidence that outright percentages had been established.
Other research has shown differences in performance between international and domestic S&E researchers working in the United States.13 While no significant difference was found in the number of grants, dollar amount of grants, or success rates in obtaining grants, in both normal and fractional count of publications, international scientists were consistently more productive than their domestic counterparts. These differences may be due to a strong incentive among international scientists to engage in research. Even if these international scientists were interested in activities or jobs other than research, their chances of getting them were lower than for domestic scientists.14
Recent Trends in International Graduate-Student Enrollments
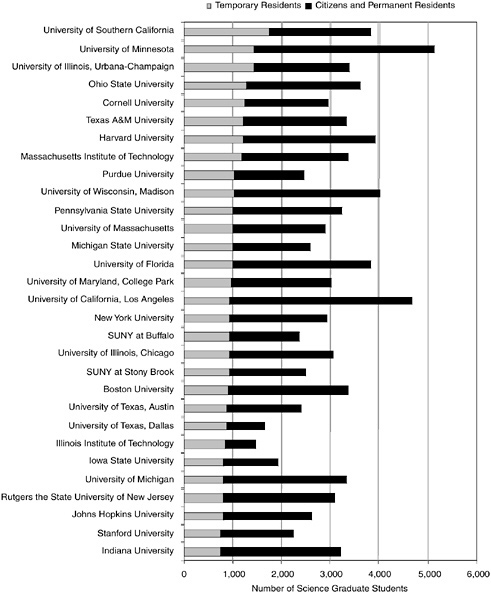
For doctorate-granting institutions, total enrollment of international S&E graduate students increased dramatically between 2000 and 2002. In 2002, 55.5 percent of international S&E graduate students were enrolled at Research I (R1) universities; R1s also enrolled the highest proportion (26.0 percent) of international students (see Figure 1-4). Institutions enrolling the largest numbers of international S&E graduate students are shown in Figures 1-5 and 1-6. First-time enrollments of international S&E graduate students have been tracked only since 2000 by NSF and since 2002 by CGS, and data from both sources are available only to 2002.15 It is therefore difficult to ascertain trends after 2002. In 2002, NSF noted a decrease in first-time full-time S&E graduate enrollments among temporary residents, by about 8 percent for men and 1 percent for women.16 At the same time, first-time full-time S&E graduate-student enrollment increased by almost 14 percent for US citizens and permanent residents—15 percent for men and more than 12 percent for women.
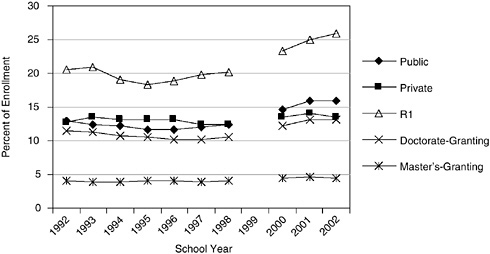
FIGURE 1-4 Enrollment of international graduate students by institutional type. SOURCE: Data are from the Council of Graduate Schools CGS/GRE Graduate Enrollment and Degrees annual surveys from 1992-2002. Available at http://www.cgsnet.org/VirtualCenterResearch/graduateenrollment.htm. The CGS enrollment numbers include all major S&E fields, as well as business, education, humanities and arts, and public administration and services. The non-S&E fields have 3 and 17 percent enrollment of international students. CGS states, “Institution type was a major differentiating variable in the enrollment of non-US students, reflecting the concentration of international students in doctoral programs in science and engineering.”
The decline in first-time international graduate-student applications has stimulated considerable discussion (see Box 1-2) and more than a few warnings that our national S&E capacity may have begun to weaken. The picture for international graduate-student total full-time enrollments is different. For 2002, NSF reported an 8 percent gain in temporary residents enrolled in S&E graduate programs. That gain is smaller than for the previous 2 years (12 percent and 9 percent), but 2002 total full-time enrollment levels exceeded the annual gains for most other years during the last two decades.
What is the meaning of the declining first-time enrollment numbers for international S&E graduate students? Several interpretations seem plausible. First, the decline began from an enrollment peak that followed the atypical economic conditions of the late 1990s. One cause of the rising international enrollment of the 1990s may have been the lure of jobs in dot.com industries. Access to US jobs for foreign-born people is often much better for those who have been educated in the United States. Enrollments
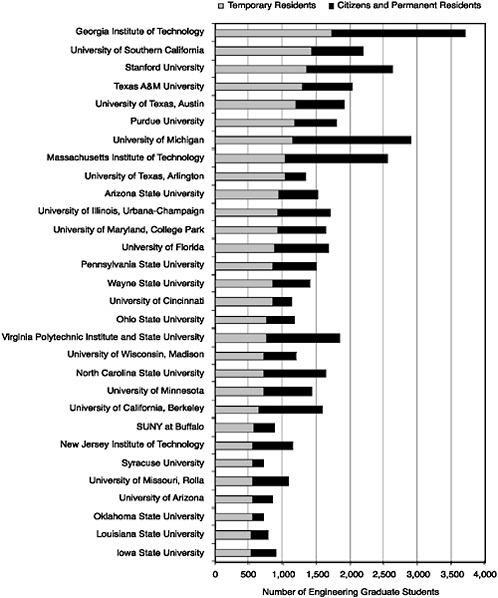
FIGURE 1-5 Top 30 Institutions for enrollment of temporary-resident engineering graduate students, 2002.
SOURCE: Data for Figures 1-5 and 1-6 are from: National Science Foundation. 2004. Survey of Graduate Students and Postdoctorates in Science and Engineering 2002. Arlington, VA: National Science Foundation.
|
BOX 1-2 Since 9-11, the Institute of International Education (IIE) and the Council of Graduate Schools (CGS) have attempted to quantify the effects of visa and immigration changes on the flow of international graduate students and postdoctoral scholars. Both surveys have limitations but they provide potentially useful insights into recent trends. IIE, supported by the US Department of State, has been collecting information on international student flows, including enrollments in US graduate schools, since 1950. Its Open Doors reporta provides data on international students in all fields and visiting scholars who are teaching or conducting research on US campuses; it also provides data on US students abroad. IIE reports place of origin, funding sources, and fields of study of graduate students. Its fall 2003 and 2004 enrollment surveys did not break down graduate enrollment by field and included master’s and doctoral students in business, engineering, science, and other fields. Retrospective numbers indicate that S&E fields represent about 40 percent of total international enrollments, but it is not possible to gather field-specific information specifically for graduate students from these snapshot surveys. CGS has been collecting graduate application, admission, and enrollment data since 1986.b CGS surveys virtually all PhD-granting institutions in the United States and collects enrollment data by institutional type, ethnicity, sex, and citizenship. CGS gathers information on S&E fields, business, education, humanities and arts, and public administration and services, and it groups together as “other” such fields as architecture, communications, home economics, library sciences, and religion. It performed snapshot applications, admissions, and enrollment surveys in 2003 and 2004, but the most recent complete data publicly available are from 2002. On the basis of these snapshot surveys, CGS reported substantial decreases in international graduate-student applications and admissions between 2003 and 2004 (see Table 1-2 below).c International student applications and admissions to S&E graduate programs were among the hardest-hit. Most graduate students apply to more than program, so the application rate does not correspond with numbers of students. A drop in application rate may reflect the same total number of students applying to fewer schools and does not imply a drop in quality. This interpretation is supported by CGS data, which showed the later decrease in enrollments to be much smaller.d Total domestic-student applications and admissions did not change between 2003 and 2004, whereas enrollments decreased by 5 percent. Data from IIE indicate a smaller increase in first-time international-student enrollments than would be expected on the basis of previous trends.e Data from the CGS 2005 survey of graduate-school applications indicate a 5 percent overall decrease in international-student applications between 2004 and 2005. Engineering programs saw a 7 percent decrease, life sciences programs a 1 |
|
TABLE 1-2 Change in Applications, Admissions, and Enrollments for International Graduate Students 2003-2004d,f
percent decrease, and physical sciences a 3 percent decrease.f The American Institute of Physics (AIP), concerned about anecdotal evidence that international graduate enrollments were declining after 2001, performed a survey of PhD-granting physics departments in 2003 to complement its annual survey of departments.g AIP found that the proportion of international physics graduate students, after rising steadily for several decades to a peak of 55 percent in 2000, declined by 10 percent between 2000 and 2002. What seems to be driving the decline in enrollments is a mix of reduced applications and reported difficulties in obtaining nonimmigrant visas. For the CGS surveys, the three primary reported causes of the declines in international graduate applications, admissions, and enrollments were increased global competition for students, changed visa policies, and less-favorable perceptions of the United States abroad. In the AIP survey, during the year preceding June 2003, two-thirds of the PhD-granting physics departments and almost half the master’s-granting departments reported that they had accepted foreign students who were unable to enroll because of visa difficulties.
|
|||||||||||||||||||||||||||||||||||||||
also may have been influenced by the increases in research assistantship funding for graduate students and postdoctoral scholars during the middle to late 1990s, led by a rapid increase in the budget of the National Institutes of Health (NIH).17 The current decline, on the other hand, coincides with an economic recession and could be interpreted as a return from an unsustainable peak to a point on a long-term curve that had been rising steadily for many years.
A second possible interpretation is that the recent 3-year decline is the beginning of a long-term downward trend. It may be too early to justify that interpretation or to decide whether such a trend is a sign of weakening in US S&E. For example, there is no evidence yet that the quality of graduate students or the staffing levels in laboratories has suffered. S&E populations have always fluctuated and in ways that are seldom expected; it may simply be too early to discern the causes of the recent decline.18
Decline in Students Taking Proficiency Exams
Another factor to consider is the decline in international students taking graduate-school entrance exams (see Figure 1-7). Often seen as early indicators of student intentions, these numbers, too, have been declining recently. The Educational Testing Service (ETS), which administers several leading proficiency examinations for students, reports declines in the volumes of international students using its products. For example, the number of TOEFLs (tests of English as a foreign language) administered to students applying to US graduate schools has declined from a peak in 2002. In addition, the number of Graduate Record Examinations (GREs) taken by international students dropped last year. In India and China, the two largest-volume countries, the number of GRE test-takers fell by about 50 percent from 2003 to 2004. One interpretation of the decline is that fewer international students want to study in the United States. However, the decline in TOEFL volumes is likely to have been influenced by increasing competition from the International English Language Testing System (IELTS). The volume of IELTS users increased from 75,000 in 1997 to 475,000 in 2003,19 especially as some countries with growing higher-edu-
|
17 |
The NIH budget doubled from $13.6 billion in FY 1998 to $27.3 billion in FY 2003. |
|
18 |
One review of the NIH budget concluded that the dramatic growth of its budget did not result in an increase in new US doctorates or in the number of US citizens in postdoctoral appointments even while the number of international postdoctoral scholars was rising. Howard H. Garrison, Susan A. Gerbi, and Paul W. Kincade. 2003. “In an era of scientific opportunity, are there opportunities for biomedical scientists?” FASEB Journal 17:2169-2173. |
|
19 |
IELTS 2003 Annual Review, available at http://www.ielts.org/library/AnnualReview2003_v1.pdf. |
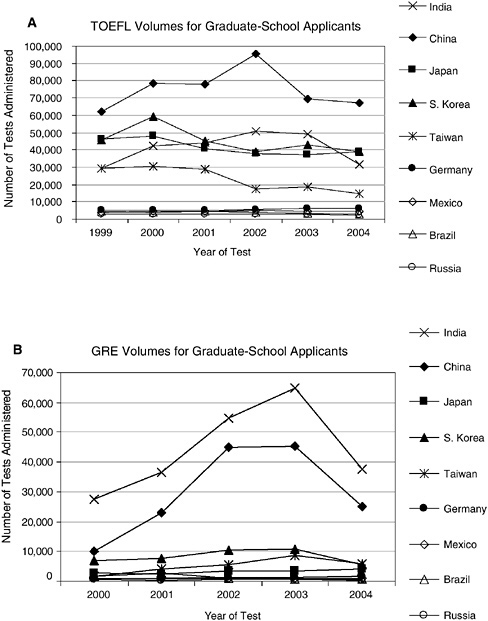
FIGURE 1-7 Graduate school entrance examinations.
SOURCE: Data are from the Educational Testing Service and are available at http://ftp.ets.org/pub/gre/volumes_00_04.pdf.
cation sectors, such as Australia, require its use and do not accept TOEFL scores.20
GRE volumes decreased in Asia after antifraud measures were taken in October, 2002. ETS learned that verbal portions of the GRE and some of the answers were being posted on Web sites in Asian countries by students who had memorized them. Replacement of the computerized test with paper versions that are changed with each testing date has decreased the number of students taking the test multiple times and may have discouraged some portion of less-qualified students from taking it.21 In addition, Australia, Canada, and other countries competing with the United States for graduate students do not require applicants to take the GRE.22
Initially, some observers had ascribed the decline in volumes of TOEFL and GRE tests to 9/11 visa and immigration policies. However, although these policies may have had an effect, other factors, including competition for other testing services and antifraud measures, probably played a larger role in the decline. A lesson to be learned is that both test-taking and application to US graduate schools can be influenced by factors that may not be apparent at first glance.
International Postdoctoral Scholars
There is less quantitative information about the career paths and experiences of postdoctoral appointees than of graduate students (see Box 1-1 and the discussion of data needs in Chapter 4). Postdoctoral work has become the norm in the physical and life sciences and is becoming more common in other fields. The purpose of a postdoctoral position is to provide a year or more of stipend support to deepen training, complete publications, and otherwise prepare for long-term employment. Most postdoctoral scholars work in academe, and about 10-14 percent in other sectors, chiefly industry and the national laboratories. Little is known about the educational background, motivations, or career paths of either domestic or international postdoctoral scholars.
It is apparent that international postdoctoral scholars play an active and sometimes dominant role in academic S&E research. Their participa-
tion varies by field, as does that of graduate students. The most recent numerical analysis of the postdoctoral population in the United States from the GSS shows that the total number of nonphysician academic postdoctoral scholars in S&E fields in US institutions has almost doubled since the middle 1970s, from about 20,000 to 38,000.23 In the most recent decade for which data are available, the numbers of postdoctoral scholars with temporary-residence visas increased rapidly, rising from 6,472 in 1983 to 21,601 in 2002; the number of US citizens and permanent residents in postdoctoral positions rose much more slowly, from 10,432 in 1983 to 16,715 in 2002 (see Figure 1-3). The growth in postdoctoral positions was largest in the life sciences, where total numbers increased from 9,494 in 1983 to 26,262 in 2002 (see Figure 1-8). Life-sciences postdoctoral scholars in 2002 represented 68.5 percent of the total postdoctoral population. The increasing propensity to take a postdoctoral position is not just attributable to the increased number of PhDs being awarded in the life sciences but also strongly correlated with the increased population of international graduate students,24 many of whom move into postdoctoral positions.
Where Do International Postdoctoral Scholars Come From?
Two independent estimates indicate that of the 60 percent of academic postdoctoral scholars who hold temporary visas, about four-fifths have non-US doctorates, which means that half of all US academic postdoctoral scholars have non-US doctorates.25 The scientific society Sigma Xi recently completed a survey of the US postdoctoral population that provides a demographic snapshot for 2004.26 Sigma Xi found that 53 percent of re-
|
23 |
These numbers include postdoctoral scholars in health fields but exclude postdoctoral scholars with medical degrees, who are presumably working as physicians. The figures in this report include only postdoctoral scholars at US academic institutions. In its report Enhancing the Postdoctoral Experience for Scientists and Engineers (Washington, DC: National Academy Press, 2000), COSEPUP inferred the NSF figure on academic appointments to be 73% of the total number of postdoctoral appointments. |
|
24 |
Paula E. Stephan and Jennifer Ma. 2005. “The Increased Frequency and Duration of the Postdoctorate Career Stage.” American Economics Association Conference, January 7-9, 2005, Philadelphia, PA. Available at http://www.aeaweb.org/annual_mtg_papers/2005/0108_1430_1204.pdf. |
|
25 |
Mark Regets, senior analyst, Science Resource Statistics, National Science Foundation, presentation to committee, July 19, 2004. Estimates based on the NSF Survey of Doctorate Recipients 2001 and the NSF Survey of Graduate Students and Postdocs 2001; Geoff Davis, Sigma Xi National Postdoctoral Survey, comments to the committee November 11, 2004. |
|
26 |
Geoff Davis, director, Sigma Xi National Postdoctoral Survey Project, presentation to committee, November 11, 2004. Sigma Xi e-mailed a Web survey to 22,178 postdoctoral scholars at 46 institutions, including 18 of the 20 largest academic employers of postdoctoral scholars and NIH. Participants’ postdoctoral status was verified by their institutions. 8,392 (38 percent) responded; 6,775 (31percent) completed the 100-question survey. For more information and nonresponse analysis, see http://postdoc.sigmaxi.org. |
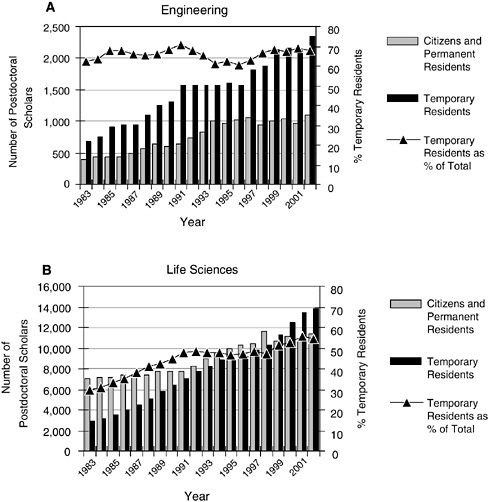
FIGURE 1-8 Academic postdoctoral-scholar appointments by field, 1983-2002.
SOURCE: National Science Foundation. 2004. Survey of Graduate Students and Postdoctorates in Science and Engineering 2002. Arlington, VA: National Science Foundation. Postdoctoral scholars with medical degrees are excluded from the analysis. Physical Sciences include mathematics, earth science, and computer science. Life Sciences include biological science, agricultural science, and health fields. Social Sciences include behavioral science.
spondents were temporary visitors, 41 percent were US citizens, and 6 percent were permanent residents. Of the total sample, nearly half—46 percent—had received their PhDs abroad (see Figure 1-9). Citizenship and country where PhD was awarded varied by field (see Figure 1-10). Of postdoctoral scholars on temporary visas, almost 80 percent had earned their PhDs outside the United States. Of those with non-US PhDs, the
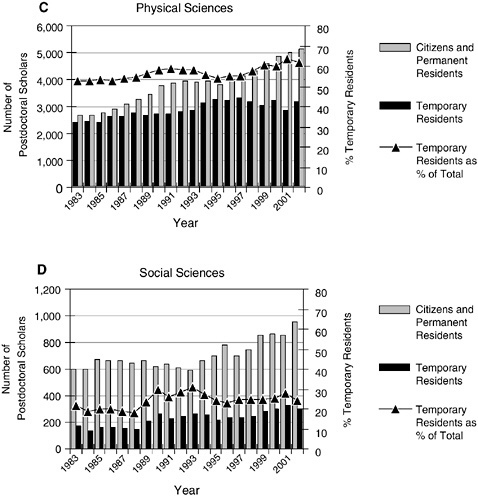
highest number came from China (25 percent), followed by India (11 percent), Germany (7 percent), South Korea (5 percent), Canada (5 percent), Japan (5 percent), the UK (4 percent), France (4 percent), Spain (2 percent), and Italy (2 percent). One conclusion that can be drawn from the numbers is that the United States is benefiting from an inflow of postdoctoral scholars who have received graduate support and training elsewhere.
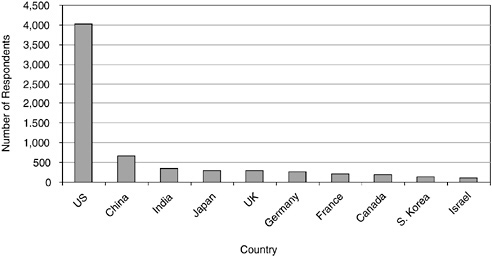
FIGURE 1-9 Where postdoctoral scholars received doctorates.
SOURCE: Data for Figures 1-9, 1-10, 1-11, 1-12, and 1-21 are from the Sigma Xi National Postdoctoral Survey. 22,178 postdoctoral scholars at 46 institutions were contacted, including 18 of the 20 largest academic employers of postdoctoral scholars and NIH. Postdoctoral status was confirmed by the institution. 8,392 (38 percent) responded; 6,775 (31 percent) of the respondents completed the entire survey, which included over 100 questions.
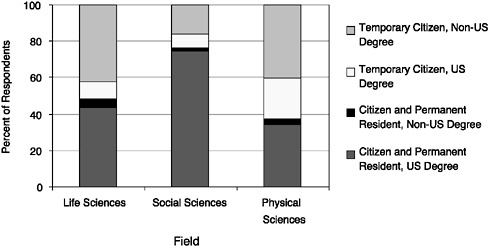
FIGURE 1-10 Postdoctoral-scholar citizenship, field, and country of doctorate.
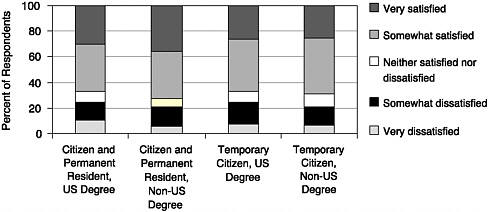
FIGURE 1-11 Satisfaction with postdoctoral experience in the United States.
The Postdoctoral Experience for Temporary Residents
Sigma Xi also collected information on training experience and compensation. International and domestic academic postdoctoral scholars expressed similar satisfaction with their training experience (see Figure 1-11). Temporary residents showed a greater tendency than US citizens to feel that their postdoctoral position was preparing them for an independent research position (see Figure 1-12). Access to funding sources and employment opportunities was more limited for noncitizens, and a significant difference in annual stipend levels was reported. Temporary residents earned 7 percent less than citizens ($37,600 for temporary residents versus $40,400 for citizens). Temporary residents worked longer hours and earned an estimated “hourly wage” ($14.52) that was 11 percent smaller than that of US citizens ($16.29).27 The difference was noticeable by source of degree: temporary residents with non-US PhDs (41 percent) earned $3,100 less than citizens with US PhDs (43 percent). Similar differences in stipend support are corroborated by data on doctorates with US degrees from NSF’s longitudinal Survey of Earned Doctorates (see Figure 1-13).
The Changing Balance of International and Domestic Scientists and Engineers
The numbers of US citizens and permanent resident graduate students in S&E fell between 1993 and 2002 at the same time that the numbers of
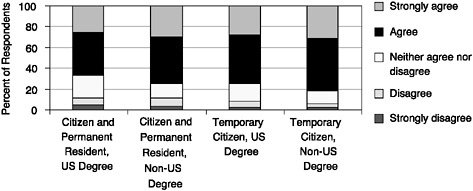
FIGURE 1-12 Preparation for independent position.
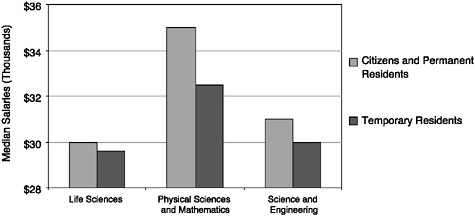
FIGURE 1-13 Median 2001 postdoctoral-scholar stipends by citizenship and field, for the 1999-2000 PhD cohort.
SOURCE: National Science Foundation. 2004. Survey of Earned Doctorates 2002. Arlington, VA: National Science Foundation.
international graduate students increased.28 There is considerable discussion about whether the presence of high numbers of international graduate students in some fields can make those fields less appealing to US students
and about how to encourage women and members of underrepresented minority groups to pursue careers in S&E.29
Some have suggested that students who complete S&E undergraduate work outside the United States are more knowledgeable and better prepared for graduate studies than are US students. Certainly, in many countries the approach is to provide a narrow, focused undergraduate education. International students with bachelor’s degrees often take courses only in their major areas, whereas US students are required to take many courses outside their major areas. For example, in nuclear physics, less than 30 percent of US citizens had taken an advanced undergraduate course in nuclear science versus about 60 percent of international students. Furthermore, of US students in doctoral nuclear-science programs, only 5 percent had a master’s degree, whereas over 50 percent of international students had completed a master’s degree before starting doctoral work in the United States.30 Even so, it appears that US students catch up in content knowledge by the second or third year of graduate study, and the time to degree does not differ between international and domestic students.
As the numbers of S&E baccalaureate degrees awarded to members of underrepresented minority groups has increased, there has not been a concomitant increase in graduate-school enrollments.31 However, it is not clear whether women or underrepresented minority-students are being displaced or are choosing other career paths. An empirical study of admissions to graduate schools showed in the aggregate a substantially higher rate of acceptance of US citizens over international applicants, a modestly higher rate of acceptance of women than men in three of the fields studied, and a substantially higher rate of acceptance of members of underrepresented minorities over other US citizens in all five fields studied.32
More recent studies also find no evidence of displacement of women and underrepresented minorities in the graduate admissions process. For
example, one study found no evidence of displacement but marked effects on educational outcomes, describing a negative correlation between the enrollment of temporary residents and US citizens in graduate programs. The most elite institutions saw the largest increases in temporary-resident enrollment and the steepest drops in enrollment of US citizens.33 Those effects were statistically significant for white males but not for women or underrepresented minorities. It is not clear whether white males were deterred from enrolling by international students or chose other career paths for different reasons. For example, some may have been drawn to business careers during the dot.com and financial-services boom or to other high-paying professions throughout the 1990s, many of which did not require graduate training.
Additional evidence suggests that there is no displacement of US citizens from graduate programs by temporary residents. The number of PhDs granted to undergraduates from US institutions changed little during the 1990s while the number of non-US bachelor’s-degree recipients obtaining US doctorates rose sharply. Thus, the large change in the proportion of citizen to temporary-resident graduate students was caused primarily by the expansion of PhD programs, with a majority of the new slots being taken by international students.34 Another researcher calculated that an increase of one full-time temporary resident student in an S&E graduate department was not associated with displacement of US citizens or members of underrepresented minority groups.35 Graduate application and admissions data from CGS (see Box 1-2 and Table 1-2) support these findings. In this “natural experiment” following 9-11, the number of international graduate-student applications and admissions fell dramatically. During the same period, domestic-student applications remained flat, and admissions decreased. If international students displaced domestic students, one would have expected to see a rise in domestic admissions instead of a drop.
Another study examining possible displacement of domestic scientists and engineers from S&E describes the importance of several other factors. First, the displacement of US citizen scientists and engineers occurs mostly from “temporary” jobs in academe, not from “permanent” jobs in academe. Thus, US citizens are losing academic positions that are less valued rather than highly valued. Second, the finding that displacement is largest
for those in mathematics and computer science suggests that at least in some fields US citizens were not pushed from the academic sector but rather pulled by better opportunities and higher-paying positions elsewhere in the economy.36
ECONOMIC IMPACT OF INTERNATIONAL GRADUATE STUDENTS AND POSTDOCTORAL SCHOLARS
Economists have debated whether the inflow of international scientists and engineers has a favorable or unfavorable effect on the US economy. Most of the research has concerned inflows of unskilled workers, who have constituted a rising share of US immigrants in recent decades. Those workers are thought to reduce the wages of domestic unskilled labor and contribute to rising wage inequality.37 There is less evidence that skilled visitors have that effect.38 Indeed, some researchers argue that a disproportionate increase in the number of high-skill immigrants will lower the wages of high-skilled US workers, raise the wages of low-skill workers, and thereby reduce income inequality. Although high-skill immigrants may reduce the economic incentives for citizens to enter high-skill fields, they do contribute to technology development and innovation. Furthermore, the researchers argue that children of high-skill parents disproportionately tend to be highly skilled themselves, creating a beneficial fiscal impact on future innovation capacity.39
|
36 |
Sharon G. Levin, Grant C. Black, Anne E. Winkler, and Paula E. Stephan. 2004. Differential Employment Patterns for Citizens and Non-Citizens in Science and Engineering: Minting and Competitive Effects (Working Paper). Available at http://www2.gsu.edu/~ecopes/foreignscientists/index.htm. |
|
37 |
X. Clark, T. J. Hatton, and J. G. Williamson. 2002. Where Do US Immigrants Come From, and Why? (Working Paper Number 8998). Cambridge, MA: National Bureau of Economic Research. |
|
38 |
Borjas has indicated that an immigration-induced 10 percent increase in the supply of doctorates in a particular field at a particular time reduces the earnings of that cohort of doctorates by about 3-4 percent. About half this adverse wage effect was attributed to the increased prevalence of low-pay postdoctoral appointments in fields that have softer labor-market conditions because of large-scale immigration. At the same time, he suggests that a benefit of immigration may be the possibility “that the sizable increase in the skill endowment of the workforce accelerates the rate of scientific discovery.” George J. Borjas. 2004. “Immigration in high-skill labor markets: The impact of foreign students on the earnings of doctorates.” American Economic Association Conference, January 7-9, 2005, Philadelphia, PA. Available at http://www.aeaweb.org/annual_mtg_papers/2005/0108_1430_1201.pdf. |
|
39 |
Thomas MaCurdy, Thomas Nechyba, and Jay Bhattacharya. 1998. “An economic framework for assessing the fiscal impacts of immigration.” In: The Immigration Debate: Studies in the Economic, Demographic and Fiscal Effects of Immigration. Washington, DC: National Academy Press, pp. 13-65. |
Direct Economic Impact
Chapter 3 discusses the rise of global competition for students, especially among countries where English, the language of most scientific conferences and publications, is the dominant tongue. Some of those countries, notably Australia, emphasize the direct economic impact of international students, which, for economies of modest size, can be considerable. By one estimate, the inflow of fees, tuition, and living expenses from international students constitutes Australia’s third-ranking services export industry.40
Similarly, NAFSA: The Association of International Educators has estimated that higher education for international students accounted for US revenues of $12.87 billion in the 2003-2004 academic year.41 That figure is often cited in the press,42 but it requires interpretation. The NAFSA figure applies to all international students at all levels of study and includes not only tuition and fees paid by undergraduates and professional students but also expenditures on travel, food, housing, incidentals, and the cost of supporting a family. The NAFSA number does not reveal the intricacies of subsidies and taxpayer support for graduate education. An accurate revenue and cost estimate would have to take into account not only types of funding but also sources of funding and determinants of tuition waivers.
Tuition and Fees
From the data on annual tuition, fees, and average support in Table 1-3, it is clear that overall, graduate students are receiving more financial support than they are paying in tuition.
State universities may recoup some of the graduate-student support costs by charging out-of-state tuition for international students. Although undergraduate and some master’s students usually pay their own tuition through family or other sources, most graduate students do not. At the undergraduate level, international students on F-1 visas generally cannot obtain residence for tuition purposes and are therefore subject to nonresident tuition fees (NRTs) for the duration of their studies. US citizen and permanent-resident out-of-state undergraduate and graduate students are
|
40 |
Simon Marginson, “Australian higher education: National and global markets.” In: Markets in Higher Education: Rhetoric or Reality? eds. P. Teixeira, B. Jongbloed, D. Dill, and A. Amaral. Dordrecht, The Netherlands: Kluwer, pp. 207-40. |
|
41 |
NAFSA, the Association of International Educators. 2004. The Economic Benefits of International Education to the United States of America: A Statistical Analysis. Available at http://www.nafsa.org/content/PublicPolicy/DataonInternationalEducation/econBenefits.htm. |
|
42 |
For example, see Joseph S. Nye Jr. 2004. “You can’t get here from there,” The New York Times (November 29). |
TABLE 1-3 Annual Revenues and Costs of Graduate Education per Full-Time Doctoral Student, 2000-2001
|
Tuition/Fees Paid and Average Support Provided per Full-Time Doctoral Student |
||
|
|
Tuition and fees paida |
Average support providedb |
|
Public (in-state) |
$4,243 |
$29,929 |
|
Private |
$14,420 |
$47,129 |
|
Average |
$8,070 |
$37,234 |
|
|
Full-time S&E doctoral enrollment, 2000 |
|
|
Citizens |
231,070 |
|
|
Temporary Residents |
110,213 |
|
|
Total |
341,283 |
|
|
aNational Center for Education Statistics. 2002. Digest of Education Statistics, 2002 (NCES 2003060). Washington, DC: US Department of Education, Table 315. Average graduate-student tuition was weighted by fall full-time graduate enrollment. These numbers include all doctoral-degree programs but not professional schools. NOTES: A rough estimate of the total investment in S&E graduate enrollment from state, federal, university, and private sources can be obtained by multiplying average support by S&E enrollment, yielding a figure of $13 billion. bNational Center for Education Statistics. 2002. Ibid, Tables 323 and 345. These numbers include all doctoral-degree programs but not professional schools. |
||
frequently granted residence after one year.43 In comparison, at the graduate level, many public universities grant tuition waivers to nonresident academic student employees, such as teaching assistants (TAs) and research assistants (RAs), but these waivers vary considerably by state, within state campuses, and even by departments within an institution.44 If funding is available, individual S&E departments also offer to cover tuition charges, using research grant funds, to attract and retain talented international graduate students. Other funding sources include competitive fellowships and scholarships. Table 1-4 shows policies for several of the public universities with the highest numbers of international graduate students (see Figures 1-5 and 1-6).
|
43 |
Jim Caufield. 2000. “UC nonresident tuition policy: long on numbers, short on vision.” Commissioned by UCLA Graduate Students Association. Available at http://gsa.asucla.ucla.edu/issues/nonresident.html. |
|
44 |
Scott Smallwood. 2004. “Stipends for graduate assistants, 2003-4.” Chronicle of Higher Education. (October 15). Available at http://chronicle.com/stats/stipends/2004/. |
TABLE 1-4 Public University Tuition Waiver Policies for International Graduate Students
|
Institution |
Regulation on Tuition Waivers |
|
State University of New York at Stony Brook |
Tuition charges waiveda |
|
University of Arizona |
Tuition charges waivedb |
|
University of California, Los Angeles |
No waiver for TAs; varying amounts of tuition charges waived for RAs depending on percentage of appointment. Nonresident tuition (NRT) is reduced by 75% for PhD students who have advanced to candidacya,b |
|
University of Florida |
Tuition charges waiveda |
|
University of Illinois at Urbana-Champaign |
Tuition charges waived for TAs and RAs with a minimum 25% through 67% appointment; the tuition waiver varies between a “base-rate” and a “full” waiver, depending on the graduate program in which the student is enrolled; the base-rate waiver is for the lowest, in-state tuition rate, and the full waiver covers the tuition as assessed, whether resident or nonresidenta,c |
|
University of Kansas |
|
|
University of Maryland at College Park |
No waiverd |
|
University of Michigan at Ann Arbor |
State and Federal Funding Sources
Like domestic graduate students, international graduate students are typically subsidized by federal, state, university, foundation, and other sources. Many are supported by research assistantships (RAs), with funding obtained by a principal investigator from government grants (such as from NSF, NIH, the Department of Energy, the Department of Agriculture, the Department of Education, and the Department of Defense) and corporate contracts. Others are supported by teaching assistantships (TAs) funded by universities, with funds from state legislatures for public universities or tuition and endowment income for private universities. TAs and RAs are working at low wages, so the calculation of how much they are subsidized
|
Institution |
Regulation on Tuition Waivers |
|
University of Nebraska |
NRT waived for TAs and RAsb |
|
University of Texas at Austin |
NRT waived for TAs, RAs,a,b and nonresident or international students receiving competitive scholarships of at least $1000; resident tuition must still be paidf |
|
University of Virginia |
|
|
University of Washington |
|
|
University of Wisconsin, Madison |
Tuition charges waived for TAs and RAs with 33.3% or 50% appointments (depending on department)a,e |
|
aScott Smallwood. 2004. “Stipends for Graduate Assistants, 2003-4.” Chronicle of Higher Education. (October 15). Available at http://chronicle.com/stats/stipends/2004/. bJim Caufield. 2000. “UC nonresident tuition policy: long on numbers, short on vision.” Commissioned by UCLA Graduate Students Association, http://gsa.asucla.ucla.edu/issues/nonresident.html. cGraduate College, University of Illinois, http://www.grad.uiuc.edu/issues/nonresident.html. dPersonal communication. eOffice of Budget and Planning, University of Michigan, http://www.umich.edu?~urel/gsi-sa/comparison.html. fOffice of Accounting, University of Texas at Austin, http://www.utexas.edu/business/accounting/sar/waivers.html. |
|
is further complicated. Smaller numbers of students receive fellowships or scholarships from various sources.45
The types of funding are similar for both domestic and international graduate students, but the mix of funding is different (see Figure 1-14), partly because of restrictions on access to specific funding streams. The
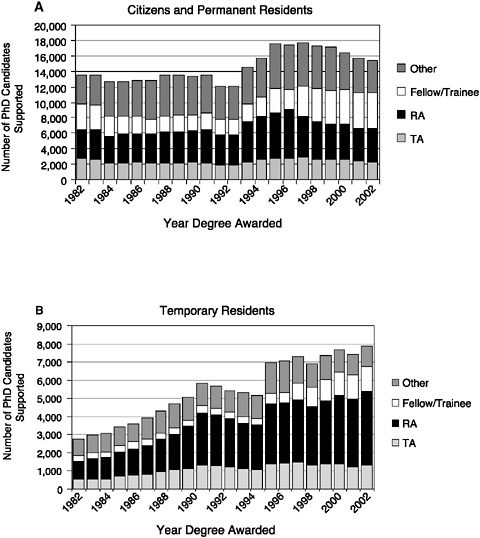
FIGURE 1-14 Primary mechanisms of support for doctoral candidates, 1982-2002.
SOURCE: National Science Foundation. 2004. Survey of Earned Doctorates 2003. Arlington, VA: National Science Foundation. Other: support from the student or scholar’s institution of higher education, state and local government, foreign sources, nonprofit institutions, or private industry; traineeships: educational awards given to students selected by the institution or by a federal agency; research assistantships: support for students whose assigned duties are primarily in research; teaching assistantships: support for students whose assigned duties are primarily in teaching.
primary support mechanism for postdoctoral scholars is the research grant (see Figure 1-15). Funding numbers for postdoctoral scholars are not reported by citizenship, but restrictions limit the access of international scholars to training grants and fellowships. This has a greater effect in fields with a high proportion of such awards, particularly life sciences and social sciences (see Figure 1-16).
The use of public funding to educate international graduate students has provoked controversy, especially in states whose legislatures have complained that such students may later move to other states or return to their home countries. Critics also list the incremental costs of educating international graduate students, including costs for recruitment, verification of credentials, international-visitor offices, English classes, and for some, early admission to allow time for acculturation.
Stay Rates of International Graduate Students
Clearly, both domestic and international scientists and engineers have an opportunity to make a lasting impact on the US economy. Their impact can be inferred from, if not proved by, their participation in US universities, industries, and national laboratories after they receive their doctorates. In total, foreign-born scientists and engineers were 22.7 percent of the US S&E labor force in 2000, an increase from 12.7 percent in 1980 (Figure 1-17). Representation of foreign-born scientists and engineers in US S&E occupations varies by field and increases with degree level (Figure 1-18 and Table 1-5). Foreign-born doctorates were 37.3 percent of the US S&E labor force, an increase from 23.9 percent in 1990 (see Figure 1-17).
Plans to stay vary by field and by when the PhD was awarded (Figure 1-19). One study found that 45 percent of international students from developing countries planned to enter the US labor market for a time and 15 percent planned to stay permanently; another 15 percent planned to go to a third country.46 Stay rates appear to be responsive to economic conditions in the United States. For example, during the dot.com boom in the late 1990s, there was a surge of interest among international engineering doctorates in remaining in the United States. Similarly, the propensity for domestic students to enter graduate programs is affected by the job market, as seen by the rapid downturn in domestic physics and engineering graduate enrollments in the late 1990s (see Figure 1-2).
Another study has shown that the stay rate of international doctorate scientists and engineers has increased steadily and substantially in the last
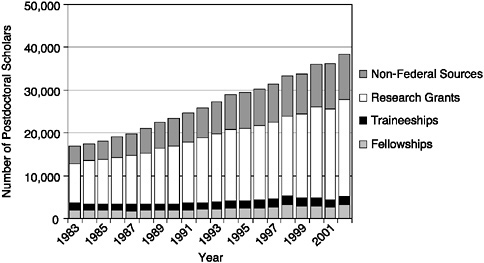
FIGURE 1-15 Primary mechanisms of support for postdoctoral scholars, 1983-2002.
SOURCE: Data for Figures 1-15 and 1-16 are from National Science Foundation. 2004. Survey of Earned Doctorates 2002. Arlington, VA: National Science Foundation. Non-Federal Sources: support from the institution of higher education, state and local government, foreign sources, nonprofit institutions, or private industry; research grants: support from federal agencies to a principal investigator, under whom postdoctoral scholars work; traineeships: educational awards given to scholars selected by the institution or by a federal agency; fellowships: competitive awards given directly to scholars for financial support of their graduate or postdoctoral studies.
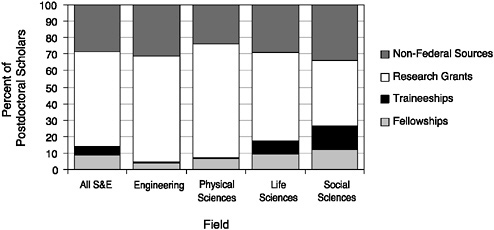
FIGURE 1-16 Mechanisms of support for postdoctoral scholars by field, 1998-2002.
decade.47 The proportion of foreign-born doctorates remaining in the United States for at least 2 years after receiving their degrees increased from 49 percent for the 1989 cohort to 71 percent for the 2001 cohort.48 The increased stay rate was due to an increase in the number of PhDs awarded to international students and to an increase in international graduate students deciding to remain in the United States after receiving their PhDs. Stay rates varied by field of study, country of origin, and economic conditions in sending countries. Stay rates were highest among engineering, computer-science, and physical-science graduates. Stay rates varied dramatically among graduate students from the top source countries—China (96 percent), India (86 percent), Taiwan (40 percent), and Korea (21 percent). Decisions to stay in the United States appear to be strongly affected by conditions in the students’ home countries, primarily unemployment rate, percentage of the labor force that works in agriculture, and per capita GDP.49
Similarly, conversion to US citizenship shows field specificity. In most fields, the percentage of graduate students who were temporary residents at the time their degrees were awarded who later obtain US citizenship has been relatively constant since 1995; in engineering, the numbers of students obtaining citizenship show marked time sensitivity (see Figure 1-20).
The Sigma Xi postdoctoral survey50 found that the United States was the most attractive place to settle for postdoctoral scholars of all nationalities, regardless of where the PhDs were earned. The exception was European citizens who had earned non-US PhDs, who preferred to return to Europe (see Figure 1-21).
|
47 |
Although international student is usually taken to mean a student on a temporary visa, the figures sometimes include students on both temporary and permanent visas to compensate for the large number of Chinese students in the 1990s who became permanent residents under the Chinese Student Protection Act. This issue is discussed in greater detail by Finn (see next footnote), who finds the stay rate for those on temporary and permanent visas almost the same. |
|
48 |
Michael G. Finn. 2003. Stay Rates of Foreign Doctorate Recipients from U.S. Universities, 2001. Oak Ridge, TN: Oak Ridge Institute for Science and Education (ORISE). The stay rate was defined as remaining in the United States for at least 2 years after receipt of the doctorate, but Finn estimates that these rates do not fall appreciably during the first 5 years after graduation. |
|
49 |
D. L. Johnson. 2001. Relationship Between Stay Rates of PhD Recipients on Temporary Visas and Relative Economic Conditions in Country of Origin (Working Paper). Oak Ridge, TN: ORISE. |
|
50 |
Geoff Davis, director, Sigma Xi National Postdoctoral Survey Project, presentation to committee, November 11, 2004. Survey results available at http://postdoc.sigmaxi.org. |
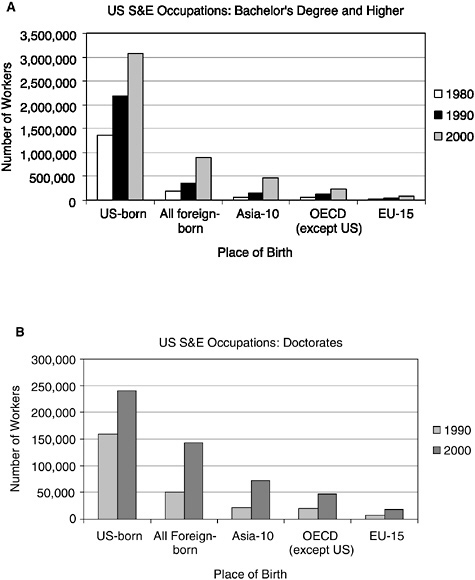
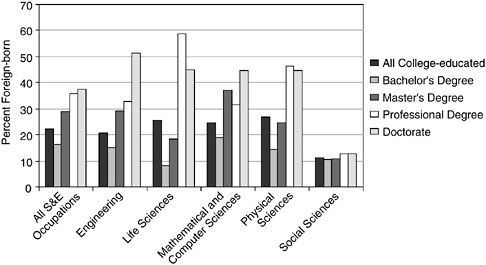
FIGURE 1-18 US Census estimates of foreign-born in US S&E occupations by field, 2000.
SOURCE: Data for figure and table are from 2000 US Census 5 percent Public Use Microdata Samples (PUMS) and include all S&E occupations other than postsecondary teachers, because field of instruction was not included in occupation coding for the 2000 census.
A Positive Impact on Innovation
Skilled migrants may contribute at many levels, as technicians, teachers, and researchers and in other occupations in which technical training is desirable. But some research suggests that they generate economic gains by adding to the processes of industrial and business innovation. Such innovations tend to contribute to future productivity gains of both citizen and immigrant workers, which result in a net increase in real wages. One study provides evidence that the immigration of skilled workers adds to local skills rather than substituting for them.51 The authors’ econometric analyses suggest that a 10 percent increase in the number of international gradu-
TABLE 1-5 Number of Foreign-Born in US S&E Occupations, 2000
|
|
All S&E |
Engineering |
Life Sciences |
Mathematics and Computer Sciences |
Physical Sciences |
Social Sciences |
|
All college-educated |
816,000 |
265,000 |
52,000 |
370,000 |
92,000 |
37,000 |
|
Bachelor’s degree |
365,000 |
132,000 |
6,000 |
197,000 |
21,000 |
9,000 |
|
Master’s degree |
291,000 |
100,000 |
10,000 |
146,000 |
21,000 |
14,000 |
|
Professional degree |
25,000 |
5,000 |
8,000 |
6,000 |
4,000 |
2,000 |
|
Doctoral degree |
135,000 |
28,000 |
28,000 |
21,000 |
46,000 |
12,000 |
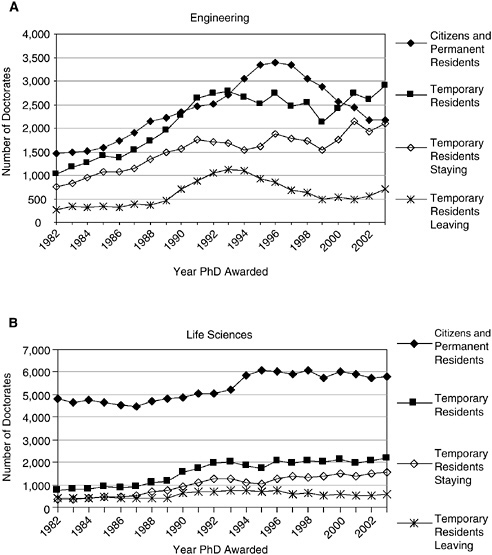
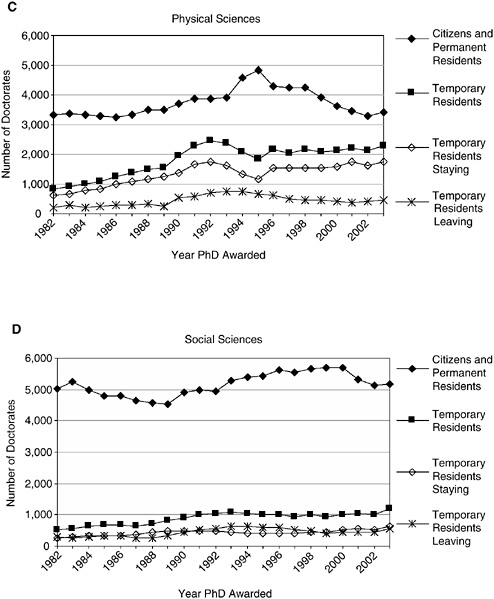
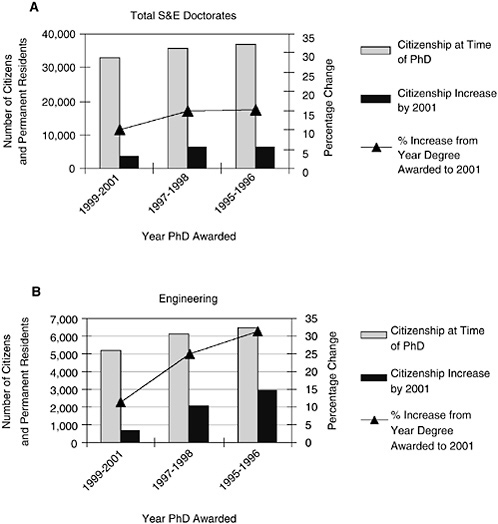
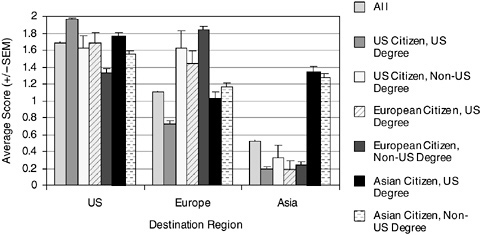
FIGURE 1-21 Plans of postdoctoral scholars to stay in the United States, 2004.
SOURCE: Data are final results from 2004 Sigma Xi National Postdoctoral Survey. The question about settlement preference was asked of one-eighth of respondents, who were asked to score their interest on a scale of 0 = not at all, 1 = somewhat interested, and 2 = very interested.
ate students would raise university patent grants by 6.0 percent and nonuniversity patent grants by 4.0 percent. Taken in the aggregate, enrollments of US graduate students had no detectable effect in their model.52 The authors concluded that bureaucratic hurdles in obtaining student visas may impede innovation if they decrease the inflow of international graduate students.53
An Impact Through “Exceptional” Contributions
There is evidence that the foreign-born and foreign-educated, at least in the recent past, have made a disproportionate number of “exceptional”
contributions to the S&E enterprise of the United States.54Figure 1-22 shows that since 1990, almost half the US Nobel laureates in science fields were foreign-born; 37 percent received their graduate education abroad. A surprisingly large percentage of foreign-born scientists and engineers working in the United States were educated (at least in part) abroad, suggesting that the United States has benefited from investments in education made by other countries. More recent data (for example, the 2004 elections to the National Academies) suggest that a transition may be under way and that these conclusions concerning the foreign-born may not hold in the future.
Impact on Industry
The impact of international scientists and engineers on US industries, as measured by their presence, seems to be considerable. Skilled immigrants are highly mobile, and one study concludes that most technology industries in which they are concentrated are fast-growing exporters and leading contributors to the nation’s economic growth.55 At IBM Research and Intel, for example, about one-third of the S&E doctoral-level employees are foreign nationals.56 Up to half the researchers in US automotive industry laboratories are foreign-born.57
According to one of the few available studies, 32 percent of all new PhDs with definite plans to work in US industry are temporary residents at the time of graduation. That is about the same as the proportion of temporary residents in the population of new PhDs. The proportion of temporary residents going into industry is highest in mathematics (43 percent), civil engineering (42 percent), electrical engineering (41 percent), mechanical engineering (40 percent), and computer science (38 percent). The largest
|
54 |
Paula E. Stephan and Sharon G. Levin. “Foreign scholars in U.S. science: Contributions and costs.” In: Science and the University, eds. Ronald Ehrenberg and Paula Stephan. Madison, WI: University of Wisconsin Press (forthcoming). The authors use six criteria to indicate “exceptional” contributions (not all contributions) in S&E: individuals elected to the National Academy of Sciences (NAS) and/or National Academy of Engineering (NAE), authors of citation classics, authors of hot papers, the 250 most cited authors, authors of highly cited patents, and scientists who have played a key role in launching biotechnology firms. |
|
55 |
AnnaLee Saxenian. 2001. Silicon Valley’s New Immigrant Entrepreneurs (Working Paper No. 15). San Diego, CA: Center for Comparative Immigration Studies, University of California. Available at http://www.ccis-ucsd.org/PUBLICATIONS/wrkg15.PDF. |
|
56 |
William R. Pulleyblank, director, Exploratory Server Systems, IBM Research, presentation to committee, July 19, 2004; Jeff Wheeler, staffing market intelligence, Intel, presentation to committee, July 19, 2004. |
|
57 |
William Agnew, Director of Program and Plans (retired), General Motors. Summary of interviews with several high-level R&D directors from large global automotive companies, presented to committee, October 8, 2004. |
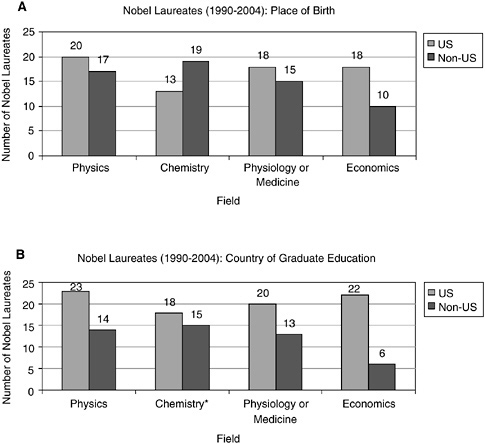
FIGURE 1-22 Exceptional contributions: US Nobel Laureates’ place of birth and country of graduate education.
SOURCE: Data from “Chronology of Nobel Prize winners in Physics, Chemistry, and Physiology or Medicine.” Nobel e-Museum—The official Web site of the Nobel Foundation. Available at http://www.nobel.se/index.html. Note that one laureate in chemistry had two PhDs.
number of foreign industrial hires among new PhDs came from China (nearly 10 percent of all industrial hires) and India (more than 8 percent of industrial hires). That is consistent with research that indicates high stay rates of PhDs from China and India.58
IMPACT OF INTERNATIONAL GRADUATE STUDENTS AND POSTDOCTORAL SCHOLARS ON NATIONAL SECURITY
As we have seen, the S&E enterprise is increasingly multidisciplinary, interdisciplinary, and global. The US system of higher education that is generally admired by the rest of the world depends on the close interplay between research and education and the broad dissemination of scholarly work. Academic research thrives on the serendipitous discoveries arising from casual access and cross-disciplinary collaboration. The system of competitive peer review, widely acknowledged to promote excellence, requires open and transparent communication. One challenge faced by policy makers is to balance the necessary openness with the need for national security in ways that maintain the productive environment of research and education.
To ensure adequate human resources in fields important for homeland security, in Making the Nation Safer, the National Research Council recommended that there be a human resource development program, similar to the National Defense Education Act.59 National weapons laboratories have instituted specific programs to recruit and hire critically skilled people to staff nuclear-stockpile stewardship programs, for which US citizenship is a primary consideration, including graduate and postdoctoral internship programs, programs involving local high schools and universities, and provision of support for current employees to gain additional training. A recent report indicates these programs are a major reason that these laboratories do not have significant problems locating the necessary people to fill critical-skills positions.60
The committee considered additional national security issues but data are not available on what additional risks, if any, an international student may pose versus a domestic student, particularly now that SEVIS and Visas Mantis security screens have been deployed. Certainly, there are inherent risks in relying on international students to fill the nation’s critical S&E positions. As we have witnessed with the tightening of US border security (see Chapter 2), the availability of international scientists and engineers for graduate student, postdoctoral, and other research positions can diminish rapidly. In addition, in periods of international tension, students and scholars who are in the United States on temporary visas may decide to leave.
Limitations on the access to international students and scholars may have an adverse impact on the ability to attract the best research talent for the basic research underpinning US national security. The presence of international students and scholars in our academic institutions has prompted some funding agencies to attempt to limit who may participate in research projects.61 Additional concerns are prompted by export-control regulations on research (see Chapter 2). Most university research is published fundamental research that is exempt from export-control restrictions. Any research that is not openly published would be subject to the restrictions and require a license for the involvement of international students and collaborators from some countries and for some technologies. A 2005 NRC report62 listed visa problems, restrictive contracts, and export controls as particularly critical to US Department of Defense (DoD) research in engineering and the physical, mathematics, and computer sciences, and recommended that National Security Decision Directive 189 be recognized in DoD basic research contracts. Another NRC report has recommended that international postdoctoral scholars be eligible for federal training grants and fellowships.63
If restrictions on research and the processes to pursue it become too onerous, international scientists may choose to work in other nations, depriving the United States of their contributions to combat broad threats to national security, such as the spread of infectious disease. The international response to the worldwide epidemic of severe acute respiratory syndrome (SARS) highlighted the globalization of research and the need to maintain the mobility of the best researchers so that they are free to address such challenges.64 The World Health Organization coordinated an international effort by 13 laboratories in 10 countries that identified in 1 month the new pathogen that caused SARS. Clearly, a feat of such complexity could not have been accomplished without international scientific collaboration and interaction.
The value of international scientific exchange in our increasingly interdependent world is of utmost importance. The controls used to regulate international travel of students and scholars, including the technology alert list (TAL), export controls, the Student and Exchange Visitor Information System (SEVIS), and Visas Mantis security checks have been implemented to reduce any potential security risks to the United States posed by international visitors. However, such potential gains in security come at a high cost. The controls have created an unwelcoming atmosphere and are eroding trust with our colleagues around the world. Special efforts need to be made to ensure international visitors do feel welcome in the face of these necessary security measures. If the cancellation of conferences and loss of collaborations continues, the United States may lose its traditional role as a convening power, and this would have grave and lasting consequences.65
IMPACT ON INTERNATIONAL RELATIONS
The exchange of students among countries is considered a central feature of international relations and foreign policy by US government leaders, as illustrated by the following statements:
The relationships that are formed between individuals from different countries, as part of international education programs and exchanges, can also foster goodwill that develops into vibrant, mutually beneficial partnerships among nations.66
–President Bush, 2001
America’s educational institutions attract talented future leaders from around the world. International students and scholars benefit from engagement with our society and academic institutions and we benefit enormously from their interaction with our society as they help our citizens develop understanding and knowledge that enriches our lives, increases international cooperation, enhances our national security, and improves our economic competitiveness.67
–Secretary of State Colin Powell, 2004
|
65 |
See Jane Lubchenco and Goverdhan Mehta. 2004. “International scientific meetings.” Science 305:1531; and “Organizing an international meeting in the United States.” International Visitors Office Web page, National Academies Board on International Scientific Organizations, http://www7.nationalacademies.org/visas/Organizing_a_Meeting.html. |
|
66 |
George W. Bush. 2001. Statement for International Education Week 2001 (November 13), http://exchanges.state.gov/iew2001/message.htm. |
|
67 |
Colin L. Powell. 2004. Statement for International Education Week 2004 (October 15), http://exchanges.state.gov/iew/statements/powell.htm. |
|
68 |
“Foreign Students Yesterday, World Leaders Today.” Bureau of Educational and Cultural Affairs, US Department of State. Available at http://exchanges.state.gov/education/educationusa/leaders.htm. |
According to the committee’s analysis of responses to the Pew Global Attitudes Survey (see Appendix C), people who admire US science and technology and who visit the United States improve their attitude toward the United States substantially. Similarly, returnees who assume leadership positions at home may become strong foreign-policy and national-security assets for the United States. Scientists and engineers who have been educated here often return home with an appreciation of the egalitarian values of scientific research, democratic values, and the productivity of a vibrant capitalist economy. For example, among allies who have participated in an educational exchange program in the United States are Afghani President Hamid Karzai, Philippines President Gloria Arroyo, French President Jacques Chirac, King Abdullah of Jordan, Mexican President Vicente Fox, and British Prime Minister Tony Blair.68 Of course, one may cite examples of foreign students who find US culture offensive or have even become outright enemies of the United States or of Western culture. Historically, however, science has served as a bridge between nations and a means of communication that can transcend political barriers. A notable example was the continuing exchange of American and Soviet scientists throughout the Cold War.69
CONCLUSION
The participation of international graduate students and postdoctoral scholars is an important part of the research enterprise of the United States. In some fields they make up more than half the populations of graduate students and postdoctoral scholars. If their presence were substantially diminished, important research and teaching activities in academe, industry, and federal laboratories would be curtailed, particularly if universities did not give more attention to recruiting and retaining domestic students. The next two chapters will consider national policies and exogenous factors that are likely to influence their participation.


