
Appendix B
Case Study Metrics for the Climate Change Science Program
This appendix provides case study examples of metrics for a range of program elements drawn from the Climate Change Science Program (CCSP). Each case study is focused on specific CCSP questions and milestones and includes a rationale and background information needed to inform the development of metrics. Specific process, input, output, outcome, and impact metrics developed by the committee appear at the end of each case study (Tables B.1-B.8). Following the case studies the metrics are grouped together (Tables B.9-B.13) to facilitate comparison and help the committee assess the difficulty of creating and applying them to other parts of the CCSP.
The case studies were created to inform the committee’s thinking about metrics. A selection is presented here, in draft form, to show how and why the committee developed general metrics for the CCSP (Box 5.1). No attempt was made to revise the case study metrics after the general metrics were created. The emphasis is on presenting the committee’s thought process, not on recommending specific metrics for CCSP program elements.
CASE STUDY THEMES
The committee derived eight key themes from the milestones, products, and payoffs within the CCSP Strategic Plan and developed one or two case studies for each. These themes also conform to the conventional sequence of scientific investigation, starting with the development of new or better observations and ending with improved use of information to advance knowledge or better serve decision making. The themes are:
-
improve data sets in space and time;
-
improve estimates of physical quantities;
-
improve understanding of processes;
-
improve representation of processes;
-
improve assessment of uncertainty, predictability, or predictive capabilities;
-
improve synthesis and assessment to inform;
-
improve the assessment and management of risk; and
-
improve decision support for adaptive management and policy making.
Case study examples of themes 3 and 8 appear in Chapter 5.
Theme 1: Improve Data Sets in Space and Time
Solar Forcing of Climate
Related CCSP Questions, Milestones, and Products. Question 4.1.5: “To what extent are climate changes as observed in instrumental and paleoclimate records related to volcanic and solar variability, and what mechanisms are involved in producing climate responses to these natural forcings?”1
Rationale. Understanding how human activities are altering the Earth’s climate requires an understanding of the role of natural variability in climate forcing. Therefore, it is essential to know how the Sun’s energy output varies and how these variations affect the Earth’s climate.
Background. Nine independent satellite measurements of total solar irradiance (TSI) have been made since 1978. These data show that the TSI has changed during recent 11-year solar cycles with 0.1 percent amplitude (Figure B.1). However, the lack of overlapping instruments having in-flight sensitivity tracking precludes detection of any long-term variations of the Sun’s TSI on climate time scales, if any are present. The construction of a long-term irradiance composite depends crucially on assumptions made about the degradation of radiometers that lack in-flight tracking capability. Different assumptions yield two different time series. For example, note the two different trends in the energy input at solar minimum in Figure B.1.
TABLE B.1 Example Metrics for Case Study on Solar Forcing of Climate
|
Type |
Example Metrics |
|
Process |
• Is there a plan for continuous measurement of other climate variables related to solar irradiance to enable discernment and quantification of the physical, chemical, and biological links between solar irradiance changes and climate? • Is a plan for periodic five-year review of solar measurements available that includes the following: —Are the measurements being made with sufficient precision and accuracy? —Are the measurement plans robust with respect to the requirements for continuity and/or calibration? |
|
Input |
• Are the instruments and platforms required for deployment of a TSI measurement system available? • Are the measurements to be made by these instruments relatable to those made using previous technologies? • Yearly reviews of the following: —Sufficient commitment of resources to allow the planned program to be carried out —Sufficient resources being devoted to the development of climate models to utilize the solar measurements properly • Does the best scientific evidence indicate that the resources being devoted to the solar radiation measurements are appropriate, given our need to understand the climate record and predict future climate changes? |
|
Output |
• Publication of a peer-reviewed, multiyear record of TSI that is relatable to existing records • Documented, published records of how solar variability has contributed directly and indirectly to past climate change • Quantitative links between measures of solar activity (e.g., sunspot number, solar wind) and solar irradiance at the top of the Earth’s atmosphere |
|
Outcome |
• Improved ability to forecast non-irradiance-related effects of solar activity • Forecasts of future solar variability and predictions of its climate effect are available for comparison with other climate drivers to determine the nature of climate change • Recognition of direct and indirect mechanisms by which solar variations can influence climate |
|
Impact |
• Public understanding of the importance of solar variation in climate change relative to other radiative forcing (e.g., greenhouse gases) is improved |
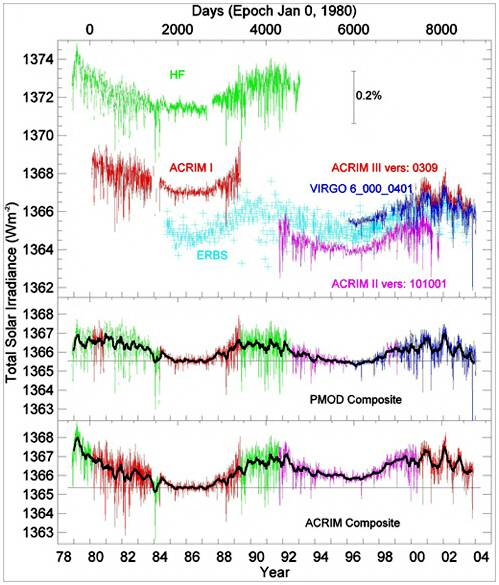
FIGURE B.1 TSI database and two different composite records showing a time series (1978-2004) of measured solar energy input per unit area to the Earth system from various instruments: Active Cavity Radiometer Irradiance Monitor (ACRIM), Variability of Solar Irradiance and Gravity Oscillations (VIRGO), Hickey-Frieden radiometer (HF), Earth Radiation Budget Satellite (ERBS), and Physikalisch-Meteorologisches Observatorium Davos (PMOD). An overlap in the middle of the record between ACRIM I and ACRIM II or use of a technique with absolute calibration would have made it possible to determine whether there is a trend in TSI at solar minimum. SOURCE: Fröhlich, C., and J. Lean, 2004, Solar radiative output and its variations: Evidence and mechanism, Astronomy and Astrophysics Reviews, 12, 273–320. Copyright 2004; used with kind permission of Springer Science and Business Media.
Aerosols and Their Role in Climate Forcing
Related CCSP Questions, Milestones, and Products. Question 3.1: “What are the climate-relevant chemical, microphysical, and optical properties, and spatial and temporal distributions, of human-caused and naturally occurring aerosols?”2 Milestones, products, and payoffs include (1) improved description of the global distributions of aerosols and their properties; (2) empirically tested evaluation of the capabilities of current models to link emissions to (a) global aerosol distributions and (b) the chemical and radiative properties (and their uncertainties) of aerosols; and (3) better estimates of the radiative forcing of climate change for different aerosol types and the uncertainties associated with those estimates.3
Rationale. One of the largest uncertainties in climate research is the specification of aerosol properties and their role in direct climate forcing (Figure B.2). The challenge is to adequately characterize the nature and occurrence of atmospheric aerosols and include their effects in models to reduce uncertainties in climate prediction.
Background. Because aerosols (1) originate from a variety of sources, (2) are distributed across a wide spectrum of particle sizes, and (3) have atmospheric lifetimes that are much shorter than those of most greenhouse gases, their concentrations and composition have great spatial and temporal variability. Satellite-based measurements of aerosols are necessary but not sufficient for acquiring an adequate information base upon which progress in understanding the role of aerosols in climate can be built. In situ measurements and process-level studies are necessary to reduce uncertainties in both direct and indirect forcing. The CCSP strategic plan calls for expanded use of “space-based, airborne, and ground-based instruments and laboratory studies to provide better data for aerosols …,” particularly to improve knowledge of spatial distribution and temporal variation of aerosols and precursor gases and of physical, chemical, and optical processes of aerosols; and to distinguish natural from anthropogenic aerosol.4 These objectives illustrate the need for basic science information to assess the net radiative effect of aerosols.
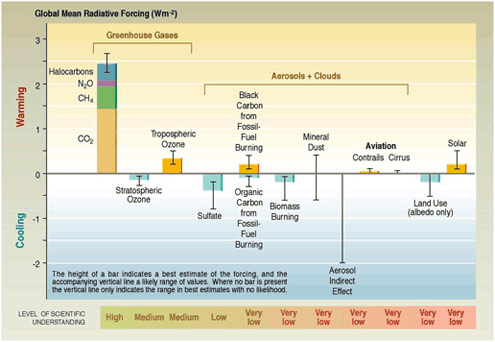
FIGURE B.2 Global annual mean radiative forcing due to a number of agents for the period from preindustrial times (1750) to the present (about 2000). Most of the forcing estimates associated with aerosols have a very low level of scientific understanding, making their estimates highly uncertain. SOURCE: Climate Change Science Program and the Subcommittee on Global Change Research, 2003, Strategic Plan for the U.S. Climate Change Science Program, Washington, D.C., p. 16; adapted from Intergovernmental Panel on Climate Change, Working Group I, 2001, Climate Change 2001: The Scientific Basis, Cambridge University Press, Cambridge, U.K., p. 392. Used with permission from the Intergovernmental Panel on Climate Change and the Climate Change Science Program.
TABLE B.2 Example Metrics for Case Study on Aerosols and Their Role in Climate Forcing
|
Type |
Example Metrics |
|
Process |
• Does a structure exist for the science community to evaluate the adequacy of existing and planned measurement programs concerned with aerosol distribution and radiative properties? • Is there a peer-reviewed five-year plan, updatable every five years, describing where and how measurements will be carried out that link aerosol distribution and chemistry to direct and indirect radiative forcing? • Are the requirements defined for quantifying spatial and temporal variability in planned missions? • Is a mechanism in place to take account of any surprises or new insights in the planning of new measurement campaigns? |
|
Type |
Example Metrics |
|
Input |
• To what extent do measurements have sufficient accuracy, precision, and completeness to answer the high-priority questions on aerosols and climate? • What resources are being devoted to these measurements? • Are the resources being expended on climate science research being allocated in an optimal manner (i.e., measurements versus models, space measurements versus surface or airborne measurements)? • Does the best scientific evidence indicate that the resources being devoted to solar radiation measurements are appropriate, given our need to understand the climate record and predict future climate changes? |
|
Output |
• Well-described and demonstrated relationships between aerosol distribution and radiative forcing • Forecasts of future aerosol distribution and consequences for regional climate based on scenarios of future aerosol emissions |
|
Outcome |
• To what extent are the measurements being used to answer the high-priority climate questions that motivated them? • Are the aerosol measurements together with other aerosol research resulting in better understanding of the uncertainties in climate projections due to direct and indirect aerosol processes? • The program leads to regulation of aerosol emissions |
|
Impact |
• Regional air quality is improved as a result of aerosol emission regulations |
Theme 2: Improve Estimates of Physical Quantities
Sea-Level Rise
Related CCSP Questions, Milestones, and Products. Question 4.2.3: “What are the projected contributions from different components of the climate system to future sea-level changes, what are the uncertainties in the projections, and how can they be reduced?”5 The associated research activity is “improved representation of processes (e.g., thermal expansion, ice sheets, water storage, coastal subsidence) in climate models that are required for simulating and projecting sea-level changes.”6
Rationale. Intergovernmental Panel on Climate Change (IPCC) assessments have highlighted considerable uncertainty about the causes of the sea-level rise over the past century. A number of factors can contribute to
sea-level rise, including ocean thermal expansion, melting of permanent snow cover and mountain glaciers, decreases in groundwater storage, and decreased volume of polar ice sheets. The contributions of ocean thermal expansion are the best constrained, but there is considerable uncertainty about the contributions from groundwater and the Greenland ice sheet. Even the sign of the contribution of the largest freshwater reservoir, the Antarctic ice sheet, is unknown.
Background. The magnitude of sea-level change over the past 100 to 150 years is reasonably well known, owing to a number of observations around the Earth. However, stations give sometimes conflicting measurements, and it is necessary to track changes regionally and over shorter time scales. Integration of measurements with models is essential to estimate the volume of freshwater reservoirs, to determine how this has changed, and to project future changes. Improved estimates of physical quantities are also implicitly required to improve models. Making progress in this research area will require observations (e.g., sea level, geodetic reference frame), estimates of physical quantities (e.g., ice sheet and glacier volume), integration of historical and new information, and improved models to predict sea-level change. The ice sheet volume can be estimated from a number of individual ground (e.g., snow accumulation, ice flow) and satellite-based (e.g., altimetry) measurements, as well as from models relating volume and elevation change.
TABLE B.3 Example Metrics for Case Study on Sea-Level Rise
|
Type |
Example Metrics |
|
Process |
• Is there a coordinated, strategic plan that the agencies use to guide research programs, set priorities, and support budget requests? Is the plan responsive to decision support needs? • Is there a coordinated, global strategic plan for measurement systems that agencies use to guide new investments, justify ongoing networks, and support budget requests? • Do the plan and the program have an appropriate balance of in situ and space-based measurements? Are they well integrated? |
|
Input |
• Are there adequate, well-performing data and information systems? • Is the research taking advantage of emerging technology and system integration and stimulating the development of new measurement technologies? |
|
Output |
• How has the accuracy of measuring sea level and other priority global fluxes and reservoirs of water significantly improved as a result of the deployment of measurement systems for research? • Are the measurements of sufficient accuracy to inform assessments and policy? |
|
Type |
Example Metrics |
|
|
• Have adequate means of assessing measurement accuracy at the scales of interest been developed? • Are research programs producing synthesized results addressing the components of sea-level rise? |
|
Outcome |
• Are the research results leading to lower uncertainties in the historical contributions to sea-level rise and thence to better projections of future sea-level rise? • Has significant progress been made on understanding the contributions to sea-level rise as a result of the measurement, process research, and modeling programs? • Do these projections adequately inform assessments and provide a basis for adaptive management and (inter)national policy making on mitigating the potential consequences of sea-level rise (e.g., impacts on coastal communities and ecosystems)? |
|
Impact |
• “No-build” zones established between structures (e.g., roads, railways, houses) and the shoreline protect communities from sea-level rise |
Theme 4: Improve Representation of Processes
Climate-Vegetation Feedbacks
Related CCSP Questions, Milestones, and Products. Question 8.1: “What are the most important feedbacks between ecological systems and global change (especially climate), and what are their quantitative relationships?”7 The CCSP product related directly to the improved representation of processes in models is, “Quantification of important feedbacks from ecological systems to climate and atmospheric composition to improve the accuracy of climate projections. This product will be needed to ensure inclusion of appropriate ecological components in future climate models.”8
Rationale. Our lack of knowledge about the nature of climate-vegetation interactions has hindered our ability to predict climate sensitivity and to understand the response of ecosystems to climate change.
Background. Early studies of tropical deforestation called attention to the importance of vegetation in governing surface energy and moisture
fluxes.9 Climate, in turn, has a significant impact on vegetation. The importance of these effects prompted the development of a wide variety of climate models designed to include atmosphere-vegetation interactions, beginning with Dickinson (1984) and Dorman and Sellers (1989).10 However, climate-vegetation models are still in their infancy. A better understanding of the controls on vegetation distribution and character, including weather, climate, and the role of human activities (e.g., change in land use and land cover, creation of pollutants), is required to improve predictions of future vegetation distributions. We need a more explicit understanding of the complex interactions between diverse ecosystems and ecosystem components and their chemical as well as physical environment. An improved assessment of the importance of spatial and temporal variability in ecosystem character and an ability to address multiple spatial scales will also be required if we are to quantify changes that will influence moisture and energy budgets. All of these factors require improved field and controlled-environment facilities and long-term observing sites to quantify these interactions. An improved representation of these processes is the key to improved climate-vegetation models. In addition, opportunities to validate the models, perhaps through vegetation records from past climates, will be required if we are to gain confidence in the model predictions.
TABLE B.4 Example Metrics for Case Study on Climate-Vegetation Feedbacks
|
Type |
Example Metrics |
|
Process |
• Is a functioning peer review process in place involving scientists, managers, and other stakeholders? Are there timetables for periodic peer review of results? • Recognized leadership that enables interaction between diverse communities of scientists • A five-year plan, revisited every five years, to assess progress and set priorities through peer review for the following: —Implementation of experiments, analysis, and modeling designed to increase understanding of and confidence in the linkages between vegetation and environmental change —Implementation of experiments, analysis, and modeling designed to improve prediction of climate change and variability at a regional level with the resolution and accuracy needed for vegetation studies —Development of field and controlled-environment facilities and long-term ecological observing stations designed to improve understanding and quantification of vegetation-climate interactions • An ability to revisit the planning process in response to the development of new experimental methods and new insights from other experiments and fields of study • Are systems in place that will promote interaction, partnership, and communication between the ecosystem community and the climate and environmental research community, including scientists, agency managers, policy makers, and the public? |
|
Input |
• Sufficient intellectual foundation in multiple disciplines to support the research • Available funds for the development and maintenance of a sustainable scientific community and for promoting interaction, partnership, and communication between scientists, agency managers, policy makers, and the public • Annual research and development (R&D) expenditures are sufficient to implement and sustain the following: —Principal Investigators (PIs) and/or “centers” projects directed toward achieving the objectives —The investigation of ○ Competing ideas and interpretations of relationships between climate and vegetation ○ Innovative and comprehensive approaches for gathering or interpreting and modeling climate-vegetation interactions ○ The full breadth of relationships between environmental disturbance and ecosystems, including climate, pollutants, and land cover or land use ○ The resilience of ecosystems to environmental stress —Interpretive activities —Development of environmentally controlled facilities and long-term observing sites —Development of predictive models and synthesis of information —Integration of diverse research communities and existing research enterprises |
|
Type |
Example Metrics |
|
Output |
• Experimental and observational data of sufficient quantity and quality to support the determination of climate-vegetation relationships • Well-described and demonstrated relationships between environment and vegetation • Climate and climate variability forecasts suitable for determining the future distribution of vegetation, with well-described sources of error and limitations • Vegetation character and distribution projections suitable for determining the impact of vegetation changes on climate • Published reports supporting the analysis of vegetation and climate relationships • Effectively selected, sufficiently accurate, peer-reviewed, published, and broadly accepted data and analysis on vegetation and environment relationships • Adequate community and infrastructure have been developed to support a program of monitoring, surveillance, and modeling of ecosystems • Periodic assessments of the state of the science • Well-described and demonstrated assessment of vegetation-climate interactions |
|
Outcome |
• Consistent and reliable projections of vegetation change and climate-vegetation interactions and feedbacks, with well-described sources of error and limitations • Well-described and demonstrated assessment of the resilience of vegetation to a variety of environmental stresses • An improved understanding of the response of ecosystems to environmental stress through an improved capability to assess the role of climate change on a variety of time scales • A peer-reviewed, published, broadly accepted conclusion on the relationships between environment and vegetation • Accelerated incorporation of improved knowledge of climate-vegetation processes and feedbacks into climate models to reduce uncertainty in projections of climate sensitivity and changes in climate and related conditions • Observations, analysis, and models are utilized to improve our understanding of vegetation changes and other ecosystem responses • Expansion of the monitoring, surveillance, and forecast knowledge gained through an examination of vegetation to other areas of ecosystem analysis • Integration of a sustainable community of climate and ecosystem scientists |
|
Impact |
• Increased public understanding of the role of climate and other environmental stresses on ecosystems • Evidence of improved ecosystem management as a result of use of improved data and analysis tools and understanding of ecosystem function |
Theme 5: Improve Assessment of Uncertainty, Predictability, or Predictive Capabilities
Paleoclimate Time Series as Benchmarks of Climate Variability and Change
Related CCSP Questions, Milestones, and Products. Question 4.1.5: “To what extent are climate changes as observed in instrumental and paleoclimate records related to volcanic and solar variability, and what mechanisms are involved in producing climate responses to these natural forcings?”11 The related milestone is “targeted paleoclimatic time series as needed, for example, to establish key time series of observations and natural forcing mechanisms as benchmarks of climate variability.”12
Rationale. Improving our ability to predict climate change, understanding the limits to our ability to make such predictions, and defining our confidence in climate predictions are key elements of the CCSP strategic plan. A critical subset of research directed at these goals includes (1) establishment of time series of prehistorical climate variations, (2) simulation of past climates, the annual mean climate, the seasonal cycle, or seasonal-to-decadal variability (e.g., El Niño-Southern Oscillation), and (3) determining the extent to which physical variables or phenomena can be portrayed realistically in models.13
Background. A significant number of studies have used estimates of past radiative forcing (e.g., volcanic eruptions, solar variability) to simulate the climate record of the last several centuries and then compared these model simulations to proxy records of climate change derived from a variety of sources.14 These studies use different reconstructions of past temperature trends and different model parameters. Nevertheless, model simulations and climate reconstructions, which have independent uncertainties, are generally consistent, suggesting some level of capability in understanding and simulating the climates of the last 1000 years. The success of proxies in defining past climate change depends on the degree to which the
proxy accurately reflects temperature, precipitation, atmospheric circulation, and ocean circulation and on the degree to which spatially limited samples reflect hemispheric averages. Spatial patterns of climate change are also of importance, particularly in assessing the capabilities of climate models to simulate the character of past climates beyond hemispheric averages. The near absence of proxy data from large areas of the world presents significant difficulties.15 There are also significant differences among model simulations of the past, related to differences in model sensitivities or parameterizations and to differences in the specification of past radiative forcing. Resolution of these differences and the development of increasingly credible time series from paleoclimate proxies as benchmarks of climate variability and change are important objectives for the CCSP.
TABLE B.5 Example Metrics for Case Study on Paleoclimate Time Series as Benchmarks of Climate Variability and Change
|
Type |
Example Metrics |
|
Process |
• Does a structure exist for scientific community planning and peer review of paleoclimate variability and benchmarking? • Are there processes and timetables for periodic peer review of results generated for each paleoclimate proxy and of synthesis activities that cross or employ multiple proxies and consider different estimates of past radiative forcing? —Does the review enable determination of the comparability and continuity of data generated for different proxies? —Does the review enable testing of model predictions (benchmarks) outside of experimental areas? • A five-year plan for implementation of experiments, analysis, and modeling to obtain an increased understanding of and confidence in the causes of recent and historical climate change, revisited every five years, to assess progress through peer review. It is particularly important that the planning process be revisited periodically in the light of development of new experimental methods and new insights from other experiments and fields of investigation |
|
Input |
• Annual R&D expenditures are sufficient to implement and sustain —PIs and/or “centers” projects directed toward achieving the objectives —The investigation of ○ Competing ideas and interpretations of proxy data ○ Innovative approaches for gathering or interpreting paleoclimate records ○ The full breadth of proxy types ○ The application of climate models with estimates of past radiative forcing —Interpretive activities |
|
Type |
Example Metrics |
|
|
• Funds available for the development and maintenance of a sustainable paleoclimate scientific community of sufficient depth and diversity • Do data of sufficient quantity and quality exist to support the analysis of historical (paleolithic) patterns of climate variability and change? |
|
Output |
• Well-described and demonstrated relationships between the observations and model output • Description of the potential errors and sources of limitations in the observations, forcing factors, and model capability • Improved description of aerosol distribution, solar variability, and land-use or land-cover forcing factors • Effectively selected, sufficiently accurate, peer-reviewed, published, and broadly accepted data and analysis on our ability to simulate the climate of the last 1000 years • Extension of model-data comparisons for the last 1000 years to the following: —Additional variables beyond globally averaged, mean annual surface temperature —The spatial and temporal character of climate variability |
|
Outcome |
• An improved ability to separate the contributions of natural versus human-induced climate forcing to climate variations and change • A peer-reviewed, published, broadly accepted conclusion on our ability to simulate the climate of the last 1000 years, to attribute these variations to specific causes, and to predict future climate |
|
Impact |
• Public is better educated on the history of climate change |
Theme 6: Improve Synthesis and Assessment to Inform
Human Health and Climate
Related CCSP Questions, Milestones, and Products. Question 9.4: “What are the potential human health effects of global environmental change, and what climate, socioeconomic, and environmental information is needed to assess the cumulative risk to health from these effects?”16
Rationale. Synthesis and assessment is a major goal of the CCSP strategic plan. The plan defines assessment as “processes that involve analyzing and evaluating the state of scientific knowledge (and the associated degree of scientific certainty) and, in interaction with users, developing
information applicable to a particular set of issues or decisions.”17 The impact of climate change on the occurrence of human infectious disease is an example of the importance of synthesis and assessment, given the many possible health effects that can stem from changes in climate and the importance of health to society. Changes in the distribution of disease vectors, for example, may result in exposure of new populations to disease risk and perhaps reexposure of populations to a past disease.
Background. Detecting the effect of climate change on the prevalence and intensity of human infectious disease is difficult because of the uncertainties associated with prediction of long-term changes in climatic conditions, the resultant ecological changes, and their causal connection to specific diseases.18 Detecting a change in health that can be attributed to climate variability requires defining a baseline distribution for a disease vector prior to climate change. The effect of climate change can be also assessed by changes in the intensity of transmission of diseases, by changes in the transmission season, or by changes in their geographical distribution. The immediate goal is to identify climate processes that appear to affect health directly or to result in environmental changes that facilitate the spread of human diseases. Assessment of the links between climate change and infectious disease will focus on (1) present understanding of the links between weather, climate, and infectious diseases; (2) knowledge of the fundamental relationships between disease and ecological or other environmental conditions (Figure B.3); (3) identification of the factors that result in an improved ability to predict climate conditions (probably at least a season in advance), climate variability, and eventually future climate change; and (4) frameworks for making decisions involving the scale of change, management scope, and stakeholder involvement. Information on these factors is required particularly at the regional level, with the resolution and accuracy appropriate for assessing impacts on ecosystems, assessing risks to human populations, and enabling development of public health strategies.
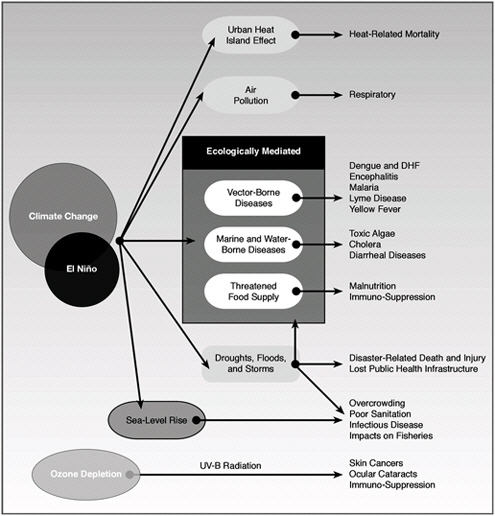
TABLE B.6 Example Metrics for Case Study on Human Health and Climate
|
Type |
Example Metrics |
|
Process |
• Is a transparent, inclusive, and peer review process in place for identifying leadership of the assessment activity, structure and timing of the assessment, and selection of participants? • Is there a process for peer review of the assessment and its conclusions, including a process for incorporating reviewer suggestions and comments in the final product? • Is there a process that enables identification of bottlenecks to rapid research progress? |
|
Input |
• Does a broad community of professionals and stakeholders required for assessment exist? • Are funds available for the development and maintenance of a sustainable climate and health scientific community of sufficient depth and diversity? • Are funds available for the assessment, including selection of participants, communication among participants and the larger community, preparation, and peer review? • Are funds available for distribution of the assessment and communication of conclusions to a wide audience? • Are historical climate, health, and environmental data available that are of sufficient quantity and quality to support the determination of historical patterns of climate-related health effects? |
|
Output |
• Effectively selected, sufficiently accurate, peer-reviewed, published, and broadly accepted data and analysis on health and environment relationships • Climate and climate variability forecasts suitable for assessing health outcomes, with well-described sources of error and limitations • Development of monitoring networks that support forecasting regional-scale climate variability and predicting its impact on human health |
|
Outcome |
• Consistent and reliable predictions of climate variables (e.g., sea surface or land temperature distributions) linked to human disease outbreak, with well-described sources of error and limitations • Ability to predict the extent to which a change in climate will significantly affect public health, as measured by an increase in infant mortality rates, declines in human life expectancy, or other factors • Existence of a health care infrastructure with the appropriate expertise to respond to climate predictions |
|
Impact |
• Increased public awareness of climate impacts on human health • Predictions of climate change reduce risk of human disease outbreaks |
Theme 7: Improve the Assessment and Management of Risk
Assessing, Preventing, and Managing Public Health Threats of Infectious Diseases
Related CCSP Questions, Milestones, and Products. Question 9.3: “How can the methods and capabilities for societal decision-making under conditions of complexity and uncertainty about global environmental variability and change be enhanced?”19 Question 9.4: “What are the potential human health effects of global environmental change, and what climate, socioeconomic, and environmental information is needed to assess the cumulative risk to health from these effects?”20 Many milestones and products are related to risk assessment and health. The most direct discussion of risk is found within the human contributions and responses theme: (1) additional tools for preventing and managing the public health threat of infectious diseases; (2) assessments of the potential health effects of combined exposures to climatic and other environmental factors (e.g., air pollution); (3) the next phase of health sector assessments to understand the potential consequences of global change for human health in the United States, especially for at-risk demographic and geographic subpopulations; and (4) improved characterization and understanding of vulnerability and adaptation based on analyses of societal adjustment to climate variability and seasonal-to-interannual forecasts.21
Rationale. The last decade has brought much greater emphasis on the potential impacts of climate change on regions and sectors (e.g., forestry, ecosystems, human health, water resources), economic analysis of potential impacts, and making climate information useful to a variety of stakeholders. Consequently, improving our ability to assess and manage risks associated with climate variability and change has become a key goal of the CCSP (Goal 5). The CCSP proposes to develop improved decision support processes and products to improve the use of knowledge on climate change and its potential impacts.
Background. Outbreaks of many infectious diseases are tied to the seasons, suggesting a link to weather and climate. A growing body of
research is confirming the connection between weather, climate, and infectious diseases transmitted by mosquitoes, ticks, and rodents (e.g., Lyme disease, malaria, dengue fever, Hantavirus).22 Such linkages hold the promise that disease outbreaks can be anticipated, that the vulnerability of the population can be assessed, and that beneficial adaptation or mitigation strategies can be put into place that minimize or manage risk. These linkages define a foundation for preventing or managing specific threats. The assessment of risk requires a more complete understanding of these linkages, including the following:
-
An improvement in the ability to assess the vulnerability of regions (e.g., Hantavirus in the Southwest) and populations (e.g., the young, the elderly, those with compromised immune systems, the economically disadvantaged). The assessment objective should be to refine the estimate of risk associated with disease outbreaks.
-
The ability to identify system thresholds or “breakpoints” that may influence the outbreak and spread of disease.
-
An improved understanding of time lags between climate conditions and the outbreak and spread of diseases.
-
The enhancement in knowledge of the potential for adaptation and the resilience of communities, institutions, public health care systems, regions, and sectors, including time, cost, efficacy, and feasibility.
TABLE B.7 Example Metrics for Case Study on Assessing, Preventing, and Managing Public Health Threats of Infectious Diseases
|
Type |
Example Metrics |
|
Process |
• A five-year plan, revisited every five years, to assess progress and set priorities through peer review, for example: —Implementation of experiments, analysis, and modeling designed to increase understanding of and confidence in the linkages between health and environmental change —Implementation of experiments, analysis, and modeling designed to improve prediction of climate change and variability at a regional level with the resolution and accuracy needed for health studies |
|
Type |
Example Metrics |
|
|
—Development of monitoring and surveillance systems with sufficient data collection frequency, resolution, and accuracy to detect indications of infectious disease outbreaks —Determination of vulnerable regions and populations to define the level of risk associated with disease outbreaks —Determination of the ability of communities, institutions, and public health care systems to respond to disease outbreaks • Are systems are in place that will promote interaction, partnership, and communication between the health community and the climate and environmental research community, including scientists, agency managers, policy makers, and the public? • Are procedures in place for translating model results into knowledge that is understandable and usable by decision makers? |
|
Input |
• Are funds available for the development and maintenance of a sustainable scientific community and for promoting interaction, partnership, and communication between scientists, agency managers, policy makers, and the public? • Are annual R&D expenditures sufficient to implement and sustain the following: —PIs and/or “centers” projects directed toward achieving the objectives —The investigation of ○ Competing ideas and interpretations of relationships between climate and health ○ Innovative and comprehensive approaches for gathering or interpreting and modeling disease outbreaks ○ The full breadth of relationships between environmental disturbance and health ○ Vulnerabilities of human populations ○ Resilience of communities and institutions —Interpretive activities —Development of a robust disease monitoring and surveillance system —Development of predictive models and synthesis of information • A “climate services” function that enables climate information and predictions to be used by the health community |
|
Output |
• Well-described and demonstrated assessment of population vulnerabilities to disease outbreaks • Adequate community and infrastructure have been developed to support a program of monitoring, surveillance, and forecasting of disease risk • Sufficient spatial and temporal coverage of model predictions to provide an adequate disease potential based on monitoring and surveillance, with well-described sources of error and limitations • Effective education mechanisms to promote behavior that will reduce risk |
|
Outcome |
• Expansion of the monitoring, surveillance, and forecast knowledge gained through an examination of health to other areas of ecological risk analysis • Consistent and reliable forecasts of disease outbreak potential, with well-described sources of error and limitations • A reliable system for using forecasts to implement adaptation or mitigation strategies that minimize adverse outcomes associated with infectious diseases |
|
Type |
Example Metrics |
|
Impact |
• Demonstrated cases of successful risk management (e.g., outbreak averted, public warned in time, behavior of individuals changed) • Significantly reduced morbidity and mortality rates as a result of improved management of infectious disease • Improved health infrastructure or heath education programs inform the public of potential risks • Increased public understanding of health risks and requirements to mitigate risk |
Theme 8: Improve Decision Support for Adaptive Management and Policy Making
National Policy-Making Case Study: Scenarios of Greenhouse Emissions and Climate Response
Related CCSP Questions, Milestones, and Products. Question 9.2: “What are the current and potential future impacts of global environmental variability and change on human welfare, what factors influence the capacity of human societies to respond to change, and how can resilience be increased and vulnerability decreased?”23 The relevant payoff emphasizes scenario refinement: “Scenarios will be strengthened by an improved understanding of the interdependence among economic growth; population growth, composition, distribution, and dynamics (including migration); energy consumption in different sectors (e.g., electric power generation, transportation, residential heating and cooling); advancements in technologies; and pollutant emissions.”24
Rationale. One of the key environmental policy decisions facing the world today is the response to the buildup of greenhouse gas (GHG) emissions. Scenarios—future socioeconomic, technological, or policy developments that may or may not be realized—are a useful way of studying the impacts of GHG emissions on populations and formulating a policy response. Scenario planning is useful when there are considerable uncertainties in some of the future trends and inputs that affect planning.
Background. GHG scenarios include factors such as population growth, economic development, and technological change, and they may also include analysis of the effects of atmospheric GHG concentrations, climate variables, and measures of human and environmental consequences. Such scenarios may or may not assume various levels of emissions control, such as long-term targets for atmospheric stabilization under Article 2 of the Framework Convention on Climate Change.25 They may take the form of “if-then” questions for choosing a specific policy response, or they may form the basis for policy studies aimed at setting long-term goals or assessing current policy measures, including research and development and other aspects of technology development.
TABLE B.8 Example Metrics for Case Study on Scenarios of Greenhouse Gas Emissions and Climate Response
|
Type |
Example Metrics |
|
Process |
• Are effective mechanisms in place for coordination with the Climate Change Technology Program? • Does a structure exist for community planning and peer review of scenario development, public policy response, and analysis? • Is there a timetable for the periodic review of scenario development activities, including testing of scenarios under different policy approaches? |
|
Input |
• Does a program exist that effectively sustains the needed analysis capability? • Funds are available for the development and maintenance of a sustainable scientific community capable of analyzing climate change scenarios and policy response • Historical climate, health, and environmental data are of sufficient quantity and quality to support the determination of historical patterns of climate-related effects • Funds are available to support the technology, monitoring systems, predictive models, and interpretive activities required to develop different climate-related scenarios and to support the assessment of relevant policy responses |
|
Output |
• Peer-reviewed results from each region and from cross-region syntheses ensure comparability and continuity of data generated for different regions • Have active groups been created that are capable of carrying out the desired policy-related scenario analysis, and is the necessary general analytic capability being sustained to respond when needs arise? • Development of scenarios that not only reflect the range of problems produced by climate change, but also—through deliberative processes—are widely acceptable to impacted populations |
|
Type |
Example Metrics |
|
|
• Are the analysis and assessment methods well documented, and is the work published in the peer-reviewed literature? • Are the analysis and assessment capabilities adequate to analyze climate scenarios, including the following: —An ability to handle multiple gases, multiple sectors, and all regions of the world —The capacity to link emissions scenarios to climate outcomes —The capability to assess a range of policy proposals and estimate their cost —The capability to analyze uncertainty in emissions, climate outcomes, and policy cost |
|
Outcome |
• Accepted proposals for domestic emissions control measures |
|
Impact |
• Program results are reflected in U.S. government climate policy, international forums (including the IPCC), and/or public discussion of the issue • The United States is adequately and appropriately prepared for international climate change negotiations |
COMPARISON OF CASE STUDY METRICS
The process, input, output, outcome, and impact metrics developed for the case studies that appear here and in Chapter 5 are grouped in Tables B.9 through B.13 to facilitate comparison and show how the general metrics (Box 6.1) arose.
TABLE B.9 Process Metrics for All Case Studies
|
Theme |
Example Metrics |
|
1 |
Solar Forcing • Is there a plan for continuous measurement of other climate variables related to solar irradiance to enable discernment and quantification of the physical, chemical, and biological links between solar irradiance changes and climate? • Is a plan for periodic five-year review of solar measurements available that includes the following: —Are the measurements being made with sufficient precision and accuracy? —Are the measurement plans robust with respect to the requirements for continuity and/or calibration? |
|
Theme |
Example Metrics |
|
|
Aerosol Forcing • Does a structure exist for the science community to evaluate the adequacy of existing and planned measurement programs concerned with aerosol distribution and radiative properties? • Is there a peer-reviewed five-year plan, updatable every five years, describing where and how measurements will be carried out that link aerosol distribution and chemistry to direct and indirect radiative forcing? • Are the requirements defined for quantifying spatial and temporal variability in planned missions? • Is a mechanism in place to take account of any surprises or new insights in the planning of new measurement campaigns? |
|
2 |
Sea-Level Rise • Is there a coordinated, strategic plan that the agencies use to guide research programs, set priorities, and support budget requests? Is the plan responsive to decision support needs? • Is there a coordinated, global strategic plan for measurement systems that agencies use to guide new investments, justify ongoing networks, and support budget requests? • Do the plan and the program have an appropriate balance of in situ and space-based measurements? Are they well integrated? |
|
3 |
Effect of CO2 on Land Carbon Balance • Has the leadership of this overall effort, which spans several agencies, been identified? • Does a structure exist that will involve the scientific community in planning of the sites and conditions chosen for manipulation or gradient studies? • Is there a 5-10-year plan for implementation of the manipulation experiments, to be revisited and updated in accord with new discoveries? • Is there a plan to incorporate longer-term aspects of the problem that extend beyond the 5-10-year horizon (i.e., multiple generations of plants exposed to altered atmospheric conditions)? • Do a mechanism and timetable exist for periodic review of experimental implementations, including testing of model predictions outside experimental areas? • Do a mechanism and timetable exist to disseminate results to potential stakeholders (particularly the agricultural community) and involve them in planning discussions? |
|
4 |
Climate-Vegetation Feedbacks • Is a functioning peer review process in place involving scientists, managers, and other stakeholders? Are there timetables for periodic peer review of results? • Recognized leadership that enables interaction between diverse communities of scientists |
|
Theme |
Example Metrics |
|
|
• A five-year plan, revisited every five years, to assess progress and set priorities through peer review for the following: —Implementation of experiments, analysis, and modeling designed to increase understanding of and confidence in the linkages between vegetation and environmental change —Implementation of experiments, analysis, and modeling designed to improve prediction of climate change and variability at a regional level with the resolution and accuracy needed for vegetation studies —Development of field and controlled-environment facilities and long-term ecological observing stations designed to improve understanding and quantification of vegetation-climate interactions • An ability to revisit the planning process in response to the development of new experimental methods and new insights from other experiments and fields of study • Are systems in place that will promote interaction, partnership, and communication between the ecosystem community and the climate and environmental research community, including scientists, agency managers, policy makers, and the public? |
|
5 |
Paleoclimate Time Series • Does a structure exist for scientific community planning and peer review of paleoclimate variability and benchmarking? • Are there processes and timetables for periodic peer review of results generated for each paleoclimate proxy and of synthesis activities that cross or employ multiple proxies and consider different estimates of past radiative forcing? —Does the review enable determination of the comparability and continuity of data generated for different proxies? —Does the review enable testing of model predictions (benchmarks) outside of experimental areas? • A five-year plan for implementation of experiments, analysis, and modeling to obtain an increased understanding of and confidence in the causes of recent and historical climate change, revisited every five years, to assess progress through peer review. It is particularly important that the planning process be revisited periodically in the light of development of new experimental methods and new insights from other experiments and fields of investigation |
|
6 |
Human Health and Climate • Is a transparent, inclusive, and peer review process in place for identifying leadership of the assessment activity, structure and timing of the assessment, and selection of participants? • Is there a process for peer review of the assessment and its conclusions, including a process for incorporating reviewer suggestions and comments in the final product? • Is there a process that enables identification of bottlenecks to rapid research progress? |
|
Theme |
Example Metrics |
|
7 |
Assessing, Preventing, and Managing Public Health Threats • A five-year plan, revisited every five years, to assess progress and set priorities through peer review, for example: —Implementation of experiments, analysis, and modeling designed to increase understanding of and confidence in the linkages between health and environmental change —Implementation of experiments, analysis, and modeling designed to improve prediction of climate change and variability at a regional level with the resolution and accuracy needed for health studies —Development of monitoring and surveillance systems with sufficient data collection frequency, resolution, and accuracy to detect indications of infectious disease outbreaks —Determination of vulnerable regions and populations to define the level of risk associated with disease outbreaks —Determination of the ability of communities, institutions, and public health care systems to respond to disease outbreaks • Are systems are in place that will promote interaction, partnership, and communication between the health community and the climate and environmental research community, including scientists, agency managers, policy makers, and the public? • Are procedures in place for translating model results into knowledge that is understandable and usable by decision makers? |
|
8 |
Adaptive Management of Water Resources • Does the CCSP have an effective planning structure, involving both agency managers and the scientific community, that is used to set priorities and implement water resource programs? • Does an adequate structure exist for peer review of both CCSP water resource programs and the research supported by those programs? • Does the CCSP support programs that effectively sustain research-applications partnerships, carry out a continuing assessment process, and provide test-beds for emerging water resource information and decision support tools? • Is the science in these planned programs responsive to the needs of regional stakeholders? • Does the CCSP water resources plan provide for the measurements, modeling, and decision support needed to link water cycle research and operational needs? |
|
|
Scenarios of Greenhouse Gas Emissions • Are effective mechanisms in place for coordination with the Climate Change Technology Program? • Does a structure exist for community planning and peer review of scenario development, public policy response, and analysis? • Is there a timetable for the periodic review of scenario development activities, including testing of scenarios under different policy approaches? |
TABLE B.10 Input Metrics for All Case Studies
|
Theme |
Example Metrics |
|
1 |
Solar Forcing • Are the instruments and platforms required for deployment of a TSI measurement system available? • Are the measurements to be made by these instruments relatable to those made using previous technologies? • Yearly reviews of the following: —Sufficient commitment of resources to allow the planned program to be carried out —Sufficient resources being devoted to the development of climate models to utilize the solar measurements properly • Does the best scientific evidence indicate that the resources being devoted to the solar radiation measurements are appropriate, given our need to understand the climate record and predict future climate changes? |
|
|
Aerosol Forcing • To what extent do measurements have sufficient accuracy, precision, and completeness to answer the high-priority questions on aerosols and climate? • What resources are being devoted to these measurements? • Are the resources being expended on climate science research being allocated in an optimal manner (i.e., measurements versus models, space measurements versus surface or airborne measurements)? • Does the best scientific evidence indicate that the resources being devoted to solar radiation measurements are appropriate, given our need to understand the climate record and predict future climate changes? |
|
2 |
Sea-Level Rise • Are there adequate, well-performing data and information systems? • Is the research taking advantage of emerging technology and system integration and stimulating the development of new measurement technologies? |
|
3 |
Effect of CO2 on Land Carbon Balance • Is there sufficient theoretical basis for the design and interpretation of experiments? • Is the technology available to perform experiments assuming multiple, long-term (decadal) manipulations of plots of sufficient size to test hypotheses? • Are sufficient resources (people, dollars) available to implement and support a measurement network, modeling, and interpretive activities for the appropriate period of time (decades)? • Is there an identified stakeholder community to take advantage of scientific advances? |
|
4 |
Climate-Vegetation Feedbacks • Sufficient intellectual foundation in multiple disciplines to support the research |
|
Theme |
Example Metrics |
|
|
• Available funds for the development and maintenance of a sustainable scientific community and for promoting interaction, partnership, and communication between scientists, agency managers, policy makers, and the public • Annual R&D expenditures are sufficient to implement and sustain the following: —PIs and/or “centers” projects directed toward achieving the objectives —The investigation of ○ Competing ideas and interpretations of relationships between climate and vegetation ○ Innovative and comprehensive approaches for gathering or interpreting and modeling climate-vegetation interactions ○ The full breadth of relationships between environmental disturbance and ecosystems, including climate, pollutants, and land cover or land use ○ The resilience of ecosystems to environmental stress —Interpretive activities —Development of environmentally controlled facilities and long-term observing sites —Development of predictive models and synthesis of information —Integration of diverse research communities and existing research enterprises |
|
5 |
Paleoclimate Time Series • Annual R&D expenditures are sufficient to implement and sustain: —PIs and/or “centers” projects directed toward achieving the objectives —The investigation of ○ Competing ideas and interpretations of proxy data ○ Innovative approaches for gathering or interpreting paleoclimate records ○ The full breadth of proxy types ○ The application of climate models with estimates of past radiative forcing —Interpretive activities • Funds available for the development and maintenance of a sustainable paleoclimate scientific community of sufficient depth and diversity • Do data of sufficient quantity and quality exist to support the analysis of historical (paleolithic) patterns of climate variability and change? |
|
6 |
Human Health and Climate • Does a broad community of professionals and stakeholders required for assessment exist? • Are funds available for the development and maintenance of a sustainable climate and health scientific community of sufficient depth and diversity? • Are funds available for the assessment, including selection of participants, communication among participants and the larger community, preparation, and peer review? • Are funds available for distribution of the assessment and communication of conclusions to a wide audience? • Are historical climate, health, and environmental data available that are of sufficient quantity and quality to support the determination of historical patterns of climate-related health effects? |
|
Theme |
Example Metrics |
|
7 |
Assessing, Preventing, and Managing Public Health Threats • Are funds available for the development and maintenance of a sustainable scientific community and for promoting interaction, partnership, and communication between scientists, agency managers, policy makers, and the public? • Are annual R&D expenditures sufficient to implement and sustain the following: —PIs and/or “centers” projects directed toward achieving the objectives —The investigation of ○ Competing ideas and interpretations of relationships between climate and health ○ Innovative and comprehensive approaches for gathering or interpreting and modeling disease outbreaks ○ The full breadth of relationships between environmental disturbance and health ○ Vulnerabilities of human populations ○ Resilience of communities and institutions —Interpretive activities —Development of a robust disease monitoring and surveillance system —Development of predictive models and synthesis of information • A “climate services” function that enables climate information and predictions to be used by the health community |
|
8 |
Adaptive Management of Water Resources • Annual R&D expenditures are sufficient to implement and sustain the following: —PIs and/or “centers” projects directed toward achieving the objectives —The investigation of ○ Competing ideas and interpretations of causes ○ Competing interpretations of data ○ Innovative approaches for gathering or interpreting water resources data • Funds are available for the development and maintenance of a sustainable water resources scientific community of sufficient depth and diversity |
|
|
Scenarios of Greenhouse Gas Emissions • Does a program exist that effectively sustains the needed analysis capability? • Funds are available for the development and maintenance of a sustainable scientific community capable of analyzing climate change scenarios and policy response • Historical climate, health, and environmental data are of sufficient quantity and quality to support the determination of historical patterns of climate-related effects • Funds are available to support the technology, monitoring systems, predictive models, and interpretive activities required to develop different climate-related scenarios and to support the assessment of relevant policy responses |
TABLE B.11 Output Metrics for All Case Studies
|
Theme |
Example Metrics |
|
1 |
Solar Forcing • Publication of a peer-reviewed, multiyear record of TSI that is relatable to existing records • Documented, published records of how solar variability has contributed directly and indirectly to past climate change • Quantitative links between measures of solar activity (e.g., sunspot number, solar wind) and solar irradiance at the top of the Earth’s atmosphere |
|
|
Aerosol Forcing • Well-described and demonstrated relationships between aerosol distribution and radiative forcing • Forecasts of future aerosol distribution and consequences for regional climate based on scenarios of future aerosol emissions |
|
2 |
Sea-Level Rise • How has the accuracy of measuring sea level and other priority global fluxes and reservoirs of water significantly improved as a result of the deployment of measurement systems for research? • Are the measurements of sufficient accuracy to inform assessments and policy? • Have adequate means of assessing measurement accuracy at the scales of interest been developed? • Are research programs producing synthesized results addressing the components of sea-level rise? |
|
3 |
Effect of CO2 on Land Carbon Balance • Peer-reviewed, published results generated for each site and synthesis activities across sites that identify the most important mechanisms at work • Production of a facility that (1) can be put into the field for years at a time and (2) can maintain atmospheric CO2 levels at a specific set point (e.g., 50 ppm [parts per million] above ambient levels), with a precision (averaged over 1 hour) of 5 ppm. For a subset of these systems, additional control over either atmospheric ozone levels, temperature (i.e., increase by 5°C compared to the control plot), soil moisture, or species diversity is required • Development of a suite of new measurement techniques that can detect carbon allocation patterns on time scales of (1) hours, (2) days to weeks, and (3) a growing season in response to external variables and photosynthetic rates of plants in control versus experimentally manipulated systems • Incorporation of relationships between photosynthetic rates, carbon allocation, and external and internal variables into process-based models that simulate patterns of photosynthetic response and allocation (on appropriate time scales for each process) and that can be tested against other observations as well as in other kinds of manipulated systems • Technology developed for rapid control of trace gas concentrations at high precision |
|
Theme |
Example Metrics |
|
4 |
Climate-Vegetation Feedbacks • Experimental and observational data of sufficient quantity and quality to support the determination of climate-vegetation relationships • Well-described and demonstrated relationships between environment and vegetation • Climate and climate variability forecasts suitable for determining the future distribution of vegetation, with well-described sources of error and limitations • Vegetation character and distribution projections suitable for determining the impact of vegetation changes on climate • Published reports supporting the analysis of vegetation and climate relationships • Effectively selected, sufficiently accurate, peer-reviewed, published, and broadly accepted data and analysis on vegetation and environment relationships • Adequate community and infrastructure have been developed to support a program of monitoring, surveillance, and modeling of ecosystems • Periodic assessments of the state of the science • Well-described and demonstrated assessment of vegetation-climate interactions |
|
5 |
Paleoclimate Time Series • Well-described and demonstrated relationships between the observations and model output • Description of the potential errors and sources of limitations in the observations, forcing factors, and model capability • Improved description of aerosol distribution, solar variability, and land-use or land-cover forcing factors • Effectively selected, sufficiently accurate, peer-reviewed, published, and broadly accepted data and analysis on our ability to simulate the climate of the last 1000 years • Extension of model-data comparisons for the last 1000 years to the following: —Additional variables beyond globally averaged, mean annual surface temperature —The spatial and temporal character of climate variability |
|
6 |
Human Health and Climate • Effectively selected, sufficiently accurate, peer-reviewed, published, and broadly accepted data and analysis on health and environment relationships • Climate and climate variability forecasts suitable for assessing health outcomes, with well-described sources of error and limitations • Development of monitoring networks that support forecasting regional-scale climate variability and predicting its impact on human health |
|
7 |
Assessing, Preventing, and Managing Public Health Threats • Well-described and demonstrated assessment of population vulnerabilities to disease outbreaks • Adequate community and infrastructure have been developed to support a program of monitoring, surveillance, and forecasting of disease risk |
|
Theme |
Example Metrics |
|
|
• Sufficient spatial and temporal coverage of model predictions to provide an adequate disease potential based on monitoring and surveillance, with well-described sources of error and limitations • Effective education mechanisms to promote behavior that will reduce risk |
|
8 |
Adaptive Management of Water Resources • Established (accepted, peer-reviewed, published) baselines for hydrologic forecasting improved as a result of CCSP-supported research • Consistent and reliable estimates and forecasts of water resources quantities (e.g., volume of natural water reservoirs, fluxes) to support adaptive management • Water resource planning scenarios that take into account contingencies such as substantial decreases in mountain snowpack expected as a result of further climate warming or multiyear droughts that stress water resources systems well beyond their design capacity • Accurate regional and national measures of the hydrologic effects likely associated with climate change • Quantitative information on components of the regional, national, and global water cycle that are important for water resources management, such as precipitation patterns and trends, streamflow trends, snowpack, and groundwater changes • Establishment of the degree to which these components are changing because of factors other than natural variability, such as moisture fluxes and precipitation • Sustainable information systems that make water resource data and information readily available to research and applications users |
|
|
Scenarios of Greenhouse Gas Emissions • Peer-reviewed results from each region and from cross-region syntheses ensure comparability and continuity of data generated for different regions • Have active groups been created that are capable of carrying out the desired policy-related scenario analysis, and is the necessary general analytic capability being sustained to respond when needs arise? • Development of scenarios that not only reflect the range of problems produced by climate change, but also—through deliberative processes—are widely acceptable to impacted populations • Are the analysis and assessment methods well documented, and is the work published in the peer-reviewed literature? • Are the analysis and assessment capabilities adequate to analyze climate scenarios, including the following: —An ability to handle multiple gases, multiple sectors, and all regions of the world —The capacity to link emissions scenarios to climate outcomes —The capability to assess a range of policy proposals and estimate their cost —The capability to analyze uncertainty in emissions, climate outcomes, and policy cost |
TABLE B.12 Outcome Metrics for All Case Studies
|
Theme |
Example Metrics |
|
1 |
Solar Forcing • Improved ability to forecast non-irradiance-related effects of solar activity • Forecasts of future solar variability and predictions of its climate effect are available for comparison with other climate drivers to determine the nature of climate change • Recognition of direct and indirect mechanisms by which solar variations can influence climate |
|
|
Aerosol Forcing • To what extent are the measurements being used to answer the high-priority climate questions that motivated them? • Are the aerosol measurements together with other aerosol research resulting in better understanding of the uncertainties in climate projections due to direct and indirect aerosol processes? • The program leads to regulation of aerosol emissions |
|
2 |
Sea-Level Rise • Are the research results leading to lower uncertainties in the historical contributions to sea-level rise and thence to better projections of future sea-level rise? • Has significant progress been made on understanding the contributions to sea-level rise as a result of the measurement, process research, and modeling programs? • Do these projections adequately inform assessments and provide a basis for adaptive management and (inter)national policy making on mitigating the potential consequences of sea-level rise (e.g., impacts on coastal communities and ecosystems)? |
|
3 |
Effect of CO2 on Land Carbon Balance • Peer-reviewed and published knowledge of the processes by which increasing atmospheric CO2 can influence the carbon balance at (1) the whole plant level and (2) the ecosystem level. Determination of the sign and magnitude (to 30%) of the feedback between CO2 levels and the amount of carbon stored over the first year of the manipulation (and subsequent years as they become available) • Models of suitable spatial scale that incorporate process-level understanding are used to predict the response of ecosystems to multiple stressors, such as increased CO2 and temperature or CO2 and ozone • Policy makers are informed about —The potential for different kinds of ecosystems to store or release carbon under conditions of a 50 ppm increase in atmospheric CO2 —The magnitude of release or uptake of CO2 and how this understanding will be modified by the presence of more investigators in the field • Peer-reviewed assessments that quantify the potential effects of changing atmospheric composition on the yield of different crops • Improved prediction of future trends in atmospheric CO2 levels, given a scenario of fossil fuel emissions and deforestation |
|
Theme |
Example Metrics |
|
4 |
Climate-Vegetation Feedbacks • Consistent and reliable projections of vegetation change and climate-vegetation interactions and feedbacks, with well-described sources of error and limitations • Well-described and demonstrated assessment of the resilience of vegetation to a variety of environmental stresses • An improved understanding of the response of ecosystems to environmental stress through an improved capability to assess the role of climate change on a variety of time scales •A peer-reviewed, published, broadly accepted conclusion on the relationships between environment and vegetation • Accelerated incorporation of improved knowledge of climate-vegetation processes and feedbacks into climate models to reduce uncertainty in projections of climate sensitivity and changes in climate and related conditions • Observations, analysis, and models are utilized to improve our understanding of vegetation changes and other ecosystem responses • Expansion of the monitoring, surveillance, and forecast knowledge gained through an examination of vegetation to other areas of ecosystem analysis • Integration of a sustainable community of climate and ecosystem scientists |
|
5 |
Paleoclimate Time Series • An improved ability to separate the contributions of natural versus human-induced climate forcing to climate variations and change •A peer-reviewed, published, broadly accepted conclusion on our ability to simulate the climate of the last 1000 years, to attribute these variations to specific causes, and to predict future climate |
|
6 |
Human Health and Climate • Consistent and reliable predictions of climate variables (e.g., sea surface or land temperature distributions) linked to human disease outbreak, with well-described sources of error and limitations • Ability to predict the extent to which a change in climate will significantly affect public health, as measured by an increase in infant mortality rates, declines in human life expectancy, or other factors • Existence of a health care infrastructure with the appropriate expertise to respond to climate predictions |
|
7 |
Assessing, Preventing, and Managing Public Health Threats • Expansion of the monitoring, surveillance, and forecast knowledge gained through an examination of health to other areas of ecological risk analysis • Consistent and reliable forecasts of disease outbreak potential, with well-described sources of error and limitations •A reliable system for using forecasts to implement adaptation or mitigation strategies that minimize adverse outcomes associated with infectious diseases |
|
Theme |
Example Metrics |
|
8 |
Adaptive Management of Water Resources • Effective pilot research-applications partnerships result in experimental use of more accurate hydrologic forecasting tools and improved decision making • A regional demand exists among stakeholders for emerging CCSP data and information to support decision making • Decision support systems have been adapted to use emerging CCSP data and information • Improved information and technology have resulted in improved operational management of water resources, such as water allocations and reservoir operations • New infrastructure (e.g., groundwater backup systems for surface reservoirs) provides a more stable supply of water • More effective water resources planning structures, such as state drought task forces and agency capital investment plans, have been initiated that explicitly consider climate change |
|
|
Scenarios of Greenhouse Gas Emissions • Accepted proposals for domestic emissions control measures |
TABLE B.13 Impact Metrics for All Case Studies
|
Theme |
Example Metrics |
|
1 |
Solar Forcing • Public understanding of the importance of solar variation in climate change relative to other radiative forcing (e.g., greenhouse gases) is improved |
|
|
Aerosol Forcing • Regional air quality is improved as a result of aerosol emission regulations |
|
2 |
Sea-Level Rise • “No-build” zones established between structures (e.g., roads, railways, houses) and the shoreline protect communities from sea-level rise |
|
3 |
Effect of CO2 on Land Carbon Balance • Crop productivity is improved because of use of forecasts that take into account changes in CO2, ozone, and climate • Conservation reserves are more resilient because of use of knowledge of how changes in CO2 affect plant competition and ecosystem structure |
|
4 |
Climate-Vegetation Feedbacks • Increased public understanding of the role of climate and other environmental stresses on ecosystems • Evidence of improved ecosystem management as a result of use of improved data and analysis tools and understanding of ecosystem function |
|
Theme |
Example Metrics |
|
5 |
Paleoclimate Time Series • Public is better educated on the history of climate change |
|
6 |
Human Health and Climate • Increased public awareness of climate impacts on human health • Predictions of climate change reduce risk of human disease outbreaks |
|
7 |
Assessing, Preventing, and Managing Public Health Threats • Demonstrated cases of successful risk management (e.g., outbreak averted, public warned in time, behavior of individuals changed) • Significantly reduced morbidity and mortality rates as a result of improved management of infectious disease • Improved health infrastructure or heath education programs inform the public of potential risks • Increased public understanding of health risks and requirements to mitigate risk |
|
8 |
Adaptive Management of Water Resources • Increased resilience of the water supply has decreased the vulnerability of populations to hydrologic aspects of climate variability and change |
|
|
Scenarios of Greenhouse Gas Emissions • Program results are reflected in U.S. government climate policy, international forums (including the IPCC), and/or public discussion of the issue • The United States is adequately and appropriately prepared for international climate change negotiations |


