
Appendix A
Excerpts from USGS Circular 1111
The following sections are reproduced from Bernknopf et al. (1993), “Societal Value of Geologic Maps.”
GEOLOGIC INFORMATION AS A PUBLIC GOOD (pages 45-47)
Types of Information Discussion of the public-good attributes of information begins with the distinction between general and specific information. A frequently made argument (see Musgrave, 1959; Becker, 1975; Cohn, 1979) is that general information is a public good, while specific information is a private good. There is the presumption that general information possesses more of the characteristics of a public good, having a lack of exclusion possibilities (anyone can use the information) and a lack of congestion costs (there is no cost of competition in the use of the information).
As applied to geologic maps, general information is collected at a scale that would be valuable for a variety of regional planning decisions encompassing a set of choices for land uses such as highway route selection, waste repository siting, energy exploration, and development impacts.1 Such information also would be available for a long period of time, given the slow rate of decay of its usefulness.
Specific information, on the other hand, is much more localized (for example, specific siting characteristics of interchanges along a single road right-of-way) and of much less use for further application. In essence, the collection of site-specific geologic information for determining the economic and environmental feasibility of siting a waste repository would be of little use in road planning unless the road is to be constructed in the same location as the proposed waste facility. As the information becomes more specific, the number of users becomes smaller. Thus, geologic information can be both general and specific information. Our concern is with geologic maps in the general information category. We note, however, that in compiling specific information, general information is often necessary to provide background data. In what follows, we discuss the economic concepts associated with the production of a public good in order to gain insight into the nature of regional geologic information. From this discussion we propose a series of testable hypotheses that can be examined empirically.
Public Goods Pure public goods have two key characteristics. First, it is impossible, or inefficient, to exclude anyone (nonrival in consumption) from consuming the good once it is produced.2 The availability to other users is not diminished. Second, the production of the good is characterized by jointness of supply (Musgrave, 1959).3 The extreme case of jointness of supply arises when the cost of the good is made up entirely of fixed costs. The key characteristics of a public good are discussed in more detail in this section, including a brief introduction to the “free-rider” problem.
Nonrival in Consumption Public goods are nonrival in consumption; that is, any one individual’s consumption of the output does not reduce the consumption by others. Maps are available free to certain groups, readily available in certain repositories, and reproducible, so there is little reason to believe that any individual could be restricted from use. There is an obvious case of nonrival consumption for regional geologic maps.
A second aspect of the nonrival consumption argument is the ability to legally exclude others from making full use of information through the use of patents and copyrights. Such rules for exclusion are necessary for the private sector to have the appropriate incentive to produce map infor-
mation that would be otherwise publicly provided information. Since individuals are able to obtain map information by not paying (a “free ride”), a private sector producer would not be able to recover the cost of production and would not provide the good.
Implementation of an exclusion scheme is difficult in the case of regional geologic map information because the range of potential users is large and dispersed. Effectively there is no way to implement a payment scheme. As a general rule, as information becomes more general, there is it a larger group of potential beneficiaries and there is less likelihood that exclusion is feasible. This point can be seen by comparing the possibilities of exclusion from use of a general theoretical development in seismology and earthquake prediction in California, relative to an engineering rehabilitation job on a building in Berkeley, Calif., which is used in a particular application. In the case of the general information, there may be a role for the government to produce such information.
Jointness of Supply The jointness of supply condition is fulfilled; that is, the per-unit production and distribution costs of regional geologic map information are near zero, while the per-unit costs of the information collection make up almost 100 percent of total per-unit cost. Regional geologic maps possess this characteristic, because the bulk of the costs of producing such maps are borne “up front,”4 while the actual printing and distribution costs are relatively small. Because the printing costs are relatively low, the cost of serving an additional consumer also is small.5 For example, the expected per-unit cost of information collection and synthesis for a 1:100,000-scale map covering Loudoun County, Virginia, is about $1.16 million, while the cost of production and distribution are about $8.44 per unit.6 Therefore, excluding consumers once the good has been produced is inefficient.
“Free-Rider” Problem When the above two characteristics for a public good occur, in most cases, the private supply of this type of good such as a regional geologic map will yield inefficient market outcomes. Too little geologic information is produced, and a market failure ensues. This type of market failure is known as the “free-rider” problem. Free riders are individuals or groups who attempt to enjoy a good while not paying for it; it is impossible or inefficient to exclude them from the activity. The
TABLE A-1 Payoffs to the provision of a public good [C=contribution; NC=no contribution]
|
|
|
Person B |
|
|
|
|
C |
NC |
|
Person A |
C |
4, 4 |
1, 5 |
|
NC |
5, 1 |
2, 2 |
|
nature of the free-rider problem may be illustrated as an application of the prisoner’s dilemma (see Mueller, 1989, p. 8-17), summarized as follows:
Consider a simple economy with two persons. Each person begins with an endowment of $2 and each has two choices (strategies): to contribute to the provision of a public good or not to contribute. The public good is generated by summing the total contributions and multiplying this by 1.5 to reflect the consumer surplus (total area under the demand curve or total willingness to pay for a commodity) generated by the public good. The public good is enjoyed equally by both persons, and their payoffs are given by the value of the public good minus their contributions. The payoffs to these strategies are shown in Table A-1. For example, if both choose C (contribution), the total contribution is $4, the value of the public good is $6, and each person receives $4 as his net payoff. If both choose NC (no contribution), then they keep their endowment, so the payoff is $2 to each. If one contributes and the other does not, then the contributor receives $1 (his share of the public good is $3, and his contribution is $2), while the noncontributor receives $5 (his share of the public good is $3, and he keeps his endowment). The equilibrium outcome in this game is (NC, NC) with no public good being produced. This result is unfortunate, since the total payoff is clearly greater in the (C, C) outcome. The (NC, NC) outcome arises because NC is a dominant strategy for both of the persons in this economy. That is to say, it is not in either individual’s interest to separately contribute to the public good since the payoff from this strategy is lower than from the strategy of not contributing.
The outcome for the general case of the pure public good is that private (voluntary) production will lead to suboptimal levels of production.7 As a
result of this type of individual behavior, economics research has argued that the government should intervene to ensure proper provision of the good.8
THE ROLE OF GEOLOGIC MAP INFORMATION IN THE MAKING OF A DECISION (pages 21-23)
Reducing Information Uncertainty with Geologic Maps Chapter I describes geologic map information. For purposes of this chapter, we provide a brief description of the nature of geologic map information as it applies to regulatory decisionmaking. The geologic characteristics of a parcel of land are based on the type, structure, and engineering characteristics of the rock that are identified during the geologic mapping. This activity involves observation, sampling, analysis, and interpretation. The resolution of geologic map information generally increases with larger scale maps (more detailed) and with newer vintage maps.
Geologic maps can be interpreted to provide the basis for statistics that infer quantitative attributes about the geologic characteristics of a particular parcel of land. More detailed (larger scale) maps provide more accurate statistics (provide a likely reduction in the variance). In the demonstration of our applications, the available geologic map information (at different vintages and scales) for a region is used to produce derivative map information showing rock permeability and shear strength. A geologic map’s vintage is an important consideration because it represents the status of interpretations, concepts, and models that continue to evolve over time. These geologic characteristics are considered important for our applications. Suppose a new geologic map of a region is produced at a
|
|
as an income transfer, and, where the public good is normal, the result is an increase in the willingness to pay for the good by these persons. The resulting response is analogous to a Cournot reaction and can be shown to lead to positive provision. The key initial assumption of this analysis is that at least one person’s demand exceeds the cost of providing the first unit of the good. For most public goods this is not the case, and the outcome is that private provision will be at zero levels. Where the cost of the public good is such that no one person is willing to supply any amount on his own, there is some debate as to whether the private market will supply a positive amount. Where use of the good may be prevented after it is made available (a club good), Bagnoli and McKee (1991) have shown that a “focal equilibrium” exists in which the good is supplied at efficient levels. Where the good is subject to ex post consumption by noncontributors, Isaac and others (1985) have shown that the good is generally undersupplied. |
scale that is more detailed than the existing geologic map, as is commonly the case. For instance, at the new map scale, perhaps faulting is delineated more clearly and boundaries between different rock types (contacts) are defined better than on the older, less detailed geologic map. Better delineation of the geologic attributes results because the newer and improved geologic map is based on more detailed, systematic observations. If this improved geologic map information leads to a different number of restricted parcels, then we have a measure of the value of the improved geologic map information. The net benefits of this improved information are the changes in the expected loss avoided, and the costs are the costs associated with acquiring the improved geologic map information.
Gathering geologic map information is a challenging process because of the scarcity of geologic outcrops, scarcity and expense of drill-hole data, and complexity of possible geologic interpretations. In general, the density of data required for the appropriate level of geologic resolution is a function of map scale. At any map scale, geologic information has an inherent uncertainty because observations cannot be made everywhere, and extrapolations must be made. Thus, the true value of a geologic attribute for a location is described by a probability distribution. The central point of the probability distribution is the expected value of the geologic attribute in a specific location. The variance of the attribute corresponds to the variability of the geologic attribute over the entire mapped area. This concept is illustrated in Figure A-1, in which the probability distribution of a geologic attribute is plotted for two different levels of information, d1 and d2, corresponding, for example, to existing and improved geologic information. R in Figure A-1 denotes a regulatory standard (threshold), and ![]() denotes the expected value of the geologic attribute for a given locality or parcel of land. The 95-percent confidence interval (2σ) about the expected value is indicated for the distribution dl as 2σVI. With this information, we fail to reject the hypothesis that the allowed standard, R, is met for this parcel of land, because it is within two standard deviations of the expected value, and
denotes the expected value of the geologic attribute for a given locality or parcel of land. The 95-percent confidence interval (2σ) about the expected value is indicated for the distribution dl as 2σVI. With this information, we fail to reject the hypothesis that the allowed standard, R, is met for this parcel of land, because it is within two standard deviations of the expected value, and ![]() .
.
With improved geologic map information, based on larger scale maps or newer field data, we have distribution d2. The improved information is more precise and more detailed. As such, distribution d2 has less uncertainty (in this case, a smaller standard deviation, 2σV2 than d1. The null hypothesis is rejected because the expected value of the geologic attribute minus two standard deviations is greater than the standard, R.
The rejection of a particular parcel by use of information from d2 occurs because the information in d2 is more precise, not because there is a bias in the original data, dl. Additionally, note that the expected value of the geologic attribute has had the effect only of reducing the variance of the statistic.
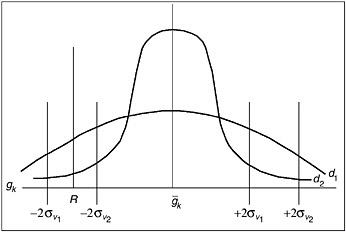
FIGURE A-1 The probability distributions, d1 and d2, of a geologic characteristic gk, for two geologic maps of different vintages and different scales, ν1 and ν2, for the same area. R represents a regulatory standard. ![]() denotes the expected value of the geologic attribute for a given locality or parcel of land. 2σ is the 95-percent confidence level about the expected value for the distributions.
denotes the expected value of the geologic attribute for a given locality or parcel of land. 2σ is the 95-percent confidence level about the expected value for the distributions.
The Inclusion of Geologic Map Information in Regulations Hypothetically, a regulatory agency could employ the following procedure to determine the number of parcels available for a given land use.9 Each parcel is tested for whether the average value of the geologic attribute (![]() ), minus two standard deviations, is greater than or less than the regulatory standard. The rule in Equation A-1 is applied to each parcel.
), minus two standard deviations, is greater than or less than the regulatory standard. The rule in Equation A-1 is applied to each parcel.
A-1
where ![]() is the average value of the geologic attribute in k, where k=l, …, K, σv is the standard deviation of g over the mapped area for a given vintage geologic map, v, and R is the regulatory standard.
is the average value of the geologic attribute in k, where k=l, …, K, σv is the standard deviation of g over the mapped area for a given vintage geologic map, v, and R is the regulatory standard.
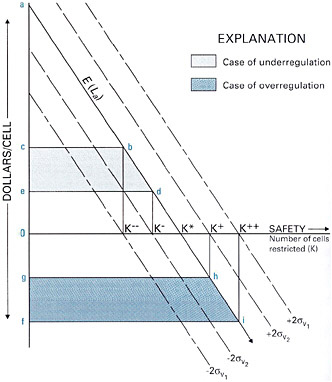
FIGURE A-2 Economic impact of a regulation based on geologic map information. E(La) is the marginal expected loss avoided; K* is the optimal level of safety. See text for in-depth discussion.
The economic impact of a regulation based on the improved geologic map information can be seen in Figure A-2. This figure is a representation of the changes in the number of parcels restricted or mitigated when new, more detailed information becomes available. Safety (horizontal axis) is denoted as the fraction of land (parcels or cells) in the region that is rejected (require mitigation) for a particular land use type.10 Losses avoided through implementation of regulations are measured in terms of a money metric (dollars) on the vertical axis. As the vulnerable, or “at risk,” cells are eliminated, society’s exposure to that risk is reduced. As the level of safety increases, there is an increase in expected losses avoided. The
change in expected losses avoided is shown in the figure as the marginal expected loss avoided, E(La), for restricting each additional cell. The E(La) curve represents the net marginal expected loss avoided (the cost of avoiding losses is constant), which is normalized on the figure by representing the E(La) as deviations from zero. Therefore, an optimal level of safety is shown as the intersection of the E(La) curve and the horizontal axis (net marginal expected loss avoided is zero) at the point labeled K* in the figure.
There is uncertainty regarding the actual losses to be avoided by restricting cells, because there is uncertainty concerning the true state of the geology underlying a cell. We have indicated this uncertainty in Figure A-2 by the dashed lines above and below E(La). We have indicated two levels of uncertainty, each of which is consistent with a different level of geologic map information (d1 and d2 in terms of Fig. A-1). In each case, the dashed lines enclose the 95-percent confidence interval.
The presence of information uncertainty leads to a tendency in the regulatory process to generate errors involving either underregulation or overregulation of land uses. Since the optimal level of safety is that which results in net marginal expected loss avoided being zero, either underregulation or overregulation must result in a welfare loss to society.
These losses may be shown by reference to Figure A-2. Consider the case in which the regulator sets the standards to restrict K−− cells. With K−− cells restricted, the social loss is given by the area bc0K*. This area is the amount of the potential consumer surplus that is foregone when the regulatory standard is set at K−− rather than the optimal level of K*. Improved geologic map information results in the level of regulation being increased so that K− cells are now restricted (this is the 95-percent confidence level with this improved information, d2). The welfare loss is now given by the area de0K*. The value of the improved geologic map information is the gain in consumer surplus (the reduction in the welfare loss) shown as the area cbde in Figure A-2.
Consider now the case in which the regulator sets the standards at K++ (this is overregulation compared with the social optimal level of K*). The welfare loss associated with this amount of overregulation in the area if0K*. With the improved information, the regulator reduces the number of cells restricted to K+. The gain from this information is the area fihg.
REFERENCES
Bagnoli, M., and M. McKee, 1991. Voluntary contribution games: Efficient private provision of public goods. Economic Inquiry, 29: 351-366.
Becker, G., 1975. Human capital. 2nd edition. Chicago, Illinois, University of Chicago Press; 268 pp.
Bergstrom, T., L. Blume, and H. Varian, 1986. On the private provision of public goods. Journal of Public Economics, 29: 25-39.
Bernknopf, R.L., D.S. Brookshire, D.R. Soller, M.J. McKee, J.F. Sutter, J.C. Matti, and R.H. Campbell, 1993. Societal Value of Geologic Maps. Denver, Colorado, U.S. Geological Survey Circular 1111; 53 pp.
Cornes, R., and T. Sandler, 1986. The theory of externalities, public goods, and club goods. New York, Cambridge University Press; 451 pp.
Isaac, R.M., K. McCue, and C.R. Plott, 1985. Public good provision in an experimental environment. Journal of Public Economics, 26: 51-74.
Matti, J.C., R.L. Bernknopf, J.N. Van Driel, G.E. Ulrich, and J.S. Schindler, 1988. Photo-mechanical versus computer-based methods of preparing and disseminating geologic-map information: A comparison of costs and savings. U.S. Geological Survey administrative report, April 1988; 25 pp.
Mueller, D.C., 1989. Public choice II. New York, Cambridge University Press; 8-17.
Musgrave, R.A., 1959. The theory of public finance. New York, Macmillan; 628 pp.
Varnes, D.J., 1974. The Logic of Geological Maps, with Reference to Their Interpretation and Use for Engineering Purposes. Washington, D.C., U.S. Geological Survey, Professional Paper 837; 48 pp.


