
4
Heritable Genetic Effects of Radiation in Human Populations
INTRODUCTION AND BRIEF HISTORY
Naturally occurring mutations in somatic and germ cells contribute respectively to cancers and heritable genetic diseases (i.e., hereditary diseases). The discoveries by Muller (1927) of the mutagenic effects of X-rays in fruit flies (Drosophila) and by Stadler (1928a, 1928b) of similar effects in barley and maize, and the subsequent extension of these findings to other types of ionizing radiation (and also to ultraviolet) and other organisms, conclusively established the genetic damage-inducing effects of radiation. However, widespread and serious concern over the possible adverse genetic effects of exposure of large numbers of people to low levels of radiation first arose in the aftermath of the detonation of atomic bombs over Hiroshima and Nagasaki in World War II, some 20 years after the discoveries of the mutagenic effects of X-rays. In June 1947, at the meeting of the Conference on Genetics convened by the Committee on Atomic Casualties of the U.S. National Research Council to assess the program of research on the heritable effects of radiation to be undertaken in Japan, the leading geneticists voted unanimously to record the following expression of their attitude toward the program: “Although there is every reason to infer that genetic effects can be produced and have been produced in man by atomic radiation, nevertheless the conference wishes to make it clear that it cannot guarantee significant results from this or any other study on the Japanese material. In contrast to laboratory data, this material is too much influenced by extraneous variables and too little adapted to disclosing genetic effects. In spite of these facts, the conference feels that this unique possibility for demonstrating genetic effects caused by atomic radiation should not be lost …” (NRC 1947). Thus came into existence the genetics program in Hiroshima and Nagasaki under the auspices of the Atomic Bomb Casualty Commission (ABCC), the newly formed joint agency of the Japanese Ministry of Health and Welfare and the U.S. National Academy of Sciences. The ABCC was renamed the Radiation Effects Research Foundation in 1976. In the late 1940s, the mouse was chosen as the primary surrogate for assessing the genetic radiosensitivity of humans, and extensive studies were initiated in different research centers in the United States, England, and Japan.
In the mid-1950s, one major international and several national scientific bodies came into existence, including the United Nations Scientific Committee on the Effects of Atomic Radiation (UNSCEAR), the Committee on the Biological Effects of Atomic Radiation (the BEAR committee; renamed the Committee on the Biological Effects of Ionizing Radiation [BEIR] in 1972) set up by the U.S. National Academy of Sciences, and the Committee of the British Medical Research Council. The UNSCEAR and the BEIR committees have continued their work up to the present, periodically reviewing the levels of radiation to which human populations are exposed and improving assessment of the somatic and genetic risks of radiation exposure (NRC 1972, 1980, 1988, 1990, 1999; UNSCEAR 1993, 2000b, 2001).
From the beginning of these efforts, it was obvious that in the absence of direct human data on radiation-induced germ cell mutations, quantitative estimates of genetic risk could be derived only through a knowledge of the prevalence of naturally occurring hereditary ill health in the population, the role of spontaneous mutations in supporting this burden, and plausible assumptions on the rates of induced germ cell mutations in humans. The methods developed and used by the above committees for risk estimation, therefore, were necessarily indirect. All were geared toward using human data on genetic diseases as a frame of reference, together with mouse data on radiation-induced mutations, to predict the radiation risk of genetic disease in humans. Both the UNSCEAR and the BEIR committees are cognizant of the need to make assumptions given the consequent uncertainties in extrapolating from mouse data on induced mutation rates to the risk of genetic disease in humans.
Details of the genetics program that evolved in Japan and the vast body of data that emerged from these studies have
been published in a series of articles. The most relevant ones have now been compiled in a single volume (Neel and Schull 1991). The most important finding of these studies is that there are no statistically demonstrable adverse genetic effects attributable to radiation exposures sustained by the survivors. Although cited and discussed in the UNSCEAR and BEIR reports over the years, these results did not constitute part of the “mainstream thinking” of genetic risk estimators and therefore were not used in risk estimation.
During the past few years, estimates of the baseline frequencies of Mendelian diseases have been revised and mathematical methods have been developed to estimate the impact of an increase in mutation rate (as a result of radiation exposures) on the frequencies of different classes of genetic diseases in the population. Additionally, there have been several advances in our understanding of the molecular basis and mechanisms of origin of human genetic diseases and of radiation-induced mutations in experimental systems. As a result of these developments, it now is possible to reexamine the conceptual basis of risk estimation, reformulate some of the critical questions in the field, and address some of the problems that could not be addressed earlier.
This chapter summarizes the general framework and the methods and assumptions used in risk estimation until the publication of BEIR V (NRC 1990). This is followed by a discussion of the advances in knowledge since that time, their impact on the concepts used in risk estimation, and how they can be employed to revise the risk estimates. Throughout this chapter, the terms “genetic diseases,” “genetic effects,” and “genetic risks” are used exclusively to mean “heritable genetic diseases,” “heritable genetic effects,” and “heritable genetic risks,” respectively.
GENERAL FRAMEWORK
Goal of Genetic Risk Estimation
The goal of genetic risk estimation, at least as envisioned and pursued by UNSCEAR and the BEIR committees, remains prediction of the additional risk of genetic diseases in human populations exposed to ionizing radiation, over and above that which occurs naturally as a result of spontaneous mutations. The concept of “radiation-inducible genetic diseases,” which emerged early on in the field, is based on two established facts and an inference. The facts are that (1) hereditary diseases result from mutations that occur in germ cells and (2) ionizing radiation is capable of inducing similar changes in all experimental systems adequately investigated. The inference, therefore, has been that radiation exposure of human germ cells can result in an increase in the frequency of genetic diseases in the population. Worth noting is the fact that although there is a vast amount of evidence for radiation-induced mutations in diverse biological systems, there is no evidence for radiation-induced germ cell mutations that cause genetic disease in humans.
Germ Cell Stages and Radiation Conditions of Relevance
From the standpoint of genetic risks, the effects of radiation on two germ cell stages are particularly important. In the male, these are the stem cell spermatogonia, which constitute a permanent germ cell population in the testes and continue to multiply throughout the reproductive life span of the individual. In the female, the corresponding cell stages are the oocytes, primarily the immature ones. The latter constitute the predominant germ cell population in the female. Female mammals are born with a finite number of oocytes formed during fetal development. These primordial oocytes, as they are called, grow, and a sequence of nuclear changes comprising meiosis takes place in them. The latter however are arrested at a particular stage until just before ovulation. Because oocytes are not replenished by mitosis during adult life and immature oocytes are the predominant germ cell population in the female, these are clearly the cell stages whose irradiation has great significance for genetic risks.
The radiation exposures sustained by germ cells in human populations are generally in the form of low-LET (linear energy transfer) irradiation (e.g., X-rays and γ-rays) delivered as small doses at high dose rates (e.g., in diagnostic radiology) or are greatly protracted (e.g., continuous exposures from natural and man-made sources). In estimating genetic risks to the population therefore, the relevant radiation conditions are low or chronic doses of low-LET irradiation. As discussed later, most mouse data used for estimating the rates of induced mutations have been collected at high doses and high dose rates. Consequently, assumptions have to be made to convert the rates of induced mutations at high doses and dose rates into mutation rates for radiation conditions applicable for risk estimation in humans.
GENETIC DISEASES
Since the aim of genetic risk estimation is to predict the additional risk of genetic diseases relative to the baseline frequency of such diseases in the population, the concept of genetic diseases and their classification and attributes are considered in this section. The term genetic diseases refers to those that arise as a result of spontaneous mutations in germ cells and are transmitted to the progeny.
Mendelian Diseases
Diseases caused by mutations in single genes are known as Mendelian diseases and are further divided into autosomal dominant, autosomal recessive, and X-linked, depending on the chromosomal location (autosomes or the X chromosome) and transmission patterns of the mutant genes. In an autosomal dominant disease, a single mutant gene (i.e., in the heterozygous state) is sufficient to cause disease. Examples include achondroplasia, neurofibromatosis, Marfan syndrome, and myotonic dystrophy. Autosomal recessive
diseases require homozygosity (i.e., two mutant genes at the same locus, one from each parent) for disease manifestation. Examples include cystic fibrosis, phenylketonuria, hemochromatosis, Bloom’s syndrome, and ataxia-telangietasia.
The X-linked recessive diseases are due to mutations in genes located on the X chromosome and include Duchenne’s muscular dystrophy, Fabry’s disease, steroid sulfatase deficiency, and ocular albinism. Some X-linked dominant diseases are known, but for most of them, no data on incidence estimates are currently available. Therefore, these diseases are not considered further in this report. The general point with respect to Mendelian diseases is that the relationship between mutation and disease is simple and predictable.
Multifactorial Diseases
The major burden of naturally occurring genetic diseases in human populations, however, is not constituted by Mendelian diseases, which are rare, but by those that have a complex etiology. The term “multifactorial” is used to designate these diseases to emphasize the fact that there are multiple genetic and environmental determinants in their etiology. Their transmission patterns do not fit Mendelian expectations. Examples of multifactorial diseases include the common congenital abnormalities such as neural tube defects, cleft lip with or without cleft palate, and congenital heart defects that are present at birth, and chronic diseases of adults (i.e., with onset in middle and later years of life) such as coronary heart disease, essential hypertension, and diabetes mellitus.
Evidence for a genetic component in their etiology comes from family and twin studies. For example, first-degree relatives of patients affected with coronary heart disease have a two- to sixfold higher risk of the disease than those of matched controls, and the concordance rates of disease for monozygotic twins are higher (but never 100%) than those for dizygotic twins (Motulsky and Brunzell 1992; Sankaranarayanan and others 1999).
As mentioned earlier, multifactorial diseases are presumed to originate from the joint action of multiple genetic and environmental factors; consequently, the presence of a mutant allele is not equivalent to having the disease. For these diseases, the interrelated concepts of genetic susceptibility and risk factors are more appropriate. The genetic basis of a common multifactorial disease is the presence of a genetically susceptible individual, who may or may not develop the disease depending on the interaction with other genetic and environmental factors. These concepts are discussed further in Annex 4A. The important general point is that unlike the situation with Mendelian diseases, the relationships between mutations and disease are complex in the case of multifactorial diseases. For most of them, knowledge of the genes involved, the types of mutational alterations, and the nature of environmental factors remains limited. Among the models used to explain the inheritance patterns of multifactorial diseases and to estimate the recurrence risks in relatives is the multifactorial threshold model (MTM) of disease liability. The MTM, its properties, and its predictions are discussed in Annex 4A.
Chromosomal Diseases
Historically, both UNSCEAR and the BEIR committees have always had an additional class of genetic diseases—“chromosomal diseases”—in their lists that included those that had long been known to arise as a result of gross (i.e., microscopically detectable), numerical (e.g., Down’s syndrome, which is due to trisomy of chromosome 21), or structural abnormalities of chromosomes (e.g., cri du chat syndrome, due to deletion of part or the whole short arm of chromosome 5 [5p-]). As discussed later, this is really not an etiological category, and deletions (microscopically detectable or not) are now known to contribute to a number of constitutional genetic diseases grouped under autosomal dominant, autosomal recessive, and X-linked diseases.
RISK ESTIMATION METHODS
In the absence of data on radiation-induced germ cell mutations that can cause genetic disease in humans, all of the methods developed and used for predicting the risk of genetic disease from the mid-1950s to the present are indirect. Their strengths and weaknesses are reviewed in BEIR V (NRC 1990). One such indirect method is the doubling dose method, on which attention is focused in this section. It has been in use since the early 1970s (NRC 1972, 1990; UNSCEAR 1977, 1982, 1986, 1988) and is used in the recent UNSCEAR (2001) report.
The Doubling Dose Method
The doubling dose method enables expressing of the expected increase in disease frequency per unit dose of radiation in terms of the baseline frequency of the disease class. The doubling dose (DD) is the amount of radiation required to produce in a generation as many mutations as those that arise spontaneously. Ideally, it is estimated as a ratio of the average rates of spontaneous and induced mutations in a given set of genes:
(4-1)
The reciprocal of the DD (i.e., 1/DD) is the relative mutation risk (RMR) per unit dose. Since RMR is the reciprocal of DD, the smaller the DD, the higher is the RMR and vice versa. With the doubling dose method, until recently, risk was estimated as a product of two quantities—namely, the baseline disease frequency, P, and 1/DD:
(4-2)
The population genetic theory that underlies the use of Equation (4-2) is the equilibrium theory that population geneticists use to explain the dynamics of mutant genes in populations. The theory assumes that the stability of mutant gene frequencies (and thus disease frequencies) in a population is the result of the existence of a balance between the rates at which spontaneous mutations enter the gene pool in every generation and the rate at which they are eliminated by natural selection (i.e., through failure of survival or reproduction).
When the mutation rate is increased as a result of radiation in every generation, this balance between mutation and selection is disturbed by the influx of induced mutations, but the prediction is that the population will attain a new equilibrium (over a number of generations) between mutation and selection. The amount of increase in mutation frequency, the time it takes for the population to reach the new equilibrium, and the rate of approach to equilibrium are all dependent on induced mutation rates, the intensity of selection, the type of genetic disease, and whether the radiation exposure occurs in one generation only or generation after generation. It should be noted that since the starting population (before radiation exposure) is assumed to be in equilibrium between mutation and selection, the quantity P in Equation (4-2) represents the equilibrium incidence of the disease, and the product of P and 1/DD is the expected increase in disease frequency at the new equilibrium.
Risk Estimation for Different Classes of Genetic Disease
The application of Equation (4-2) to risk estimation is straightforward for autosomal dominant diseases since the relationship between mutation and disease is simple for this class of diseases. Population genetic theory predicts that for these diseases, if there is an x% increase in mutation rate in every generation, at the new equilibrium this increase will be reflected as an x% increase in the frequency of these diseases. Until recently, estimates of risk for the first, second, or any postradiation generation of interest were obtained through “back calculation” from the predicted new equilibrium incidence using certain assumptions. If the population sustains radiation exposure in one generation only, there will be a transient increase in the mutant frequency in the first postradiation generation, followed by a progressive decline to the “old” equilibrium value.
The method used to predict the risk of X-linked diseases is approximately similar to that for autosomal dominant diseases discussed above. For autosomal recessive diseases, the risk calculation is more involved because when recessive mutations first arise (or are induced), they are present in the heterozygous state and do not precipitate disease in children of the first few postradiation generations. For multifactorial diseases, the situation is complex in that there is no simple relationship between mutation and disease, and as discussed later, the estimate of risk will depend on the model used for their maintenance in the population.
The Concept of Mutation Component
The concept of mutation component and the statistic MC, which is derived using this concept, help to unify attempts at predicting how the frequencies of different classes of genetic diseases in the population will change as a result of increases in mutation rate. The mutation component is defined as the relative increase in disease frequency (i.e., relative to the baseline frequency) per unit relative increase in mutation rate (i.e., relative to the spontaneous mutation rate). First introduced in BEIR I (NRC 1972) to address the problem of the impact of the radiation risk of multifactorial diseases in the population, and subsequently elaborated by Crow and Denniston (1981, 1985) and Denniston (1983), the concept can be used for all classes of genetic disease as done in BEIR V (NRC 1990). During the past few years, the concept has been developed further with the necessary algebraic formulations, that permit a direct evaluation of the impact of an increase in mutation rate for all classes of genetic disease in any postradiation generation of interest following exposure to radiation in either one generation only or generation after generation (Chakraborty and others 1998a; Denniston and others 1998). These advances are considered in a later section. Suffice to note here that the inclusion of MC in Equation (4-2) yields the revised equation:
(4-3)
where MC is the disease class and postradiation generation-specific mutation component and the other two quantities are as defined earlier.
RECENT ADVANCES WITH RESPECT TO THE THREE QUANTITIES USED WITH THE DD METHOD OF RISK ESTIMATION
The BEIR V report (NRC 1990) reviewed the advances that occurred from the mid-1950s to 1990 with respect to P, the baseline frequency of genetic disease, DD, and MC, the three quantities considered relevant for risk estimation with the DD method thus far. In the material that follows, attention is focused on progress made since 1990.
Baseline Frequencies of Genetic Diseases
Mendelian Diseases
Estimates of the baseline frequencies of Mendelian diseases used by UNSCEAR since its 1977 report and by the BEIR III and BEIR V committees (NRC 1980, 1990) have been based on the compilations and analysis of Carter (1976a, 1976b) primarily for Western European and Western
European-derived populations. These are the following (all in live births): autosomal dominants, 0.95%; X-linked, 0.05%; and autosomal recessive, 0.25%. Advances in human genetics during the past two decades now permit an upward revision of the above estimates to 1.5% for autosomal dominant diseases, 0.15% for X-linked diseases, and 0.75% for autosomal recessive diseases (Sankaranarayanan 1998). Note that the revised total frequency of Mendelian diseases is thus 2.4%, which is about twice the earlier figure of 1.25%.
Multifactorial Diseases
For multifactorial diseases (which include congenital abnormalities present at birth and chronic diseases), the estimates used by UNSCEAR (1986, 1988, 1993, 2001) derive from data obtained for the population of Hungary (Czeizel and Sankaranarayanan 1984; Czeizel and others 1988). These estimates are 6% of live births for congenital abnormalities and 65% of the population affected by chronic diseases (excluding cancers). Since most chronic diseases have their onset in middle and late ages (published figures pertain to these age groups), data on the distribution of the population in various age intervals (i.e., ages 0, 1, 2, 3–4, 5–9, 10–14, … 80–84, 85+, etc.; a total of 21 age intervals) for 1977 to 1981 were used to obtain estimates applicable to the population as a whole. For example, if the published estimate for a given disease pertains to the adult population (i.e., above age 14), the figure was reduced by 21% since the 0–14 year age group constituted 21% of the total population of 10.7 million (Czeizel and others 1988).
For the BEIR V committee (NRC 1990), the starting point for congenital abnormalities was the published data of Czeizel and Sankaranarayanan (1984) and Czeizel and others (1988), which gave an incidence estimate of 6%. This figure was reduced to 2–3% by noting that the 6% figure is “… so high, in part, because of the unusually high frequency of congenital dislocation of the hip in Hungary” (Czeizel and Sankaranaryanan 1984). For chronic diseases, the starting point was the estimate of about 60% based on preliminary data of Czeizel and colleagues made available to and used by UNSCEAR in its 1988 report. The BEIR V committee reduced the figure of 60% to 30% by (1) subtracting the estimates for essential hypertension, acute myocardial infarction, other acute and subacute forms of ischemic heart disease, and varicose veins of the lower extremities (together about 25%) and (2) reducing the figure for juvenile osteochondrosis of the spine from 11% (based on radiographic screening) to about 0.5% (on the assumption that only about 5% of the cases identified by radiographic screening may be deemed to be of clinical significance). The resulting adjusted figure of about 30% was given as the estimate for the “selected others” subgroup of “other diseases of complex etiology.” Together with the earlier committee’s figures for heart disease (60%) and cancer (30%; which were termed “round number approximations” for all varieties of the above diseases), the total became 120%. Footnote f to Table 2-5 of the BEIR V report (NRC 1990) offers the following explanation for the 120% figure: “Includes heart disease, cancer, and other selected disorders…. Note that the total exceeds 100%. The genetic component in many of these traits is unknown. To the extent that genetic influences are important, the effects are through genes that have small individual effects but that act cumulatively among themselves and in combination with environment factors to increase susceptibility.”
Estimates of Baseline Frequency of Multifactorial Diseases Used in This Report
In examining what would be considered a reasonable estimate of baseline frequency of congenital abnormalities for use in risk estimation, the BEIR VII committee took note of the vast body of data on their prevalence in different parts of the world, including some large-scale studies carried out in North America (Myrianthopoulos and Chung 1974; Trimble and Doughty 1974; Baird and others 1988). The estimates vary over a wide range, from about 1% in live births to a high of about 8.5% in total births (i.e., still- and live births), depending on, among other things, the definition, classification, and diagnostic criteria; entities included; method of ascertainment; duration of follow-up of live-born children; and sample sizes. In one of the largest U.S. studies (Myrianthopoulos and Chung 1974), the overall frequency of major abnormalities was 8.3% (53,257 deliveries of known outcome), which compares favorably with the estimate of about 6% from British Columbia (Baird and others 1988) and of about 6% from Hungary mentioned earlier. This documents the premise that under conditions of good ascertainment, the overall prevalences are similar and are of the order of about 6%. This committee therefore accepts the 6% figure as reasonable for use in risk estimation in this report.
For chronic multifactorial diseases, the committee prefers to use the estimate of 65% obtained by Czeizel and colleagues (1988) in view of the fact that the estimate is based on 26 clear-cut disease entities defined by ICD (International Classification of Diseases) code numbers that were studied epidemiologically in a large population. This estimate was also used by UNSCEAR (1988, 1993, 2001) as the best available overall estimate for chronic diseases as a whole (excluding cancers). Included in the above estimate are heart or blood vessel-related diseases, together, about 25%. For the estimate of 60% mentioned in BEIR V (NRC 1990) under the heading “heart disease” no verifiable source or study is cited. Likewise, for cancers, BEIR V cites an estimate of 30%, again with no citation of the source or the types of cancers included. As mentioned earlier, both of these numbers represent round number approximations.
In the view of the BEIR VII committee, the inclusion of cancers in estimating the heritable risks of radiation is not meaningful at the present state of knowledge.
Estimates of Baseline Frequency of Chromosomal Disease
The BEIR V report (NRC 1990) and the UNSCEAR (1993) report assessed the baseline prevalence of chromosomal diseases to be of the order of about 0.4% in live births. The present committee sees no reason to alter this estimate.
Summary of Current Estimates of Baseline Frequencies of Genetic Diseases and Comparison with Those in BEIR V
Table 4-1 presents these comparisons showing that the current estimates for Mendelian diseases are higher than those used in 1990, while those for the other classes remain essentially unchanged.
The Doubling Dose
As discussed earlier DD is one of the important quantities used in the equation for the doubling dose method of risk estimation. Although the DD concept was formulated by Muller (1951, 1954, 1959) in the 1950s and several possible estimates and/or ranges of DDs were discussed in the BEAR report (NRC 1956), in UNSCEAR (1962), and in Lüning and Searle (1971), actual use of the method to obtain quantitative estimates of risk began only in 1972 (NRC 1972). Changes in the conceptual basis and database used for DD estimates from the mid-1950s to the early 1990s have recently been reviewed (Sankaranarayanan and Chakraborty 2000a).
TABLE 4-1 Estimates of the Baseline Prevalences of Genetic Diseases Used in BEIR VII and BEIR V
Table 4B-1 (see Annex 4B) summarizes the important developments. As evident from that Table, with one exception, most of the DD estimates used in risk estimation by UNSCEAR and the BEIR committees were based on data on both spontaneous and induced mutation rates in mice. The one exception was BEIR I (NRC 1972), which used data on spontaneous rate of mutations of human genes and induced rate of mutations in mouse genes. As discussed below, reevaluation of the assumptions underlying the use of mouse data on spontaneous mutation rate for DD calculations has shown that these are incorrect and that the use of human data on spontaneous mutation rates along with mouse data on induced rates is correct.
Incorrectness of the Assumption of Similarity of Spontaneous Mutation Rates in Mice and Humans—The Need to Use Human Spontaneous Mutation Rates for DD Calculations
Extrapolation of the mouse-based DD to humans for risk estimation implies the assumption that both the spontaneous and the induced rates of mutations are similar in the two species. The assumption of similarity of induced rates of mutations in both species is defensible on the grounds of generally similar gene organization, 70–90% homology in DNA sequence of genes, and substantial conservation of synteny for many chromosomal regions between humans and mice. However, the situation is different with respect to spontaneous mutations.
The reasons spontaneous mutation rates in humans are unlikely to be similar to those in mice have been discussed (Sankaranarayanan 1998). Briefly, these have to do with the differences in the number of cell divisions between the zygote and the mature germ cell in the two species. Vogel and Motulsky (1997) estimate that in human females, the number of cell divisions from zygote to the mature egg (Nf) is of the order of about 24. For the mouse female, estimates of Drost and Lee (1995) suggest that Nf is of the same order. So, from the standpoint of Nf, human and mouse females are similar.
In human males, however, the comparable number of cell divisions is much higher; it is about 30 until the age of puberty (taken to be 15 years), ~23 per year thereafter, and 6 for proliferation and meiosis. Thus, the number of cell divisions prior to sperm production (Nm) in a 20-year-old male can be estimated to be 30 + (5 × 23) + 6 = 151, increasing to 381 at age 30 years, 611 at age 40 years, and 841 at age 50 years (Crow 1999). The Nm/Nf thus increases with paternal age, being 6.3 at age 20, 15.9 at age 30, 25.5 at age 40, and 35.0 at age 50. In the male mouse, the number of cell divisions from zygote to sperm is of the order of about 62 at age 9 months, assuming a 9-month generation (Chang and others 1994; Drost and Lee 1995; Li and others 1996). The Nm/Nf ratio in the mouse is therefore 2.5 (i.e., 62/25), which is much lower than in humans. The committee notes that in
most mouse experiments, the parental animals were used at a rather uniform age (usually about 12 weeks), and the question of paternal age effects has not been specifically addressed.
Since most spontaneous mutations arise as a result of errors in DNA replication, one would expect that the mutation rate in human males would be higher than that in females and that there would be an increase in the likelihood of spontaneous germinal mutations with the age of the male (so-called paternal age effect). By and large, these expectations have been fulfilled. The literature on this subject and the recent evidence from molecular studies have been reviewed (Crow and Denniston 1985; Crow 1993, 1997, 1999; Vogel and Motulsky 1997; Sankaranarayanan 1998; Green and others 1999).
When one considers the large differences in life span between humans and mice and the paternal age effect for spontaneous mutations in humans, it is clear that extrapolation from short-lived mice to humans is unlikely to provide a reliable average spontaneous rate in a heterogeneous human population of all ages. This is one reason to abandon the use of the mouse data on spontaneous mutation rates in DD calculations and to use human spontaneous mutation rates instead. The following arguments support this: (1) estimates of spontaneous mutation rates in humans are unweighted averages of the rates in the two sexes (and therefore automatically incorporate sex differences and paternal age effects), and (2) the sex-averaged rate is relevant in the context of DD calculations (Sankaranarayanan 1998).
A second reason for not using the mouse spontaneous mutation rates for DD calculations is that the whole question of spontaneous mutation rates in mice has now assumed an unexpected complexity due to the noninclusion, until recently, of mutations that originated as germinal mosaics (resulting in progeny carrying the same mutation [“clusters”] in the following generation) in estimates of spontaneous mutation rates in the specific locus experiments (Russell and Russell 1996; Selby 1998a, 1998b; Russell 1999). According to Russell and Russell (1996), if mosaic data are included, the total spontaneous rate becomes twice that of 6.6 × 10⁻⁶ per gene based on mutations that arose singly. However, Selby (1998a, 1998b) has argued that (1) the data on clusters should be included in calculating the total spontaneous mutation rate; (2) his computer simulation studies (which incorporate clusters in his model) suggest an increase of the rate by a factor of about 5 compared to that based on mutations that arose singly; (3) the fivefold higher total spontaneous rate is the appropriate numerator in DD calculations; and (4) if paternal age effects are extrapolated from humans to mice, the estimate of spontaneous rate is even higher. In the view of this committee, the above argument cannot be sustained for humans for the following reasons:
First, while there is no doubt that a proportion of spontaneous mutations in human genes arise as germinal mosaics (and can potentially result in clusters in the following generation), the limited data available on mosaics and clusters at present preclude a quantitative assessment of their contribution to spontaneous mutation rates. The main relevance of germinal mosaicism in the human context is this: the parent who carries a mosaic mutation for an autosomal dominant or X-linked trait does not have a mutant phenotype and therefore would not be considered as having a risk of producing affected children. However, because his or her gonads contain mutant and normal cells, he or she may run the risk of having more than one progeny who carries the mutant gene (mutational “clusters”).
Second, if a substantial proportion of human mutations arise as germinal mosaics in one generation and result in clusters in the following generation, the frequencies of at least autosomal dominant and X-linked diseases also have to be corrected upwards to account for this possibility; there is no reliable way of doing this at present. The published estimates of human spontaneous mutation rates do not provide sufficient grounds for assuming that substantial proportions of mutations in the germ cells first arose as mosaics and subsequently resulted in clusters of mutations; if this had been the case, major increases in the frequencies of affected individuals from one generation to the next would have been observed, but this does not appear to be true. Further, family sizes in present-day human populations are limited (in fact, they are so small that there is almost never more than one affected offspring from a mating, in contrast to the situation in mice where large numbers of progeny are obtained from a single male). Both of these arguments support the view that mutational clusters are much less relevant in humans than in mice.
The advantages of using human spontaneous mutation rates for DD calculations are (1) they pertain to human disease-causing genes; (2) as mentioned earlier, the mutation rate estimates in humans, because they are averaged over both sexes, automatically include sex differences and paternal age effects; and (3) in mutation rate calculations, human geneticists count all mutants that arise anew irrespective of whether they were part of a cluster or not; if clusters had occurred, they would have been included. The committee therefore accepts the view that the use of human spontaneous rates and mouse induced rates for DD calculations (i.e., the procedure used in BEIR I; NRC 1972) is more logical, and it has assessed published data on spontaneous mutation rate in humans and induced rates of mutations in mice.
Doubling Dose Estimation Using Spontaneous Mutation Rates of Human Genes and Induced Rates of Mouse Genes
Estimation of the Average Spontaneous Mutation Rate of Human Genes
To calculate a representative average spontaneous mutation rate of human genes, the available estimates for indi-
vidual autosomal dominant diseases published by Childs (1981) and Vogel and Motulsky (1997) were used, irrespective of whether these diseases have high or low prevalence or high or low mutation rates. However, the analysis took into account the numbers of genes thus far known or estimated to underlie each of these disease phenotypes (Vogel and Motulsky 1997; Sankaranarayanan 1998; McKusick 2000). This represents an important departure from earlier estimates based on disease phenotypes alone, which generally assumed a one-to-one relationship between mutation and disease. Details of these diseases, estimates of mutation rates, and selection coefficients are given in Table 4-2. The (unweighted) average mutation rate derived from these data (for some 26 autosomal dominant phenotypes with an esti
TABLE 4-2 Database for Estimating Average Spontaneous Mutation Rate of Human Autosomal Genes Associated with Autosomal Dominant Diseases and Their Selection Coefficients(s)
|
Disease Phenotype |
Estimated |
||
|
No. of Loci |
Mutation Rate (× 106)a |
Selection Coefficient(s)b |
|
|
Achondroplasia |
1 |
11.0 |
0.8 |
|
Amelogenesis imperfecta |
1 |
1.0 |
0 |
|
Aniridia |
2 |
3.8 |
0.1 |
|
Apert’s syndrome |
1 |
3.5 |
0 |
|
Blindness |
9 |
10.0 |
0.7 |
|
Cataracts (early onset) |
30 |
6.0 |
0.3 |
|
Cleft lip |
1 |
1.0 |
0.2 |
|
Deaf mutism |
15 |
24.0 |
0.7 |
|
Dentinogenesis imperfecta |
2 |
1.0 |
0 |
|
Huntington disease |
1 |
5.0 |
0.2 |
|
Hypercholesterolemia |
1 |
20.0 |
0 |
|
Marfan syndrome |
1 |
5.0 |
0.3 |
|
Multiple exotoses |
3 |
7.7 |
0.3 |
|
Myotonic dystrophy |
1 |
18.0 |
0.3 |
|
Neurofibromatosis |
2 |
70.0 |
0.5 |
|
Osteogenesis imperfecta |
2 |
10.0 |
0.4 |
|
Osteopetrosis |
1 |
1.0 |
0.2 |
|
Otosclerosis |
1 |
20.0 |
0 |
|
Polyposis of intestine |
1 |
10.0 |
0.2 |
|
Polycystic kidney disease |
2 |
87.5 |
0.2 |
|
Porphyria |
2 |
1.0 |
0.05 |
|
Primary basilar impression |
1 |
10.0 |
0.2 |
|
Rare diseases (early onset) |
50 |
30.0 |
0.5 |
|
Retinoblastoma |
1 |
8.7 |
0.5 |
|
Spherocytosis |
1 |
22.0 |
0.2 |
|
Tuberous sclerosis |
2 |
8.0 |
0.8 |
|
Total |
135 |
|
|
|
Average |
|
( 2.95 ± 0.64) |
0.294 |
|
aFor some entries, mutation rate estimates are uncertain (see Childs 1981 for details). bEstimated from reproductive fitness. SOURCE: Childs (1981); Vogel and Motulsky (1997). |
|||
mated 135 loci) is (2.95 ± 0.64) × 10−6 per locus per generation. This figure is within the range of 0.5 × 10⁻⁵ to 0.5 × 10⁻⁶ per locus used in the 1972 BEIR I report (NRC 1972).
The list of autosomal dominant diseases used to provide the basis for the prevalence estimate (P in Equation (4-3)) encompasses many more than the 26 diseases used in the above calculations (Sankaranarayanan 1998); these other diseases could not be included in the present analysis because of lack of information on mutation rates. Further, the mutation rate estimates for X-linked phenotypes have not been included in these calculations; instead, it has been assumed that the average spontaneous mutation rate for autosomal dominant genes calculated above can also be used for X-linked genes. The justification for this assumption rests on the following lines of reasoning: (1) among Mendelian diseases, autosomal dominants constitute the most important group from the standpoint of genetic risks, and (2) although X-linked recessive diseases are also expected to respond directly to an increase in mutation rate, since their prevalence is an order of magnitude lower than that of autosomal dominants (i.e., 0.15% versus 1.5%) the assumption of similar spontaneous rates of mutations for autosomal dominants and X-linked recessives is unlikely to result in any significant underestimation of the total risk. In fact, for this reason, these two classes of diseases are considered together in risk estimation.
The Average Rate of Induced Mutations in Mice
To calculate the average rate of induced mutations in mice, the committee used all available data on rates of induced mutations in defined genes in mice; these relate to recessive specific locus mutations at 12 loci, biochemical mutations (null enzyme mutations, also recessive at a large number of loci), and autosomal dominant mutations at 4 loci incidentally detected in the course of the specific locus experiments. The data on these autosomal dominant mutations are all from studies carried out in Harwell; comparable data from Oak Ridge studies were unavailable. Inclusion of the data on dominant mutations in mutation rate calculations was dictated by the consideration that although the underlying genes were not well defined at the time these experiments were performed (but mutations were “frequently” observed and recorded, indicating that they were among the more radiation-mutable loci), we now know not only their identity (and the molecular nature of the mutations) but also their human counterparts (the mouse Sl, W, Sp, and T correspond to, respectively, the MGF, KIT, PAX3, and T genes in humans; see McKusick 2000). All of the data considered here come from experiments involving stem cell spermatogonia.
The data from female mice have not been used because there is uncertainty about whether mouse immature oocytes are a good model for assessing the mutational radiosensitivity of human immature oocytes (UNSCEAR 1988). The arguments rest on (1) the strikingly higher sensitivity of mouse
immature oocytes to radiation-induced killing (the majority are destroyed by 0.5 Gy; Oakberg and Clark 1964) in contrast to those of human and rhesus monkey immature oocytes, for which the dose required is at least 100 times higher (Baker 1971) and (2) the observations that no mutations were recovered from oocytes sampled 7 weeks after irradiation in contrast to the situation with mature and maturing oocytes (Russell 1965). In view of this uncertainty and in order not to underestimate the risk, the committee has used the assumption that the rate estimated for males will also be applicable to females.
Details of the data used are summarized in Tables 4-3A to 4-3C and are from experiments involving acute X-irradiation or from high-dose fractionated X-irradiation (usually two fractions separated by 24 h) appropriately normalized to acute X-irradiation conditions (see Table 4-3A, footnote d; and Table 4-3B, footnotes a and b) to permit easy comparisons. Table 4-3A shows that the average rate of induced mutations is highest at the original seven specific loci (3.03 × 10⁻⁵ per locus per gray) and is about one-third of the above at the six loci used in the experiments of Lyon and Morris (1969; i.e., 0.78 × 10⁻⁵ per locus per gray; one locus, a, is common to both sets). For various sets of biochemical loci at which null mutations have been scored, the estimates vary over a range from 0.24 × 10⁻⁵ to 1.64 × 10⁻⁵ per locus per gray. The average rate for dominant visible mutations is within the above range. The unweighted average of the induced mutation rates is 1.09 × 10⁻⁵ per locus per gray for acute irradiation. The use of this rate for DD calculations, however, is somewhat problematic since (1) there is overlap of one or more loci in different data sets; (2) in some studies (see footnote e, Table 4-3A), all of the loci involved could not be ascertained; and (3) there is no simple way of taking into account the interlocus variation and sampling variance of induced rates from the derived average estimate of 1.09 × 10⁻⁵ per locus per gray.
TABLE 4-3A Database for Calculating Rates of Induced Mutations in Mice
|
System |
No. of Loci |
Average Rate/Locus/Gy (× 105) |
Reference |
|
1. The 7-locus system (Lyon and others 1964) (3 and 6 Gy; acute X- or γ-irradiation or 3 + 3 Gy, 24 h interval) |
7a |
3.03 |
Phillips (1961); Russell (1965, 1968); Lyon and others (1972); Cattanach and Rasberry (1994); Pretsch and others (1994) |
|
2. The 6-locus system (Lyon and others 1964) (6 Gy; acute X-irradiation) |
6b |
0.78 |
Lyon and Morris (1969) |
|
3. Biochemical loci (recessive, null enzyme) (3 + 3 Gy, 24 h interval; X-rays) |
12c |
0.70d |
Charles and Pretsch (1986); Pretsch and others (1994) |
|
4. Biochemical loci (recessive, null enzyme) (3 Gy, 3 + 3 Gy, 24 h interval and 6 Gy; X-rays) |
32e 32 32 |
1.64 0.67d 0.24 |
Unpublished data of S.E. Lewis, cited in Neel and Lewis (1990) |
|
5. Biochemical loci (recessive, null enzyme) (3 + 3 Gy, 24 h interval; X-rays) |
4f |
1.24d |
Unpublished data of J. Peters, cited in Neel and Lewis (1990) |
|
6. Dominant visibles (Sl, W, Sp and T)g (X rays) |
4 |
0.44 |
See Table 4-3B |
|
Unweighted average: 8.74/8 = 1.09 × 10⁻⁵ per locus per gray |
|||
|
NOTE: Data are from experiments involving irradiation of males (stem cell spermatogonia) and all rates are normalized to single acute X-irradiation conditions. aa: non-agouti; b: brown; c: chinchilla; d: dilute; p: pink-eyed dilution; s: piebald; se: short ear; in the work of Pretsch and others (1994), with some strains, mutations at four or five of these loci were scored. ba: non-agouti; bp: brachypodism; fz: fuzzy; ln: leaden; pa: pallid; pe: pearl. cLdh1, Tpi, Gpi1, Pgk, G6pd1, G6pd2, Pk, Gr, Mod1, Pgam, Gapdh, Ldr. dNormalized assuming additivity of the effect of dose fractionation. eAcy1, Car2, G6pd1, Ggc, Es1, Es3, G6pd1, Gpi1, Hba, Hbb, Idh1, Ldh1, Ldh2, Mod1, Mod2, Np1, Pep2, Pep3, Pep7, Pgm1, Pgm2, Pgm3, Pk3, Trf (the identity of the other 8 loci could not be ascertained). fHba, Hbb, Es3, Gpi1. gSl: steel; W: dominant spotting; Sp: splotch; T: brachyury. |
|||
TABLE 4-3B Dominant Visible Mutations Recovered in the Course of Mouse Specific Locus Experiments (Spermatogonial Irradiation)
|
Expt No. |
X-ray Dose (Gy) |
Number of Progeny |
Number of mutations at |
Mutations per Locus per Gray (× 105) |
Reference |
||||
|
Sl |
W |
Sp |
T |
Total |
|||||
|
1 |
6 + 6 (8-week interval) |
3,612 |
1 |
— |
— |
— |
1 |
0.58a |
Lyon and others (1964) |
|
2 |
6 |
16,735 |
— |
1 |
— |
— |
1 |
0.25 |
Lyon and Morris (1969) |
|
3 |
5 + 5 |
7,168 |
1 |
— |
— |
— |
1 |
0.35a |
Cattanach and Moseley (1974) Cattanach and others (1985) |
|
4 |
3 + 3 |
7,645 |
2 |
— |
— |
— |
2 |
1.09a |
Cattanach and Rasberry (1994) Cattanach and others (1985) |
|
5 |
3 + 3 |
15,849 |
1 |
1 |
1 |
3 |
6 |
0.35b |
Cattanach and Rasberry (1994) Cattanach and others (1985) |
|
6 |
6 |
10,897 |
1 |
— |
— |
— |
1 |
0.38 |
Cattanach and Rasberry (1994) |
|
7 |
6 |
19,285 |
1 |
— |
— |
— |
1 |
0.22 |
Cattanach and Rasberry (1994) |
|
8 |
1 + 9 |
10,318 |
1 |
— |
— |
1 |
2 |
0.24a |
Cattanach and others (1985) |
|
9 |
1 + 9 |
14,980 |
— |
— |
— |
3 |
3 |
0.50a |
Cattanach and others (1985) |
|
Unweighted average: 3.96/9 = 0.44 per locus per gray |
|||||||||
|
NOTE: Experiments were carried out during 1964–1994 in Harwell, England. All rates are normalized to single acute X-irradiation conditions. aNormalized to single unfractionated irradiation conditions under the assumption of additivity of yields. bNormalized to single unfractionated irradiation (by dividing the rate by 3) on the basis of observations of the enhancement of specific locus mutation frequency (in the same experiment by a factor of 3 [3H1 strain of mice]). |
|||||||||
The committee therefore used the following approach to derive the average induced rate of mutations. All experimental data were first grouped by loci, so that an unweighted estimate of the locus-specific induced rates could be derived from the average of the estimates from all experiments involving each of the loci. Subsequently, these locus-specific rates were averaged across loci to arrive at the average induced mutation rate. This procedure permitted calculation of the standard error of the estimated rate that incorporated the sampling variability across loci as well as the variability of the rates in individual experiments. In this approach, unpublished data of Neel and Lewis (1990) were excluded since details of the identity of all the loci and the loci at which mutations were recovered were unavailable. Although fewer data were used (the total number of loci became 34), this approach was considered preferable since (1) no locus is double-counted while averaging over all loci, (2) the loci and the corresponding mutant phenotypes are clear, and (3) an estimate of the standard error of the mean (which takes into account both intra- and interlocus variability) can be given. These data permit an overall average estimate of (1.08 ± 0.30) × 10−5 per locus per gray (Table 4-3C). With a dose-rate reduction factor of 3 traditionally used1 (Russel 1965;
TABLE 4-3C Locus-Specific Rates for Radiation-Induced Mutations in Mice Estimated from Data Tables 4-3A and 4-3B
|
Locusa |
Rate per Gray (× 105) |
SE (× 105) |
|
pa |
0 |
0 |
|
pe |
0 |
0 |
|
G6pd1 |
0 |
0 |
|
G6pd1 |
0 |
0 |
|
Ldh2 |
0 |
0 |
|
Ldr |
0 |
0 |
|
Pgk1 |
0 |
0 |
|
Tpi |
0 |
0 |
|
Hba2 |
0 |
0 |
|
Hbb1 |
0 |
0 |
|
Hbb2 |
0 |
0 |
|
Gapdh |
0 |
0 |
|
Pk |
0 |
0 |
|
Mod1 |
0 |
0 |
|
Sp |
0.04 |
0.04 |
|
W |
0.15 |
0.12 |
|
Gpi |
0.33 |
0.33 |
|
a |
0.45 |
0.24 |
|
T |
0.45 |
0.18 |
|
ln |
0.67 |
0.67 |
|
Ldh1 |
0.97 |
0.69 |
|
se |
0.97 |
0.33 |
|
Sl |
1.31 |
0.51 |
|
bp |
1.34 |
0.95 |
|
Es3 |
1.67 |
1.67 |
|
Hba1 |
1.67 |
1.67 |
|
c |
1.90 |
0.48 |
|
Gr |
2.19 |
1.40 |
|
b |
2.35 |
0.52 |
|
fz |
2.68 |
1.34 |
|
p |
2.93 |
0.56 |
|
d |
3.14 |
0.62 |
|
Pgam |
3.91 |
1.93 |
|
s |
7.59 |
0.89 |
|
Average rate (acute irradiation) |
1.08 |
0.30b |
|
Chronic irradiation |
0.36 |
0.10b |
|
NOTE: For raw data and their analysis, see Sankaranarayanan and Chakraborty (2000a). aIn these calculations, two additional loci (Ldh2 in the experiments of Pretsch and others 1994; Hba2 in the experiments of Peters) have been included based on current evidence (Lewis and Johnson 1986). bThe standard error of the average rate was calculated taking into account variation of the rates among loci as well as sampling variation of the experimental data for each locus. |
||
Searle 1967), the rate for chronic low-LET radiation conditions becomes (0.36 ± 0.10) × 10−5 per locus per gray.
It is worth reiterating here that this is the first time an attempt has been made to use the mutation data coming not only from the 7 specific loci but also from all loci for which there are published data (a total of 34 loci; see Table 4-3C) taking into account interlaboratory and interexperimental variations in induced rates. Unfortunately, all of the data from biochemical loci and for dominant visibles were from experiments involving acute X- or fractionated X-irradiation experiments. In trying to put together all of these data, there was no alternative but to use the correction factors suggested by the authors of the respective papers to estimate the rate for chronic radiation conditions from the available data. The committee feels that the procedures adopted in estimating an induced rate of (0.36 ± 0.10) × 10−5 per gray are sound and that it is justifiable to use a single estimate for the induced rate of mutations.
THE DOUBLING DOSE ESTIMATE
With the estimates of (2.95 ± 0.64) × 10−6 per locus for the rate of origin of spontaneous mutations in humans and (0.36 ± 0.10) × 10−5 per locus per gray for induced mutations in mice, the DD becomes 0.82 ± 0.29 Gy. This new estimate is not very different from 1 Gy that has been used thus far and was based entirely on mouse data. The conceptual basis and the database used for estimating the average spontaneous and induced rates of mutations, however, are now different. The committee suggests retaining the use of 1 Gy for the DD estimate.
MUTATION COMPONENT OF GENETIC DISEASES
Background
As noted earlier, the MC is one of the quantities in the equation used to estimate risk of genetic disease using the doubling dose method (i.e., risk per unit dose = P × [1/DD] × MC, where P = baseline disease prevalence, 1/DD = the relative mutation risk per unit dose, and MC = the mutation component). The rationale for including MC in the risk equation is that the relationship between mutation and disease varies between different classes of genetic diseases—simple for autosomal dominant and X-linked diseases, slightly complex for autosomal recessive diseases, and very complex for multifactorial diseases—and the use of disease class-specific MC makes it possible to predict the impact of an increase in mutation rate on the frequencies of all classes of genetic diseases (Chakraborty and others 1998b; Denniston and others 1998; ICRP 1999).
General Definition
Let P be the disease prevalence before an increase in mutation rate and ΔP its change due to a Δm change in spontaneous mutation rate, m. The mathematical identity
(4-4)
formalizes the definition of MC. In this equation, since ΔP/P is the relative change in disease prevalence and Δm/m is the
relative change in mutation rate, the formal definition of MC becomes
(4-5)
In other words, MC is the relative change in disease prevalence per unit relative change in mutation rate. Because of the paucity of human data, until recently, estimates of Δm/m have been obtained from mouse data and assumed to be applicable to the human situation.
It should be stressed that (1) the MC concept is applicable only when there is a change in mutation rate; (2) MC is not the same as the genetic component of the disease; rather, MC quantifies the responsiveness of the genetic component of the disease to increases in mutation rate; (3) if the disease is only partly genetic, since only the genetic component will respond to an increase in mutation rate, the MC for such a disease will be lower than that for a fully genetic disease; and (4) if the disease is entirely environmental in origin, the MC concept does not apply.
Note that despite the different notations used, Equation (4-4) is the same as the Equation (4-3), the basic risk equation (i.e., risk per unit dose = P × [1/DD] × MC). The latter can be rewritten as risk per unit dose ÷ P = (1/DD) × MC in which risk per unit dose ÷ P = ΔP/P in Equation (4-4) and (1/DD)=Δm/m (since DD = m/Δm). Therefore, if m increases to m(1 + k) the disease incidence increases from P to P(1 + kMC) showing that the MC concept is relevant only in the context of a change in mutation rate.
MC for Autosomal Dominant Diseases
The MC concept and its application are more easily illustrated with respect to autosomal dominant diseases for which the relationship between mutation and disease is straightforward. Two population genetic concepts are used in estimating MC, namely, the Hardy-Weinberg equilibrium and mutation-selection balance. The first of these relates the frequencies of mutant alleles to those of genotypes in large randomly mating populations, and the second describes the dynamics of mutant genes in populations.
Hardy-Weinberg Equilibrium
For a single locus with two alleles, the Hardy-Weinberg equilibrium concept is an application of the binomial expansion (p + q)2 = p2 + 2pq + q2, where p and q are the proportions of alleles A and a (and p + q = 1), and = p2, 2pq, and q2 are the proportions of the three genotypes AA, Aa, and aa. If the parents mate at random, which is equivalent to combining genes at random from a large pool to which each parent has contributed equally, the zygotes are in Hardy-Weinberg proportions. The larger the population, the closer the numbers agree with these binomial expectations. The Hardy-Weinberg concept thus summarizes the basic characteristic of stability of allele frequencies (and therefore of genotype frequencies) over time in large, randomly breeding populations in the absence of differences in viability or fertility among the genotypes, migration, mutation, and geographical subdivision of the population. In the case of genetic diseases, this is reflected as their stable prevalences in the population. With more than two alleles, the extension is straightforward: the binomial expansion becomes multinomial (Crow 2001).
Mutation-Selection Balance
Spontaneous mutations arise in each generation at a finite rate, and most are eliminated sooner or later by natural selection. At equilibrium, the rate of origin of new alleles by spontaneous mutation will be equal to the rate at which they are eliminated by selection and is called the mutation-selection equilibrium. The equilibrium frequency of the mutant allele depends on whether that allele is recessive or dominant.
Consider a one-locus, two-allele situation in a large, randomly mating population in Hardy-Weinberg equilibrium and assume that the fitness of the three genotypes (AA, Aa, and aa) can be represented by 1 − s, 1 − s and 1, respectively. The zygotic frequencies, counted before selection, will be p2, 2pq, and q2, respectively, for the three genotypes, where p denotes the frequency of the dominant allele A, and q =1 − p, that of the normal allele a. In a stable gene pool, with the allele a mutating to A at a rate of m per generation, ignoring back mutations, there will be an mq amount of new disease-causing mutant alleles per generation; this will be counterbalanced by an elimination of these alleles by selection, which amounts to pqs + p2s. At equilibrium, these two quantities should be equal, yielding an equilibrium allele frequency of A (e.g., ![]() ) that satisfies the equation
) that satisfies the equation
(4-6)
or
(4-7)
because the mutation rate (m) is generally smaller than the selection coefficient (s). At low mutant allele frequencies, the frequency of dominant diseases at equilibrium is then predicted to be ![]() . For example, if for an autosomal dominant disease the spontaneous mutation rate is m =1 × 10⁻⁵ and the selection coefficient s = 0.5, the equilibrium frequency of the mutant allele p ≈ m/s ≈ 2 × 10⁻⁵ and the disease frequency 2p ≈ 4 × 10⁻⁵ (since q is very nearly 1).
. For example, if for an autosomal dominant disease the spontaneous mutation rate is m =1 × 10⁻⁵ and the selection coefficient s = 0.5, the equilibrium frequency of the mutant allele p ≈ m/s ≈ 2 × 10⁻⁵ and the disease frequency 2p ≈ 4 × 10⁻⁵ (since q is very nearly 1).
Estimation of MC
In estimating MC for autosomal dominant diseases, it is important to take into account the fact that some of these diseases (e.g., Apert’s syndrome, Crouzon’s syndrome, osteogenesis imperfecta) are due entirely to germline mutations, whereas with some other diseases (e.g., retinoblastoma, and breast cancers), only a proportion is due to germline mutations, the remainder being due to somatic mutations. As discussed later, for diseases of the latter type (referred to as those with a “sporadic” component), the predicted MCs will be less than those for the former in view of the fact that MC is related to the germline genetic component. In what follows, only the most relevant equations are given for MC estimations for two scenarios of radiation exposure, namely, exposure in one generation only or in every generation with and without the sporadic components. For details of the derivations of the equations, see the International Commission on Radiological Protection (ICRP 1999) Task Group report and Chakraborty and colleagues (1998b).
The starting assumption in these computations is that the population is in mutation-selection equilibrium prior to radiation exposure. When the population sustains radiation exposure, the mutation rate is increased, which in turn will impact disease frequency. As shown below, if the exposure occurs in one generation only, MC and ΔP are maximal in the first postradiation generation, progressively diminishing in subsequent generations until the population returns to the old equilibrium. When this occurs, MC becomes zero.
If, on the other hand, the population is exposed to radiation generation after generation (i.e., the mutation rate is permanently changed from m to [m + Δm]), the MC and ΔP will continue increase with time (in generations) until the population reaches a new equilibrium between mutation and selection. At equilibrium, MC = 1 if the disease is entirely due to germinal mutations. Note that MC = 1 signifies that if the mutation rate is increased by x%, the disease frequency at the new equilibrium (under conditions of radiation in every generation) will be increased by x%. The magnitude of the increase in MC and the increase in disease frequency in intermediate generations will depend on Δm and the number of generations following radiation exposure.
MC Estimation for a Hypothetical Autosomal Dominant Disease Having No Sporadic Component in Its Etiology
For a one-time increase in mutation rate (“burst,” indicated by the subscript b in MCb below), the dynamics of change in MC with time, t, at any generation is given by
(4-8)
For example, if one assumes that s = 0.5, then MCb at the first postradiation generation becomes 0.5 (1 − 0.5)0 = 0.5. For a permanent increase in mutation rate (indicated by the subscript p), the equation is
(4-9)
Again assuming that s = 0.5, the MCp at the first postradiation generation becomes [1 − (1 − 0.5)1]=0.5. Equations (4-8) and (4-9) thus show an interesting property of the effects on MC of a one-time or permanent increase in mutation rate in the first generation, namely, MCb =MCp. With no irradiation in subsequent generations, MC gradually decays to zero at a rate of (1 − s) per generation, whereas under conditions of permanent increase in mutation rate, MC gradually increases in subsequent generations to attain a value of 1 at the new equilibrium.
The patterns of changes in MC and disease frequency with time, following a one-time or a permanent increase in mutation rate, are shown in Figure 4-1 and Table 4-4. In these illustrations, it is assumed that the mutation rate is increased from 1 × 10⁻⁵ to 2 × 10⁻⁵, either in one generation only (broken line) or in every generation (solid line), and that the initial disease frequency (which corresponds to the baseline mutation rate of 1 × 10⁻⁵ and a selection coefficient of 0.5) is 4 × 10⁻⁵.
It is clear that following a single-generation doubling of the mutation rate, both the disease frequency and MC show a transitory increase in the first postradiation generation. In subsequent generations, the disease frequency progressively declines to the old equilibrium value and MC declines to zero. With a permanent doubling of the mutation rate, for the selection coefficient of 0.5 used in these calculations, the disease frequency becomes twice that at the old equilibrium value by about the fifth postradiation generation by which time the mutation component becomes nearly 1.0.
MC Estimation for a Hypothetical Autosomal Dominant Disease with a Sporadic Component in Its Etiology
As mentioned earlier, some autosomal dominant diseases have a sporadic component in their etiology. For example, about 40% of retinoblastoma cases are due to germline mutations and the remaining ones are sporadic (Vogel 1979). For such diseases, the disease frequency at equilibrium can be assumed to take the form P = A + Bm. With A (sporadic component) and B (germinal component) as constants, only the second term will be responsive to an increase in mutation rate. If the dose dependence of induced mutations is linear, namely, m = α + βD and this form of m is substituted for P in the above equation,
(4-10)
so the relative increase in disease frequency ΔP/P = βBD/(A + Bα) and the relative increase in mutation rate Δm/m = BD/α. Consequently,
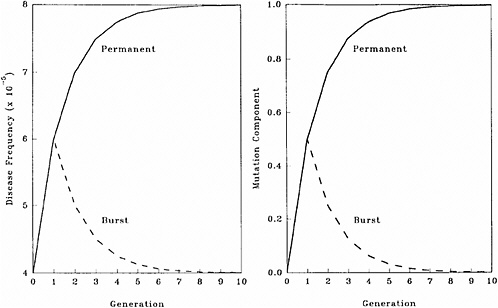
FIGURE 4-1 Changes in disease frequency (y-axis, left panel) and mutation component (y-axis, right panel) following a one-time (broken line) or a permanent (solid line) increase in mutation rate from 1 × 10⁻⁵ to 2 × 10⁻⁵ for an autosomal dominant disease. The disease frequency, before the doubling of the mutation rate, is 4 × 10⁻⁵ and the selection coefficient is 0.5. SOURCE: Figure reproduced with permission from Chakraborty and others (1998b).
(4-11)
It is clear that the larger the sporadic component, the smaller is the MC. When A =0 and B = 1, as they are for most autosomal dominant diseases, MC at equilibrium will be 1. For diseases with a sporadic component in their etiology, MC at equilibrium will be less than 1 (i.e., an x% increase in mutation rate will result in a <x% increase in disease frequency).
MC Estimation for X-Linked and Autosomal Recessive Diseases
The mathematical procedures for estimating MC for X-linked and autosomal recessive diseases are more complex than those for autosomal dominant diseases and are detailed in Chakraborty and colleagues (1998b). The relevant conclusions are the following:
For a one-time increase in mutation rate the response of X-linked diseases is similar to that of autosomal dominants (i.e., MC in the first postradiation generation is equal to the selection coefficient, s). However, since only one-third of the X chromosomes are in males, s must be adjusted to take this into account. In other words, in Equation (4-7), s should be replaced by s/3. For example, if s = 0.6, the first-generation MC will be 0.2. For autosomal recessives, MC will be much smaller than for autosomal dominants, and it is close to zero in the first (as well as several successive) generations. This is due to the fact that when a recessive mutation first occurs (or is induced), it is present in heterozygotes and does not precipitate disease until the mutant allele frequency becomes sufficiently high in the population to produce homozygous individuals who will be affected by the disease.
For a permanent increase in mutation rate, the MC for both X-linked and autosomal recessive diseases progressively increases to reach a value of 1.0 at the new equilibrium. The rates of approach to the new equilibrium, however, are different and are dictated by selection coefficients and time (in generations) following radiation exposure. The effect of an increase in mutation rate on MC is most pronounced for autosomal dominants followed by that for X-linked and autosomal recessives, in that order.
Numerical Estimates of MC for Autosomal Dominant, X-Linked, and Autosomal Recessive Diseases Used in This Report
In Table 4-2, estimates of selection coefficients from published data for different autosomal dominant diseases are
TABLE 4-4 Effects of a One-Time or Permanent Doubling of the Mutation Rate on Mutant Gene Frequency (p), Disease Frequency (P), and Mutation Component (MC) for a Hypothetical Autosomal Dominant Disease
|
General formulas for calculating the effects of an increase in mutation rate from m to m(1 + k) on mutant gene frequency, disease frequency, and mutation component follow. |
||
|
At Generation t |
For a Permanent Increase |
For a One-Time Increase |
|
Mutant gene frequency, pt |
p0{1 + k [1 − (1 − s)t]} |
p0[1 + ks (1 − s)t−1] |
|
Disease frequency, Pt |
2pt |
2pt |
|
Mutation component, MC |
[1 − (1 − s)t ] |
s(1 − s)t−1 |
presented. The average of these values is s = 0.29. Similar estimates for X-linked diseases are not available. For estimating the risk to first-generation progeny, the committee uses a rounded value of MC = s = 0.3 for both autosomal dominant and X-linked diseases. The rationale for which rests on the following considerations: (1) the baseline incidence of X-linked diseases is an order of magnitude lower than that of autosomal dominant diseases (0.15% versus 1.5%; Table 4-1), (2) the net effect of selection for X-linked diseases is lower (i.e., s/3 versus s for autosomal dominants), and (3) the use of the same MC value for both autosomal dominant and X-linked diseases therefore does not underestimate risk. The committee is cognizant of the fact that selection intensities in present-day human populations are probably lower. For autosomal recessives, the first-generation MC is close to zero.
MC ESTIMATION FOR CHRONIC MULTIFACTORIAL DISEASE
Introduction
As mentioned earlier, for most multifactorial diseases, knowledge of the number of genes involved, the types of mutational alterations, and the nature of environmental factors remains limited, and there is no simple relationship between mutation and disease. Further, unlike the situation for Mendelian diseases, no models have been proposed to explain the stable prevalences of multifactorial diseases in the population. Models such as the multifactorial threshold model of disease liability (see Annex 4B) are essentially descriptive models. They permit one to explain the transmission patterns of these diseases and make reasonable predictions of recurrence risks in families, but they are not, as such, suitable for the estimation of MC. There is, however, a wealth of literature about evolutionary population genetic models on the maintenance of quantitative variability (and traits) in populations, and these incorporate mechanisms (reviewed by Sankaranarayanan and others 1994). Although there are differences in detail between them and the applicability of these models to multifactorial diseases, all of them are based on equilibrium theory (i.e., they invoke mutation and selection as opposing forces in the evolution and maintenance of variability for these traits). They are therefore similar to the models used to explain the dynamics of single mutant genes underlying Mendelian diseases in populations.
As a first approach to the problem of estimating MC for multifactorial diseases, an ICRP (1999) Task Group developed a “hybrid” model in which some concepts of the MTM and models for the evolution of quantitative traits in populations were incorporated. This “hybrid model” is henceforth referred to as the finite-locus threshold model (FLTM; ICRP 1999; see also Denniston and others 1998). The original aim was to use FLTM to estimate MC for both congenital abnor-
malities and chronic diseases. However, as discussed later, advances in human molecular biology and radiation genetics during the past few years suggest that it is not biologically meaningful to use the FLTM to estimate MC for congenital abnormalities, and therefore its use is limited to chronic diseases.
Finite-Locus Threshold Model
Rationale
As mentioned above, the FLTM uses the concepts of liability and threshold of the MTM (appropriately redefined for a finite number of loci) and that of mutation-selection equilibrium from evolutionary population genetic models on the maintenance of variability of quantitative traits. The choice of a finite number of loci rests on three main considerations: (1) although precise knowledge of the genetic basis is not yet available for most chronic diseases, for well-studied ones such as coronary heart disease, it is now clear that the number of underlying genes is probably small, and their mutant alleles have small to moderate effects; (2) estimates of the heritability of liability (h2), a statistic that provides a measure of the relative contribution of genetic factors to the overall phenotypic variability for various chronic diseases, have been published in the literature; and (3) unlike the MTM, the FLTM permits quantitative analysis of the joint effects of mutation and selection. As emphasized in BEIR V (NRC 1990), the heritability of liability mentioned above should not be confused with heritability of the trait, which is very different (and much smaller than heritability of liability). This distinction is important since MC is related more to the heritability of liability than to the heritability of trait (see NRC 1990, Table 2-3, footnote c, for a mathematical formulation of the approximate relationship between heritability of liability and heritability of trait).
Assumptions and Predictions of the FLTM
Details of the assumptions and predictions of the FLTM are discussed in the report of the ICRP (1999) Task Group and by Denniston and colleagues (1998) and are summarized briefly in Annex 4C. In general terms, the FLTM assumes that the liability underlying a chronic disease, which is made up of both genetic and environmental factors, is a continuous variable and that the environmental contribution has a normal (Gaussian) distribution. Although the standard MTM assumes numerous (essentially an infinite number of) genetic factors (i.e., mutant alleles), the FLTM assumes that the genetic component of liability is discrete (i.e., it comes from mutant alleles of a finite number of gene loci). The latter is also true of the threshold. The FLTM incorporates mutation and selection (s) coefficients as additional parameters (the MTM does not include these). The effects of specified increases in mutation rate are evaluated in terms of changes in h2 and MC.
Effects at Equilibrium Following a Permanent Increase in Mutation Rate
The predicted effects discussed below (and shown in Figure 4-2) are for the five-locus model when the spontaneous mutation rate per gene per generation (assumed to be 10−6) is increased permanently to 1.15 × 10⁻⁶ (i.e., a 15% increase) as a result of radiation exposures in every generation. The selection coefficients (s values) used were 0.2 to 0.8. The data points shown in Figure 4-2 are from different computer runs using different combinations of parameter values (selection coefficients, threshold, and environmental standard deviation). As can be seen, for h2 values greater than about 0.1, MC > 0.8 at equilibrium, and for h2 > 0.4, MC is essentially equal to 1.0. In other words, a 15% increase in mutation rate will result in a 15% increase in disease frequency at the new equilibrium.
Although the estimates discussed above are for the five-locus model (n = 5), these conclusions remain qualitatively unaltered for n = 3, 4, and 6, which were also examined (data not shown).
Effects in Early Postradiation Generations Under Conditions of a Permanent Increase in Mutation Rate
The effects expected in early postradiation generations (i.e., generations 1, 5, and 10) under the same radiation conditions as above are diagrammed in Figure 4-3. By noting the difference in the y-axis scales (compared to Figure 4-2), it is evident that the MC in early generations is very small, often being much less than 2% for the conditions specified for the model.
Comparison of the Effects at Equilibrium with Those in Early Generations Under Conditions of a Permanent Increase in Mutation Rate
Figure 4-4 compares the h2 versus MC relationship at equilibrium with that at generation 10 (shaded areas in the figure are the ones of interest in MC estimation for chronic diseases). The conclusions from Figure 4-2 and Figure 4-3 are reinforced (i.e., over a broad range of h2 values from about 0.3 to 0.8, for the specified increase in mutation rate the MC at equilibrium is close to 1.0, whereas over the same h2 range and the same increase in mutation rate, even after 10 postradiation generations the corresponding MCs are very small).
Effects on MC After an Increase in Mutation Rate in One Generation Only
The numerical algorithms used for the calculations above have also been used to examine the effects of a one-time increase in mutation rate (i.e., the mutation rate was increased by 15% for one generation and then brought back to
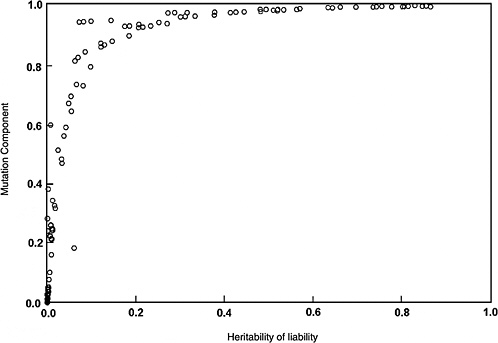
FIGURE 4-2 Relationship between heritability of liability (h2) (x-axis) and mutation component (MC) (y-axis) at the new equilibrium between mutation and selection under conditions of radiation exposure in every generation. Results are for the five-locus FLTM when the assumed baseline mutation rate of 10−6 per gene is increased to 1.15 × 10⁻⁶ (i.e., by 15%). Note that for h2 estimates >30%, MC = 1.
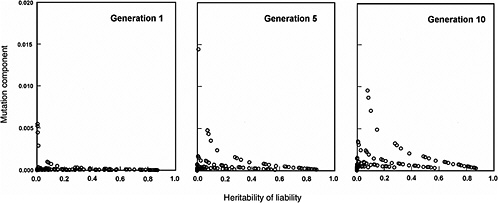
FIGURE 4-3 Relationship between heritability of liability (h2) and mutation component for the first, fifth, and tenth postradiation generations, under the same conditions as specified in Figure 4-2. Note that the scale of the y-axis differs from Figure 4-2. MC values are very small, being <0.02 over a broad range of h2.
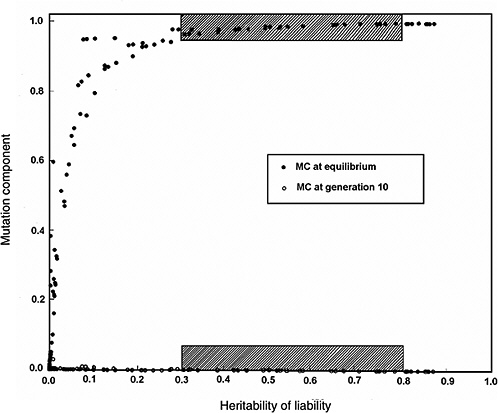
FIGURE 4-4 Comparison of the relationship between heritability of liability and mutation component for the tenth postradiation generation with that at the new equilibrium, under the same conditions as those specified for Figure 4-2. The shaded areas of h2 (range: 0.3–0.8) are those of interest in the context of chronic diseases. Note that in this range, the MC at generation 10 is very small, whereas at the new equilibrium, it is equal to 1.
the original value for all subsequent generations). As expected, the first-generation MC is the same (i.e., very small) as that shown in Figure 4-3, and this is followed by a gradual decline back to zero in subsequent generations (data not shown).
Effects of Gene Interactions (Epistasis) and Sporadics
The effects of gene-gene interactions on quantitative phenotypes at risk of complex diseases are varied and do not lend themselves readily to modeling. However, when some assumptions about these interactions were incorporated in the FLTM, it was found that the results (at the new equilibrium as well as for the early postradiation generations) were basically the same as those under conditions of no interactions (data not shown but discussed in Denniston and others 1998; ICRP 1999).
In all of the model predictions discussed thus far, the possibility that some individuals may be affected by the disease for reasons unrelated to their genotypes (sporadic cases) was not considered. When these were taken into account, as expected the magnitude of MC was lower, both at the new equilibrium and in the early generations. The factor by which the numerical estimates of MC will change can be estimated to be [1 − (a/PT)], where (a/PT) represents the proportion of sporadic cases among the total number of affected individuals (a = number of sporadic cases; PT = total number of cases).
General Conclusions
The most important conclusion from computer simulation studies is that when the population is exposed to small doses of radiation in every generation, the MC for chronic diseases is very small, being of the order of 1 to 2% in the first several postradiation generations including the first. Since one of the assumptions of the model is the simultaneous increase in mutation rate of all of the genes underlying a given chronic disease, which is unlikely to occur at low radiation doses, the effective MC in the early generations is likely to be much less than 1–2%. One would therefore predict that the expected increases in the frequency of chronic diseases (relative to the baseline frequency) will be even smaller in the first few postradiation generations.
A second conclusion, again under conditions of a permanent increase in mutation rate, is that at the new equilibrium between mutation and selection (which will be achieved several tens—if not hundreds—of generations later, depending on the amount of increase in mutation rate and selection coefficients), the MC will become 1.0. In other words, for a sustained increase of x% in mutation rate, there will be an x% increase in the frequency of chronic diseases at the new equilibrium. This conclusion holds for several different combinations of assumed parameter values (selection coefficients, thresholds, numbers of loci, environmental variances, interactions among genes) and consequently can be considered robust.
Finally, if the population sustains radiation exposure in one generation only, the increase in MC will be transient and small, followed by a progressive decline to zero. The result will be a transient small increase in disease frequency followed by a decline toward the baseline frequency in subsequent generations.
This committee uses the 2% value in its calculations as the best MC estimate for the first postradiation generation, which was also the case for the ICRP (1999) Task Group and UNSCEAR (2001).
Bridging the Gap Between Rates of Radiation-Induced Mutations in Mice and Risk of Inducible Genetic Diseases in Humans
Introduction
Mouse data on rates of induced mutations (incorporated in the DD estimate) provide the basis for genetic risk prediction in humans. In predicting the risk as a product of P, 1/DD, and MC (i.e., Equation (4-3) noted in the section on mutation component), an important assumption is implicit: mutations will be induced in those genes at which spontaneous mutations in humans cause disease (i.e., the quantity P), the average rate of induced mutations in mice is applicable to induced human germline mutations, and such induced mutations will be compatible with viability and hence recoverable in the offspring of irradiated individuals. However, thus far, no radiation-induced genetic diseases have been found in the offspring of those who have sustained radiation exposures (e.g., Byrne and others 1998; Meistrich and Byrne 2002; MGSC 2002).
Advances in human molecular genetics and radiation genetics during the last decade support the view that there are several fundamental differences (in mechanisms, nature, etc.) between spontaneous mutations that cause disease and radiation-induced mutations studied in experimental systems such as the mouse. More specifically, they suggest that a major proportion of human genes of relevance from the disease point of view may not yield “recoverable” induced mutations. Stated differently, the rate at which induced disease-causing mutations are seen in human live births following parental radiation exposures may be much lower than that of induced mutations in mice.
Concept of Potential Recoverability Correction Factor and Revision of the Risk Equation
Since there is no alternative to the use of mouse data on radiation-induced mutations for risk predictions in humans, methods have to be devised to bridge the gap between induced mutation rates in mice and the risk of genetic disease in humans. One such method has been developed recently and is based on the incorporation of a correction factor, termed the potential recoverability correction factor (PRCF), in the risk equation (Sankaranarayanan and Chakraborty 2000a). As a consequence, the risk now becomes a product of four quantities instead of the original three:
(4-12)
where P, 1/DD, and MC are as defined earlier and PRCF is the disease-class-specific potential recoverability correction factor. Since PRCF is less than one, the estimate of predicted risk will be smaller when PRCF is incorporated than when it is not.
The differences between spontaneous disease-causing mutations in humans and radiation-induced mutations studied in experimental systems, which constitute the basis for the development of the PRCF concept, are discussed in detail by Sankaranarayanan (1999) and Sankaranarayanan and Chakraborty (2000b) and summarized in Annex 4D.
To assess PRCF, it was necessary first to define criteria on the basis of information available from molecular studies of radiation-induced mutations, to apply these to human genes of interest on a gene-by-gene basis, and to examine which among them can be considered candidates for potentially recoverable induced mutations. The operative words are the italicized ones, since there is as yet no evidence for a radiation-induced germ cell mutation in humans, our understanding of the structural and functional genomics of the genome is incomplete, and the criteria will undoubtedly change with advances in knowledge.
Among the attributes considered in defining the criteria are gene size, location, normal function, known mutational mechanisms, spectrum of spontaneous mutations, “gene-richness” or “gene-poorness” of the region, whether intragenic (including whole-gene) deletions and multigene deletions are known, and whether disruption of the gene or genomic region by rearrangements is associated with a mutant phenotype. Under the assumption that a deletion is induced in a genomic region containing the gene of interest, the question asked was, Given the structural and functional attributes of the gene or genomic region, can this deletion be considered potentially recoverable?
The criteria developed and how the genes examined are assigned to one of three groups—namely, unlikely to be recovered (group 1), recoverability uncertain (group 2), and potentially recoverable (group 3)—summarized in Annex 4D. Since the starting assumption is that the genomic region containing the gene of interest has sustained a multigene deletion, the assessments only tell us which disease-causing mutations, if induced, may be recovered in live births within the framework of the criteria used; they do not shed light on the absolute radiation risk of a given genetic disease. Also worth mentioning here is that assignment to group 1 (unlikely to be recovered) is somewhat less subjective, and therefore more reliable, than that to the other two groups. This aspect is taken into account in defining PRCF (i.e., by lumping groups 2 and 3 and considering that the mutations in the genes included may be potentially recoverable).
In general terms, if one analyzes a total of N genes and if n among them can be excluded as unlikely to be recovered, the remainder, made up of the other two groups, constitutes (N − n) and the fraction (N − n)/N provides a crude measure of genes at which induced mutations may be recoverable. This fraction is referred to as the unweighted PRCF.
The PRCF as estimated above, however, does not take into account differences in the prevalence of diseases assigned to different groups. For example, if a disease with a high prevalence is assigned to group 1, societal concern about radiation effects will be far less than when it is assigned to the other two groups. Consequently, some weighting for disease prevalence is required.
If P is the total prevalence of diseases due to mutations in N genes and p is the prevalence of (N − n) genes (in groups 2 + 3), then the weighted PRCF becomes [p(N – n)/(PN)]. For the purpose of risk estimation however, it is preferable to use a range provided by the unweighted and weighted PRCF estimates to avoid the impression of undue precision.
PRCF Estimates for Autosomal Dominant and X-Linked Diseases
A total of 67 genes involved in autosomal dominant (59) or X-linked (8) recessive diseases was included in the analysis. The results, given in Table 4-5, show that the unweighted and weighted PRCFs for autosomal dominants are 0.29 and 0.16, respectively; when X-linked diseases are included, the corresponding values become 0.36 and 0.20. Since the overall estimated prevalence of autosomal dominants is an order of magnitude higher than that of X-linked diseases (i.e., 1.5% versus 0.15%), the use of the range of (rounded) PRCF values of 0.15 to 0.30 (encompassing the prevalence-weighted and unweighted estimates) for autosomal dominant and X-linked diseases seems reasonable.
PRCFs for Autosomal Recessive Diseases
The recoverability of induced recessive mutations is also subject to constraints imposed by the structure, function, and genomic contexts of the underlying genes. However, since induced recessive mutations are first present in the heterozygous condition (and 50% of the gene product is sufficient for normal functioning), one can assume that even large deletions may be recoverable in heterozygotes (unless the induced deletion encompasses neighboring essential structural genes, resulting in inviability of heterozygotes). Additionally, induced recessive mutations, at least in the first several generations, do not result in recessive diseases, and as discussed earlier, the MC for recessive diseases is close to zero
TABLE 4-5 Assessment of Potential Recoverability of Radiation-Induced Mutations in Autosomal Dominant and X-Linked Diseases and Calculation of PRCFs
|
Group |
No. of Genes |
Unweighted PRCFa |
Prevalence (×104) |
Weighted PRCFb |
|
Autosomal dominants |
||||
|
1 (unlikely to be recovered) |
42 |
— |
46.5 |
— |
|
2 + 3 (uncertain + potentially recoverable) |
17 |
0.29 |
55.9 |
0.16 |
|
Subtotal |
59 |
102.4 |
|
|
|
Autosomal dominants + X-linked |
||||
|
1 (unlikely to be recovered) |
43 |
— |
49.0 |
— |
|
2 + 3 (uncertain + potentially recoverable) |
24 |
0.36 |
60.9 |
0.20 |
|
Total |
67 |
109.9 |
|
|
|
aUnweighted PRCF, autosomal dominants: 17/59 = 0.29; autosomal dominants + X-linked: 24/67 = 0.36. bWeighted PRCF, autosomal dominants: (55.9 × 17)/(102.4 × 59) = 0.16; autosomal dominants + X-linked: (60.9 × 24)/(109.9 × 67) = 0.20. |
||||
in the first few generations. In view of all these factors, it does not seem necessary to estimate PRCF for this class of diseases.
PRCFs for Chronic Diseases
In the FLTM used to estimate MC for chronic diseases, it is assumed that (1) the genetic component of liability is due to mutations in a finite number of gene loci, (2) the affected individuals are those whose genetic component of liability exceeds a certain threshold, and (3) radiation exposure can cause a simultaneous increase in mutation rate in all of the underlying genes, which in turn causes the liability to exceed the threshold. Consequently, the requirement for potential recoverability also applies to induced mutations in the underlying genes. A crude approximation of potential recoverability for each chronic disease is the xth power of that for mutation at a single locus, where x is the number of gene loci, assumed to be independent of each other. Since the PRCF for autosomal dominant and X-linked mutations has been estimated to be in the range from 0.15 to 0.30, for chronic diseases, these figures become (0.15)x to (0.30)x. With the assumption of just two loci as a minimum, the PRCF estimate becomes 0.02 to 0.09, and with more loci, it will be much smaller. Intuitively, these conclusions are not unexpected given that one is estimating the simultaneous recoverability of induced mutations in two or more independent genes.
PRCFs for Congenital Abnormalities
Currently available data do not permit the estimation of PRCFs for congenital abnormalities. However, as discussed later, this does not pose any serious problem since at least a provisional estimate of risk for this class of diseases can now be made without recourse to the DD method.
Strengths and Weaknesses of the Use of PRCF Estimates
Development of the PRCF concept represents an example of how advances in human molecular biology and radiation genetics can be integrated for the purpose of genetic risk assessment. In principle, three ways of incorporating PRCFs into the risk equation (i.e., Equation (4-3)) can be envisaged: (1) suitably increase the DD (i.e., reduce the induced rate of mutations so that DD becomes higher and 1/DD becomes a smaller fraction); (2) decrease the MCs for the different classes of genetic disease; and (3) introduce disease class-specific PRCFs as an independent quantity into the risk equation. Of these, the last possibility has been preferred for two reasons. First, the original definition of the DD (a ratio of spontaneous and induced rates of mutations in a set of defined genes) and of MC (a quantity that predicts the relative increase in disease incidence per unit relative increase in mutation rate, both compared to the baseline) can be retained without modifications. Second, with further advances in structural and functional genomics of the human genome and in the molecular analysis of radiation-induced mutations, there is the real prospect of defining PRCFs with greater precision.
In developing the PRCF concept, it has been assumed that the recoverability of an induced deletion is governed more by whether a given genomic region can tolerate large changes and yet be compatible with viability than by genomic organization per se. Considerable amounts of data exist that strongly support the view that in the case of deletion-associated naturally occurring Mendelian diseases, the deletions do not occur at random (i.e., there are specificities of breakpoints dictated by the nucleotide sequence organization (reviewed in Sankaranarayanan 1999). A priori, therefore, one would not expect that radiation would be able to reproduce such specificities that nature has perfected over millennia, at least not in all genomic regions. Should this be the case, even the weighted PRCFs would be overestimates. However, until newer methods are developed to bridge the gap between induced mutation rates in mice and the risk of genetic diseases in humans, the PRCF range of 0.15 to 0.30 for autosomal dominant and X-linked diseases represents the best estimate that can be made at present.
The PRCF estimate range of 0.02 to 0.09 (i.e., [0.15]2 to [0.30]2) for chronic diseases merits some comment since (1) it is based on the PRCFs for single-gene mutations and (2) it assumes just two loci (the minimum number required to call the disease multifactorial) underlying a chronic disease sustaining induced mutations simultaneously. On the first point, it is obvious that if the PRCFs for single-gene mutations change, the PRCFs for chronic diseases will also change. Secondly, the data on well-studied chronic diseases such as coronary heart disease (CHD), essential hypertension, and diabetes mellitus suggest that more than two loci may be involved. The implication is that the PRCFs for chronic diseases are likely to be smaller than cited above. For example, if there are three loci, the range becomes 0.003 to 0.03, with four loci, 0.0005 to 0.008, and so on. All this means is that the PRCF values for chronic diseases may turn out to be lower than 0.02 to 0.09.
The committee uses the PRCF ranges 0.15–0.30 for autosomal dominants and X-linked diseases and 0.02–0.09 for chronic diseases, as did UNSCEAR (2001).
Potential “Disease Phenotypes” of Radiation-Induced Genetic Damage in Humans
Introduction
For historical reasons, over the past four decades or so, the focus in the assessment of adverse genetic effects of radiation has been on the risk of inducible genetic diseases. The rationale for this rested on the premise that if spontaneous mutations can cause specific genetic diseases, so can
radiation-induced mutations. This rationale gained support from experimental studies demonstrating that radiation-induced mutations in specific marker genes could be recovered in a number of biological systems, including the mouse. Consequently, efforts at risk estimation proceeded to use the mouse data on rates of induced recessive specific locus mutations as a basis for estimating the risk of genetic diseases due to mutations in single genes and assumed that the mouse rates can be used for this purpose.
Now, one can approach the question of adverse genetic effects of radiation from the perspective provided by our current understanding of the mechanism of radiation action, the molecular nature of radiation-induced mutations, increasing knowledge of human genetic diseases, and the mechanisms of their origin. One important outcome of this approach, discussed in the preceding section, is that it is now possible to conclude that the risk of single-gene diseases is probably much smaller than expected from the rates of induced mutations in mice. A second important outcome is the concept discussed in the present section, namely, that the adverse effects of gonadal irradiation in humans are more likely to be manifest as multisystem developmental abnormalities than as single-gene diseases.
Multisystem Developmental Abnormalities May Constitute the Major “Phenotypes” of Radiation-Induced Genetic Damage
The argument and findings that provide the basis for the above concept come from studies of the mechanism of induction of genetic damage by radiation, the nature of radiation-induced mutations, and the common phenotypic features of naturally occurring multigene deletions in humans. Some of these are discussed in the preceding section, and these studies and others are briefly considered below (see Sankaranarayanan 1999 for a detailed review).
Ionizing radiation produces genetic damage by random deposition of energy; the predominant type of radiation-induced genetic change is a DNA deletion, often encompassing more than one gene.
The whole genome is the target for radiation action, and deletions (and other gross changes) can be induced in any genomic region; however, since the recoverability of an induced deletion in a live birth is subject to structural and functional constraints, only a subset of these deletions that is compatible with viability may be recovered. Further, not all the recoverable deletions may have phenotypes that are recognizable from knowledge gained from naturally occurring genetic diseases.
Studies of naturally occurring human microdeletion syndromes, also termed “contiguous gene deletion syndromes” (Schmickel 1986) or segmental aneusomy2 syndromes (Budarf and Emanuel 1997), are instructive in the context of delineating phenotypes of multigene deletions. These syndromes result from deletions of multiple, functionally unrelated, yet physically contiguous genes that are compatible with viability in the heterozygous condition. Many have been reported in the human genetics literature, and they have been found in nearly all human chromosomes, but their distribution in different chromosomal regions seems to be nonrandom. This is not unexpected in the light of differences in gene density in different chromosomes and chromosomal regions. However, despite their occurrence in different chromosomes, the common features of the phenotypes of many of these deletions include mental deficiency, a specific pattern of dysmorphic features, serious malformations, and growth retardation (Schinzel 1988; Epstein 1995; Brewer and others 1998).
In considering all of these together, the concept was put forth that multisystem developmental abnormalities are likely to be among the principal phenotypes of deletions and other gross changes induced in different parts of the human genome. Because the underlying genetic change is a deletion, generally one would expect that these phenotypes would show autosomal dominant patterns of inheritance.
Experimental Data in Support of the Concept
Mouse data supporting the above concept come from studies on radiation-induced skeletal abnormalities (Ehling 1965, 1966; Selby and Selby 1977, 1978), cataracts (Kratochvilova and Ehling 1979; Ehling 1985; Favor 1989), congenital abnormalities ascertained in utero (Kirk and Lyon 1982, 1984; Nomura 1982, 1988, 1989, 1994; Lyon and Renshaw 1984; Rutledge and others 1986) and growth retardation (Searle and Beechey 1986; Cattanach and others 1993, 1996). The cases analyzed (e.g., skeletal abnormalities, growth retardation) show that the underlying induced genetic changes are multigene deletions. It is worth mentioning here that the data on skeletal and cataract mutations were used earlier by both UNSCEAR and the BEIR committees to provide alternative estimates of the risk of dominant effects using what was referred to as the direct method. This method was not used by UNSCEAR (2001) or by the BEIR V committee (NRC 1990). The basic data from these studies, however, have now been used by UNSCEAR (2001) to obtain a provisional estimate of the risk of developmental defects without recourse to the DD method. This aspect is considered in the section on risk estimation.
There is no conceptual contradiction between naturally occurring and radiation-induced developmental abnormalities. As discussed earlier, naturally occurring human congenital abnormalities are classified as a subgroup of multifactorial diseases, whereas radiation-induced ones generally are predicted to show autosomal dominant patterns of inheritance. It may therefore seem that there is a conceptual contradiction. In reality, this contradiction is only apparent when
one considers the fact that the primary reasons for considering naturally occurring developmental abnormalities as multifactorial are their etiological heterogeneity (as a consequence of which their transmission patterns are inconsistent with Mendelian patterns of inheritance), the lack of knowledge of the genetic factors involved, and the nature of environmental factors. The concept that is emerging is that human developmental abnormalities may be treated as inborn errors in development or morphogenesis in obvious analogy with, and as an extension of, the classical concept of inborn errors of metabolism (Epstein 1995). Therefore, diverse dysmorphogenetic causes (including those “driven” by multigene deletions) can produce similar malformations.
OTHER POTENTIALLY RELEVANT DATA
Induction of Mutations at Expanded Simple Tandem Repeat Loci in the Mouse and Minisatellite Loci in Human Germ Cells
Introduction
Since the mid-1990s, several studies have been carried out on the induction of germ cell mutations at expanded simple tandem repeat (ESTR) loci in mice (formerly called minisatellites) and at minisatellite loci in humans. These are regions of the genome that do not code for any proteins but are highly unstable (mutable), both spontaneously and under the influence of radiation. These attributes have facilitated detection of increases in mutation rates at radiation doses and sample sizes substantially smaller than those used in conventional mutation studies with germ cells. Although these loci do not code for proteins and most spontaneous and radiation-induced mutational changes in them are not associated with adverse health effects, some limited evidence is suggestive of a possible role of minisatellites in human disease (reviewed in Bridges 2001). For example, there are data suggesting that minisatellites can affect transcription of the insulin gene (IDDM2) and HRAS1 genes (Trepicchio and Krontiris 1992; Kennedy and others 1995) Further, it has been found that certain polymorphisms of the minisatellite at the 5′-flanking region of the IDDM2 gene may be associated with predisposition to insulin-dependent diabetes mellitus (Bell and others 1984; Bennett and others 1995). Additionally, there is suggestive evidence of an association between the risk of cancer and mutations in the HRAS1 gene (Krontiris and others 1993; Phelan and others 1996). Although it is not possible at present to use data from these studies for radiation risk estimation, they are considered in this report because some of the findings have exposed interesting aspects of the radiation response at these loci that have parallelisms to the genomic instability phenomenon recorded in irradiated somatic cell systems and therefore relevant for ongoing debates in radiobiology. Most of these studies have been reviewed recently (Bridges 2001; UNSCEAR 2001). The principal conclusions are summarized here; and details are presented in Annex 4F.
Mouse Studies
Mutations at the ESTR loci can be induced by both low-and high-LET (neutrons from californium-252 [252Cf]) irradiation of mouse germ cells (Dubrova and others 1993, 1998a, 1998b, 2000a, 2000b; Sadamoto and others 1994; Fan and others 1995; Niwa and others 1996). For both types of radiations, the dose-effect relationship for mutations induced in spermatogonial stem cells is consistent with linearity. The high frequency of induced mutations strongly supports the view that they are unlikely to result from direct radiation damage to these small genomic loci themselves (i.e., they are nontargeted events arising indirectly as a result of genomic instability; Niwa and others 1996; Dubrova and others 1998b; Niwa and Kominami 2001). There is evidence that this instability is not the result of a general genome-wide increase in meiotic recombination rate (Barber and others 2000).
This genomic instability is transmissible to at least two generations resulting in increased frequencies of mutations (Dubrova and others 2000b; Barber and others 2002). These findings add further support to observations on genomic instability recorded in somatic cells—the occurrence of genetic changes in the progeny of irradiated cells at delayed times (in terms of cell generations) after irradiation.
Data on ESTR mutations obtained in experiments involving irradiated spermatogonial stem cells permit an estimate of the DD of about 0.33 Gy for acute X-irradiation, similar to that known for specific locus mutations in mice (Dubrova and others 1998b). It should be noted, however, that both the average spontaneous rate (0.111 per band) and the induction rate (0.338 Gy−1) are orders of magnitude higher than those of specific locus mutations.
There are some discrepancies between the findings of Dubrova and colleagues and those of Niwa and colleagues: (1) In the work of Dubrova and colleagues, post-meiotic germ cells are not sensitive to mutation induction at the ESTR loci, whereas in the work of Niwa and colleagues, all germ cells are sensitive, albeit to different degrees; it is not yet clear whether these differences are due to differences in the mouse strains used or to some other reasons. (2) In the work of Niwa and colleagues, F1 tests showed increased frequencies of mutations in the unirradiated maternal allele, suggesting the occurrence of destabilization in the zygote; however this occurs only after spermatozoal but not after gonial irradiation of the males; in the work of Dubrova and colleagues, the data imply that destabilization occurs in the F1 zygote when the spermatozoa used for fertilization received irradiation either at the postmeiotic or premeiotic stages in spite of observations that postmeiotic germ cells were not sensitive to mutation induction.
Human Studies
The results of Dubrova and colleagues from the three post-Chernobyl studies (two in Belarus and one in Ukraine) and from a study conducted on the population in the vicinity of the nuclear test site in Semipalatinsk (Kazakhstan) provide evidence that mutations at minisatellite loci can be induced by radiation in human germ cells (Dubrova and others 1996, 1997, 2002b). The dose-response relationships, however, remain uncertain because of considerable difficulties in the estimation of parental gonadal doses. For example, in the first Belarus study (Dubrova and others 1996) the level of surface contamination by 137Cs was used as a broad dose measure, and the children of parents inhabiting heavily contaminated areas (>250 kBq m−2) were found to have twice the frequency of mutations compared to those of parents from less contaminated areas (<250 kBq m−2). In the second Belarus study (with more exposed families and more loci sampled), based on estimates of individual doses, two groups were defined: <20 mSv and >20 mSv (Dubrova and others 1997). The mutation frequency in children from the latter group was 1.35 times that in the former and the frequency in both groups was about twofold higher than in unexposed UK controls.
In the Ukraine study (Dubrova and others 2002b), a 1.6-fold increase in mutation rate in the exposed fathers but not exposed mothers (both relative to unexposed controls) was found, but again the dose-response relationship is uncertain. The authors noted that the doses from external chronic irradiation and internal exposures together were of the order of ~100 mSv (excluding short-lived isotopes). In the Semipalatinsk study (Dubrova and others 2002a), again there was a 1.8-fold increase in the first-generation progeny of parents receiving relatively high doses of radiation (cited as >1.0 Sv, but could have been higher or lower). In this study, through the use of three-generation families, the authors obtained evidence for a decline in mutation frequency as population doses decreased. Although this is what one normally would expect, it becomes a puzzling observation in view of the earlier evidence from the authors on ESTR loci on transgenerational mutagenesis in mice (i.e., the persistence of high mutation rate for at least two generations after the initial radiation exposure).
It is intriguing that in all studies discussed above, there is roughly a twofold increase in mutation rate (often less) despite the fact that the estimates of doses range from about 20 mSv to 1 Sv. Also noteworthy is that studies of the children of Chernobyl cleanup workers (estimated dose: <0.25 Sv; Livshits and others 2001) and of children of A-bomb survivors (estimated dose: 1.9 Sv; Kodaira and others 1995; Satoh and Kodaira 1996) do not show any increase in minisatellite mutation frequency. The same is true also of studies of cancer patients who had sustained chemo- and/or radiotherapy (Armour and others 1999; May and others 2000; Zheng and others 2000). The question of whether the induced mutation frequencies reach a plateau at low doses (unlike in the case of ESTR loci in mice) remains open. In a more recent study of the children born to Estonian Chernobyl cleanup workers, Kiuru and colleagues (2003) found that the minisatellite mutation rate was slightly but not significantly increased among children born after the accident relative to that in their siblings born before the accident; the recorded dose levels at which such an effect was seen were 200 mSv. At lower doses, there was no effect. It is obvious that much work is needed to validate the potential applications of minisatellite loci for monitoring mutation rate in human populations.
As discussed in Annex 4F, ESTR loci in mice and minisatellite loci in humans differ in a number of ways: the composition and size of the arrays, their distribution (apparently random in the case of ESTRs and subtelomeric in the case of minisatellites), the manifestation of instability (in both somatic cells and germline in the case of ESTRs, but almost completely restricted to the germline in the case of minisatellites, although the end result is the change in the number of repeat cores with both ESTRs and minisatellites), and mechanisms (ESTR instability appears to be a replication- or repair-based process involving polymerase slippage during replication, whereas minisatellite instability is due to gene conversion-like events involving recombinational exchanges). To what extent these differences may help explain the differences in response between mouse ESTR loci and human minisatellite loci remains to be determined. As pointed out by Yauk and others (2002), “… the use of mouse ESTR loci as models for human minisatellite instability should be treated with considerable caution.” Apart from the evidence that the mutational events represent nontargeted ones, no real insights have emerged thus far on the mechanisms of instability or radiation mutagenesis at these loci. In view of this and the fact that “mutational events” at the mouse ESTR and human minisatellite loci do not pertain to protein-coding genes, these data are not used in risk estimation.
RISK ESTIMATION
Introduction
In this section, advances in knowledge reviewed in earlier sections are recapitulated briefly and used to revise the estimates of genetic risks presented in BEIR V (NRC 1990). Additionally the consistency of the main finding of the genetic studies carried out on atomic bomb survivors in Japan (i.e., lack of demonstrable adverse genetic effects of radiation) with the present estimates and the strengths and weaknesses of the latter are discussed. Risks are estimated using the doubling dose method for Mendelian and chronic multifactorial diseases. For congenital abnormalities, mouse data on developmental abnormalities are used without recourse to the doubling dose method. No separate risks are estimated
for chromosomal diseases since they are assumed to be subsumed in part under the risks for autosomal dominant + X-linked diseases and in part under those for congenital abnormalities. The estimates presented are for a population sustaining low-LET, low-dose or chronic radiation exposures at a finite rate in every generation and are applicable to the progeny of the first two postradiation generations.
The equation now used for risk estimation is:
(4-13)
where P is the baseline frequency of the disease class under consideration, 1/DD is the relative mutation risk per unit dose, MC is the disease class-specific mutation component, and PRCF is the disease class-specific potential recoverability correction factor.
Summary of Advances Since the 1990 BEIR V Report
1. Baseline frequencies of genetic diseases. The baseline frequencies of Mendelian diseases have now been revised upwards. The revised estimates are the following: autosomal dominant diseases, 15,000 per million live births; X-linked diseases, 1500 per million live births; and autosomal recessive diseases, 7500 per million live births. For chromosomal diseases, the estimate remains unchanged at 4000 per million live births. For congenital abnormalities and chronic multifactorial diseases, the current estimates (respectively, 60,000 per million live births and 650,000 per million individuals in the population) are the same as those used in the UNSCEAR (1993, 2001) reports. BEIR V (NRC, 1990) used lower estimates of 20,000 to 30,000 for congenital abnormalities and did not provide any comparable estimate for chronic multifactorial diseases (see Table 4-1).
2. Conceptual change in calculating the doubling dose. Human data on spontaneous mutation rates and mouse data on induced mutation rates are now used to calculate the doubling dose, which was also the case in the NRC (1972) report. Although the conceptual basis for calculating the DD is now different (and the estimate itself is based on more data than has been the case thus far), its magnitude (i.e., 1 Gy for chronic low-LET radiation conditions) is the same as that used in the BEIR V.
3. Mutation component. Methods to estimate the mutation component (the relative increase in disease frequency per unit relative increase in mutation rate) have now been elaborated for both Mendelian and chronic multifactorial diseases. For autosomal dominant diseases, the first postradiation generation MC = s = 0.3, where s is the selection coefficient. For the second postradiation generation, MC = 0.51 as given by the equation MCp = [1 − (1 − s)t], where s = 0.3 and t = 2. For X-linked diseases (which are considered together with autosomal dominant diseases), the same values are used. For autosomal recessive diseases, MC in the first few generations is close to zero. For chronic multifactorial diseases, MC in the first as well as the second postradiation generations is assumed to be about 0.02. For congenital abnormalities, it is not possible to calculate MC, but this does not pose any problem since the risk estimate for these does not use the doubling dose method.
4. Potential recoverability correction factor. A new disease class-specific factor, the PRCF, has been introduced in the risk equation to bridge the gap between radiation-induced mutations in mice and the risk of radiation-inducible genetic disease in human live births. The risk now becomes a product of four quantities (see Equation (4-13) above) instead of three, which was the case until the early 1990s (NRC 1990; UNSCEAR 1993). For autosomal dominant and X-linked diseases, the PRCF estimate is in the range 0.15 to 0.30; the lower value represents the “weighted PRCF” (i.e., weighted by disease prevalence), and the higher value, the unweighted one (i.e., the proportion of human genes at which induced disease-causing mutations are potentially recoverable in live births). For autosomal recessive diseases, no PRCF is necessary (since induced recessive mutations do not precipitate disease in the first few generations). For chronic diseases, PRCFs are estimated to be in the range between about 0.02 and 0.09 under the assumption that the number of genes underlying a given multifactorial disease is equal to 2 (the minimum number) and that the PRCF is the nth power of that for an autosomal dominant disease (i.e., [0.15]2 to [0.3]2). It is not possible to calculate PRCF for congenital abnormalities.
5. The concept that the adverse effects of radiation-induced genetic damage in humans are likely to manifest predominantly as multisystem developmental abnormalities in the progeny of irradiated individuals has now been introduced in the field of genetic risk estimation.
The mouse data used to obtain a provisional estimate of the risk of developmental abnormalities (considered here under the risk of congenital abnormalities) pertain to those on radiation-induced dominant skeletal abnormalities, dominant cataract mutations, and congenital abnormalities ascertained in utero (see Table 4-3D). Details of these abnormalities are discussed in Sankaranarayanan and Chakraborty (2000b) and in UNSCEAR (2001).
Briefly, the data on skeletal abnormalities (Ehling 1965, 1966; Selby and Selby 1977) permit an overall estimate of about 6.5 × 10⁻⁴ per gamete per gray for acute X- or γ-irradiation of males (spermatogonial stem cells). This estimate takes into account the proportion of skeletal abnormalities in mice, which—if they occur in humans—are likely to impose a serious handicap. The comparable rate for dominant cataracts (Favor 1989) is lower, being ~0.33 × 10⁻⁴ per gamete per gray. The rate for congenital abnormalities (corrected for compatibility with live births) is 19 × 10−4 per gamete per gray based on two sets of data (Kirk and Lyon 1984; Nomura 1988). When these three estimates are com-
bined, the resultant figure is about 26 × 10−4 per gamete per gray and this has been rounded upwards to 30 × 10−4 per gamete per gray. This estimate summarizes the overall risk of congenital abnormalities for acute X-irradiation of males. With a dose-rate reduction factor of 3, the rate applicable for chronic or low-dose irradiation conditions is about 10 × 10−4 per gamete per gray. Under the assumption that the rate in females will be the same, the rate applicable for irradiation of both sexes is about 20 × 10−4 per gamete per gray.
Current Risk Estimates
Estimates of risk for all classes of disease except congenital abnormalities have been obtained using the equation: Risk = P × 1/DD × MC × PRCF. The values used for estimating the first-generation risk are the following:
Autosomal Dominant + X-Linked
Chronic Diseases
For the second postradiation generation, the MC value is 0.51 for autosomal dominant and X-linked diseases; the values for all others remain the same. Estimates for congenital abnormalities have been obtained using mouse data on developmental abnormalities (see Table 4-3D); the DD method was not used.
Table 4-6 (top part) presents the current estimates of genetic risks of radiation and compares them with those in BEIR V (NRC 1990; bottom part). All estimates are per million progeny per gray.
Risk to Progeny of the First Postradiation Generation
As can be seen, the risk is of the order of about 750 to 1500 cases for autosomal dominant and X-linked diseases (versus 16,500 cases of naturally occurring ones) and zero for autosomal recessive diseases (versus 7500 cases of naturally occurring ones). For congenital abnormalities, the estimate is about 2000 cases (versus 60,000 cases of naturally occurring ones), and for chronic diseases, it is about 250 to 1200 cases (versus 650,000 cases of naturally occurring ones). Overall, the predicted risks per gray represent 0.4 to 0.6% of the baseline frequency (738,000 per million).
Risk to Second Postradiation Generation Progeny
Under conditions of continuous radiation exposure in every generation, the risk to the second postradiation genera
TABLE 4-3D Mouse Database Used for Estimating the Rate of Induction of Dominant Heritable Developmental Effects Listed as Congenital Abnormalities in Table 4-6
|
End Point |
Dose (Gy) |
Frequency of Affected Progeny |
Rate per Gray (× 104)a |
|
|
References: Ehling (1965, 1966); Selby and Selby (1977) |
||||
|
1. Skeletal abnormalities |
6.0 |
5/754 |
|
11 |
|
2. Skeletal abnormalities |
1+ 5 |
5/277 |
(30)a |
15 |
|
3. Skeletal abnormalities |
1+ 5 |
37/2646 |
(23)a |
12 |
|
Overall average induction rate |
|
~13 |
||
|
Rate applicable to humans |
~6.5 |
|||
|
Reference: Favor (1989) |
||||
|
4. Cataractsb |
1.5 |
2/23,157 |
|
0.28 |
|
|
3.0 |
3/22,712 |
0.29 |
|
|
5.3 |
3/10,212 |
0.47 |
||
|
6.0 |
3/11,095 |
0.38 |
||
|
6.0 |
3/17,599 |
0.21 |
||
|
Overall average induction rate |
|
0.33 |
||
|
Reference: Nomura (1988) |
||||
|
5. Congenital anomalies (detected in utero; ICR strain) |
0.36 |
1/163c |
|
56d |
|
1.08 |
3/234c |
83 |
||
|
2.16 |
9/496c |
65 |
||
|
Reference: Kirk and Lyon (1984) |
||||
|
6. Congenital anomalies (detected in utero; [(C3H/HeH) × (101/H) strain] |
5.00 |
22/1014c |
|
30e |
|
Unweighted average induction rate |
48 |
|||
|
Corrected for viability in human live births |
19f |
|||
|
Overall rate for developmental abnormalities |
30g |
|||
|
NOTE: All these studies involved spermatogonial irradiation. aEstimates in parentheses: observed rate per gray for fractionated radiation conditions (24 h interval between fractions); estimates without parentheses are standardized to acute radiation conditions by dividing the above by 2, the factor by which specific locus mutation frequencies are known to be enhanced under fractionated radiation conditions. bRates have been corrected for controls in which the frequency was 1/22,594. cDenominator refers to the number of live fetuses screened. dRates corrected for controls (8/1967). eRate corrected for controls (5/720). fUnder the assumption that about 40% of the abnormalities may be compatible with live births in humans (see Nomura 1988). g(6.5 + 0.3 + 19)10−4 = 26 × 10−4 rounded to 30 × 10−4. |
||||
tion progeny is slightly higher for autosomal dominant and X-linked diseases and for congenital abnormalities. The overall increase in risk (all classes of disease) relative to the baseline is small (0.53%–0.91% of 738,000 per million progeny).
Comparisons of Present Estimates with those in BEIR V
The bottom part of Table 4-6 shows the risk estimates arrived at in BEIR V (NRC 1990). As evident, in the 1990 report (1) the estimates of baseline frequency of Mendelian diseases were lower and (2) no risk estimate was provided for chronic multifactorial diseases. It is worth mentioning that the differences between the current and the 1990 estimates stem from differences in the assumptions used (see NRC 1990 for details). For example, for congenital abnormalities, in the 1990 report it was assumed that the MC concept could be applied to these and that the first-generation MC could be as high as 35% (“worst-case” assumption); in the present report, the MC concept has not been used for this class of diseases for reasons discussed earlier.
The genetic theory of equilibrium between mutation and selection that underlies the use of the doubling dose method predicts that when a population sustains radiation exposure in every generation, a new equilibrium between mutation and selection will eventually be reached, albeit after tens or hundreds of generations into the distant future. In principle, therefore, one can project risks at the new equilibrium. However, in the present report (in contrast to NRC 1990), this has not been done and calculations have been restricted to the
TABLE 4-6 Estimates of Current Genetic Risks from Continuing Exposure to Low-LET, Low-Dose, or Chronic Radiation and Comparisons with Estimates in BEIR V Not Estimated
|
|
Risk per Gray per Million Progeny at |
||
|
Disease Class |
Baseline Frequency per Million Live Births |
First Generation |
Second Generationa |
|
Current Estimates |
|||
|
Mendelian |
|||
|
Autosomal dominant and X-linked |
16,500 |
~750 to 1500 |
~1300 to 2500 |
|
Autosomal recessive |
7,500 |
0 |
0 |
|
Chromosomal |
4,000 |
||
|
Multifactorial |
|||
|
Chronic multifactorial |
650,000c |
~250 to 1200 |
~250 to 1200 |
|
Congenital abnormalities |
60,000 |
~2000d |
~2400 to 3000 |
|
Total |
738,000 |
~3000 to 4700 |
~3950 to 6700e |
|
Total risk of baseline per gray as percent |
|
0.41 to 0.64 |
~0.53 to 0.91 |
|
ESTIMATES IN BEIR V REPORT (1990) |
|||
|
Mendelian |
|||
|
Autosomal dominant |
10,000 |
~600 to 3500 |
NE |
|
X-linked |
400 |
<100 |
NE |
|
Autosomal recessive |
2,500 |
<100 |
NE |
|
Chromosomal |
4,400 |
<600 |
NE |
|
Multifactorial |
|||
|
Congenital abnormalities |
20,000–30,000 |
1000 |
NE |
|
Other disorders |
|
||
|
Heart disease |
600,000 |
NE |
|
|
Cancer |
300,000 |
NE |
|
|
Selected others |
300,000 |
NE |
|
|
NOTE: The doubling dose used for both sets of estimates is 1 Gy. NE = N. aRisk to the second generation includes that of the first generation. bAssumed to be subsumed in part under the risk of autosomal dominant and X-linked diseases and in part under congenital abnormalities. cFrequency in the population. dCalculated using mouse data on developmental abnormalities without using the doubling dose method. eAssumes that between 20 and 50% of the abnormal progeny in the first postradiation generation may transmit the damage to the second (i.e., resulting in 400 to 1000 affected cases); this is in addition to the newly induced damage in the first postradiation generation and manifest in the second (2000 cases). |
|||
first two generations for the following reasons: (1) people are generally interested in genetic risks in the foreseeable future (i.e., to children and grandchildren), and (2) embarking on prediction of risk tens or hundreds of human generations from now involves the unrealistic and untestable assumptions that circumstances (e.g., demographic and health care possibilities) will remain constant over very long periods of time and that the various assumptions and quantities used will remain unchanged over tens or hundreds of human generations.
Reconciliation of Present Estimates with Main Conclusions of the Genetic Studies on A-Bomb Survivors in Japan
Introduction
The genetic studies of atomic bomb survivors carried out in Japan represent the largest and most comprehensive of the long-term human studies ever carried out on adverse hereditary effects of radiation. The various papers published over the past four decades on this research program have been compiled by Neel and Schull (1991). Since the beginning of these studies, their focus has always been on a direct assessment of adverse hereditary effects in the first-generation progeny of survivors, using indicators of genetic damage that were practicable at the time the studies were initiated in the early 1950s. They were not aimed at expressing risks in terms of genetic diseases. As the research progressed, it became clear that no statistically significant adverse effects could be demonstrated in the children of survivors, and this conclusion was found to hold when all of the available data until 1990 were analyzed (Neel and others 1990). The indicators used were: untoward pregnancy outcome (UPO), deaths among live-born infants through a period of about 26 years (exclusive of those resulting from malignancies), malignancies in children, frequency of balanced structural rearrangements of chromosomes, frequency of sex chromosomal aneuploidy, frequency of mutations affecting protein charge or function (electrophoretic mutations), sex ratio among children of exposed mothers, and growth and development of children.
DD Estimates from Japanese Data
Since the mid-1970s, several different DDs consistent with the emerging data had been estimated, and these are summarized in Annex 4A. The most recent DD estimates were those published by Neel and colleagues (1990) using five of the indicators mentioned above (i.e., UPO, F1 mortality, F1 cancers, sex chromosomal aneuploidy, mutations affecting protein charge or function). Details of how these DDs were calculated are presented in Annex 4G. The important point here is that all of the past as well as the 1990 DD estimates based on the Japanese data were higher by factors of 3 or more compared to the DD estimate of 1 Gy that has been used by UNSCEAR and the BEIR committees over the years. Since, in the public mind, the notion remains that the magnitude of DD defines the magnitude of risk (i.e., a low DD is indicative of high risk and high DD of a low risk), the above discrepancy between the DDs has given rise to the concern that UNSCEAR and the BEIR V committees might have overestimated the risks.
The BEIR VII committee stresses that such comparison between DDs estimates is inappropriate for the following reasons: (1) the DDs used by the UNSCEAR and BEIR committees are based on spontaneous and induced rates of mutations at defined human and mouse genes, respectively (or mouse genes in the past); (2) DD enters the risk equation as 1/DD, and the latter is only one of the four quantities used to predict the risk of genetic disease prospectively; and (3) in the Japanese studies, DD is estimated retrospectively from empirical data on indicators of genetic damage that are totally different and not readily equatable to genetic diseases; further, based on current knowledge, most of the indicators would not have been expected to show a significant increase in frequency for mechanistic or other reasons (see Annex 4G).
Consistency of Findings from Japanese Studies with Present Risk Estimates
Notwithstanding these differences in end points, estimates of DDs, and the approaches used for risk estimation, the principal messages from the Japanese studies (no significant adverse effects in more than 30,000 progeny from parents with estimated conjoint gonadal dose of the order of about 0.4 Sv or less) and from estimates discussed in this document (3000 to 4700 cases per gray per million children of the first postradiation generation; Table 4-6) are basically the same—namely, that at low doses the genetic risks are small compared to the baseline risks of genetic diseases.
Strengths and Weaknesses of the Risk Estimates Presented in This Report
For the first time in genetic risk estimation, it has been possible to present risk estimates for all classes of genetic disease. In part, this is due to the incorporation of advances in human molecular biology within the conceptual framework of risk estimation. It is important to realize however that human data that bear on hereditary effects of radiation remain limited, and estimates of risk still have to be obtained indirectly using several assumptions. While the risk estimates presented in this document represent what is achievable at the present state of knowledge, it is instructive to examine the assumptions (and consequent uncertainties) and, more importantly, the overlap of the estimates made.
Equal Sensitivity of Both Sexes to Radiation-Induced Mutations
The first of these assumptions—namely, the sensitivity of human immature oocytes to radiation-induced mutations is equal to that of stem cell spermatogonia—was dictated by the view that mouse immature oocytes may not constitute a suitable model for assessing the response of human immature oocytes. If indeed human immature oocytes turn out to be less sensitive than stem cell spermatogonia, then the sex-averaged rate of induced mutations would be lower (i.e., the DD would be higher, which means lower relative mutation risk). At present, it is not possible to address this issue.
The Doubling Dose
The average spontaneous mutation rate (the numerator in DD calculations) is based on 26 human disorders encompassing some 135 genes. Although it would have been ideal to use the average rate based on all of the genes contributing to diseases included under P (the baseline frequency of diseases), this was not possible because of lack of data. When full annotations of all of the genes in the human genome and knowledge of their disease potential and mutation rates become available, it is likely that the estimate of average rate of mutations will change. Likewise, the average rate of induced mutations (the denominator in DD calculations) is now based on induced mutations in 34 mouse genes with widely different locus-specific rates. Again, knowledge of the radiation response of mouse genes is expected to increase when the mouse genome, which has now been sequenced (FCRGERG 2002; MGSC 2002), becomes fully annotated and enables radiation mutagenesis studies with additional genes. At present, one can only speculate about how the induced mutation rate will change and how it will impact the DD estimate.
Mutation Component
In this report, it is assumed that the first-generation MC = s = 0.3 for autosomal dominant and X-linked diseases. The estimate for s has been obtained from an analysis of only a subset of naturally occurring autosomal dominant diseases for which such information was available and is therefore not applicable to all autosomal dominant and X-linked diseases included under P. If one were able to include these, the average s value might change. Further, it may be necessary to revisit the assumption that the s value for induced mutations that cause disease is similar to those of spontaneous disease-causing mutations.
The estimate that for chronic multifactorial diseases, MC = 0.02 for the first few generations has been obtained from computer simulation studies, which showed that the MC values were in the range of 0.01 to 0.02, often closer to the former than to the latter. If the actual MCs are in fact closer to 0.01, the currently used MC value will overestimate the risk by a factor of 2.
Potential Recoverability Correction Factors
For autosomal dominant and X-linked diseases, a range of PRCFs from 0.15 to 0.30 was used, the lower limit of the range being a weighted average (i.e., weighted by disease incidence) and the upper limit, the unweighted average (i.e., proportion of genes at which induced mutations are potentially recoverable in live births). However, the criteria developed for potential recoverability of induced deletions (the predominant type of radiation-induced DNA damage) do not include breakpoint specificities that are undoubtedly important in the case of deletion-associated naturally occurring Mendelian diseases. It seems unlikely that radiation-induced deletions would share these specificities, certainly not in all genomic regions. Should these specificities also be important for recovering induced deletions (with a disease phenotype similar to that associated with a naturally occurring deletion), even the weighted PRCF may be an overestimate.
For chronic multifactorial diseases, the assumption has been that the PRCF may simply be the xth power of that for single-gene diseases, with x = the number of genes that have to be simultaneously mutated to cause disease. The values of 0.02 to 0.09 have assumed x = 2, the minimum number. Although statistically such a calculation can be defended, the implicit biological assumption that at low doses of radiation, two independent mutations underlying a chronic disease may be induced simultaneously and recovered seems unrealistic.
There is one further point to be made, namely that the PRCF for chronic diseases is very sensitive to x. For example, if x = 3, the PRCF range becomes 0.003 to 0.03 (i.e., [0.15]3 to [0.30]3). Since for many chronic diseases, mutations in more than two genes seem to be involved, the argument is that the PRCF range of 0.02–0.09 used in the present calculations may overestimate the risk.
Overlap in Estimates of Risk
It should be recalled that (1) the estimates of risk for autosomal dominant and X-linked diseases have been obtained using the DD method; (2) the risks of congenital abnormalities that are also adverse dominant effects have been obtained independently using mouse data without recourse to the DD method; and (3) the risk of “chromosomal diseases” has been assumed to be subsumed under the above two items. The important point is that since all of these represent dominant effects (and spontaneous mutations in many developmental genes are known to cause Mendelian diseases), there must be overlap between the classes of risk grouped under the headings of autosomal dominant + X-linked diseases and of congenital abnormalities, although at present it is difficult to assess its magnitude. The consequence is that the sum may overestimate the actual risk of dominant effects.
Overall Conclusions
The committee has evaluated Table 4-6 and expresses the view that these estimates of risk are the best that are possible at the present time.
ANNEX 4A: MODELS OF INHERITANCE OF MULTIFACTORIAL DISEASES IN THE POPULATION
Multifactorial Threshold Model of Disease Liability and the Concept of Heritability
Assessment of the relative importance of genetic and environmental factors in the etiology of multifactorial diseases is essential to explain their transmission patterns and predict their risks of recurrence in families. Conceptualized this way, it is a problem of quantitative genetics, the theoretical foundations for which were laid by Fisher (1918). Multifactorial diseases per se, however, are not quantitative traits, but qualitative ones (i.e., all-or-none traits [presence or absence of disease]), although some of the surrogate clinical measures used are quantitative (e.g., serum cholesterol levels in the case of CHD, systolic and diastolic blood pressure in the case of essential hypertension, fasting glucose concentrations in the case of diabetes mellitus). Consequently, methods originally developed for studies of quantitative traits and their inheritance were adapted to deal with these diseases.
Carter (1961) proposed the concepts of a hypothetical variable called disease liability that underlies multifactorial diseases and of threshold. The concept of disease liability enables one to envisage a graded scale of the degree of being affected or being normal. Likewise, the concept of threshold enables one to envision a certain value in the liability scale that, when exceeded, will cause the disease. Below the threshold, the individual would not be affected. Subsequently, Falconer (1965) formalized these concepts quantitatively by advancing what has come to be known as the MTM of disease liability.
Details of the MTM have been discussed extensively in a number of publications (e.g., Falconer 1965, 1967; Smith 1975; Carter 1976a; Bishop 1990). The basic assumptions of the simple or standard version of the MTM are the following: (1) all environmental and genetic causes can be combined into a single continuous variable called liability, which is not measurable as such; (2) liability is determined by numerous genetic and environmental factors that act additively, each contributing a small amount of liability; (3) the liability in the population has a normal (Gaussian) distribution; and (4) affected individuals are those whose liability exceeds a certain threshold (see Figure 4A-1).
The MTM permits a number of predictions: First, when the population frequency of the disease is high, the relative risk to relatives of an index case (compared to the general population) would be expected to be greater, but proportionately less. This situation occurs because, when the popula
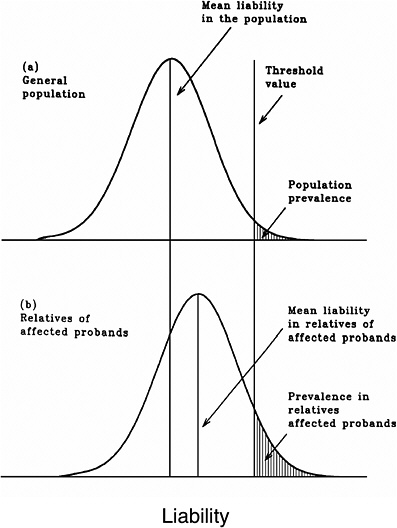
FIGURE 4A-1 Distribution of liability in the general population and in relatives of affected individuals according to the multifactorial threshold model.
tion frequency is high, the predisposing mutations for the condition are distributed throughout the population, so the likelihood of exceeding the threshold is high. When the population frequency of the disease is low, only relatives have a significant risk.
Second, for diseases that show marked differences in incidence between the sexes, the MTM—with the added assumption of different thresholds in the two sexes—would predict higher relative risks to relatives of the less frequently affected sex. For example, in Hungary, congenital pyloric stenosis is about three times more common in males than in females (0.22% versus 0.07%). The risk to brothers of affected females is about 20%, which is much higher than the value of 4% for the brothers of affected males (Czeizel and Tusnady 1984). On the assumption that the threshold is farther from the mean in females than in males (i.e., more to the right upper tail of the distribution), one would expect that affected females would have more disease-predisposing mutations, on average, than affected males. Relatives of female patients would therefore receive more of these (thus being at correspondingly higher risk) than relatives of male patients (see Figure 4A-2).
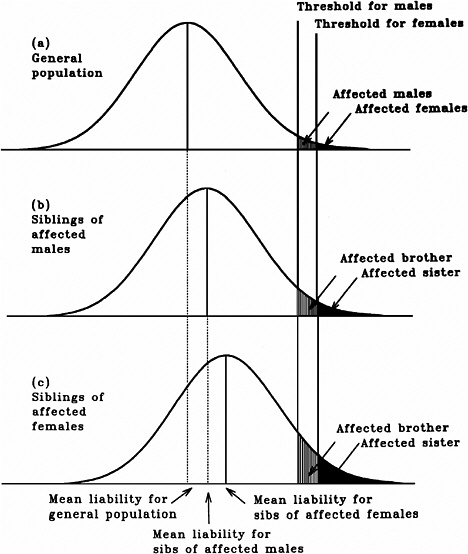
FIGURE 4A-2 Comparisons of the distribution liability in the general population with those in relatives of affected individuals when there are differences in the prevalence of multifactorial disease, according to the multifactorial threshold model with the additional assumption of different thresholds for disease liability in the two sexes.
Based on the properties of the normal distribution of liability (made up of both genetic and environmental components) that underlies the MTM, methods have been developed to use data on the population frequency of a given multifactorial disease to predict the risk to relatives of those affected and to estimate, on the basis of correlation in liabilities between relatives, the relative contribution of genetic factors to the overall phenotypic variability summarized in the statistic called “heritability of liability” (h2).
Concept of Heritability
In quantitative genetics, the relative contributions of genetic and environmental factors to the overall phenotypic variation is assessed by analysis of variance (i.e., by estimating the total phenotypic variance, VP, and apportioning it into variance due to genetic factors, VG, and variance due to environmental factors, VE). Under the assumption that the genetic and environmental effects are independent of each other (i.e., they are not correlated), VP = VG + VE. The ratio VG/VP is called “broad-sense heritability of liability,” or “degree of genetic determination,” and is symbolized by hB2. It provides a measure of the relative importance of genotype as a determinant of phenotypic value (Smith 1975).
The genotypic variance VG can be subdivided into an additive component (VA) and a component to deviations from additivity. Additive genetic variance is the component attributable to the average effect of genes considered singly, as transmitted in the gametes. The ratio VA/VP is called “narrow-sense heritability,” or hN2, and expresses the extent to which the phenotypes exhibited by parents are transmitted to offspring, and it determines the magnitude of correlation between relatives. The nonadditive genetic variance is due to the additional effects of these genes when combined in diploid genotypes and arises from dominance (VD), interaction (epistasis, VI) between genes at different loci, and assortative mating (VAM). In the absence of these sources of genetic variance, hN2 = hB2. It is important to note that most of the heritability estimates for chronic diseases published in
the literature are broad-sense heritability of liability estimates and are in the range of about 0.3–0.8.
Other Models of Inheritance of Multifactorial Diseases
An important assumption of the MTM as discussed above is that a large number of factors, each with small effects, contributes to liability. However, the assumption of fewer contributing factors is also consistent with data from familial aggregation studies, and for this reason, it is not a good analytical tool for discriminating between different modes of inheritance. Consequently, attempts to fit the familial data to Mendelian models (with appropriate choice of assumptions on the numbers of loci, penetrance, dominance, etc.) or to a combination of major locus and polygenic models have been made, (e.g., Elston and Stewart 1971; Morton and MacLean 1974; Kendler and Kidd 1986); although these models are of interest in catalyzing the search for the genes involved, they are now largely superseded by molecular approaches that hold the potential for direct identification of the genes.
ANNEX 4B: THE DOUBLING DOSE
Table 4B-1 provides a broad overview of the data used during the past four decades for estimating doubling doses. It is worth noting that although the present unit for expressing absorbed radiation dose is gray (or sievert when considering radiations of different qualities), in reviewing the earlier estimates in this section the DDs are expressed in the same units employed in the original publications, namely, roentgens (R), rads, roentgen-equivalent-man (rem), grays, and sieverts. Note that for low-LET radiation (e.g., X-rays and γ-rays), 1 Gy = 100 rads ~ 100 R; 1 rem=1rad; and 1Sv=100 rem.
Briefly, the notion that the DD for genetic damage induced in human males at low-dose or chronic low-LET radiation conditions is likely to be of the order of about 100 R was already entertained in the early 1960s (UNSCEAR 1962). This estimate was guided by the findings (from mouse studies on recessive specific locus mutations) that chronic X-irradiation would be only about one-third as effective as acute X-irradiation in males and much less effective in females (Russell and others 1958, 1959). Consequently, it was suggested that the DD for chronic X-irradiation exposure conditions was probably at least three times that for acute X-irradiation (i.e., three times that of about 30 R suggested in the 1958 UNSCEAR report for acute X-irradiation or about 100 R).
In 1971, Lüning and Searle broadened the original concept of the DD to include not only mutations at defined gene loci, but also four other end points of genetic damage (semisterility, dominant visible mutations recovered in the course of studies on recessive specific locus mutations, autosomal recessive lethals, and skeletal abnormalities, all from experiments involving irradiation of male mice [spermatogonial stem cell irradiations]). They found that for acute X-irradiation of males, although individual estimates varied from 16 to 51 R (with wide confidence limits, except for specific locus mutations), the overall average was about 30 R. For low-dose or chronic low-LET radiation exposure, the suggestion was that it would be between three and four times that for acute X-irradiation (i.e., about 100 R). UNSCEAR, however, did not use the DD method in its 1972 report, but in all reports published until 1993, the mouse data-based estimate of 1 Gy has been used.
The BEIR I report (NRC 1972) introduced the concept that DD estimates must be based on the average spontaneous mutation rate of human genes and the average induced rate of mutations in mouse genes. In that report it was assumed that (1) the spontaneous mutation rate of human genes might be in the range of 0.5 × 10⁻⁶ to 0.5 × 10⁻⁵ per gene and (2) the sex-averaged rate of induced recessive mutations in mouse was about 0.25 × 10⁻⁷ per locus per rem for low-LET radiation conditions. With these estimates, a range of DDs from 20 to 200 rem was calculated.
The induced rate of 0.25 × 10⁻⁷ per locus per rem mentioned above was the unweighted average of the rate of 0.5 × 10⁻⁷ per locus per rem for males (at 12 loci, including 7 of the specific loci have been used in most mouse experiments and the additional 5 used in the studies of Lyon and Morris 1969) and that of zero assumed for females. It was noted, however, that the estimate of 0.25 × 10⁻⁷ per locus per rem might be too high for at least two reasons: (1) “the gene loci at which these studies were made, were to some extent preselected for mutability” and (2) “the rate of induction of dominant visible mutations in mice is lower than for recessives by at least an order of magnitude and dominant mutations constitute a substantial part of the human genetic risk.” This procedure of using human data on spontaneous mutation rates was driven by one of the principles stated by the committee—namely, that emphasis should be placed on human data when feasible—the implicit idea being that if the induced rate was extrapolated from mouse to humans, there would be one extrapolation uncertainty and if both spontaneous and induced rates were extrapolated to humans, there would be two such uncertainties.
When UNSCEAR (1977) first used the mouse data-based DD of 100 rads, it did not actually specify the induced rates. This was because the estimate of 100 rads was arrived at by assuming that the DD for low-LET chronic radiation conditions would be three times that of ~30 rads for high-dose-rate acute X-irradiation conditions (for five different end points; see Lüning and Searle 1971).
In BEIR III (NRC 1980), however, the committee abandoned the method that was used in BEIR I, namely, using human data on spontaneous mutation rates and mouse data on induced mutation rates in defined genes. The stated objection to the BEIR I method was that it mixed the induced rate of a set of mouse genes preselected for high mutability
TABLE 4B-1 Doubling Dose Estimates Used in Risk Estimation from the 1950s to the Early 1990s
|
Reference |
DD |
Radiation Conditions |
Comments |
|
1956 BEAR report (NRC 1956) |
50–80 R 40 R |
High dose rate (acute) |
Guided more by general radiation genetic principles (established mostly from Drosophila studies) than by knowledge of mouse or human mutation rates and, therefore, nothing more than educated guesses; among the principles were (1) linear dose-effect relationship for induced mutations and (2) effect independent of dose rate or dose fractionation. The general philosophy and “best” estimates of the Medical Research Council (MRC 1958) and UNSCEAR (1958) were roughly similar |
|
UNSCEAR (1962) |
100 R |
Chronic |
Based on mouse data on the reduced effectiveness of chronic γ-irradiation for the induction of specific locus mutations (Russell and others 1958); assumed that DD for males will be about 3 times that of 30 R assumed in UNSCEAR (1958) for acute X-irradiation conditions; noted that DD for females may be higher |
|
Lüning and Searle (1971) |
16–51 rads ~100 rads |
Acute Chronic |
Based on mouse data for 5 different end points for males; no DD estimate provided for females |
|
1972 BEIR report (NRC 1972) |
20–200 rem |
Chronic |
Based on a range of spontaneous rates in humans (0.5 × 10⁻⁶ to 0.5 × 10⁻⁵) and a sex-averaged rate of induction of specific locus mutations of 0.25 × 10⁻⁷ per locus per rem in mice |
|
Neel and others (1974) |
46 rem (Petersen and others 1990) 125 rem (females) |
Acute |
Based on data on mortality of children born to A-bomb survivors through the first 17 years of life; assumed that for chronic irradiation, the DD for males might be 3 to 4 times 46 rem and as much as 1000 rem for females |
|
Sankaranarayanan (1976); Searle (1976) |
80–240 rads |
Chronic |
Based on mouse data for specific locus mutations induced in spermatogonia and in mature + maturing oocytes and dominant visibles and translocations induced in spermatogonia |
|
UNSCEAR (1977) |
100 rads |
Chronic |
Rationale stated as follows: “Examination of available evidence in the mouse suggests that the use of a 100-rad DD will not underestimate the risk. The ICRP Task Group has also this figure in its calculations …” |
|
1980 BEIR report (NRC 1980) |
50–250 rem |
Chronic |
Based on the “best substantiated” estimate of DD of 114 rem for spermatogonial irradiation of male mice and approximately halving and doubling the above estimate to arrive at the range of 50–250 rem |
|
UNSCEAR (1982) |
100 rads |
Chronic |
No change from the 1977 report |
|
Neel and others (1982); Schull and others (1982) |
60 ± 93 rem 135 ± 388 rem 535 ± 2416 rem 135 ± 156 rem |
Acute |
The first three estimates are based, respectively, on data on UPOs, survival through childhood, and sex chromosomal aneuploids in the Japanese studies; the authors considered that the weighted average of 135 ± 156 rem (last entry) should be multiplied by a factor of 3 to make it applicable to chronic radiation conditions |
|
UNSCEAR (1986) |
1 Gy |
Chronic |
No change from the 1977 report |
|
UNSCEAR (1988) |
1 Gy |
Chronic |
No change from the 1977 report |
|
1990 BEIR report (NRC 1990) |
100 rads |
Chronic |
Overall estimate based on mouse data (both sexes) on several different end points; most estimates given as ranges that vary by factors between about 2 and 30 (a reflection of differences in estimated spontaneous and induction rates); multiplication factors between 5 and 10 used when necessary to convert DD estimates for high-dose-rate irradiation to those for chronic irradiation |
|
Neel and others (1990) |
1.69–2.23 Sv |
Acute |
Composite estimates of “minimal DDs” (DDs at 95% lower confidence limits) compatible with Japanese results on UPOs, F1 mortality, F1 cancer, sex chromosomal aneuploids, and mutations altering protein charge or function; on the assumption of a dose-rate reduction factor of 2, the authors suggest that for chronic low-LET, low-level radiation, the figures are likely to be twice those estimated (i.e., about 3.4 to 4.5 Sv) |
|
Neel and Lewis (1990) |
1.35 Gy |
Acute |
Based on an analysis of mouse data on 7 mutational end points (spermatogonial irradiation experiments); the authors suggest that with the use of a dose-rate factor of 3, the DD will be about 3 Gy |
|
UNSCEAR (Rabes and others 2000) |
1 Gy |
Chronic |
No change from the 1977 report |
|
SOURCE: Sankaranarayanan and Chakraborty (2000a). |
|||
with estimates of human spontaneous rates for more typical genes. The BEIR III committee adopted the view that it was preferable to use a DD estimate obtained from spontaneous and induced mutations in the same set of loci in the same species and used exclusively the data on the seven specific loci obtained in experiments with male mice. The figures used were 7.5 × 10⁻⁶ per locus for spontaneous rates and 6.6 × 10⁻⁸ per locus per rem for induced rates from which “the best substantiated” DD estimate of 114 R was calculated. To derive DDs for risk predictions, it approximately halved and doubled the above estimate of 114 R to obtain a range of 50 to 250 rem.
In BEIR V (NRC 1990), the committee again used primarily mouse data but included several additional end points in both sexes (dominant lethals, recessive lethals, dominant visibles, recessive visibles, reciprocal translocations, congenital malformations, and aneuploidy). On the basis of all these data, it concluded that “considering all endpoints together, the direct estimates of doubling dose for low dose rate radiation have a median value of 70–80 rad, indirect estimates based on high dose-rate experiments have a median value of 150 rad, and the overall median lies in the range of 100 to 114 rad. These estimates support the view that the doubling dose for low dose-rate, low-LET radiation in mice is approximately 100 rad for various genetic endpoints.”
Table 4B-1 also shows that the DD estimates made over the years based on genetic data from A-bomb survivors (Neel and others 1974, 1982, 1990; Schull and others 1981, 1982; Otake and others 1990; Neel 1998) were at least some three to four times that of 1 Gy used by UNSCEAR and the BEIR committee; the so-called Japanese DD estimates, however, were never used by the above committees. For the first time, the BEIR V (NRC 1990) report gave a formal “status” to the Japanese results by noting that “a doubling dose of 100 rem approximates the lower 95% confidence limit for the data from atomic bomb survivors in Japan and it is also consistent with the range of doubling doses in mice.”
ANNEX 4C: ASSUMPTIONS AND SPECIFICATIONS OF THE FINITE-LOCUS THRESHOLD MODEL
The assumptions and specifications of the FLTM have been discussed in detail by Denniston and colleagues (1998) and in the ICRP (1999) Task Group report. Briefly, the FLTM assumes that (1) the genetic component of liability of a chronic multifactorial disease is discrete and is determined by mutant alleles at a finite number (n) of autosomal gene loci; the total number of mutant alleles at these n loci in a given genotype is a random variable g; (2) the environmental component is continuous and represented by a random variable e, which has a Gaussian distribution with mean of zero and variance of Ve; (3) the total liability x = f(g) + e, where f(g) is a function of the number of mutant alleles in the n-locus genotype of the individual and e is the environmental effect; (4) individuals with liability exceeding the threshold T (i.e., x > T) are affected by the disease, and those for whom x < T are unaffected; and (5) unaffected individuals have a fitness of 1 and unaffected ones of (1 − s). The impact of an increase in total mutation rate as a result of radiation exposures—from m to m(1 + k), with k measuring the increase relative to the baseline—is assessed in terms of changes in heritability of liability (hx2), and consequent changes in the MC. This assessment was carried out by assuming that the effects of the mutant alleles are either additive or synergistic.
Unlike the case of Mendelian diseases, the algebraic formulations of the FLTM do not permit expressing the effects in the form of a single equation. However, the predictions of the model can be evaluated iteratively using the computer program that was developed for this purpose. The program is first run using a specified set of parameter values (mutation rate, selection coefficients, threshold, etc.) until the population reaches equilibrium between mutation and selection. Once this occurs, the mutation rate is increased either once or permanently corresponding to radiation exposure in one generation only or in every generation, and the computer run is resumed with the new mutation rate while the other parameters remain the same. The changes in mutation component and its relationship to heritability of liability are then examined in desired generations and at equilibrium. It is worth mentioning that the h2 estimates are not inputs but outputs of the program obtained using different combinations of s values, environmental standard deviation, and threshold.
ANNEX 4D: DIFFERENCES BETWEEN SPONTANEOUS DISEASE-CAUSING MUTATIONS IN HUMANS AND RADIATION-INDUCED MUTATIONS IN EXPERIMENTAL SYSTEMS
The molecular alterations recorded in spontaneous disease-causing mutations in humans include a wide variety ranging from base-pair changes to whole-gene deletions and some multigene deletions. Radiation-induced mutations studied in experimental systems (including the mouse), however, are often multigene deletions, although scored through the phenotype of the marker loci. The extent of the deletion varies with the locus and the genomic region in which it is located.
Spontaneous mutations arise through a number of different mechanisms, and most are dependent on the DNA sequence organization of the genes and their genomic context. In contrast, radiation-induced mutations originate through random deposition of energy in the cell. One can, therefore, assume that the initial probability of radiation inducing a deletion may not differ between different genomic regions. However, their recoverability in live-born offspring seems dependent on whether the loss of the gene or genomic region is compatible with viability in heterozygotes.
Spontaneous mutations can cause either loss or gain of function of the normal gene through different mechanisms. For example, loss-of-function mutations in genes that code for structural or regulatory proteins may result in dominant phenotypes through haploinsufficiency (i.e., a single normal gene is not sufficient for normal functioning) or through dominant negative effects (i.e., the mutant product interferes with the function of the normal gene in the heterozygote). While loss of function of a gene can result from a variety of molecular alterations including deletions, gain-of-function mutations are likely only when specific changes in the gene cause a given disease phenotype. Radiation-induced mutations, because they are often multigene deletions, cause loss of function through haploinsufficiency.
Despite the existence of a number of differences between spontaneous and radiation-induced mutations as outlined above, radiation mutagenesis studies with a variety of experimental systems have been very successful. The possible reasons for this are now becoming evident: although the choices of marker genes in early studies of induced mutations were dictated more by practical considerations (e.g., obtaining sufficient numbers of mutants, unambiguous identification through their respective phenotypes) than by their relevance to human genetic diseases, in retrospect it is clear that the “successful” mutation test systems have been those in which most of these marker genes, and the genomic regions in which they are located, are nonessential for the viability of heterozygotes (in vivo) or of the cell carrying the induced genetic change (in vitro). Consequently, induced mutations—predominantly deletions—could be recovered and studied. Most human genes, however, do not appear to be of this type.
ANNEX 4E: CRITERIA USED TO ASSIGN HUMAN GENES TO ONE OF THREE GROUPS FROM THE STANDPOINT OF THE RECOVERABILITY OF INDUCED MUTATIONS IN LIVE BIRTHS
The genes included in the analysis are a subset of those in which mutations cause autosomal dominant and X-linked diseases, which have provided the basis for the overall incidence estimates for these diseases discussed earlier (Sankaranarayanan 1998). Since not all of them fulfilled the requirements for inclusion (because of insufficient information about one or more of the following: gene size, structure, function, genomic context, etc.), only a subset could be used. The “gene-richness” or “gene poorness” of given genomic regions was assessed using the MIM (Medelian Inheritance in Man) gene maps that present the cytogenetic location of “disease genes” and other expressed genes in given cytogenetic bands (McKusick 2000.).
A gene is assigned to group 1 (induced deletions unlikely to be recovered and/or unlikely to cause the phenotype of the disease under study) when the phenotype of the naturally occurring disease is due to specific (1) gain-of-function mutations (e.g., the FGFR3 gene involved in achondroplasia); (2) trinucleotide repeat expansions (e.g., Huntington’s disease); (3) dominant negative mutations (e.g., the COL1A1 gene involved in osteogenesis imperfecta); and (4) restricted array of point mutations (e.g., mutations in the APOB gene involved in one form of familial hypercholesterolemia). Also included in this group are genes that are relatively small in size and located in putative gene-rich regions (e.g., the VMD2 gene in Best’s macular dystrophy).
The gene is assigned to group 2 (uncertain recoverability) when (1) it is large, it codes for an essential structural protein, and the known genetic changes are missense or nonsense mutations; (2) whole-gene deletions are rare; (3) whole-gene deletions are not rare, but the gene is located in a putative gene-rich region; and (4) information on these other genes and their function is insufficient (e.g., BRCA2; VHL [von Hippel-Lindau syndrome]).
Group 3 (potentially recoverable) includes genes that are generally large and constitutional deletions, some extending beyond the confines of genes, and translocations or inversions with breakpoints in the gene causing the disease phenotype are known despite the putative gene-rich nature of the genomic region (e.g., EXT1 [multiple exotoses]; RB1 [retinoblastoma]).
For X-linked genes, the assessment is based on whether the induced deletion will be compatible with viability in males and cause disease (since the loss of the whole X chromosome is compatible with viability but results in 45,X females).
ANNEX 4F: RADIATION STUDIES WITH EXPANDED SIMPLE TANDEM REPEAT LOCI IN THE MOUSE AND MINISATELLITE LOCI IN HUMAN GERM CELLS
Introduction
The mouse and human nuclear genomes, like those of other complex eukaryotes, contain a large amount of highly repeated DNA sequence families most of which are transcriptionally inactive (Singer 1982). Among these are the simple sequence repeats that are perfect or slightly imperfect tandem repeats of one or a few base pairs (bp). In the mouse genome, the tandem repeat loci are represented by (1) relatively short microsatellites (<500 bp) with a repeat size of 1 to 4 bp; (2) long expanded simple tandem repeats (0.5 to 16 kilobases, repeat size 4 to 6 bp); and (3) true minisatellites (0.5 to 10 kb) with repeat size of 14 to 47 bp (Gibbs and others 1993; Bois and others 1998a, 1998b; Blake and others 2000).
Mouse ESTRs
The ESTRs were originally called minisatellites but have recently been renamed to distinguish them from the much
more stable true minisatellites in the mouse genome (Bois and others 1998a, 1998b). The ESTRs are highly unstable (i.e., they manifest high spontaneous mutation rates) in both somatic and germ cells. The mutational changes are manifest as changes in the number of tandem repeat cores and, hence, allele length. The available data suggest that the ESTR instability is a replication- or repair-based process involving polymerase slippage similar to mechanisms suggested for microsatellite instability (Ellegren 2000).
Human Minisatellites
In contrast to mouse ESTRs, the minisatellites in humans consist of longer repeats (10 to 60 bp) that may span from about 0.5 kb to several kilobases and show considerable sequence variation along the array (Jeffreys and others 1991; 1994; May and others 1996; Buard and others 1998; Tamaki and others 1999; Stead and Jeffreys 2000; Vergnaud and Denoeud 2000). The majority of the classical minisatellites are GC rich. The fact that some of the human minisatellite loci studied are highly unstable and have very high spontaneous mutation rates of the order of a few percent is now well documented (Jeffreys and others 1985, 1988, 1995; Smith and others 1990; Vergnaud and Denoeud 2000). Mutation at these loci is almost completely restricted to the germline and is attributed to complex gene conversion-like events involving recombinational exchanges of repeat units between alleles (Jeffreys and others 1994; May and others 1996; Jeffreys and Neumann 1997; Tamaki and others 1999; Buard and others 2000; Stead and Jeffreys 2000; Vergnaud and Denoeud 2000).
Radiation Studies with Mouse ESTR Loci
The Loci Used
Two ESTR loci have been used thus far in mouse mutation studies, namely, the Ms6-hm, and Hm-2, both of which show multiallelism and heterozygosity within inbred strains. The Ms6-hm is <10 kb in size (varying greatly between different mouse strains) and consists of tandem repeats of the motif GGGCA. Linkage analysis localized Ms6-hm near the brown (b) coat color gene on chromosome 4. The germline mutation rate is about 2.5% per gamete (Kelly and others 1989). The Hm-2 locus is located on chromosome 9 and consists of GGCA tetranucleotide repeats with alleles containing up to 5000 repeat units (i.e., up to 5 kb). The germline mutation rate of this locus is estimated to be of the order of at least 3.6% (Gibbs and others 1993). As discussed below, Dubrova and colleagues studied mutation induction at both of the above loci, whereas the Japanese workers focused their attention only on the Ms6-hm locus.
Low-LET Radiation Studies
In the studies of Dubrova and colleagues (1993) involving irradiation of spermatagonial stem cells (0.5 and 1 Gy of γ-rays; CBA/H strain), significant increases in the frequencies of mutations at the Ms6-hm and Hm-2 loci were found. Subsequent work with X-irradiation doses of 0.5 and 1 Gy established that for mutations induced in the above cell stage, the dose-effect relationship was consistent with linearity (y = 0.111 + 0.338D), where D is the dose in grays (Dubrova and others 1998a, 1998b). From these data, the authors estimated that the DD for ESTR mutations induced in spermatogonia was 0.33 Gy for acute X-irradiation, similar to that reported for specific locus mutations in mice.
In the above work, spermatids were found to be insensitive to mutation induction, a finding at variance with those of Sadamoto and colleagues (1994) and Fan and coworkers (1995) with the C3H/HeN mouse strain. These authors showed that for Ms6-hm locus mutations, all male germ cell stages were sensitive (3 Gy of γ-irradiation). Nonetheless, both sets of studies demonstrated that increases in mutation frequencies could be detected at radiation doses and sample sizes substantially smaller than those used in conventional genetic studies with specific locus mutations.
High-LET Radiations Studies
Niwa and collegues (1996) found that acute neutrons from a 252Cf source (65% neutrons + 35% γ-rays) were 5.9, 2.6, and 6.5 times more effective, respectively, in spermatozoa, spermatids, and spermatogonia, than acute γ-irradiation in inducing mutations at the Ms6-hm locus. In similar studies, Dubrova and colleagues (2000a) noted that in spermatogonial cells, chronic neutrons also from a 252Cf source had a relative biological effectiveness of about 3 relative to chronic γ-irradiation (regression equations: y = 0.136 + 1.135D, neutrons; doses of 0.125, 0.25, and 0.5 Gy; y = 0.110 + 0.373D, γ-rays; doses of 0.5 and 1 Gy). Additionally (and not unexpectedly), they found that at the above γ-ray doses of 0.5 and 1 Gy, there was no dose-rate effect. It should be remembered that the lower effectiveness of chronic γ-irradiation recorded in earlier specific locus mutation studies (Russell and others 1958) occured at total doses of 3 and 6 Gy. This observation is in contrast to earlier results with specific locus mutations (Russell and others 1958) at 3 and 6 Gy showing that chronic γ-irradiation was only one-third as effective as acute X-irradiation in inducing specific locus mutations.
Mutation Induction at the ESTR Loci—An Untargeted Process Arising as a Result of Radiation-Induced Genomic Instability
One important conclusion that emerges from these studies is that mutation frequencies in the progeny of irradiated animals are too high to be accounted for by the direct induc-
tion of mutations at the loci studied (i.e., radiation induction of germline mutations at ESTR loci is an untargeted process). Dubrova and colleagues (1998a, 1998b) concluded that there might be two associated processes: structural damage elsewhere in the genome or in other sensor molecules and, subsequently, indirect mutation at ESTR loci. This nontargeted origin of radiation-induced mutations at the ESTR loci is reminiscent of the phenomenon of delayed radiation-induced genomic instability in somatic cells (discussed in Chapters 2 and 3). The experiments of Barber and colleagues (2000) showed that the ESTR mutations in unirradiated or irradiated mice are not associated with a general genome-wide increase in meiotic recombination rate.
Further support for the concept of the nontargeted origin of induced ESTR mutations comes from the work of Niwa and Kominami (2001). In their study, male mice received 6 Gy of γ-irradiation and were mated to unirradiated females to produce F1 progeny from irradiated spermatozoa and stem cell spermatogonia. As in their earlier studies, mutations at the Ms6-hm locus were studied. The mutant frequencies for the paternally derived allele increased to 22% and 19% in the F1 progeny from irradiated spermatozoa and spermatogonia, respectively (about a twofold increase over the control rate). The surprising finding was that the mutation frequency also was higher (20%) in the maternally derived allele in progeny descended from irradiated spermatozoa, but not from spermatogonia. The authors’ interpretation is that the introduction of damage into the egg by irradiated spermatozoa triggers genomic instability in zygotes and in embryos of subsequent developmental stages, and that this genomic instability induces untargeted mutation in cis (in the paternally derived allele) and in trans (in the unirradiated maternally derived allele).
Transgenerational Instability
Dubrova and colleagues (2000a) and Barber and coworkers (2002) provided additional evidence for the involvement of radiation-induced germline genomic instability in the origin of induced ESTR mutations. In these experiments involving chronic neutron irradiation (0.5 Gy) of spermatogonial stem cells, the mutation frequency in the F1 progeny was about sixfold higher than in the control. Breeding from the unirradiated F1 mice revealed that the mutation rate remained high in transmissions from both F1 males (6×) and F1 females (3.5×; scored in F2). A part of this increase is due to germline mosaicism in F1 animals, suggesting that paternal exposure to radiation results in a destabilization of ESTR loci in the germline of offspring and that some of the mutations occur sufficiently early in germline development for significant levels of mosaicism to arise. More importantly, this instability is transmissible through meiosis and mitosis to the F2 generation and appears to operate in trans in the F1 germline (i.e., affecting alleles not only from the exposed F0 male but also from the unexposed F0 female). The latter finding is similar to that of Niwa and Kominami (2001).
In subsequent experiments, Barber and colleagues (2002) confirmed the transgenerational effects of chronic neutron irradiation and extended the observations to acute X-irradiation. Additionally, the response of two other inbred mouse strains (C57BL/6 and BALB/c) was compared with that of the CBA/H strain used in their studies. The rationale for the comparisons rests on earlier findings that BALB/c and CBA/H mice show higher levels of radiation-induced genomic instability in somatic cells than C57BL/6 mice and that this difference can be attributed to the strain-specific polymorphism at the Cdkn2a (cyclin-dependent kinase inhibitor) and Prkdc (DNA-dependent protein kinase catalytic subunit) genes (Zhang and others 1998; Yu and others 2001).
In these experiments, (1) spermatogonial neutron (0.4 Gy) or X-irradiation (2.0 Gy) of CBA/H mice resulted in an increase in the mutation rate in both the F1 and the F2 generations (derived from unirradiated F1 males and females); however, although spermatid irradiation did not cause an increase in mutation rate in the F1 generation (which was also the case in their earlier work), there was a clear increase in mutation rate in the F2 progeny, suggesting that destabilization of the F1 germline occurs after fertilization, regardless of the stage of spermatogenesis exposed to radiation, and that the radiation-induced signal also persists and destabilizes the F2 germline; (2) transgenerational effects were also observed in neutron-irradiated (0.4 Gy) C57BL/6 and X-irradiated (1 Gy) BALB/c mice; and (3) there were clear differences in the levels of spontaneous and transgenerational instability in the order BALB/c > CBA/H > C57BL/6. In summary, these data permit the conclusion that the instability associated with radiation-induced germ cell mutations at the ESTR loci persist for at least two generations.
Direct Studies of ESTR Mutations in Mouse Sperm
In a recent paper, Yauk and colleagues (2002) have reported on mouse experiments involving single molecular polymerase chain reaction (PCR) analysis of genomic DNA for studying spontaneous and radiation-induced mutations at the Ms6-hm locus. These X-irradiated male mice (1 Gy) were killed 10 weeks postirradiation, and spermatozoa collected from caudal epididymis from the mice were screened for mutations. The findings were that (1) significant increases in mutation frequency could be detected, with the magnitude being similar to that established by conventional pedigree analysis, and (2) the majority of mutations resulted from small gains or losses of three to five repeat units.
Radiation-Induced Mutations at Human Minisatellite Loci
Studies After the Chernobyl Accident and Around the Semipalatinsk Nuclear Test Site
Dubrova and colleagues (1996) first reported on radiation-induced minisatellite mutations among children born between February and September 1994 to parents who were continuously resident in the heavily polluted rural areas of the Mogilev district of Belarus following the Chernobyl accident. Blood samples were collected from 79 families (father, mother, and child) for DNA analysis. The control sample consisted of 105 nonirradiated Caucasian families from the United Kingdom, sex-matched to the offspring of the exposed group. DNA fingerprints were produced from all families by using the multilocus minisatellite probe 33.15 and two hypervariable single-locus probes, MS1 and MS31. Additionally, most families were profiled with the minisatellite probes MS32 and CEB1. For the Mogilev families, the level of 137Cs contamination was used as a dose measure, and the families were divided according to the median 137Cs contamination levels into those inhabiting less contaminated areas (<250 kBq m−2) and those inhabiting more contaminated areas (>250 kBq m−2).
The data showed that the frequency of mutations (1) was higher by a factor of about 2 in the children of exposed families relative to control families and (2) showed a correlation with 137Cs contamination levels as demarcated above. The authors suggested that these findings were consistent with radiation induction of germline mutations but also noted that other nonradioactive contaminants from Chernobyl, such as heavy metals, could be responsible. These results have been subject to criticism on the grounds that the U.K. control population was ethnically and environmentally different and therefore inappropriate for comparisons (UNSCEAR 2001). Furthermore, from the data presented, it would seem that the estimated germline doses in the whole region remain sufficiently uncertain to question the true significance of an approximately twofold difference in mutation frequencies.
In a subsequent extension of the above study, Dubrova and colleagues (1997) recruited 48 additional families and used five additional probes and found that the data confirmed the approximately twofold higher mutation rate in exposed families compared to nonirradiated families from the United Kingdom. In these studies, (1) approximate individual doses for chronic γ-ray exposures were computed for 126 families in the exposed group using published data on the annual external and internal exposure to 137Cs in soil, milk, and vegetables and family histories after the Chernobyl accident; (2) the parental dose for each family was taken as the mean value of the paternal and maternal doses up to conception of the child; (3) families within the exposed group could be divided according to the median of the distribution, into less exposed (<20 mSv) and more exposed (>20 mSv); and (4) the mutation rate in the latter was significantly higher than in the former, and both were higher than in the unexposed UK controls.
Further evidence showing an increase in minisatellite mutation frequencies has also been obtained from two studies, one in the Kiev and Zhitomir regions of Ukraine that sustained heavy radioactive contamination after the Chernobyl accident (Dubrova and others 2002b) and another at the Semipalatinsk nuclear test site in Kazakhstan (Dubrova and others 2002a). In the Ukraine investigation, the control and exposed groups were composed of families containing children conceived before (n = 98) and after (n = 240) the Chernobyl accident. Eight hypervariable minisatellite probes (CEB1, CEB15, CEB25, CEB36, MS1, MS31, MS32, and B6.7) were used.
A statistically significant 1.6-fold increase in mutation rate was found in the germline of exposed fathers, whereas the maternal germline mutation rate was not elevated. More than 90% of the children in the exposed cohort came from the most heavily radioactively contaminated areas of Ukraine, with a level of surface contamination from 137Cs of >2 Ci/km2. According to gamma spectrometric measurements of radionuclide concentration in soil and measurements of external exposures (γ-exposure rate in air), the whole-body doses from external exposures did not exceed 50 mSv, and similar doses from the ingestion of 137Cs and 134Cs for the Ukrainian population were also reported. The authors note that that all of these doses are well below all known estimates of the DD for mammalian germline mutation of 1 Sv (Sankaranarayanan and Chakraborty 2000b; UNSCEAR 2001) and, therefore, cannot explain the 1.6-fold increase in mutation rate found in exposed families
Between 1949 and 1989, the Semipalatinsk site was the former Soviet Union’s premier test site for 456 nuclear tests; it was closed in 1991. The surrounding population was exposed mainly to the fresh radioactive fallout from four surface explosions conducted in 1949, 1951, 1953, and 1956, and the radioactive contamination outside the test zone currently is assessed to be low. A total of 40 three-generation families around the test site (characterized by the highest effective dose >1 Sv) along with 28 three-generation nonirradiated families from a geographically similar noncontaminated rural area of Kazakhstan were included in the study (Dubrova and others 2002a). Note that the above dose estimate cited in the paper is from Gusev and colleagues (1997; based mostly on external radiation), and the World Health Organization (WHO 1998) states that the estimates range from <0.5 Sv to 4.5 Sv. All parents and offspring were profiled with the eight hypervariable minisatellite probes previously used in the Belarus and Ukraine studies. The mutation rates in the P0 and F1 generations were established from the observed frequencies, respectively, in the F1 and F2 generations (controls and exposed progeny).
The findings were (1) in the controls, the spontaneous mutation rates in the P0 and F1 generations were similar;
(2) in the irradiated groups, the P0 rate was significantly higher (1.8-fold) and the F1 rate was nonsignificantly (1.5-fold) higher compared to controls; and (3) plotted against the parental year of birth (1950–1960, 1961–1965, and 1966–1974), the mutation rate in the exposed F1 generation showed a negative correlation (i.e., decreased) with the parental year at birth, with the highest rate in the 1950–1960 cohort (similar to that in the P0 families) and much lower in the later two time periods (similar to that in the control cohorts).
The authors have interpreted these findings as follows: (1) all P0 parents born between 1926 and 1948 would have been directly exposed to relatively high levels of radiation from the nuclear tests, and this would explain the 1.8-fold increase in mutation rate; (2) F1 parents born between 1950 and 1956 would be heterogeneous with respect to the doses received: some would also have been exposed to high radiation doses, while those born later would have received considerably lower doses, and this heterogeneity in the parental doses could explain the 1.5-fold increase in mutation rate; and (3) the negative correlation with the year of birth may reflect the decreased exposure after the decay of radioisotopes in the late 1950s and after the cessation of surface and atmospheric nuclear tests.
Other Population Studies
In the mid-1990s, subsequent to publication of the radiation studies with mouse ESTR loci discussed earlier, Kodaira and colleagues (1995) conducted a pilot feasibility study on germline instability in cell lines established from the children of atomic bomb survivors in Japan. The cell lines were from 64 children from the 50 most heavily exposed families (combined gonadal equivalent dose of 1.9 Sv) and 50 children from control families. Mutations at six minisatellite loci were studied using the following six probes: Pc-1, 8TM-18, ChdTC15, p8g3, 8MS1, and CEB1. A total of 28 mutations were found, but these were at the p8g-3, 8MS-1, and CEB-1 loci only, and there were no mutations at the other three loci. Twenty-two of these were in the controls (of 1098 alleles tested; 2%), and six were in children from irradiated parents (among 390 alleles; 1.5%). Thus, there was no significant difference in mutation frequencies between the control and the exposed groups. The use of probes 33.16 and 33.15 in subsequent work did not alter the above conclusion (Satoh and Kodaira 1996; Satoh and others 1996).
The discrepancy between the results of Kodaira and colleagues, on the one hand, and those of Dubrova and colleagues (1996, 1998b, 2000a, 2000b) in the Belarus and other cohorts discussed earlier appears real. To what extent this might be due to differences in type and duration of radiation exposure remains unclear. For instance, the A-bomb survivors were externally exposed to considerable acute doses of radiation, whereas in the Belarus, Ukraine, and Semipalatinsk studies the exposures were chronic (both internal and external). Secondly, in the case of A-bomb survivors, most of their children were born more than 10 years after the single, acute parental exposure; in Belarus and Ukraine, however, the affected areas have been irradiated constantly since the Chernobyl accident. Finally, the Japanese data are derived from families in which most of the children were born to parents of whom only one had sustained radiation; in the work of Dubrova and colleagues, the data pertain to children for whom both parents had been exposed to chronic irradiation.
Livshits and colleagues (2001) found that the children of Chernobyl cleanup workers (liquidators) did not show an elevated rate of minisatellite mutations compared to a Ukrainian control group. The dose estimate for the liquidators was <0.25 Gy but is subject to uncertainty (Pitkevich and others 1997), and the main exposure was from external γ-irradiation (with a relatively minor contribution from the intake of radionuclides) received as repeated small daily doses. Interestingly, children conceived within 2 months of the fathers’ employment had a higher mutation rate than those conceived more than 4 months after the fathers stopped working there. This would be consistent with an effect on cells undergoing spermatogenesis, but not on spermatogonial stem cells. However, none of these differences was statistically significant.
More recently, Kiuru and colleagues (2003) compared the frequencies of minisatellite mutations among children of 147 Estonian Chernobyl cleanup workers. The comparisons were within families (i.e., between children born before and after their fathers were exposed to radiation). The post-Chernobyl children (n = 155) were conceived within 33 months of their fathers’ return from Chernobyl; the “control” children were siblings (n = 148) born prior to the accident. Mutations were studied at eight minisatellite loci (CEB1, CEB15, CEB25, CEB36, MS1, MS31, MS32, and B6.7). The estimated mean dose to the workers was 100 ± 60 mSv, with fewer than 1.4% of the cohort receiving more than 250 mSv.
A total of 94 mutations (42 in the pre-Chernobyl group and 52 in the post-Chernobyl group) were found at the eight tested loci. Within-family (i.e., pre- and post-Chernobyl) comparisons of mutation rates showed that the post-Chernobyl children had a slightly but not significantly higher mutation rate (0.042 per band) than the pre-Chernobyl children (0.035 per band) with an odds ratio of 1.33 (95% CI: 0.80, 2.20). The available data do not permit an assessment of the extent to which differences in paternal age might have contributed to this difference. When the cleanup workers were subdivided according to their radiation doses, the mutation rate in children born to fathers with recorded doses of 200 mSv, showed a nonsignificant increase relative to their siblings; at lower doses there was no difference.
Weinberg and colleagues (2001) screened children born in families of cleanup workers (currently either in Ukraine or Israel) for new DNA fragments (‘mutations’) using “multisite DNA fingerprinting.” In contrast to the results of Livshits and colleagues (2001), they reported a sevenfold
increase in mutation rate in these children compared to those conceived before the Chernobyl accident and external controls. However, the mutants were detected using random amplified polymorphic DNA-PCR, an unreliable technology. These mutants were not validated and had no obvious molecular basis (Jeffreys and Dubrova 2001).
Studies of Cancer Patients
There are some limited data on minisatellite mutations detected directly in sperm sampled from cancer patients who have sustained radiotherapy and/or chemotherapy (Armour and others 1999; May and others 2000; Zheng and others 2000). All of these studies used the so-called small-pool PCR approach (SP-PCR) originally developed for the analysis of spontaneous mutations at human minisatellite loci (Jeffreys and others 1994). While this method can overcome the small sample size limitations encountered in pedigree analysis, a major shortcoming of the SP-PCR approach, compared to the pedigree approach, is the very large variation in spontaneous mutation rates of individual alleles at a single locus. Although SP-PCR can be used to evaluate the mutation rate in the same male before and after mutagenic treatment, it does not allow amplification of very large minisatellite alleles (longer than 5 kb), thus restricting mutation scoring to a subset of relatively small minisatellite sizes.
In the first of these studies (Armour and others 1999), sperm DNA of two men exposed to the anticancer drugs cyclophosphamide, etoposide, and vincristine, plus 2.2 Gy of X-rays (scattered radiation from mediastinal radiotherapy), were analyzed for mutations at the MS205 locus known to have a high germline mutation rate (~0.4–0.7% per gamete). There were no significant differences in mutation frequencies in the pretherapy and posttherapy samples (11 and 16 months, respectively, in the two individuals). Mutation rates were 0.38% versus 0.47% in the former and 0.10% versus 0.11% in the latter. It should be noted, however, that in mouse experiments, cyclophosphamide is mutagenic only in postmeiotic germ cells, etoposide (a topoisomerase II inhibitor) is mutagenic only in meiotic cells, and vincristine is not mutagenic, although it is known to prevent the assembly of tubulin into spindle fibers (Witt and Bishop 1996; Russell and others 1998).
In the second study (Zheng and others 2000), sperm DNA from 10 men treated for Hodgkin’s disease (with different combinations of chemotherapeutic agents plus 2.5 Gy of abdominal X-rays) were analyzed using the MS205 locus. Nine patients treated with either vinblastine or adriamycin and bleomycin did not show any increases in mutation frequency. Vinblastine binds to tubulin and, in mice, results in aneuploidy but not chromosome breakage or mutations. Adriamycin is an intercalating agent and an inhibitor of topoisomerase-II, and in mice, this compound is toxic to germ cells but does not cause mutations (Witt and Bishop 1996). Bleomycin, a radiomimetic agent, selectively targets mouse oocytes, but no mutation induction in male germ cells has been observed. The only patient treated with procarbazine + oncovin + prednisone (for six cycles with 3–4 week intervals between cycles) showed a slight increase in mutation frequency (1.14% versus 0.79%). Procarbazine is known to be mutagenic to mouse spermatogonia.
In the work of May and colleagues (2000), sperm DNA samples from three seminoma patients who underwent orchiectomy and external beam radiotherapy were used to study induction of mutations at the B6.7 and CEB1 loci. These men received 15 fractions of acute X-irradiation, with a total testicular dose (from scattered radiation) ranging between 0.4 and 0.8 Gy. No induced mutations were found.
ANNEX 4G: DOUBLING DOSES ESTIMATED FROM GENETIC DATA OF CHILDREN OF A-BOMB SURVIVORS
The most recent DD estimates consistent with the Japanese data are those of Neel and colleagues (1990). These were expressed as “end-point-specific minimal DDs” excluded by the data at specified probability levels and “most probable gametic DD” (note that all of these are for the acute radiation conditions obtained during the bombings). For example, the minimal DDs at the 95% probability level were the following: 0.05 to 0.11 Sv (F1 cancers); 0.18 to 0.29 Sv (UPO); 0.68 to 1.10 Sv (F1 mortality); 1.60 Sv (sex-chromosomal aneuploidy), and 2.27 Sv (electrophoretic mutations). When only UPO, F1 cancers, and F1 mortality were considered together, the estimated DD at the 95% probability level was 0.63 to 1.04 Sv. The comparable estimate for sex chromosomal aneuploidy and electrophoretic mutations considered together was 2.71 Sv.
The oft-quoted DD range of 1.69 to 2.23 Sv, called the “most probable gametic DD” by Neel and colleagues, was obtained by calculating overall spontaneous and induced “mutation rates” for the above-mentioned five end-points and obtaining a ratio of these two. The former was estimated by summing the five individual estimates of spontaneous rates (which yielded 0.00632 to 0.00835 per gamete) and the latter, likewise, by summing the individual rates of induction (which yielded 0.00375 per gamete per parental Sv). The ratio 0.00632-0.00835/0.00375 is the DD range which is 1.69 to 2.23 Sv. The overall DDs thus calculated were found to be between 1.69 Sv (i.e., 0.00632/0.00375) and 2.23 Sv (i.e., 0.00835/0.00375) for the acute radiation conditions during the bombings. In these estimates, the limits reflect biological uncertainties about the parameters, but do not take into account the additional error inherent in the estimation process itself, which must be relatively large (Neel and others 1990). With a dose-rate reduction factor of 2 (which was used) for chronic low-LET radiation conditions, the relevant DD becomes about 3.4 to 4.5 Sv. Note, how-
ever, that the dose-rate reduction factor traditionally used by UNSCEAR and the BEIR committees is 3, based on specific locus mutation experiments with male mice.
For reasons discussed in the main text, the DDs estimated from these data cannot readily be compared with those used by UNSCEAR and the BEIR committees. However, the results with one indicator of damage used in the Japanese studies, namely, untoward pregnancy outcome, which includes stillbirths, congenital abnormalities, and early neonatal deaths, permit a crude comparison with the risk of congenital abnormalities estimated in this report. The rate of induction defined by the regression coefficient for UPO is (26.4 ± 27.7) × 10−4 per parental sievert, compared to the background risk of 500 × 10−4 assumed in the calculations. The risk of congenital abnormalities (estimated from mouse data in this document) is 60 × 10−4 per Gy−1 for acute X-irradiation, compared to the background risk (human data) of 600 × 10−4. Considering the uncertainties involved in both of these estimates, one can conclude that they are of the same order.
The other end points—namely, F1 mortality, F1 cancers, sex chromosomal aneuploidy, and electrophoretic mobility or activity mutations—that have been used in the Japanese studies have not been used in this report and so do not lend themselves to comparisons. It should be noted that the first two of the above (i.e., F1 mortality, F1 cancers) are multifactorial traits (similar to UPO), and their responsiveness to an increase in mutation rate will depend on the magnitude of the mutation-responsive component, which is quite small, as Neel and colleagues point out. Consequently, the rates of induced genetic damage underlying these traits are expected to be small, and increases will be undetectable with the available sample sizes at the relatively low radiation doses (about 0.4 Sv) sustained by most of the survivors.
The reasons for the lack of significant effects on sex chromosomal aneuploidy and electrophoretic mutations are different. There is no evidence from mouse studies that radiation is capable of inducing chromosomal nondisjunction (the principal basis for the origin of sex chromosomal aneuploidy). Since radiation is a poor inducer of point mutations, a priori one would not expect electrophoretic mutations to be induced by radiation to any great extent as they are known to be due to base-pair changes. Null enzyme mutations would be expected to be induced, but they are unlikely to be found at the low dose levels experienced by most survivors. Consequently, it is not surprising that the DD estimates of Neel and colleagues for these end points (1.60 Sv for sex-chromosomal aneuploids and 2.27 Sv for electrophoretic mutations) are higher than those for the other end points.


