
C
Global Trends in MSE Patents
ALL PATENTS
Before looking at the indicators for some MSE subfields, looking at the global trends in patenting will help identify baseline trends against which MSE-specific trends can be compared. The number of patents awarded to inventors located in the United States and in 10 other key countries—France, Germany, Italy, Switzerland, and the United Kingdom formed the Euro5 group and China, India, Japan, South Korea, and Taiwan, the Asia5 Group—was measured over a 25-year period in 5-year increments. The data in Figures C.1 and C.2, from the U.S. Patent and Trademark Office (USPTO), show that the United States dominates the overall share of U.S. patents awarded, with its total share of 53 percent outstripping the combined share of the Euro5 Group and Japan. However, caution is warranted and advisable because of what is called the home advantage. The Organisation for Economic Co-operation and Development’s (OECD’s) Compendium of Patent Statistics reports that data drawn from a single patent office display a bias whereby proportionate to their inventive activity, domestic applicants are more likely to file for patents in their home country than foreign inventors (see Figure C.3).
The OECD has developed a set of indicators based on a set of patents taken at the European Patent Office (EPO), the Japanese Patent Office (JPO), and the USPTO. Using these indicators eliminates the home advantage while also eliminating lower-value patents, which are unlikely to be patented in all three locations. An analysis of the geographic distribution of these indicators is shown in Figure
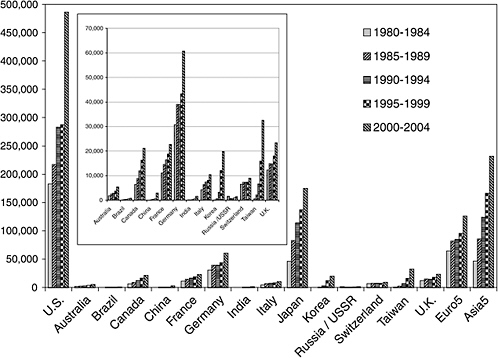
FIGURE C.1 Number of U.S. patents in all classes awarded between 1980 and 2004 (up to October 21, 2004). The Euro5 data combine the data for the five West European countries, and the Asia5 data combine the data for the five Asian countries. The insert shows the data without the data from Japan, the United States, and the Euro5 and Asia5 groups. SOURCE: USPTO.
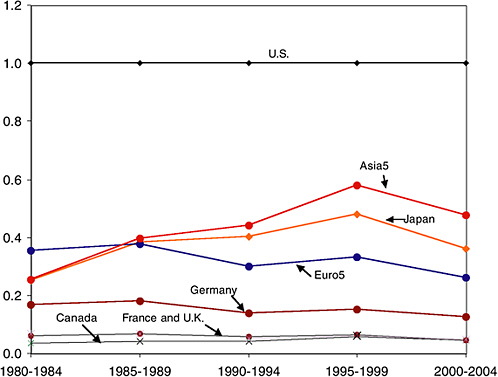
FIGURE C.2 Patent data for all classes normalized to U.S. numbers to show relative activity. The United States remains dominant over time. The divergence of the Asia5 and Japan data lines show emerging patent activity in Taiwan, Korea, China, and India. The dip in share for Asia and Europe in the last 5-year period is linked to a jump in U.S. patent activity over the same period, perhaps linked to the high-tech economic boom of the late 1990s. SOURCE: USPTO.
C.4, which shows the ranking in terms of share. The United States, Japan, and the European Union dominate the ranking. The U.S. and EU shares did not change significantly between 1991 and 2000, while the Japanese share decreased. Countries often associated with the globalization of R&D—such as China, India, Korea, and Taiwan (“Chinese Taipei” according to OECD nomenclature)—have very small overall shares. Nevertheless, each shows significant increases in share over the last decade of the 20th century. Figure C.4 shows an increase in share for many countries, with the notable exceptions of France, Japan, and Switzerland. However, globalization is more than simply an absolute increase in international activity, so it is helpful to look at patterns in transnational patent ownership. Figure
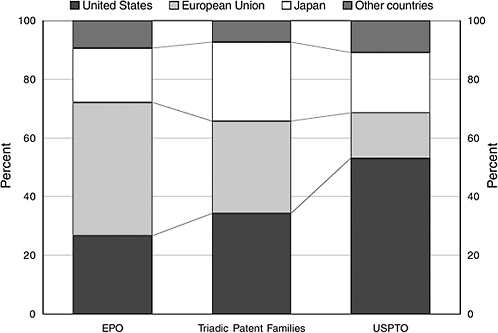
FIGURE C.3 The columns at the left and right show the geographic distribution (location of the inventor) of patent applications at the European Patent Office (EPO) and the U.S. Patent and Trademark Office (USPTO). Clearly, European inventors are the largest grouping at the EPO and U.S. inventors are the largest grouping at the USPTO. The skewing of patent data toward domestic inventors is clear. The middle column shows totals for what the OECD terms “triadic patent families,” that is, inventions for which patent applications are presented at all three agencies—the EPO, the USPTO, and the Japanese Patent Office (JPO). The skewing of patent data toward domestic inventors is clear. SOURCE: OECD, Compendium of Patent Statistics 2004, © 2004.
C.5, Figure C.6, and Figure C.7 all indicate an increase in transnational activity—for instance, in many countries a growing share of patents is owned by firms registered in other countries, a sign of increasing global activity in R&D with concomitant increases in global and transnational ownership and collaboration.
MSE PATENTS
The data presented here are part of a limited and focused analysis of the trends in the country of residence recorded for the inventors associated with MSE patents awarded by the USPTO over the last 25 years in certain key and well-defined MSE
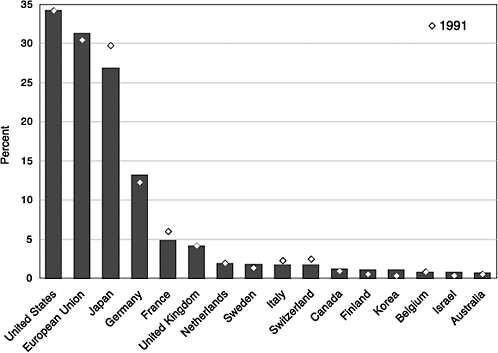
FIGURE C.4 Share of various countries in 2000 based on the country of residence of the inventors. The bars show the data for applications lodged in 2000 at the USPTO, EPO, and JPO. The diamonds show the same information for 1991. U.S. inventors are the largest grouping, accounting for 34.3 percent of applicants, similar to their 1991 share. Between 1991 and 2000 the EU’s share increased by a percentage point, to 31.4 percent, whereas Japan’s share declined by around 3 percentage points, to 26.9 percent. (Note that the percentages do not add to 100. This is due to the double counting of EU members.) SOURCE: OECD, Compendium of Patent Statistics 2004, © 2004.
subfields. Notwithstanding the weaknesses associated with a one-patent-office methodology, such a methodology can be useful in understanding the extent to which U.S. dominance has changed over time. The data were gathered from the online USPTO database.1
Patents of interest were identified by their associated international (World Intellectual Property Organization) category or by searching for a keyword in the patent title. The number of inventors from countries with well-established and
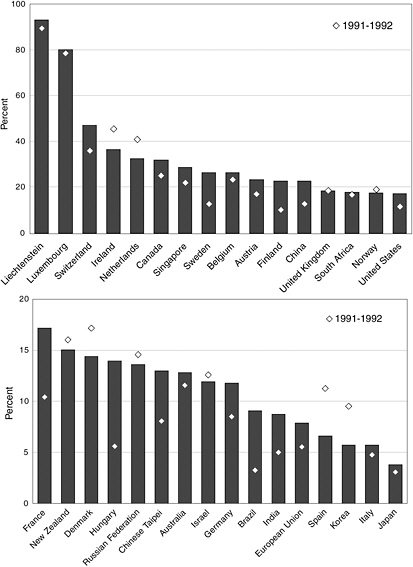
FIGURE C.5 Ownership of inventions made elsewhere according to the country of residence of the patent applicant. (The patent applicant and inventor need not be the same, and they might not be located in the same country.) The bars show the data for 1999–2000 and the diamonds show the data for 1991–1992. Note the change of scale on the left-hand axis between the upper and lower charts. These data show, for example, that over 90 percent of the patents applied for by applicants in Lichtenstein are for inventions made in other countries. The ownership of inventions made elsewhere is high in small, open economies. This is partly explained by the presence in such countries of the headquarters of multinational corporations with R&D activities elsewhere. In terms of absolute numbers, the United States and Germany are the largest owners of inventions made in other countries, but because they also generate much intellectual property domestically, their overall ranking in the above ownership data is low. SOURCE: OECD, Compendium of Patent Statistics 2004, © 2004.
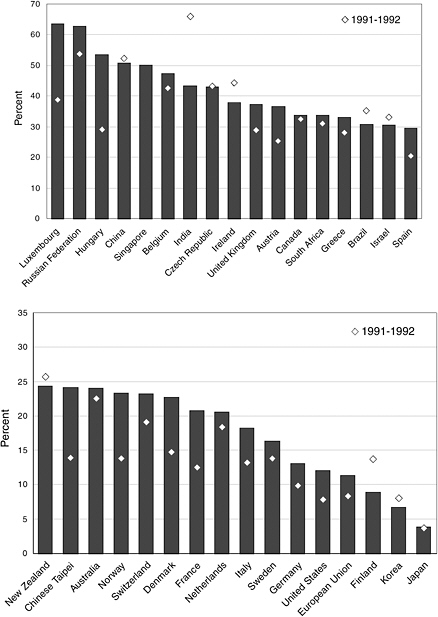
FIGURE C.6 Foreign ownership of domestic inventions according to the country of residence of the inventors. The charts are based on data from the EPO. The bars show the data for 1999–2000 and the diamonds show the same information for 1991–1992. Note the change of scale on the left-hand axis between the upper and lower charts. These data show, for example, that over 60 percent of the owners of patents for inventions made in Luxembourg are resident in another country. It is clear that as corporations relocate their R&D activities abroad an increasing share of technology is owned by entities that are not in the same country as the inventor. SOURCE: OECD, Compendium of Patent Statistics 2004, © 2004.
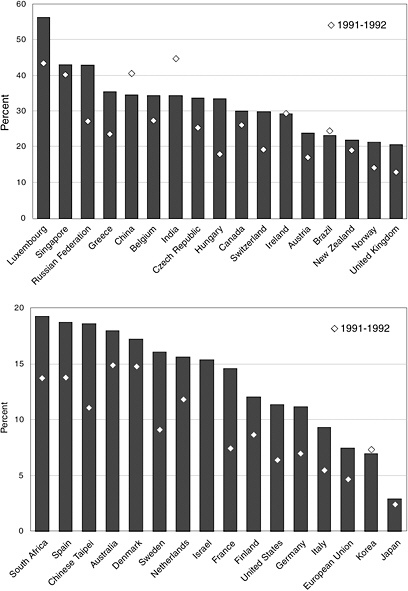
FIGURE C.7 Percentage of patents with at least one foreign coinventor, according to the residence of the inventors. The bars show the data for 1999–2000 and the diamonds show the same information for 1991–1992. Note the change of scale on the left-hand axis between the upper and lower charts. These data show, for example, that about 55 percent of patent applications from Luxembourg have at least one coinventor not from Luxembourg. NOTE: The EU is treated as one country; intra-EU cooperation is excluded. As R&D becomes a more global activity, the number of patents with a foreign coinventor should increase. The data shown here are for applications to the EPO with at least one foreign co-inventor. They show an increase in the share of patents with foreign coinventors during the 1990s. Two exceptions are China and India, where there may be an increase in domestic-only activity. SOURCE: OECD, Compendium of Patent Statistics 2004, © 2004.
emerging levels of activity in MSE were recorded. The subfields chosen for this analysis were alloys, catalysts, ceramics, magnetic materials, and composites. Data were gathered on the basis of the location of the inventors recorded on the patent approval record. For each subfield, the trend in the number of patents for inventors located in each country—and for the Asia5 and Euro5 compilations—is shown over a 25-year period in 5-year increments. In addition, the data are shown normalized to the U.S. number of patents. A country with a “share” of 1, measured in this way, has as many patents with inventors from that country as does the United States in that time period.
Alloys
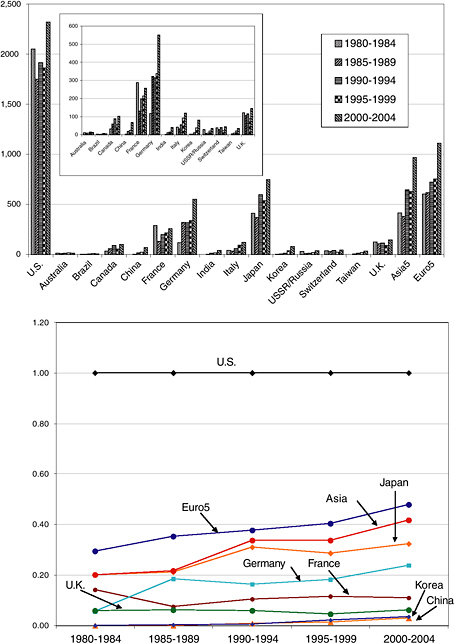
Figure C.8 shows the distribution of patents in the alloys subfield2 organized by the recorded country of the inventors listed in the patent database and the country-by-country share, normalized to U.S. activity in the same period.
The data indicate that patent applications in the alloys subfield are dominated by scientists and engineers in the United States, Japan, and Western Europe. The Asia5 numbers are dominated by those from Japan. The number of patents originating in the United States remained fairly steady over the last 25 years, around 550 patents a year. Japan has significantly increased its absolute number of patents (from 251 to 653 in the period reported), and its share relative to U.S. activity surged, surpassing the United States in the mid-1990s. Western Europe has had a steady increase in activity by this measure, and within the five countries surveyed, French-based inventors show the strongest increase in number of patents awarded. Western Europe’s share, measured against that of the United States, has increased by 50 percent over the 25 years measured, from 30 percent to 47 percent.
It is clear from the data for all classes of patents at the USPTO over the same period (Figure C.2) that the rise in the Japanese and European share of U.S. patents in all classes vis-à-vis that of the U.S. has remained fairly steady over the last 25 years—with, if anything, a small decrease in the European share. Comparing the alloys data with the data for all classes leads to the conclusion that the Japanese and European share of activity in alloy R&D, as measured by patent data, has significantly increased in the last 25 years and that the United States has lost its leadership position to Japan. The rise in the share of Japanese- and French-originated patents is not a consequence of an overall increase in their share in all technology fields; rather, it appears that the trends in alloy patenting are different from those in patenting as a whole.
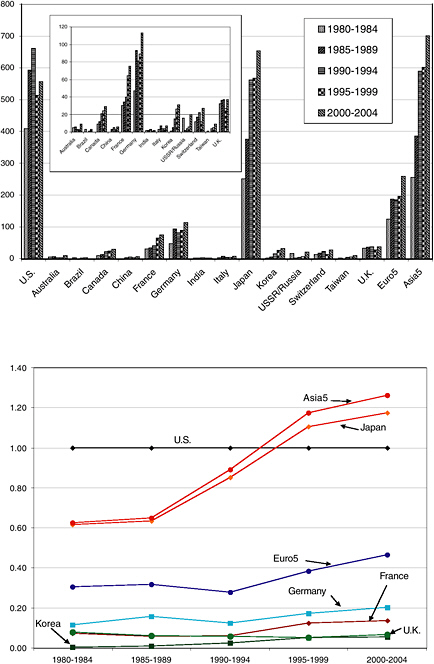
FIGURE C.8 Above: number of U.S. patents awarded between 1980 and October 21, 2004, related to alloys research. Insert shows the data without Japanese, United States, and Euro5 data. Below: number of patents for each 5-year search period normalized to the number of U.S.-originated patents. SOURCE: USPTO.
Another key question is whether there is evidence of changing activity in countries that, unlike Japan or the European countries, have not had a high profile in MSE R&D. The data for alloy research show that while the number of patents awarded with inventors in China and Korea—the two strongest nontraditional performers—has increased, the absolute numbers remain an order of magnitude behind those for Europe, Japan, and the United States. The apparent increase in activity, however, may indicate the early stages of the effects of globalization of this type of R&D in Asia—a very recent and still emerging trend. The divergence in the share factor for Japan and Asia in Figure C.8 (bottom) also indicates the emergence of activity among the four Asian countries other than Japan. It is also worth noting that the number of patents in this field from inventors from the Russian Federation surged in the last decade to levels seen in the Soviet Union in the early 1980s, which included inventors in now-independent states such as Ukraine.
Catalysts
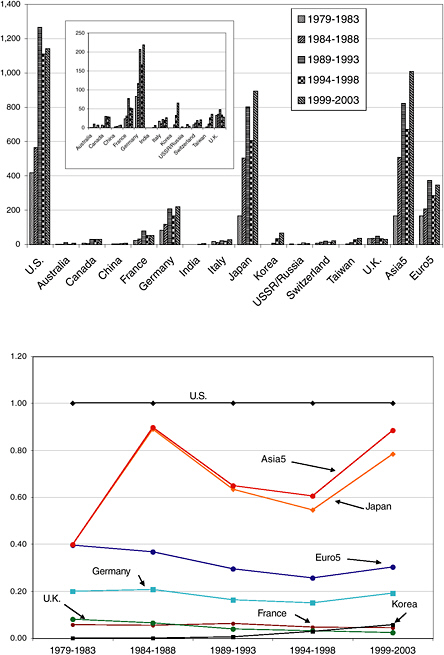
Figure C.9 shows patent data for catalysts for the same periods and the same countries as the alloy analysis above.3 The trends are quite different from those for alloys.
The dominance of the United States in catalyst patents is persistent and clear, with over twice as much patent activity associated with American inventors as for inventors from the European and Asian groupings. However, the number of patents awarded from Europe and Asia show significant increases relative to the U.S. numbers in absolute numbers and in share, with Japan, Germany, and Italy in particular demonstrating a surge in patent numbers and France being a strong participant in the sector but with relatively flat numbers.
The numbers of patents associated with inventors from the emerging centers of R&D—China, India, Korea, and Taiwan—all show substantial increases over 25 years ago, when they had no few or no patents in this classification. As with alloys, while the relative surge in these countries is strong, the number of patents remains an order of magnitude lower than the numbers in Japan and Western Europe and two orders of magnitude lower than in the United States. Once again Russia shows a return to the numbers it was achieving 25 years ago, but activity is slight.
Ceramics
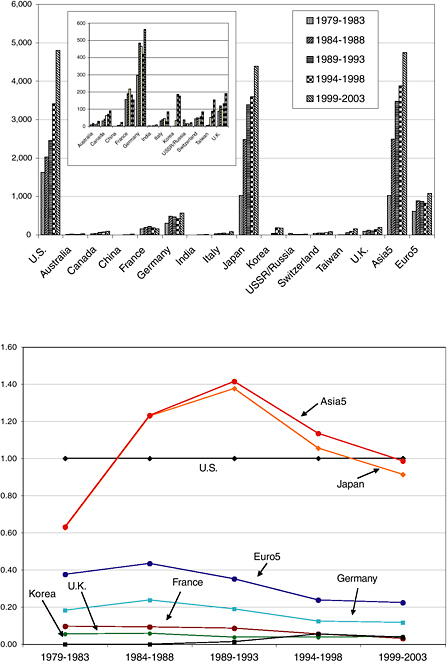
Figure C.10 shows the “ceramics” patent data at the USPTO.4 Patenting activity is dominated in this subfield by the United States and Japan. The number of patents awarded with inventors in Japan jumped significantly at the beginning of the 1980s, with recent data indicating activity on a par with inventors in the United States. Given the home advantage from the use of U.S. patent data, it is possible that Japan has in fact equaled or surpassed the United States in the last decade. Activity in Europe is running at about half that in the United States and Japan. Germany dominates European activity but has remained fairly steady in terms of share over the last 25 years. The Euro5 grouping shows a small decrease over the same period. The share for the Asia5 grouping diverges from the Japanese share as activity has increased in the emerging four since 1990. Taiwan and Korea show the strongest increases in performance, but the absolute numbers remain very low.
Magnetics
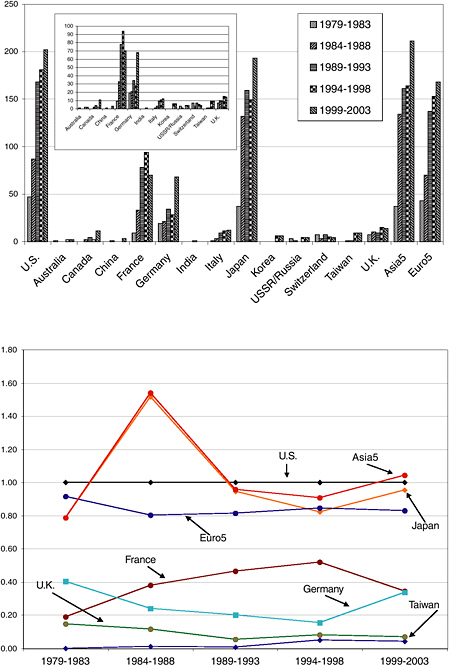
Figure C.11, based on magnetic materials patent data from the USPTO,5 shows significant growth in the patenting of magnetic technology over the last 20 years. Patent outputs from the United States and Japan have grown side by side, with activity over the last 5 years in both countries outperforming the combined activity of the five European countries by a factor of 4. Europe’s share has decreased over the last 20 years primarily because its number of patents was static at a time when Japan and the United States were surging. The share data show a divergence between Japan and the Asia5 grouping owing to significant increases in output, primarily from Taiwan and Korea, although as with the other subfields the absolute numbers of patents with inventors from these countries remains low.
Composites
Figure C.12 shows the data for composite materials patents at the USPTO.6 The data show an increase in global research on composite materials over the last 25 years, with the output from the United States, Asia, and Europe about on a par.
Activity in Europe is dominated by Germany and France. Patent output with inventors from Italy shows a significant upturn, while activity in the United Kingdom and Switzerland remains static. It appears from the data that the United States lagged behind Japan in the mid-1980s but has caught up since. Again, activity in Taiwan and Korea has emerged over the last 10 years, but overall numbers remain low for both countries. Compared with other subfields, research in composites is occurring in only a small number of countries, with emerging actors such as China and India having displayed no significant U.S. patenting activity.
GLOBALIZATION TRENDS AS SEEN FROM PATENT DATA
Although there are significant differences in the indicators for the five subfields chosen for this analysis, some general trends emerge:
-
In each subfield the United States is the world leader or among the world leaders.
-
Japan and Western Europe are the closest rivals for leadership. Japan appears to have surpassed the United States in alloys and appears ready to surpass the United States in ceramics.
-
Global activity in all the subfields examined is diversifying, with significant increases in activity in Asian countries that so far have not had substantial activity in these fields.
-
Notwithstanding the global diversification of research activity, the number of patents associated with inventors from the emerging centers remains low.


