
Multispectral Imaging of Paintings in the Infrared to Detect and Map Blue Pigments
John K. Delaney,1 Elizabeth Walmsley,1 Barbara H. Berrie,1 and Colin F. Fletcher2
SUMMARY
Spectral imaging for conservators offers the promise of providing a non-destructive tool for the identification of artists’ materials in situ, as well as determining their spatial distribution in an artwork. In this paper spectral imaging in the reflective infrared (IR) spectral region (0.7 to 2.5 microns) is examined for its potential to discriminate and identify blue pigments in paintings. The blue pigments considered are azurite, indigo, Prussian blue, lapis lazuli, cobalt blue, ultramarine, and thalo blue. Toward this end, visible to shortwave infrared diffuse reflection spectra of the blue pigments in both powder and paint forms were collected to determine the optimal spectral region to discriminate among these pigments. The measured spectra show that these blue pigments have large and varied reflectance in the near infrared (NIR, 0.7 to 1.0 microns) to shortwave infrared (SWIR, 1 to 2.5 microns) as compared to the visible spectral region. The large reflectance variation suggests the ability of broadband multispectral imaging (MSI) (< ~15 spectral bands, bandwidths of a few 100 to a few 10s of nm) to separate and support identification of these blue pigments in situ and to map their distribution. To test this, visible and infrared cameras were equipped with spectral band filters to allow collection of multispectral images of test panels and
two paintings known to contain a subset of the blue pigments listed above were imaged.
The reflectance spectra of the test panels obtained using cameras were found to correlate to those obtained using the benchtop spectrometers. Multispectral imaging of two paintings by Vincent van Gogh provided reflectance spectra consistent with the presence of the blue pigments Prussian blue, cobalt blue and ultramarine and gave information on the distribution of the pigments in the works by utilizing spectral band ratio images and false color composites. The identification of the pigments was confirmed using air-path X-ray fluorescence spectroscopy and energy dispersive spectrometry. The results show that multispectral imaging, either in numerous spectral bands from the visible to SWIR, or in a judicious selection of bands, can be a powerful tool to aid in pigment identification and distribution in paintings especially when combined with sample-based pigment identification methods such as X-ray fluorescence spectroscopy or analysis of cross-sections.
INTRODUCTION
Spectral imaging (or Imaging Spectrometry), the collection of images in separate spectral bands in order to obtain reflection spectra, has been shown to be a powerful tool for geophysical remote sensing (1). The method also provides the spatial distribution (maps) of materials, such as minerals and agricultural crops, across the imaged region.
The scientific examination of paintings often begins with the identification of the base set of pigments used by an artist. When identifying and determining the spatial distribution of pigments in a work of art, conservators begin with a visual inspection of the artwork. Subsequently, analytical methods, both destructive and non-destructive, are used in the classification and identification of pigments. Most of these techniques are applied to small areas of the painting either because they are destructive (that is, involve removing a sample from the work for analysis using polarized light microscopy or other techniques) or, if non-destructive, are too cumbersome and expensive to apply across the painting (e.g., air-path X-ray fluorescence spectroscopy, Raman spectroscopy). Although powerful, these techniques provide only localized information, and sampling sites are limited and may be biased. A less precise analytical methodology is used to extrapolate the results of “point analysis” to the rest of the artwork. The identification of pigments in un-sampled regions is often made through visual association. Success often depends on the ability to identify various pigments by their color. This hinders the ability to form general conclusions about the distribution of materials throughout the artwork. This can lead not only to misidentifications but also the possibility that some materials may not be discovered. Consequently, there has been growing interest in the development of methods that do not require sampling and provide information on spatial distribution.
One such method is visible reflectance spectroscopy using high-resolution spectra acquired from a limited number of sites in an artwork (2, 3, 4). This methodology is useful for helping to accurately define the color and has been used for pigment identification utilizing spectral reference databases (2, 5). It is especially useful for pigment identification when it is extended to include the infrared region (6, 7, 8). However, the technique suffers from the same limitation of the other non-destructive methods, i.e., small sample sizes and the lack of an analytical methodology to sample the entire painting. Simply extending the number of sample sites over the entire painting would allow, in principle, the determination of the possible pigment composition at each site in the painting. Extending high-resolution visible spectral analysis to large areas of a painting is problematic. The ability to acquire high fidelity visible reflectance spectra (<5 nm band pass) of entire paintings is beyond the resources of conservation laboratories. Using visible spectroscopy alone to identify pigments having similar colors is challenging because of the small inherent reflectance differences among them, which are further reduced and confounded by the presence of scattered light associated with varying pigment particle size, and the collection/illumination geometries.
In this paper, we investigate the use of infrared reflectance spectroscopy to aid in separating similar-appearing pigments and provide sufficient spectral data to be an adjunct to pigment identification. One motivation comes from the success of remote sensing reflectance spectral imaging, with its well-developed methodology for the identification of mineral deposits, and because numerous artists’ paints consist of ground minerals. Some success in applying this technique to works of art has already been achieved (6,); Casini et al. have differentiated between two yellow pigments in a painting by Pontormo (7).
A well-designed reflectance spectral imaging system requires a compromise between the desired spectral and spatial resolutions. While the goal is to acquire high-quality reflectance spectra with the smallest sample size over the target area of interest (here the entire painting), the signal-to-noise requirements, instrument and data handling complexity force compromise. Increasing spectral resolution requires a reduction in spatial resolution and vice versa. Knowledge of the expected range of artists’ materials to be encountered, their spectral properties, and their particle size can be used to select the spectral and spatial resolutions required for identification and mapping of the pigments.
The pigments typically encountered in paintings are either mineral or organic and as such their visible reflectance spectra are determined by broad electronic transitions that account for their color. There are overtones and combinations of vibrational transitions in the near infrared (NIR, 0.7 to 1.0 microns) to shortwave infrared (SWIR, 1 to 2.5 microns). In solids, the vibrational absorption bands have widths ca. 20 nm or wider which determines a limiting spectral resolution required for acquisition of spectra. While measurement of the position of vibrational overtone bands may be useful for unique identification of materials, designing instruments at this level of resolution (i.e., 20 nm) may be unnecessary.
Many minerals have slowly changing, large amplitude reflectance variations, larger than 0.1, in the NIR to SWIR (9), which can be sampled with > 0.1 micron bandwidths. Thus collection of broadband multispectral images (> 0.1 micron bandwidth) appears to be sufficient for material separation and to support pigment identification.
The focus of this work was to optimize spatial sampling and utilize broader spectral resolution compared to benchtop instrumentation, that is to use multi-spectral reflectance imaging. This was applied over a larger spectral region than the visible with the expectation of providing a more robust discrimination tool for pigment identification. This methodology is suitable for conservators who are used to collecting broadband images of paintings in the ultraviolet, visible and infrared (10).
EXPERIMENTAL
In this study the reflectance spectra and multispectral images of six blue pigments are measured and analyzed. The pigments include mineral ores (azurite, lapis lazuli); colors manufactured by industrial processes (Prussian blue, thalo blue, cobalt blue, and synthetic ultramarine), and organic materials (indigo). The colorant in lapis lazuli and synthetic ultramarine is chemically the same and is treated as one pigment here.
A three-part experimental approach was employed. First, the collection of high-resolution diffuse reflectance spectra of six blue pigments in both pressed powder and paint (linseed oil binder) at expected thickness on a chalk ground. Second, the collection of broadband spectral images of the paint test panels to investigate the correlation between spectral images and high-resolution spectra. Third, the collection of spectral images of paintings to determine the ability of multispectral imaging to separate and identify blue pigments in situ.
Test Panels
Test panels of paint were constructed as previously described (10). The panels consist of paintouts of pigments hand-ground in linseed oil for azurite, lapis lazuli, Prussian blue, and indigo. Commercial oil paint was used for cobalt blue (Charbonnel) and thalo blue (Fezandie & Sperrle). The azurite, lapis lazuli, Prussian blue, indigo, and thalo blue paints were applied to a white chalk ground and the cobalt blue paint on a gesso ground.
Diffuse Reflection Spectra of Pigments and Paints
Diffuse reflectance spectra of seven dark blue pigments, in pressed powder form and from the test panels, were collected using either a Nicolet System 510
interferometer spectrometer or a Beckman Instruments UV 5240 dual beam grating interferometer, both equipped with an integrating sphere.
Multispectral Imaging Instrumentation and Procedures
The multispectral images were obtained in the visible, near infrared, and shortwave infrared spectral regions using cameras fitted with band pass filters. A Sony XC-77 camera fitted with narrow band pass filters was used to acquire the visible/NIR (0.45-1.0 microns) image sets. The silicon monochrome video charge-coupled device (CCD) camera had a 25 mm f/1.6 lens. The filters (Corion Inc.) were 0.40 micron bandwidth filters in 0.50 micron increments over the range 0.45-1.0 microns. A Mitsubishi M600 PtSi or a Kodak PtSi 310-21X thermal imager was used to collect the SWIR (1.0 to 2.0 microns) image sets. Each camera was fitted with a 55 mm f/1.2 Nikon lens. Images of La Mousmé were collected using 1.2 (0.09 microns FWHH) and 1.6 (0.5 microns FWHH) micron broadband filters. Infrared images of details of the two paintings, the Self-Portrait and La Mousmé, were captured using three broadband filters: 1.1-1.4 microns (Astronomy J, Barr Associates), 1.5-1.8 microns (Astronomy H, Barr Associates), and 2.0-2.4 microns (Astronomy K, Barr Associates). Diffuse illumination was used to light the scene, typically using a pair of Lowell Tota lights with FDN Q5000T3/4 quartz halogen lamps (500 W, 3200 K) and photographers’ umbrellas. Black and white Spectralon (Labsphere) diffuse reflection targets (1 inch diameter) were used for in-scene calibration of the camera to reflectance. The low standard was 2-3 percent reflective over the range 0.45-2.4 microns, and the high standard was 98-99 percent reflective over 0.45-2.4 microns. Non-uniformity of the detector response was corrected using a gray card. For each test panel or painting, a set of 8 to 15 images was captured. In the multispectral image sets of the paintings, the paint test panels and Spectralon reflection standards were included in each image. The Spectralon standards were used to convert the digital counts of the image sets to reflectance units. Each multi-spectral experiment was repeated several times.
A Macintosh computer with a Perceptics Pixelbuffer card or a Scion AG5 PCI card was used to capture the images. A variety of image processing programs (Scanalytics IP Lab Spectrum, Adobe Photoshop, NIH Image, Research Systems Inc. ENVI 3.4) was used in the analysis, non-uniformity, and calibration of the data sets. Registration and warping of the visible-NIR images with the SWIR image set was performed using ENVI. Spectral image data cubes were constructed and analyzed in ENVI.
X-ray Fluorescence Spectroscopy
Non-destructive X-ray fluorescence spectroscopy (XRF) was performed using a Kevex 0750A spectrometer. The air-path instrument was equipped with a
secondary target made from pressed barium chloride. This allowed simultaneous measurement of X-rays from ca. 2 eV to 45 eV. Pigments composed of light elements, for example, ultramarine, cannot be detected using this instrumentation.
Optical Microscopy and Other Analysis of Cross Sections
Pigments from the top layer of paint were obtained by gently scraping the surface of the painting using a surgeon’s scalpel. A Leica MPX microscope was used to examine the particles mounted in Cargille MeltMount (refractive index 1.66) on glass slides using polarized light microscopy. The same particles or others could be mounted on a carbon planchet (stub) for examination by scanning electron microscopy (SEM) and energy dispersive spectrometry (EDS). A double-sided sticky carbon tab was used to adhere the particle to the planchet. If the particles could not be examined owing to charging they were coated with carbon. A JEOL 6300 scanning electron microscope with an Oxford Tetra backscattered electron detector was used for SEM. For EDS measurements an Oxford Inca 300 system was used with an Oxford Super ATW Si(Li) detector.
Cross-sections were obtained from cracks or areas of loss. The fragments were mounted in Bioplastic® then cut to expose the layer structure of the paint. The sections were polished on SiC grit papers (Micromesh) and examined using optical microscopy and SEM-EDS.
RESULTS AND DISCUSSION
Diffuse Spectra of the Blue Pigments and Paints
The six blue pigments have similar reflectance spectra in the visible region with few features. However, the spectra demonstrate larger and more varied changes in reflectance in the reflective infrared (0.7-2.5 microns) (Figure 1). Reflectance peaks for all the pigments are centered near 0.44 microns, and all display a strong absorption in the red. The mineral samples, azurite and lapis lazuli, have a transition to increased reflectance in the NIR (0.7 to 1 microns), azurite lagging behind lapis lazuli. In the SWIR (1 to 2.5 microns) both pigments have near-constant reflectance. In contrast, the pigments indigo and thalo blue show a rapid rise to high reflectance, peaking at ca. 1.5 microns and decreasing beyond that. Prussian blue’s transition to higher reflectance occurs at about 1.35 microns. Cobalt blue has the most variable reflectance in the IR, becoming highly reflective in the NIR and weakly reflective in the high-energy side of the SWIR, between 1.3 and 1.6 microns, and moderately reflective at wavelengths > 1.6 microns.
For all of the pigments the variations in reflectance amplitude through the IR region are large, > 0.1, and occur over spectral regions wider than 0.1 microns. These large, but slowly varying, changes in reflectance are suitable to be followed
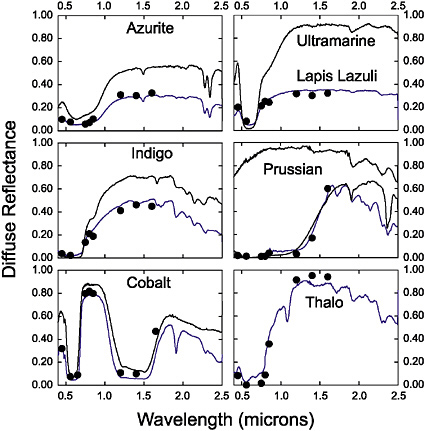
FIGURE 1 Diffuse reflectance spectra of six blue pigments in powdered form (dark line) and in oil-bound paint (blue line). The powder samples were optically thick. Synthetic ultramarine in powdered form was used instead of powdered lapis lazuli (natural ultramarine). The paint layers were generally 15-25 microns, a thickness often encountered in paintings. The reflectance spectrum of the chalk ground is given in the Prussian blue plot (top solid black curve). Reflectance values derived from multispectral images (solid circles) of the blue paint test panels (Figure 2) were obtained using spectral band pass filters.
using broadband multispectral imaging. However, increased spectral resolution and sampling (~10 nm) would allow the collection of vibrational lines such as the -O—H stretch in azurite that could be useful to characterize certain pigments.
In Old Master paintings pigments are bound in organic binders (e.g., drying oils, egg tempera) and applied in thin layers over preparatory ground layers containing calcium carbonate (chalk) or calcium sulfate (gesso). As a result the reflectance spectra of the pigment and corresponding paint made from it may differ for several reasons. To test the influence of the binders on the reflectance spectra
in the IR, diffuse reflectance spectra of the blue paints were collected (Figure 1). The possible effects of the binders on the reflectance spectra are (1) decrease in the amount of first surface reflectance (the intensity of reflectance spectra are reduced), (2) alteration of the depth of “color” from absorption (some scaling), (3) filtering of the pigment reflection by absorption properties of the binder (added spectral lines or shape changes). The spectra of the test panels compared to the powdered pigments show these effects occur. However, the general shape of the reflectance spectra of the pigments in paint is preserved with an offset (white light scatter) and scaling. Additionally, owing to the increasing transparency of the pigments in the SWIR, vibration bands from the preparatory layer may be observed in some cases.
Linseed oil as a binder acts to reduce the difference in refractive index at the first interface with air and thus reduces the intensity of the first surface reflectance. For particles larger than the wavelength of light (e.g., azurite) this results in a decrease in the ‘white light’ reflectance, hence the reflectance curves shift downward. Since the paints on the test panels do not represent infinitely thick layers, there is also a change in the total absorption and hence a scaling change between powder and paint arises. The binder can act as a spectral filter owing to its own absorption. Linseed oil has little absorption in the visible to infrared, but some of the commercial paint films (e.g., cobalt blue) appear to have additional bands in the IR. High reflectance correlates with low absorption, thus the underlying preparatory ground or underpaint layers may contribute to the reflectance spectra. The contribution of the ground to the reflectance spectrum becomes significant when the paint becomes transparent owing to decreased absorption and scattering in the SWIR. It is dependent on the thickness of the paint film. The addition of absorption features from the ground to the spectrum of Prussian blue at wavelengths beyond 1.6 microns may be noted. The general reflectance signatures are, however, maintained between bulk pressed powder and oil-bound pigments. In the samples painted on a chalk or gesso ground, which itself has a high reflectance in the visible to the SWIR, the paints appear to mimic the scattering of the optically thick powder samples.
Multispectral Imaging of Paint Samples
To examine the extent to which diffuse reflectance spectra of pigments can be modeled by using imaging cameras available to conservators, multispectral images of the paint swatches were collected (Figure 2). Two cameras, one sensitive in the visible/NIR and one in the SWIR, each outfitted with bandpass filters, were used to sample the visible/NIR and SWIR spectral regions. For in-scene calibration, the reflectance of the ground and carbon black were used as standards.
The reflectance values derived from the multispectral images of the test panels show good agreement with the reflectance spectra measured using the benchtop reflectance spectrometer (Figure 1), demonstrating that the image collection
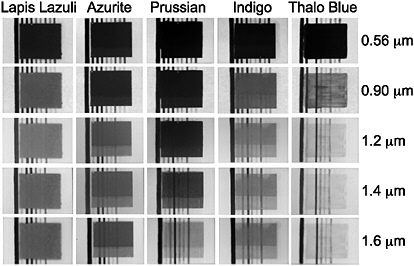
FIGURE 2 Multispectral images of test panels with blue paint swatches. By column, from left to right: Lapis lazuli (natural ultramarine), azurite, Prussian blue, indigo, and thalo blue. Center wavelength of spectral band pass filter, by row, from top to bottom: 0.56, 0.90, 1.2, 1.4, and 1.6 microns. The images show varying changes in the reflectance of the different pigments in the infrared and their increased transparency.
method is adequate. This shows that these blue pigments can be distinguished from each other using only the multispectral images. This ability exists despite the fact that the measurements on the powdered pigment samples were performed using an integrating sphere, whereas the imaging of the panels and the works of art were performed with a narrow collection solid angle. Given the near-Lambertian nature of the samples’ reflectance, and the near-diffuse illumination, the close to superimposition of the spectral data should not be surprising. These results demonstrate that by utilizing multispectral imaging techniques the reflectance of the blue pigments can be characterized adequately to distinguish among them and ideally to identify them.
In geophysical remote sensing applications, materials of interest are encountered in optically thick, granular form, like the powdered pigment samples. However, as noted earlier, in works of art the pigments are in thin paint layers. In regions of high reflectance, an increase in the transparency of the paint layer can be observed (compare Figures 1 and 2). The preservation of the spectral reflectance properties between paint and powder pigments and the maintenance of high reflectance of the bound pigments appear to be due to the high reflectance of the ground. A light-absorbing ground or pigment underneath would however alter the reflectance spectra. Thus the effect of layering of thin paint films that occurs in artwork needs to be considered. Since almost all pigments become transparent by 1.5 microns (10), collection of spectral images from 1.5 to 2.5
microns seems to be of little utility for their identification. It is the property of increasing transparency in this region that allows the detection of underdrawings in paintings using infrared reflectography (10).
Multispectral Analysis of Paintings to Characterize Blue Pigments
To demonstrate the ability of multi-spectral imaging to discriminate and identify blue pigments in situ, two paintings by Vincent van Gogh in the collection of the National Gallery of Art, Washington, D.C., were examined using the technique. The paintings were selected because they have large regions of bright to dark blue paints. Moreover, results from site-specific analysis techniques such as XRF, polarized light microscopy and SEM-EDS were available, and the paintings contain the pigments Prussian blue, cobalt blue, and ultramarine.
The first painting imaged was La Mousmé, by Vincent van Gogh (1888, Chester Dale Collection, 1963.10.151) (Figure 3, visible light image; see also www.nga.gov/search/index.shtm). Van Gogh describes this painting in his own words (11):
The portrait of the girl is against a background of white strongly tinged with emerald green, her bodice is striped blood red and violet, the skirt is royal blue, with large yellow-orange dots. The mat flesh tones are yellowish-grey; the hair tinged with violet; the eyebrows and eyelashes are black; the eyes, orange with Prussian blue. A branch of oleander in her fingers for the two hands are showing.
Prussian blue has a large change in reflectance at ~1.35 microns where the pigment becomes less absorbing (Figure 1). Other blue pigments do not have as large an absorbance change over this interval. To identify areas of the painting where Prussian blue occurs, a ratio image was created by dividing an image acquired at 1.6 microns by one acquired at 1.2 microns. In the ratio image, passages where Prussian blue is present have a ratio of absorbance >1 in comparison to passages where ultramarine, cobalt blue, or indigo are present. The ratio image of La Mousmé (Figure 3) shows bright (high reflectance ratio) features having higher reflectance at 1.6 than at 1.2 microns, which can be assigned to Prussian blue. The spectral ratio image in the IR indicates that, in the visible image, the dark lines of the chair, the dark lines outlining the flowers, the outline of the girl’s hair and to a lesser extent some daubs of paint on her skirt and some of the stripes on her blouse are painted using Prussian blue. The lack of large reflectance changes in some of the darker and brighter blue regions of the visible image suggests the use of a different blue pigment there.
To more confidently assign the regions identified in the band ratio image of La Mousmé, multispectral images in 11 spectral bands from the visible to the SWIR were collected from an 8 × 10-inch section of the painting. Each spectral band image was collected using a visible/NIR or SWIR camera fitted with bandpass
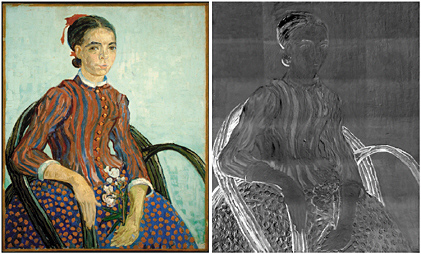
FIGURE 3 Vincent van Gogh’s La Mousmé (1888). (Left) Visible light image. (Right) Shortwave infrared spectral band ratio image creaed from two infrared composite images captured at 1.2 microns and at 1.6 microns. The bright areas are regions where the reflectance of the painting is higher at 1.6 microns than at 1.2 microns, and thus indicate both the probable presence of Prussian blue and where it occurs in high concentration within the painting. Each IRR composite comprises a mosaic of 24 flat-field-corrected images.
filters in an arrangement similar to that typically used for collecting infrared reflectograms. The image sets were converted to reflectance units using the in-scene reflectance standards. A multispectral image cube (a 3-D image where z is the spectral band and x,y are spatial locations) was then constructed and the images registered using tie points. The visible color image in Figure 4, generated from an MSI cube using the 0.45, 0.55, and 0.65 micron images, shows a detail of La Mousmé captured with the reference standards and blue test panels.
Verification of the reflectance calibration of the MSI cube was determined by comparing the image-derived spectra of “in-scene” blue test panels with the prior high-resolution spectra obtained with the benchtop spectrometer (Figure 4A). Qualitatively these two match (compare Figure 1 with Figure 4A). The image cube spectra derived from the blue test panels were a reasonable fit to the spectra acquired using benchtop instrumentation after scaling and a small amount of translation. Specifically only a small translation for Prussian blue (0.04 offset) and scaling for lapis lazuli (0.87×, 0.03 offset) and cobalt blue (0.75×) (see Figure 4A) were required to get a good match. Since the illumination of the test panels alone, versus in the scene of the painting, are different some transitional and scaling changes are not unexpected.
Reflectance spectra derived from the multispectral image cube of the painting itself support the assignment of Prussian blue to bright areas of the ratio
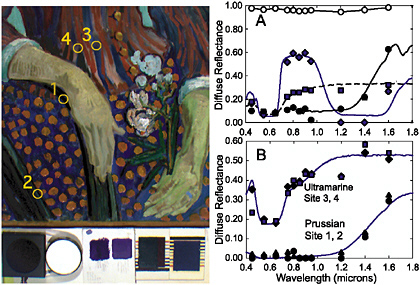
FIGURE 4 Multispectral image analysis of a detail of La Mousmé showing the presence of two different blue pigments. The multispectral image cube consists of 11 spectral bands from the visible through the SWIR. (Left) Visible color composite of spectral images obtained at 0.65, 0.55, 0.45 microns. Along the bottom, from left to right, are black and white reflectance standards (2 and 98 percent Spectralon standards) and blue pigment test panels: cobalt (two swatches), Prussian blue, and lapis lazuli. (Right) A. Plots of reflectance, derived from the multispectral images of the reference panels: high reflectance 98 percent Spectralon (open circles), cobalt blue swatch (solid blue diamonds), Prussian blue (solid black circles), and lapis lazuli (blue squares). The blue and black lines are scaled diffuse spectra. B. Plots of reflectance derived from the multispectral images of the sites 1 to 4 in the detail image. Sites 1 and 2 (black circles and triangles) are in the chair. Sites 3 and 4 are in the blue stripes on the blouse.
image (Figure 3) of La Mousmé. The image-derived spectra of the bright regions in the ratio image that map to the dark blue areas of the visible image most closely resemble the reference spectrum of Prussian blue paint test panel and powdered pigment (Figure 4B). Spectra from two sites on the chair rail (Figure 4B, sites 1, 2) are reasonably well described by the reference spectrum of Prussian blue scaled 0.53. Based on this spectral sensitivity, these areas can be determined to contain Prussian blue. Not all the blue stripes on the blouse are bright in the 1.6/1.2 micron ratio image, suggesting the presence of another pigment (Figure 3 and Figure 4, sites 3, 4). The image-based reflectance spectra show high reflectance in the NIR to SWIR (0.8 to 1.6 microns, Figure 4B, sites 3, 4) that is consistent with the reflectance behavior of indigo or ultramarine and not Prussian or cobalt blue. A scaled diffuse reference spectrum of ultramarine powdered pigment (0.39×,
0.17 offset) matches the measured spectra reasonably well. The reflectance spectra thus show that at least two blue pigments were used in this painting.
The painting has other passages of the dark blue, for example, the outlines of the buttonholes on the girl’s blouse and the top of the flowers she is holding. Visual inspection of the painting alone might suggest that these could be Prussian blue as well. However, the ratio image does not show the strong reflectance changes associated with Prussian blue. A detail from images obtained at 1.2 and 1.6 microns shows the dark blue outlining the flowers is dark at 1.2 microns and light at 1.6 microns (Figure 5), whereas the dark blue outlining the buttonholes is not apparent in either the image obtained at 1.2 or at 1.6 microns. The reflectance spectra derived from the multispectral image cube show the dark lines of the flowers are similar to Prussian blue (0.53 scaling of reference spectra), but the buttonholes are not (Figure 5). The reflectance spectra of the dark blue outlining
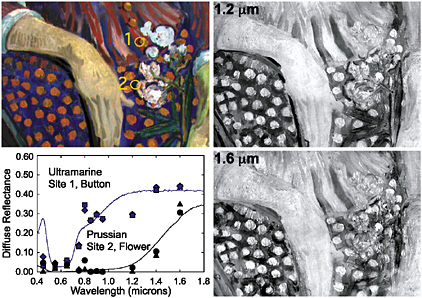
FIGURE 5 Multispectral image analysis of a detail of La Mousmé showing the use of two different dark blue pigments for outlining. The multispectral image cube consists of 11 spectral bands from the visible through the SWIR. (Top left) Visible color composite of spectral images obtained at 0.65, 0.55, 0.45 microns. (Top right) Infrared reflectogram of the detail area obtained at 1.2 microns and (Bottom right) 1.6 microns. Infrared image obtained at 1.6 microns shows the change in reflectance from 1.2 microns for the dark outline of the girl’s flowers, but not the buttonholes. (Bottom left) Plots of reflectance derived from the images of the dark lines outlining the button (blue diamonds and squares) and flower (black circles and triangles). The solid blue and black lines are diffuse reflectance spectra of the paints using the ultramarine and Prussian blue test panels (after scaling).
the buttonhole shows an earlier rise in reflectance than Prussian blue, more like some of the blue stripes on the blouse. A scaled and offset reference spectrum of ultramarine (0.42×, 0.02 offset) does pass though the majority of data in the red and infrared suggesting this blue pigment is present. Confirmation of ultramarine at these sites was provided by SEM/EDS analysis, which also showed the presence of zinc oxide (ZnO). Both the spectra and SEM/EDS are consistent with the pigment in this area being ultramarine.
Thus the blue pigments in the La Mousmé painting have been discriminated into Prussian blue and ultramarine blue. The ratio image of the area in combination with the MSI cube suggest that Prussian blue was used in the chair, the outline of the flowers in her hand, and in strokes of the girl’s hair, eyebrows, lips and some stripes of her jacket. The reflectance spectra derived from the image cube suggest that the dark outline of the buttonholes and the blue outlines around the spots on the girl’s skirt were painted using ultramarine. Cobalt blue, a pigment that van Gogh used often, does not appear to have been used for painting La Mousmé.
X-ray fluorescence spectroscopy indicated the presence of cobalt in the background of Vincent van Gogh’s Self-Portrait (1889, Collection of Mr. and Mrs. John Hay Whitney, 1998.74.5) (Figure 6, visible light image; see also www.nga.gov/search/index.shtm). A spectral image cube of a region of the painting shows that it can be used to find the locus of cobalt blue. The multispectral image cube of Self-Portrait gives reflectance spectra from the background that are similar to that of the blue cobalt blue test panel (Figure 6). A false color image, made by assigning the infrared image to the red channel shows the distribution of cobalt blue in the painting (Figure 6). Cobalt blue is extensively used in the background and also in the jacket, although spectra from the jacket are complex, indicating a mixture of pigments here.
CONCLUSIONS
This report contributes to the body of work that demonstrates the utility of spectral imaging not only for discrimination among pigments but also to determine their spatial distribution within a work of art. While reflectance spectroscopy is a relatively less specific analytical tool than other analytical chemical tools, it is non-destructive and can be readily applied to the entire artwork. Its power lies in helping to define the set of pigments used in the work, and identifying regions of high concentration and thus directing site-specific, more powerful analytical tools such cross-section analysis, XRF, and SEM/EDS for more thorough chemical analysis. Moreoever, in the case of Prussian blue, the reflectance spectra in the infrared may be a more definitive assignment method than XRF given the high tinting strength of Prussian blue. The results here demonstrate that extending the multispectral imaging method to include the infrared
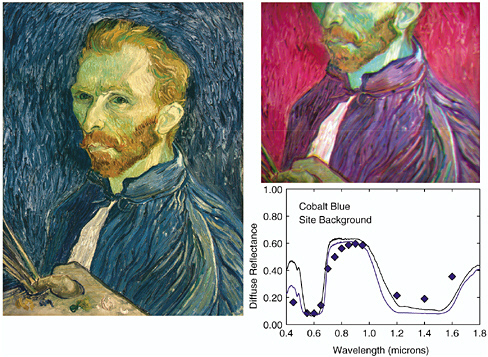
FIGURE 6 Multispectral image analysis of a detail of van Gogh’s Self-Portrait (1889). The distribution of cobalt blue is indicated in the false color image by the color red. The multispectral image cube consists of 13 spectral bands from the visible through the SWIR. (Left) Visible light image. (Bottom right) Plots of reflectance derived from the image of the background (solid diamonds). The solid blue and black lines are scaled diffuse reflectance spectra of the cobalt blue paint (blue) and powder (black). (Top right) False color infrared composite of spectral images obtained at 0.90, 0.55, 0.45 microns. This image renders the cobalt blue to appear “red” thus showing the cobalt is present in a large proportion in the background and a smaller proportion in the jacket.
can improve the success of spectral imaging in pigment identification and discrimination given the large and varied reflectance changes in these regions, in particular when the visible spectra of pigments are similar. Large and slowly varying reflectance changes in the infrared allow the utilization of broadband MSI techniques, simplifying the methodology.
This study of two paintings demonstrates that multispectral imaging in the visible and NIR regions can be employed as a useful tool in the scientific examination of paintings. We have demonstrated that the optical properties of pigments in the infrared display diagnostic features which can be employed to assign and map pigments, and that these features can be detected using conventional imaging techniques, including modeling of reflectance spectra and ratioing images
obtained at different wavelengths. It is difficult to infer this information from conventional techniques, which rely on a limited number of micro-samples. The advantages of the technique are tempered by the increased complexity of the reflectance spectra owing to particle size variation and increasing transparency in the infrared.
Conservators and conservation scientists utilizing imaging systems currently available can apply the power of visible and infrared multispectral imaging to their work.
ACKNOWLEDGEMENTS
This research forms part of an ongoing project at the National Gallery of Art on applications of infrared imaging. Over the past ten years, we have benefited from discussions and assistance from many people, including Dr. Jack Salisbury, who gave us access in 1994-95 to his laboratory at Johns Hopkins University in order to collect the diffuse reflectance spectra of the samples, and Mr. Dana D’Aria, who assisted us in the collection of the spectra; Raymond Rehberg, David L Clark, and Rollo E Black, of Eastman Kodak, who provided generous assistance using the Kodak thermal imager; Elizabeth Freeman, Kristi Dahm, Lucy Bisognano, and Laura Rivers, who helped with the image captures; Dr. Lisha Glinsman, who provided the results of XRF data on the Self-Portrait; and Dr. René de la Rie and Mr. Ross Merrill, Chief of Conservation, for their continued interest. An early phase of this research was supported by the Circle of the National Gallery of Art.
REFERENCES
1. A. F. H. Goetz, G. Vane, J. E. Solomon, and B. N. Rock, “Imaging Spectrometry for Earth Femote Sensing,” Science, 228, 1147-1153.
2. Guillaume Dupuis, Mady Elias, and Lionel Simonet, “Pigment Identification by Fiber-Optics Diffuse Reflectance Spectroscopy,” Applied Spectroscopy, 56, (2002), 1329-1336.
3. Otto Hahn, Doris Oltrogge, and H. Bevers, “Coloured Prints of the 16th Century: Non-Destructive Analyses on Coloured Engravings from Albrecht Dürer and Contemporary Artists,” Archaeometry, 46, (2004), 273-282.
4. Mauro Bacci and Marcello Picollo, “Non-Destructive Spectroscopic Detection of Cobalt(II) in Paintings and Glass,” Studies in Conservation, 41(3), (1996), 129-135.
5. Roy S. Berns, Jay Kreuger, and Michael Swicklik, “Multiple Pigment Selection for Inpainting Using Visible Reflectance Spectrophotometry,” Studies in Conservation, 47, (2002), 46-61.
6. Elizabeth Walmsley, John K. Delaney, Barbara H. Berrie, Dana D’Aria, Colin Fletcher, and Jack Salisbury, “Pigment Identification in Artworks by MultiSpectral Imaging in the Near Infrared [abstract],” Final Program of the 34th Annual Eastern Analytical Symposium ’95, Somerset, NJ; section “Imaging for Conservation,” 66.
7. Andrea Casini, Franco Lotti, Marcello Picollo, Lorenzo Stefani, and Ezio Buzzegoli, “Image Spectroscopy Mapping Technique for Non-Invasive Analysis of Paintings, Studies in Conservation, 44 (1999), 39-48.
8. Applied Spectroscopy Laboratory of the Institute of Applied Physics “Nello Carrara” of the Italian National Research Council and the Restoration Laboratory of the Opificio delle Pietre Dure, Fiber Optics Reflectance Spectra (FORS) of Pictorial Materials in the 350-1000 nm range database, http://fors.ifac.cnr.it/index.php.
9. Dana D’Aria and Jack Salisbury, Johns Hopkins University Spectral Library, http://speclib.jpl.nasa.gov.
10. Elizabeth Walmsley, Catherine Metzger, John K. Delaney and Colin Fletcher, “Improved Visualization of Underdrawings with Solid-State Detectors Operating in the Infrared,” Studies in Conservation, 39, (1994), 217-231.
11. The Complete Letters of Vincent van Gogh, 3 vols. Boston (1958). Letter 518.


