
3
Properties of Measurements and Measurement Systems for Airborne Agents
MONITORING SYSTEM PROPERTIES
Methods of Detection
Current monitoring systems used at stockpile disposal facilities to detect the presence of chemical agent in the ambient air and measure its concentration use an approach that involves air sampling. In this approach, the air being sampled is passed through a column containing an adsorbent for a certain period of time, after which the adsorbed molecules are thermally desorbed into a gas chromatograph (GC) equipped with an element-selective detector. The magnitude of the signal from the detector can usually be enhanced by increasing the volume of air passing through the adsorbent, resulting in the collection of additional agent. Selectivity is gained both by the GC separation and the use of an element-selective detector. This approach is discussed in detail in Chapter 4.
Other instruments that can be considered by the Army to measure the concentration of chemical agents in the ambient air are usually based on one of three principles: optical spectroscopy, mass spectrometry, or chemical sensing. These principles are briefly described below and are discussed in more detail in Chapter 5.
Optical Spectroscopy
All chemical agents absorb ultraviolet and infrared radiation at certain specific wavelengths. Most optically based instruments, such as Fourier transform infrared (FT-IR) spectrometers, measure the fraction of radiation absorbed by agents at one or more of these wavelengths, from which the concentration of the agent is calculated. Other optical techniques that have been proposed for monitoring chemical agents are based on the interaction of the agent molecules with a beam of monochromatic light. This interaction may involve inelastic scattering (Raman spectroscopy) or absorption of the light by the analyte followed by re-emission at a longer wavelength (fluorescence spectroscopy).
Mass Spectrometry
Mass spectrometric techniques involve ionizing the analyte by either soft ionization, in which the analyte molecules remain intact during the ionization process, or hard ionization, in which the analyte decomposes into ionized fragments. The ions that are formed are passed through a magnetic and/or electric field where they are separated on the basis of their mass-to-charge ratio (m/z). When the separation is effected under a high vacuum, this technique is known as mass spectrometry. When the ions are separated by passing them through a gas at atmospheric pressure under a high electric field, the technique is known as ion mobility spectroscopy.
Chemical Sensing
Several new molecular-level chemical sensing systems that involve the binding of the chemical target species to a surface receptor to generate an electrical or optical signal are under development. Array-based sensors employing cross-reactive sensing materials have been used to identify chemical agents in a variety of background environments. New sensing materials with higher sensitivities and specificities for chemical agent detection are being developed; these include novel polymers and nanostructured materials. In addition, complete detection systems based on microfluidics and/or microelectromechanical systems (MEMS) have been developed for chemical agent detection.
Open-Path and Point Monitoring
As noted above, current practice at stockpile sites involves a two-step process to measure trace levels of
chemical agents in the ambient air. The analytes (along with many other molecules present in the air) are first collected on a suitable adsorbent by passing the sampled air through the adsorbent for a certain duration. At the end of this time period, the collected molecules are rapidly desorbed and passed into the instrument that is used for their detection and quantification (typically a GC equipped with an element-selective detector). Because the air that is sampled originates from one particular location, this approach is known as point monitoring. The equipment used for point monitoring may be permanently mounted at a specific location or mounted on a suitable vehicle so that sampling may be effected at different locations with a single instrument.
Point monitoring has the great advantage that the sample may be preconcentrated for a time, allowing the determination of agents at very low concentration. There are two main disadvantages of point monitoring techniques, however. First, the agent may be adsorbed on the tubing through which air is passed to reach the adsorbent; in this case, the reported concentration will be less than the true value. Second, the air that is being sampled may need to be passed through the adsorbent for several minutes or even hours in order to collect enough agent to give a detectable signal; thus, the concentration of the agent cannot be measured in real time (i.e., less than 10 seconds). If the time between successive measurements is less than 15 minutes, the measurement is said to be made in near real time (NRT). For measurements using current chemical agent monitoring technology at or near the general population limit (GPL), several hours are typically needed to preconcentrate the agent molecules to a detectable level. This approach is called historical monitoring.
The only way that the concentration of chemical agents can be monitored in real time (i.e., less that 10 seconds) is to eliminate the preconcentration step and to determine the molecule in situ. When this type of measurement is made by passing a light beam directly through the air that is being sampled, the technique is called open-path monitoring. The sensitivity of open-path measurements depends fundamentally on the product of the path length and the concentration of target molecules that are interrogated by the light beam. To maximize this number, the beam is usually passed through several hundred meters of the ambient air that is being sampled.
Open-path monitoring has two other potential benefits over point monitoring besides the enhanced capability for real-time measurement. First, the analyte is never lost by adsorption on the sampling surfaces in the preconcentration step. For this advantage to be realized in practice, the instrument must have high enough sensitivity that the analyte can be detected in the atmosphere at the desired concentration. The second advantage is that the light beam passes through several hundred meters of air; thus, the chance of an agent plume passing through the light beam is significantly greater than its passing through the location at which the point monitor is mounted. There is another significant difference between point and open-path monitors in that point monitors using sample concentration techniques give the concentration of the agent averaged over the duration of the time that air is passed through the adsorbent, whereas open-path monitors give the average concentration of the agent in the light path (often called the path-integrated concentration) during the time it is interrogated.
SENSITIVITY, SELECTIVITY, AND TIME RESPONSE TRADE-OFFS
Limits of Detection and/or Quantification
The limit of detection for any analyte is the smallest quantity or concentration that can be detected to a certain confidence level (usually 95 percent). Two types of determinations should be distinguished: univariate (when only one analyte is measured by the particular sensor) and multivariate (when more than one analyte is determined). The chemical agent monitors currently used at stockpile disposal facilities rely on a univariate determination.
For a univariate determination, many textbooks on analytical chemistry give the limit of detection (LOD) as 3σ, where σ is the standard deviation of the digitized signal from the detector (Ingle and Crouch, 1988; Christian, 2004). Assuming the baseline signal is randomly distributed about a mean value and 100 points are used to calculate σ, there is about a 1 percent probability that the maximum datum and the minimum datum will each be 2.58σ from the mean in the absence of the analyte and any interferents. In practice, this consideration leads to the result that the LOD depends on the width of the signal relative to the frequency of the noise, since very narrow signals are more difficult to distinguish from noise than broader signals are, as shown in Figures 3-1A and 3-1B. A more stringent criterion for the LOD than 3σ is probably called for to avoid false positives (see below). For example, Harris (1996) defines the detection limit of atomic spectrometry as the concentration required to give a signal that is three times the peak-to-peak noise level. Since the peak-to-peak noise level is about 5σ, this criterion implies that the LOD = 15σ.
Similarly, the limit of quantification (LOQ) for a univariate analysis is usually given as 10σ, which is approximately twice the peak-to-peak noise level. Again, a more stringent criterion should probably be applied if the analyte is to be determined to an accuracy of ±25 percent at the true value with a 95 percent confidence level.
Open-path Fourier transform infrared (OP/FT-IR) spectroscopy (see Chapter 5) is an example of a multivariate analysis, since interferents will generally be present in the infrared beam at the same time as the analyte. In any multivariate analysis, a calibration step must be carried out with the analyte present along with all expected interferents. The result of this step is the calculation of the root-mean-square error of calibration (RMSEC). A completely independent
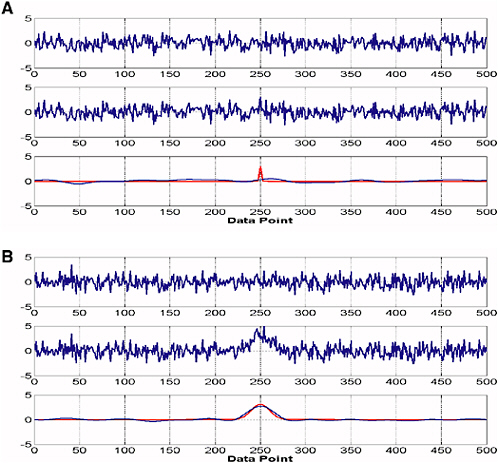
FIGURE 3-1 Random noise distribution using Gaussian peak. (A) (Top) Normally distributed random noise with a mean value of zero and a standard deviation of 1. (Middle) Same noise with a sharp Gaussian band (width of 1 and a height of 3); the peak cannot be observed visually despite the fact that its height is equal to 3σ. (Bottom in red) The noise-free Gaussian peak that was added to the noise in the upper trace. (Bottom in blue) The result of smoothing the middle trace to remove the high-frequency noise; the peak cannot be observed. (B) Same data as in (A), but with the width of the Gaussian band equal to 10. In this case, the band can readily be seen above the noise level, especially after the smoothing function has been applied. SOURCE: Courtesy of Limin Shao, University of Idaho.
series of measurements is then taken to validate the calibration, which results in the calculation of the root-mean-square error of prediction (RMSEP), which may be considered to be equivalent to the standard deviation for a univariate analysis. In both the calibration and validation steps, the concentration of the analyte must be known. In the validation step, the concentration of the analyte in each sample is calculated from the calibration matrix and compared to the known concentration for this sample. The RMSEP is the standard deviation of the difference between the known and calculated concentrations of the analyte.
Selectivity
In a univariate analysis, the predicted concentration could either be correct or it could be the result of an interferent that is present in the absence or presence of the analyte. For a chromatographic determination, the closer that the retention time of the peak of interest is to the specified retention time of the authentic analyte, the greater the confidence that can be placed in the result. An interferent that elutes with a retention time approximately equal to that of the authentic analyte, and that gives rise to a signal at the GC detector, yields a false-positive result.
For any multivariate determination, the residual spectrum after the concentration of the analyte has been determined gives an indication of the presence of any other molecule(s) that was (were) not present in the calibration samples and hence the confidence that can be placed in the predicted concentration of the analyte. Obtaining or preparing a set of calibration data in which all possible interferents are represented is one of the larger challenges of multivariate methods of analysis such as OP/FT-IR spectroscopy.
False Negatives and False Positives (Confirmation)
When the alarm level is close to the limit of detection, incorrect results may be indicated. False negatives occur when the target analyte is determined, through monitoring, to be present at a concentration below the alarm level but is in fact present at a concentration above the alarm level. Conversely, a determination in which the analyte is predicted to be present above the alarm level but is in fact absent, or present at a concentration below the alarm level, is known as a false positive. For the detection of chemical agents, false negatives mean that agent was present at a concentration greater than the alarm level, which is a potentially hazardous situation, whereas false positives may mean that the demilitarization process has to be shut down unnecessarily. Obviously, both situations are undesirable.
Measurement Time and Measurement Trade-off
The time between the start of one measurement and the start of the next is the measurement time. When preconcentration of a sample followed by a gas chromatographic separation is used, the measurement time is the sum of the duration for which air is passed through the adsorbent (tA), the time for thermal desorption of the adsorbates into the GC (tB, usually short), the time to complete the elution of all the components from the GC (tC), and the data processing time (tD, usually negligible). The time required for the thermal desorption, chromatography, and data processing (tB + tC + tD) is fixed. The amount of the analyte injected onto the GC column is directly proportional to the product of its average concentration, the flow rate of the air sample through the adsorbent, and tA. To reduce tA, the flow rate of air through the adsorbent could (in principle, at least) be increased. There is a trade-off, however: if the flow rate is too high, the efficiency of the adsorption is reduced so that there is a limiting flow rate above which the capture efficiency falls below 100 percent. In general, the lower the actual concentration of analyte in air, the greater the sampling time tA required to achieve a significant signal-to-noise ratio. Thus, the signal-to-noise ratio of the measurement is directly proportional to tA. The time required for a measurement of this type cannot be less than (tB + tC + tD). However, if a point sampling measurement technology is both sensitive enough not to require sample concentration (tA = 0) and specific enough not to require sample separation (tC = 0), then the measurement line (tB + tD) can be very short, allowing real-time detection.
In an open-path measurement, the LOD depends fundamentally on the noise level on the spectroscopic baseline, which decreases with the square root of the data acquisition time. Thus, there is a smaller benefit to increasing the measurement time in an open-path measurement than in a point monitoring technique where the analyte is trapped on an adsorbent. In an open-path measurement, a result may be obtainable in a few seconds. However, the uncertainty (LOD or LOQ) of this measurement is far worse than that obtained by a point monitoring technique and can only be improved by increasing the measurement time significantly. To obtain the same LOD as the point monitoring system described in the previous paragraph, the data acquisition time of an OP/ FT-IR measurement is far greater than the total measurement time (tA + tB + tC + tD).
INTRODUCTION TO SAMPLING FOR GB, VX, AND HD IN AIR
An understanding of the key factors that impact monitoring for GB, VX, and HD at stockpile sites is a prerequisite to considering potential new air monitoring systems for use in the stockpile program or to suggesting upgrades to existing systems.
Airborne exposure limits (AELs) for the three agents of primary interest in the stockpile program are given in Table 2-2 in the preceding chapter. The concentration range from the GPL to the IDLH limit that must be measured for each agent is shown in Table 3-1. For a given AEL, existing Army quality assurance/quality control (QA/QC) monitoring guidelines given in the Chemical Materials Agency’s Programmatic Laboratory and Monitoring Quality Assurance Plan require instruments to be calibrated between 0.5 AEL and 2.0 AEL (U.S. Army, 2004). Thus, for example, a given monitoring system (and its associated GPL method) must be capable of measuring VX GPL concentrations in the range of 0.000025 to 0.0001 ppb (0.0000003 mg/m3 to 0.0000012 mg/m3).
Sampling methods must be capable of collecting agent at a given sampling station in periods of time ranging from a few minutes (for the confirmation of NRT alarms) to 8 to 12 hours (for historical monitoring). Also, NRT monitoring systems are required to sample and report within 15 minutes. Furthermore, monitoring systems must be relatively simple to operate and maintain and must operate continuously and reliably.
TABLE 3-1 Minimum and Maximum AEL Concentrations for VX, GB, and HD
Among factors to consider when sampling for chemical agents is that interaction of VX with a variety of surfaces (including Teflon® and glass) or hydrolysis of any agent may cause severe losses during sampling and analysis.
Another factor to consider when sampling for GB, VX, and HD is that the environments within and surrounding stockpile demilitarization facilities often contain other chemicals at concentrations as high as tens of parts per billion that may interfere with agent detection. Thus, interferent concentrations can be millions of times greater than the lowest concentrations at which the agents must be monitored. These chemicals include various natural and human-made hydrocarbons, organophosphorus-based pesticides, decontaminants (for example, bleach solution), agent reaction products, and products of the combustion of gasoline and diesel fuel. Because of the presence of these potential chemical interferents, the sampling-and-analytical systems used to monitor for GB, VX, and HD must exhibit selectivities approaching a million to one or better to minimize false positives. One other complicating factor is that the environments that must be sampled at stockpile disposal sites often contain dust and/or high humidity, and the temperature of the air being sampled may range from well below 0°F to approximately 100°F.
GB, VX, and HD are typically monitored using gas chromatographic systems containing heteroatom-specific detectors (see Chapter 4 for a detailed discussion of currently used monitoring systems). For example, both the conventional flame photometric detector (FPD) and the pulsed FPD (PFPD) are used for the detection of phosphorus in nerve agents in the form of HPO* emissions, and for mustard agent, sulfur in the form of S2* emissions (where * implies that the species is in an excited state). In some instruments, the halogen-selective detector (XSD) is used for the detection of chlorine atoms in mustard agent. The limits of quantification for the FPD and the PFPD are typically at the picogram level for organophosphorus compounds and at the tens-of-picograms level for sulfur-containing (mustard) compounds. Thus, for the lowest AELs, it is usually necessary to collect agent from a minimum of several liters of air for analysis. The XSD is capable of the detection of picogram levels of HD. See Chapter 4 for further details concerning these detectors.
One other factor to consider is that it is difficult, if not impossible, to collect agents present in a given air sample without also collecting significant quantities of potential interferent compounds. Thus, it is desirable that any proposed sampling-and-analytical method include a means of separating the agents from the potential interferents collected prior to allowing the compounds to enter the detector. Also, the CMA’s Programmatic Laboratory and Monitoring Quality Assurance Plan requires that the efficiency of recovery of agent from the sample medium and through the analytical path be in the range of 75 to 125 percent (U.S. Army, 2004).1 This requirement can only be met by using components that have inert or deactivated sampling-and-analytical paths to construct the sampling-and-analytical system, and by controlling the temperature of these components to prevent the loss of agents on surfaces within these components. Inert or deactivated surfaces also help reduce sample carryover from one measurement cycle to the next.
The Programmatic Laboratory and Monitoring Quality Assurance Plan also requires that each monitoring system be certified by passing a Class I precision-and-accuracy (P&A) study, which consists of the calibration of the monitoring system, followed by a series of challenges in the range from 0.5 to 2.0 AEL over a 4-day period. A linear regression of the found (reported) concentrations versus challenge (true) concentrations is then performed. The constants determined in the linear regression (slope and intercept) are then used to calculate the concentration for a true 1.00-AEL challenge. The reported concentration must be in the range of 0.75 to 1.25 AEL; that is, the reported recovery must be in the range of 75 to 125 percent. Also, at a true concentration of 1.00 AEL, the 95 percent confidence limits for the reported concentration must be within ±25 percent of the actual concentration.
Furthermore, for daily 1.00-AEL challenges during routine operation, NRT monitoring systems must yield found concentrations in the range 0.75 to 1.25 AEL 95 percent of the time. If this condition cannot be met, then the alarm level for the NRT system must be set so that 95 percent of all 1.00-AEL challenges result in an alarm and at least 75 percent of daily 1.00-AEL first challenges must yield found concentrations in the range of 0.75 AEL to 1.25 AEL. For manual monitoring systems, the reportable limit (action level) must be set so that 95 percent of daily 1.00-AEL challenges yield found concentrations greater than or equal to the reportable limit (U.S. Army, 2004).
DATA PROCESSING (SIGNAL PROCESSING, DISPLAY)
Modern chemical sensing instruments employ computerized signal processing and data formatting algorithms to convert raw instrument signals into useful information that can be used to trigger alarms, confirm detection levels, or otherwise aid in efficient process management and operational safety. These automated signal and data processing activities are particularly important for real-time sensors, which are often based on optical or mass spectral sensing techniques. Such sensors are designed to provide high sensi-
tivity and specificity coupled with fast response times. These processing techniques entail measuring a signal that comprises a multitude of individual electronic measurement readings. The purpose of the processing module is to convert this multitude of measurements automatically into a visually (and/or audibly) recognizable detection indication, including an alarm when necessary, as well as to provide an electronic record of measurement results.
For example, in the metering of the temperature of a boiler, as depicted in Figure 3-2 (top), a single measured quantity is displayed on a gauge that can include an alarm trigger when the gauge needle exceeds some threshold value. A signal composed of a multitude of measurement readings, as represented by Figure 3-2 (bottom), presents a more difficult engineering challenge because the measured signal may exhibit complex patterns that defy simple means of automated detection and reporting. Instead, automated detection and reporting require the use of a computer chip running pattern-recognition software (algorithms). Fortunately, today’s computing technology enables this to be readily accomplished by accommodating both a large number of measurements and enabling more computationally demanding, higher-performance algorithms to be applied in real time.
To illustrate how and why such pattern-recognition processing is applied, consider the example presented in Figure 3-3. Figure 3-3A shows a notional spectrum of a chemical agent, in pure form, at a low (safe) concentration. In an ideal world, the agent could be remotely measured in
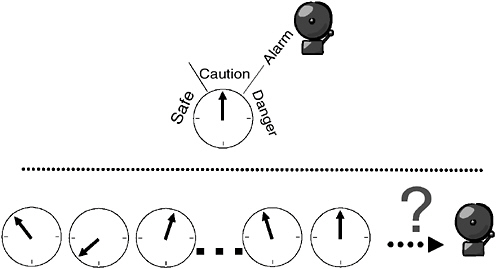
FIGURE 3-2 Illustration of simple and complex automated measurements. (Top) Simple automated detection and reporting of a simple measurement—boiler temperature; (bottom) a multitude of measurement readings, exhibiting complex patterns, defies simple means of automated detection and reporting. SOURCE: Courtesy of Frank Iannarilli, Aerodyne Research, Inc.
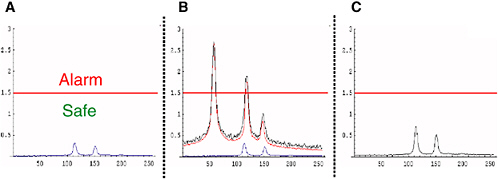
FIGURE 3-3 Depiction of pattern recognition applied to spectral detection of chemical agent. (A) Spectrum of pure agent at low concentration; (B) spectral measurement (black curve) showing the additive composite of low-concentration agent (blue curve) in a strongly interfering background (red curve); (C) result of pattern-recognition algorithm on (B), digitally suppressing much of the interfering background, and correctly indicating a safe agent concentration level. SOURCE: Courtesy of Frank Iannarilli, Aerodyne Research, Inc.
pure form, and one could automatically detect dangerous concentrations by the alarm’s sounding when the agent’s spectral peak readings exceeded the depicted alarm threshold. This might be implemented with simple electronic wiring.
Figure 3-3B depicts the chemical agent, still at the same safe concentration, but now as measured in the real world, which adds a strongly interfering background. This background exhibits three spectral peaks, all above the alarm threshold, including two at the locations of the chemical agent’s characteristic spectral peaks. Surely, no one individual or small set of readings within this spectrum, which comprises 250 measurements, is sufficiently informative for reliable automated detection.
Figure 3-3C shows the result of a simple pattern-recognition algorithm upon processing the real-world measurement in Figure 3-3B. By making use of the known spectral pattern of the chemical agent in pure form (Figure 3-3A), this algorithm is able to digitally suppress2 much of the background interference exhibited in the real-world measurement (Figure 3-3B). The result correctly indicates a low concentration of chemical agent, somewhat in excess of the true concentrations, but still well below the alarm threshold.
A certain level of reliability from an automated detection, processing, and reporting module is necessary. There are numerous ways of quantifying such reliability, such as the likelihood of detecting a chemical release (of given concentration) versus the frequency of false alarms. There exists a well-established body of knowledge for determining the achievable reliability of such automated pattern-recognition schemes, both as a function of cost/complexity and their intrinsic physical limits. Further discussion of modern signal detection and processing techniques are available in Duda et al. (2001), Hastie et al. (2001), and Scharf (1991).
RELIABILITY AND MAINTAINABILITY
Any time that a monitoring system is not completely functional at a chemical stockpile disposal facility, the potential exists for erroneous decision making and hence for either missing a true event or closing the plant on a false alarm. Reliability is the measure for the fraction of times that monitoring instruments pass tests of their continued ability to perform correctly. Instruments can fail in two ways. First, they can fail because they are not working (e.g., they may be broken or disconnected). Second, they can fail to give a correct result. The latter form of failure is covered in the next section, in which the complete human/instrument system is considered from the point of view of avoiding false negatives and false positives; this section concentrates on the former failure mode.
All of the instruments used in chemical demilitarization monitoring have good reliability in terms of the fraction of tests passed. However, with such a large number of instruments, the overall failure of the system is caused by failure of any one of the instruments, meaning that the system fails more often than its components do. For example, if each of 100 instruments only malfunctions once per year, then the probability of a system failure caused by any instrument failure is 0.24 per day, meaning that the system fails approximately 1 day in 4.3 This would probably not be acceptable to the public. Increasing system reliability involves the following:
-
Using highly reliable instruments and people—that is, mean time between failures must be as low as possible for both. This implies highly reliable instruments, which appears to be the case, and highly reliable operators, which means constant training and reinforcement of correct operating procedures.
-
Building reliable systems even if components are inherently unreliable, using planned redundancy, and so on.
-
Reducing mean time to repair using design for maintainability and similar approaches. Current NRT agent monitors are designed to be tested and then replaced for off-line repair if they do not pass each functional test. Observations of the testing procedure and reading of its manual suggest that the test system is rapid and, if procedures are followed, reliable. No attempts have been made to quantify the maintainability of the instruments, for example using the Bretby Maintainability Index (Rushworth and Mason, 1992).
Good design uses all three of the above approaches together to achieve greater system reliability.
OPERATOR AND OPERATING SYSTEMS INTERFACES
At stockpile sites, the output from any monitoring system is ultimately passed to a human operator for a final decision. The monitoring equipment and the operator together form a detection-and-decision system. The operator’s task is to make the correct decisions based on the best available data, where “correct” means a decision that the decision-system administrators and the public would have wanted the operator to make in perfect hindsight. In monitoring, the
detection systems may have differing sensitivity settings, resulting in different reactivity and reliability. The “operators” can be the personnel directly working with a system—for example, the technician who has just brought a system back online or a remote operator in the main control room. Their decision results in an action, either putting the system into a safe condition or allowing it to continue operating.
From signal detection theory, which is a well-documented performance theory for making decisions under uncertainty, two factors affect the decision made by any human operator on the basis of data received from the monitoring instrument. The factors are:
-
Discriminability of signal from noise, and
-
Bias affecting the choice of criterion for reporting the signal.
Discriminability is a measure of the absolute difficulty of the decision task, that is, how easy or difficult it is to reliably determine the difference between signal and noise. Here the signal is defined as a true alarm, that is, a concentration that exceeds the amount needed to cause an action response to be taken. The noise is the statistical background fluctuation of the output from the system against which the signal must be detected. It can include random background noise, monitoring equipment noise, or the presence of interferents.
The threshold for reporting signal or noise depends on the criterion chosen by the operator. When the system output exceeds the criterion, the operator response is “signal”; otherwise the response is “no signal,” which is usually no response at all—that is, continue operations. The choice of criterion is affected by the prior probability of an event being a signal and by the costs and rewards for the different outcomes. The lower the a priori probability of a signal, the more the criterion will move toward not calling it a signal. “Costs and rewards” are not typically monetary, but rather represent the instructions as interpreted by the operator. This is not necessarily the same as the formal policy of written instructions unless those instructions are consistently applied. For example, if supervisors and colleagues reward productive behavior that is not strictly in accordance with policy, then the implied policy affects the criterion rather than the official policy.
In chemical demilitarization activities, many decisions have a high cost associated with them. Failing to put the system into a safe state when a signal occurs (a true positive) can endanger plant personnel and the public. Conversely, reacting when there was in fact no true event (false positive) is extremely costly in terms of processing time lost before the plant returns to normal operating conditions. Human decision makers do not always react correctly when the stakes are high and one event (a hazardous event) is inherently unlikely. Moreover, there are other general human factors problems for operators at chemical stockpile sites. First, difficult decisions that must be made rapidly under uncertain conditions are stressful to some operators. Stress, particularly time stress, can affect decision making as people seek easily available solutions, for example, solutions that have worked under similar conditions in the past. Such “recognition primed decision making” (Klein, 1989) usually works well, but it can give the wrong answer if the operator “recognizes” conditions that do not apply in this instance. Another source of operator problems is complacency, defined technically as excessive trust in automated systems (Lee and Moray, 1994). This is the opposite of operators’ distrust of an instrument reading, but both represent an inappropriate level of trust in the monitoring system.
The problems described above are compounded by the operators’ knowledge that the monitoring instruments are operating at close to their technical limits. Human factors engineering can aid systems design by applying formal models, such as signal detection theory, and by using other models, such as interface design models, to improve the reliability of the decision maker.
Discriminability can be improved by ensuring that the interface to the operator is well designed. This interface consists of the physical interface of the equipment—for example, the controls and displays on the equipment—and the interface through the computer system that provides the monitoring information remotely. The interface also includes any person-to-person interaction between the operator who interfaces with the physical system and the person who makes the ultimate decision. Any documentation, such as the plans and policies promulgated by the Army to control operations, is part of the interface. Finally, the information from the interface is interpreted by the operators in terms of their knowledge and training. Training and practice have a large impact on how reliably the monitoring instruments are interpreted.
Interface design for the monitoring system should follow models of human factors good practice—for example, compatible control-display relationships or design for human-computer interaction. More modern models for interface design include ecological interface design that makes the interface compatible with the operator’s underlying models of the process. Any changes to the design must recognize that the current operators have long experience with the existing system. They have developed skills in operating and maintaining the equipment, so new designs must not contradict these learned skills but rather complement them in the new context. It is much more difficult for a human to learn a skill that conflicts with an already-learned skill than to learn a new skill unrelated to the older one.
Training of operators is particularly important when they must monitor automated equipment for rare events. As true events are extremely rare but false-positive alarms are an almost daily occurrence, the operator’s rational decision is to assume that any new alarm is also false (Wickens and Hollands, 2000). This is, of course, the wrong decision, but in an earlier NRC report on chemical events at chemical
agent disposal facilities (NRC, 2002), such behavior was found in most of the true events. False positives affect operators by “crying wolf” and make it more difficult for operators to maintain the mind-set of “true until proven false.” As a true event requires additional actions, from sending a person in a mask to investigate through to shutting down the plant, operators may be even more reluctant to treat all alarms as true events. The only way to alleviate the problem is by constant training and drills, including the use of unannounced false positives being inserted into the system specifically for training purposes.
REFERENCES
Christian, G.D. 2004. Analytical Chemistry. 6th edition. New York, N.Y.: Wiley.
Duda, R.O., P.E. Hart, and D.G. Stork. 2001. Pattern Classification. 2nd edition. New York, N.Y.: Wiley.
Federal Register. 2003. Final recommendations for protecting human health from potential adverse effects of exposure to agents GA (tabun), GB (sarin), and VX. Federal Register 68(196): 58348–58351.
Federal Register. 2004. Interim recommendations for airborne exposure limits for chemical warfare agents H and HD (sulfur mustard). Federal Register 69(85): 24164–24168.
Harris, D.C. 1996. Quantitative Chemical Analysis. 5th edition. New York, N.Y.: Freeman.
Hastie, T., R. Tibshirani, and J. Friedman. 2001. The Elements of Statistical Learning: Data Mining, Inference, and Prediction. New York, N.Y.: Springer.
Ingle, J.D., and S.R. Crouch. 1988. Spectrochemical Analysis. 6th edition. Englewood Cliffs, N.J.: Prentice Hall.
Klein, G.A. 1989. Recognition-primed decisions. Pp. 47–92 in Advances in Man-Machine Systems Research, Volume 5. Edited by W.B. Rouse. Greenwich, Conn.: JAI Press, Inc.
Lee, J.D., and N. Moray. 1994. Trust, self-confidence, and operators’ adaptation to automation. International Journal of Human-Computer Studies 40(1): 153–184.
NRC (National Research Council). 2002. Evaluation of Chemical Events at Army Chemical Agent Disposal Facilities. Washington, D.C.: The National Academies Press.
Rushworth, A., and S. Mason. 1992. The Bretby Maintainability Index—A method of systematically applying ergonomic principles to reduce costs and accidents in maintenance operations . Maintenance 7(2): 7–14.
Scharf, L.L. 1991. Statistical Signal Processing: Detection, Estimation, and Time Series Analysis. New York, N.Y.: Addison-Wesley.
U.S. Army. 2004. Programmatic Laboratory and Monitoring Quality Assurance Plan. Final, June. Aberdeen Proving Ground, Md.: Chemical Materials Agency.
Wickens, C.D., and J.G. Hollands. 2000. Engineering Psychology and Human Performance. 3rd edition. Upper Saddle River, N.J.: Prentice Hall.


