
4
Current Chemical Agent Monitoring Systems
OVERVIEW OF CURRENT AIR MONITORING SYSTEMS
The monitoring systems currently used for the detection of the airborne agents GB, VX, and HD at fixed sampling locations at stockpile disposal sites and at agent storage facilities are these:
-
ACAMS (Automatic Continuous Air Monitoring System),
-
MINICAMS® (Miniature Chemical Agent Monitoring System), and
-
DAAMS (Depot Area Air Monitoring System).
ACAMS and MINICAMS are automated near-real-time (NRT) monitoring systems that have been used in chemical agent disposal facilities since 1990 to monitor for these three agents at the Centers for Disease Control and Prevention’s (CDC’s) 1988 time-weighted average (TWA) airborne exposure limits (AELs) and at AELs that are immediately dangerous to life and health (IDLH) for GB and VX; the IDLH AELs were defined at a later date.1 As described in Chapter 2, the Army has replaced use of the 1988 TWA AELs for agent monitoring with new, short-term exposure limit (STEL) AELs that were promulgated by the CDC in 2003 for nerve agents and 2004 for mustard agent. ACAMS and MINICAMS continue to be used for NRT monitoring at the new AELs. DAAMS, a manual monitoring system, has been used at stockpile and storage sites primarily to confirm the detection of 1988 TWA levels of agents by ACAMS or MINICAMS and to conduct historical monitoring at the 1988 TWA and general population limit (GPL) levels. DAAMS continues to be used in this manner at the new 2003/2004 AEL levels. ACAMS and MINICAMS have also been used to monitor airborne concentrations of agents at the limit-of-use concentration of 100 mg/m3 for the totally encapsulated demilitarization protective ensemble (DPE) suits that workers use at chemical demilitarization sites (U.S. Army, 2004b).
Several different configurations of Agilent-gas-chromatograph-based, automated NRT monitoring systems have also been used or tested at various storage and disposal sites. These systems are known by the acronym A/DAM (Agilent/Dynatherm agent monitor). The latest version of the A/DAM system consists of a Dynatherm IACEM 980 sorbent-based sampling system connected to an Agilent 6852 gas chromatograph (GC).
In addition to fixed-site monitoring, ACAMS, MINICAMS, and the A/DAM system have also been used in mobile applications. In these applications, the NRT monitors and associated support systems are mounted in mobile vans, which are then driven to remote sampling locations (such as storage igloos) to conduct air monitoring.
The operation and performance of the MINICAMS, A/DAM, and DAAMS monitors were described in a recent National Research Council report (NRC, 2005) on air monitoring for the non-stockpile program. In the present report, the committee summarizes from the previous report only the information most relevant to this study, adding information regarding the ACAMS and its performance.
Description of the ACAMS and MINICAMS
The ACAMS is being used at four incinerator-based stockpile disposal sites in the continental United States, and it had been used at the now-closed Johnston Atoll site in the Pacific Ocean southwest of Hawaii. The MINICAMS is currently in use at two sites that destroy agents by chemical neutralization. Both of these monitors provide reports of air-
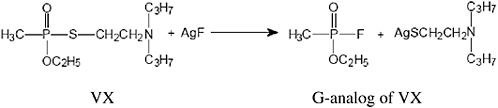
FIGURE 4-1 Derivatization of VX.
borne agent concentrations once every 3 to 15 minutes (U.S. Army, 2003). ACAMS and MINICAMS monitors used at stockpile sites are typically configured for sampling using glass tubes packed with a porous polymer. Separation of agents from potential chemical interferences is accomplished using temperature-programmed capillary gas chromatography. ACAMS monitors are configured for the detection of GB, VX, and HD using a flame photometric detector (FPD). MINICAMS monitors are typically configured with an FPD for the detection of GB, VX, and HD, or with a halogen-selective detector (XSD) for the detection of HD.
Principles of Operation
GB and HD are sampled and detected directly by ACAMS and MINICAMS monitors. However, because VX has low volatility and high affinity for irreversible adsorption on surfaces, it is first derivatized, as shown in Figure 4-1, by reaction with silver fluoride to yield the more volatile and less reactive G-analog of VX, which is then sampled and detected by ACAMS and MINICAMS monitors.
The derivatization of VX is accomplished in real time by installing a V-to-G conversion pad on the inlet of the NRT monitor or on the distal end of a heated sample line connected to the inlet. The conversion pad consists of a porous, polyester-felt pad impregnated with potassium fluoride and silver nitrate.
Detection Interferences
The FPD may be operated in a phosphorus-specific mode (by monitoring HPO*2 emissions through a 525 nm, narrow-band-pass optical filter) or in a sulfur-specific mode (by monitoring S2* emissions through a 396 nm, narrow-band-pass optical filter). In the phosphorus-specific mode, the FPD is about 10,000 times more sensitive to phosphorus than to carbon on the basis of signal per unit of mass for the range of interest when monitoring at STEL levels for GB and VX—about 1 to 10,000 picograms (pg) per second of phosphorus into the detector). In the sulfur-specific mode, the FPD is also about 10,000 times more sensitive to sulfur than to carbon for the mass range of interest when monitoring for HD at STEL levels—about 100 to 100,000 pg per second of sulfur into the detector3 (Thurbide and Aue, 1994). The FPD is less selective for phosphorus versus sulfur than for phosphorus versus carbon. Thus, despite the selectivity of the FPD, sulfur emissions (resulting from the formation of S2* in the FPD) as well as hydrocarbon emissions (for example, resulting from the formation of CH*) can cause interferences (false positives) in the phosphorus-specific mode. Also, phosphorus-containing compounds that are not agents but have the same GC-column retention time as GB or the G-analog of VX, and phosphorus-containing compounds other than VX—for example, certain pesticides—that also undergo V-to-G-analog conversion can cause false positives in the phosphorus-specific mode. In addition, hydrocarbons can quench (reduce) sulfur and phosphorus emissions, causing false negatives. For example, a concentration of only a few parts per million of a hydrocarbon, present in an area sampled by MINICAMS and with the same retention time as the agent being monitored, can result in the reduction of phosphorus or sulfur emissions by about 50 percent (Aue and Sun, 1993).
The XSD used in some MINICAMS to detect the chlorine in HD is a thermionic device based on work patented by Rice (1951) and Roberts (1957) and produced commercially by O·I Analytical. The target analyte is oxidized in a flame to produce halogen atoms that react with an alkali-activated, negatively biased platinum electrode enhancing its electron emission. In HD demilitarization facilities, potential interferents containing Cl are apparently much less abundant than those containing S, so MINICAMS utilizing XSD detectors are much less likely to produce false-positive detection than those using FPDs.
Calibration, Certification, and Quality Assurance
Before use, each NRT monitor must be calibrated. Calibration consists of injecting known masses of agent into the inlet of the monitor during successive instrument cycles—
specifically, microliter volumes of a dilute solution of agent are injected. Thus, the response (detector signal) versus the mass of agent can be determined.
After calibration, the responses obtained during subsequent cycles of operation of the NRT monitor can be converted to detected masses and to concentration readings, which are then reported as found concentrations, that is, agent concentration readings reported by the NRT monitor.
Monitoring systems (and their associated written methods) used at stockpile disposal sites must be certified before use in accordance with requirements stated in the Chemical Materials Agency’s (CMA’s) Programmatic Laboratory and Monitoring Quality Assurance Plan (U.S. Army, 2004a). Certification generally includes passing a 4-day precision-and-accuracy (P&A) study. P&A studies are usually conducted over a relatively narrow concentration range, typically 0.2 to 1.5 AEL in the past and now 0.5 to 2.0 AEL (as presented in U.S. Army, 2004a). The goals of a P&A study are (1) to demonstrate that when used for the detection of a true agent concentration of 1.00 AEL, the monitoring system (and its associated written method) is predicted to report a found concentration in the range of 0.75 to 1.25 AEL (that is, 75 to 125 percent recovery)4 with a precision of ±25 percent with 95 percent confidence, and (2) to document the P&A of the monitoring system at all concentrations used in the study (U.S. Army, 2001).
Monitoring systems and written methods are generally not tested formally outside the concentration range required for the P&A study (U.S. Army, 2004a). Thus, the accuracy of a given monitoring system for concentrations outside the range tested is generally considered to be uncertified. This fact is important to keep in mind when using the performance of monitoring systems and methods at the 1988 CDC 0.20 to 1.50 AEL concentration ranges to predict the expected performance at the 2003/2004 CDC 0.50 to 2.00 AEL concentration ranges.
Description of the A/DAM System
As noted previously, several different configurations of the A/DAM system (which consists of an Agilent GC connected to a Dynatherm thermal desorption unit) have been used or tested at various storage and disposal sites. A/DAM systems are typically configured for sampling using glass tubes packed with a porous polymer. Separation is accomplished using temperature-programmed capillary GC, and detection is done via an FPD. The A/DAM system can be configured to achieve better chromatographic resolution (and thus better selectivity) than can be achieved by ACAMS and MINICAMS monitors and, therefore, may experience fewer false positives.
The A/DAM system can also be configured with two separate GC columns and with two separate FPDs. In this configuration, gas streams exiting the Dynatherm thermal desorption unit can be split between the two analytical channels. If the two columns have liquid phases that are sufficiently dissimilar (for example, nonpolar and polar), a given agent will be detected at two different retention times on the two different analytical channels. Other potential interferences (for example, hydrocarbons) are unlikely to exhibit the same retention times as those for the agent on the two different columns. In this manner, a much higher degree of selectivity than that of the ACAMS and MINICAMS monitors is possible.
Agilent is introducing enhancements to the FPD to obtain a twofold to fivefold improvement in the signal-to-noise ratio.5 Work has also been done on a method for the direct detection of VX that, for some monitoring applications, may allow the determination of VX without the need for derivatization, and thereby may result in fewer false positives than for the detection of VX using the V-to-G-analog conversion method (NRC, 2005).
Although A/DAM systems have been proven capable of monitoring at the CDC’s 1988 TWA levels for GB, HD, and VX at several sites during the past 10 years, there are significant barriers to the widespread use of these systems. These barriers include greater cost, size, weight, and complexity compared with ACAMS and MINICAMS monitors. However, the greater analytical flexibility of the A/DAM system compared with ACAMS and MINICAMS monitors may reduce the importance of these barriers in the future, especially when monitoring sites or operations for which numerous false positives have been experienced when using ACAMS or MINICAMS monitors.
Description of the DAAMS
The concentration of agent is currently determined by DAAMS to provide historical monitoring data at the worker population limit (WPL) and the GPL AELs. DAAMS samples are also analyzed to confirm or deny alarms sounded by NRT monitoring systems. Manual DAAMS samples are collected by pulling air through glass sampling tubes packed with a porous polymer for periods of time ranging from a few minutes for NRT confirmation samples to as long as 12 hours for GPL historical monitoring. Sampling tubes are placed at various locations within a given site. Most of the
sampling tubes for WPL AELs are co-located with NRT monitors (ACAMS or MINICAMS).
The analysis of DAAMS samples is usually accomplished using an Agilent Model 6890 or Model 6852 GC connected to a Dynatherm ACEM 900 or to a Dynatherm IACEM 980 thermal desorption system, which is configured to receive and desorb manually collected samples. For samples collected and analyzed in support of historical monitoring, the DAAMS GC is usually configured with an FPD. DAAMS GCs used to confirm or deny NRT monitoring alarms may also be configured with either an electron impact (EI) or chemical ionization (CI) mass selective detector (MSD), or with both an FPD and an MSD.
Because the analysis of DAAMS samples is based on the use of laboratory-grade GCs, which may be configured in many different ways, the configuration of DAAMS GCs varies from site to site. Most DAAMS GC systems in use at stockpile sites include a precolumn and an analytical column in series. In this configuration, low-boiling compounds and agents are first allowed to pass from the precolumn into the analytical column. The flow of carrier gas within the precolumn is then reversed to allow high-boiling compounds to be backflushed from the precolumn to clean and ready it for the next sample to be analyzed. While the precolumn is being backflushed, carrier gas continues to flow through the analytical column and into the detector, allowing the detection of the agents of interest.
The initial step in the analysis of a DAAMS sample consists of inserting the sampling tube into a port on the Dynatherm thermal desorption unit. Agent desorbed from the sampling tube is first collected on a sorbent bed in a small-bore focusing tube within the Dynatherm unit. Agent is then desorbed from the small-bore tube into the precolumn within a narrow band. For this reason, the DAAMS typically achieves better chromatographic resolution than do ACAMS or MINICAMS monitors and thus is more selective and experiences fewer false positives (interferences) than do the NRT monitoring systems. This often enables DAAMS monitors employing FPD detectors to be used effectively to confirm or deny the presence of agent in areas monitored by ACAMS or MINICAMS monitors. However, since DAAMS analyzers with FPD detectors do use the same basic agent detection scheme as FPD-equipped ACAMS or MINICAMS, they are often subject to the same measurement interferences and errors. DAAMS equipped with EI and/or CI MSDs employ an independent detection method that can be very useful in both identifying and discriminating against interferents.
Performance of ACAMS, MINICAMS, and DAAMS Monitors
The current ACAMS, MINICAMS, and DAAMS concentration ranges shown in Figures 4-2 through 4-4 reflect the performance of these systems when monitoring at the CDC’s 1988 AELs, performance proven at several different stockpile sites during the past 10 to 15 years.6 The CDC’s 2003/2004 AELs and 1988/1997 required operating ranges for GB, VX, and HD are also presented in Figures 4-2 through 4-4.7
As noted previously, VX is detected as its G-analog, which differs from GB only by the presence of an ethyl group in place of an isopropyl group (in Chapter 2, see the section entitled “Chemical Agent Properties” for GB structure). Thus, it is likely that ACAMS and MINICAMS monitors could be successfully certified for GB at concentrations at least an order of magnitude less than the lower limit shown for the 1988/1997 ACAMS/MINICAMS range in Figure 4-2. (This extension of the GB lower detection limit vis-à-vis the 1988/1997 ACAMS/MINICAMS range for VX is shown by the dotted line to the left of the 1988/1997 ACAMS/ MINICAMS line at the top of Figure 4-2.)
Previous NRC reports have expressed concerns about the frequency of false alarms experienced by ACAMS (NRC, 1994, 1999, 2002). During the past few years, the CMA and various sites have initiated or completed several actions in efforts to reduce the frequency of false alarms at stockpile disposal sites. For example, during the past few years, more than 700 chemicals and other chemical-source items have been tested at the Tooele Chemical Agent Disposal Facility (TOCDF) to identify whether they interfere with the operation of ACAMS monitors (that is, to determine whether vapors from these sources resulted in a positive response from ACAMS monitors). Chemicals or chemical-source items that are proven to be or that produce interferents are then banned from the site, or, if no suitable substitute can be found, the on-site use of these chemicals or chemical sources is carefully controlled.
This committee recently received a breakdown of ACAMS false-positive alarms (with the alarm level set at 0.50 of the 1988 TWA) during several months of VX disposal operations in 2003 and 2004 at TOCDF (Tooele, Utah). This information is shown in Table 4-1.
The false-alarm rates listed are the total number of ACAMS cycles that resulted in alarms (that is, concentration readings greater than 0.50 of the 1988 TWA, which is equal to the current STEL) and that were proven false by the analysis of co-located DAAMS samples. The average number of cycles that resulted in VX false alarms for the periods listed was 36 cycles per month out of nearly 1 million ACAMS
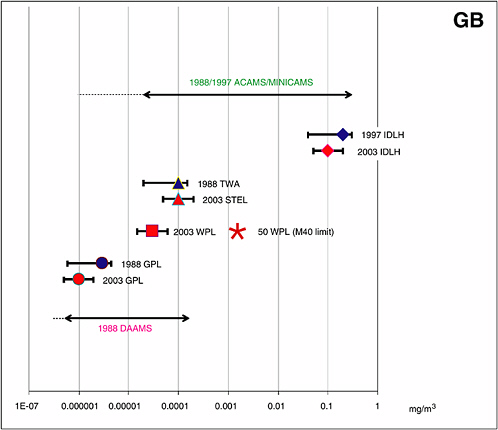
FIGURE 4-2 ACAMS/MINICAMS and DAAMS operating ranges for the 1988/1997 GB AELs and required ranges for the CDC’s 2003 GB AELs.
NOTES:
(1) The 1988/1997 AEL concentration ranges for GB over which MINICAMS and DAAMS have been certified and operated for many years are indicated by horizontal lines that end in arrows. Also represented are the following:
• The “1988/1997 ACAMS/MINICAMS” line includes a dotted line to its left to indicate that it should be possible to calibrate and certify MINICAMS for monitoring GB at phosphorus-equivalent concentrations corresponding to 0.20 to 1.50 TWA of VX.
• The “1988 DAAMS” line also has a dotted line to its left to indicate that it should be possible to calibrate and certify DAAMS for monitoring GB at phosphorus-equivalent concentrations corresponding to 0.20 to 1.50 of the 1988 GPL for VX.
• The IDLH AELs are indicated by diamonds with range bars showing the past concentration range for certifying MINICAMS, 0.20 to 1.50 of the 1997 IDHL value for GB, and the concentration range required in the future, 0.50 to 2.00 of the 2003 IDHL value for GB.
• The CDC’s 1988 TWA AEL and the numerically equivalent CDC’s 2003 15-minute STEL for GB are indicated by triangles with range bars.
• The CDC’s 2003 WPL for GB is indicated by a square with range bars, and the 1988 and 2003 GPLs are indicated by circles with range bars.
(2) The GB concentration limit above which negative-pressure respirators, such as the M40 mask, may not be worn is marked by an asterisk and labeled “50 WPL (M40 limit).” Limits for supplied-air respirators (1,000 WPL) and SCBA (10,000 WPL) are not shown.
SOURCE: NRC, 2005.
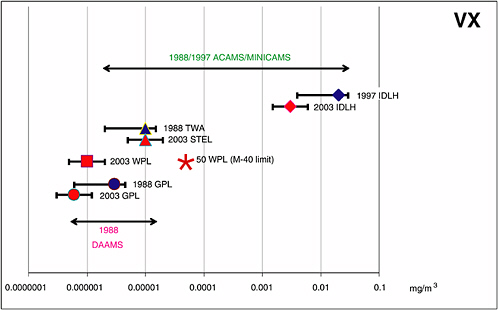
FIGURE 4-3 ACAMS/MINICAMS and DAAMS operating ranges for the 1988/1997 VX AELs and required ranges for the CDC’s 2003 VX AELs.
NOTES:
(1) The 1988/1997 AEL concentration ranges for VX over which ACAMS/MINICAMS and DAAMS have been certified and operated for many years at various sites are indicated by horizontal lines that end in arrows. Also represented are the following:
• The IDLH AELs are indicated by diamonds with range bars showing the past concentration range for certifying MINICAMS, 0.20 to 1.50 of the 1997 IDHL value for VX, and the concentration range required in the future, 0.50 to 2.00 of the 2003 IDHL value for VX.
• The CDC’s 1988 TWA AEL and the numerically equivalent CDC’s 2003 15-minute STEL for VX are indicated by triangles with range bars.
• The CDC’s 2003 WPL for VX is indicated by a square with range bars, and the 1988 and 2003 GPLs are indicated by circles with range bars.
(2) The VX concentration limit above which negative-pressure respirators, such as the M40 mask, may not be worn is marked by an asterisk; limits for supplied-air respirators (1,000 WPL) and SCBA (10,000 WPL) are not shown.
SOURCE: NRC, 2005.

FIGURE 4-4 ACAMS/MINICAMS and DAAMS operating ranges for the 1988 HD AELs and required ranges for the CDC’s 2004 HD AELs.
NOTES:
(1) The 1988 AEL concentration ranges for HD over which ACAMS/MINICAMS and DAAMS have been certified and operated for many years are indicated by horizontal lines that end in arrows. Also represented are the following:
• The “1988 MINICAMS” line includes a dotted line to its right to indicate that even though an IDLH AEL for HD was not defined until recently, MINICAMS has been used for many years to monitor for HD at concentrations up to and far above the CDC’s 2004 IDLH AEL for HD.
• The CDC’s 2004 IDLH AEL for HD is indicated by a diamond with range bars showing the concentration range required in the future when certifying MINICAMS, 0.50 to 2.00 of the 2004 IDLH.
• The CDC’s 1988 TWA AEL and the numerically equivalent CDC’s 2004 15-minute STEL for HD are indicated by triangles with range bars.
• The CDC’s 2004 WPL is indicated by a square with range bars, and the 1988 and 2004 GPLs are indicated by circles with error bars.
(2) Limits for supplied-air respirators (1,000 WPL) and SCBA (10,000 WPL) are not shown.
SOURCE: NRC, 2005.
TABLE 4-1 False-Positive Alarm Rates in 2003 and 2004 for TOCDF ACAMS During VX Operations
|
Measurement Periods |
Number of ACAMS Displaying False-Positive Alarms |
Number of ACAMS False-Positive Alarms per Day |
|
March 2003-April 2003 |
80 |
1.3 |
|
December 2003−January 2004 |
99 |
3.1 |
|
March 2004−May 2004 |
34 |
0.4 |
|
July 2004 |
73 |
2.4 |
|
SOURCE: Data from Jeff Kiley, Monitoring Office, Risk Management Directorate, CMA, briefing to the committee, October 5, 2004. |
||
sampling-and-analytical cycles per month (based on the continuous operation of 112 ACAMS with 5-minute cycles). As shown in Table 4-1, the average number of ACAMS false positives is both highly variable and non-negligible, ranging from 0.4 to 3.1 per day. Each false-positive alarm may both disrupt disposal operations and contribute to a “crying wolf” mind-set that may cause staff to discount alarms resulting from an actual agent excursion or release (NRC, 2002).
During a recent 12-month period, 8,237 primary DAAMS samples were collected and analyzed at the VX GPL at TOCDF. Of these samples, VX concentrations greater than 0.20 GPL (the reportable limit for TOCDF) were found for 16 samples. Backup DAAMS tubes for these 16 samples, collected at the same time as the primary samples, were then analyzed using a DAAMS confirmation method, and it was determined that the apparent VX response for each of the 16 tubes was not caused by VX.8
The Aberdeen Chemical Agent Disposal Facility (ABCDF) used neutralization to destroy agent HD, which results in the generation of a sulfur-containing decomposition product, thiodiglycol. The ACAMS FPD cannot be used to monitor for HD in an environment that may contain large quantities of a potential sulfur-containing interferent (thiodiglycol). For this reason, MINICAMS monitors configured with an XSD are used for NRT monitoring at the ABCDF. The XSD is sensitive only to halogen atoms in molecules. Thus, a MINICAMS configured with an XSD can detect HD but cannot detect thiodiglycol. A recent communication from the ABCDF disposal site indicated that only about five false alarms were experienced over a recent 18-month period of operation of MINICAMS/XSD systems at the ABCDF, with the alarm level set at 0.70 STEL (equal to 0.70 of the 1988 TWA) and out of more than 8 million instrument cycles—55 instruments × 12 cycles per hour × 24 hours per day × 30 days per month × 18 months.9 DAAMS monitors at the ABCDF are configured with an MSD, and some monitors also include an FPD. However, the FPD cannot be used for routine HD analysis because of the frequent occurrence of false positives. Thus, most DAAMS samples are analyzed using the MSD.
In past reports, NRC committees have suggested that the Army improve the reliability of ACAMS monitors (NRC, 1994, 1999, 2001, 2002). This committee was provided with data on malfunctions at TOCDF that are considered representative of a typical week of ACAMS monitoring at the STEL level for GB and VX. For the week of September 5-12, 2004, ACAMS monitors for VX at the STEL level experienced 602 instrument cycles in error (malfunction) out of 219,744 total cycles. ACAMS monitors for GB at the old TWA (new STEL) level experienced 194 instrument cycles in error out of 194,880 total cycles.10 These data do indicate that the ACAMS false-positive alarm rate has been reduced at TOCDF since prior NRC reviews (NRC, 1999).
Finding 4-1. The Army has taken significant steps to reduce the level of false alarms (false positives) for ACAMS and MINICAMS monitors at stockpile disposal sites, especially through the elimination of potential chemical interferences and by the adjustment of alarm levels (while still maintaining a statistical response rate of 95 percent or better for the detection of agent excursions above 1.00 STEL). False-positive alarms are still a problem, however, especially when monitoring at VX STEL levels using NRT monitors. Also, false positives are expected to be a significant problem when using DAAMS monitors equipped with FPDs to monitor at the 2003/2004 WPLs and GPLs.
Finding 4-2. In accordance with the determinations of previous NRC studies (NRC, 1999, 2001), the committee finds that the reliability of ACAMS, MINICAMS, and DAAMS appears to provide sufficient airborne agent monitoring capability to afford adequate protection to workers, the general public, and the environment.
ASSESSMENT OF CURRENT AIR MONITORING SYSTEMS
Assessment of ACAMS and MINICAMS Monitors
Instrument Capabilities
The Army is now using ACAMS and MINICAMS at stockpile sites to monitor for GB, HD, and VX at the CDC’s 2003/2004 STEL AELs and, when necessary, at the IDLH AELs. At the four incinerator sites, ACAMS are also used to monitor agent levels in the exhaust flows through the pollution abatement systems and the common stack at the source emission limit (SEL), which is equal to the prior allowable stack concentration (ASC) limit (NRC, 2001) and is moderately higher than the new STEL values for each agent (U.S. Army, 2004c). DAAMS monitors are used at stockpile sites for historical monitoring at the CDC’s 2003/2004 WPLs and GPLs and to confirm or deny ACAMS and MINICAMS alarms at the CDC’s 2003/2004 STELs (equal to the CDC’s 1988 TWA AELs).
One other application of ACAMS and MINICAMS monitors is to ensure that negative-pressure respirators are used properly. According to the Occupational Safety and Health
Administration (OSHA), an assigned protection factor of 50 should be used for negative-pressure respirators, such as the M40 mask. This means that the M40 mask can be used in environments with GB or VX present at concentrations up to 50 times their WPLs for 8 hours and in environments with agent present at concentrations up to 50 times their STELs for not more than 15 minutes. Because HD has been classified as a carcinogen (by the International Agency for Cancer Research), the concentration limit for the use of negative-pressure respirators for this agent is 1.00 STEL (equal to 7.50 WPL).
The committee expects that the more recently implemented use of ACAMS and MINICAMS to monitor for GB, HD, and VX at the CDC’s 2003/2004 IDLH levels, and at the CDC’s 2003/2004 STELs (numerically equal to the 1988 TWAs), should prove to be straightforward in view of the generally successful performance of these monitoring systems at the 1988 TWA AELs. Full implementation will require the following:
-
Developing and testing a monitoring method for the CDC’s new HD IDLH level,
-
Making minor modifications of existing IDLH methods for GB and VX (due to changes in these values), and
-
Testing the modified methods using ACAMS and MINICAMS monitors.
One major problem for ACAMS and MINICAMS monitors will continue to be the occurrence of false alarms when monitoring at the STEL for VX (equal to the CDC’s 1988 TWA value). False alarms caused by phosphorus-containing compounds (e.g., pesticides, phosphorus-containing impurities, degradation products of VX, and so on) are likely to continue unless ACAMS and MINICAMS monitors are reconfigured and/or upgraded to improve their chromatographic resolution and/or to monitor VX directly (rather than as the G-analog). Even with the occurrence of false-positive alarms, many years of operating experience have demonstrated that demilitarization operations can proceed safely as long as all such alarms are rigorously treated as real, until they are not confirmed by DAAMS analyses.
Finding 4-3. Air monitoring instrumentation used at stockpile disposal sites has been capable of reliable detection of the 1988 TWA levels for agents, as earlier NRC committees have indicated. These NRT instruments (ACAMS and MINICAMS) are likewise capable of detection at the 2003/ 2004 STEL and 2003/2004 IDLH levels.
Human Interfacing of Air Monitoring Systems
The human interfaces for ACAMS and MINICAMS do not appear to the committee to suffer from design deficiencies, with the caveat that future changes must be compatible with operators’ current mental models of the system operation. DAAMS interfaces are in effect the laboratory equipment used to determine the concentration in each DAAMS tube. These interfaces do not appear to have design deficiencies for their current uses. The design of the air monitoring system interface in the control room is part of a larger control system where the operators can call up particular ACAMS and MINICAMS results on their displays. Again, each individual display appears to be adequately designed, but the issue of integrating the information from several instruments has not been addressed.
Currently, the readouts of all ACAMS and MINICAMS are transmitted to the control room by the process data acquisition and reporting system (PDARS) and are displayed in the control room using a custom software interface. Here the results from individual ACAMS and MINICAMS are displayed on a geographic layout of the building, which is good practice for maintaining operator situational awareness. However, the individual ACAMS and MINICAMS displays are primarily character-based—that is, naming each ACAMS or MINICAMS device and giving its current reading and any special-condition codes (e.g., challenge or malfunction) as two-letter codes. Character-based displays are better for conveying detailed information but worse for the situational awareness required in an evolving incident. Color is used to some extent in the display of the building as a character changes from green to red when a threshold is exceeded. Better solutions involving symbols for special-condition codes and the use of color for indicating changes from a previous measurement would help operators to understand the overall situation rapidly and accurately. Detailed character information could then be called up when needed by selecting individual ACAMS or MINICAMS icons.
Training will be crucial to allow operators to make the correct decisions involving the redefined AELs. In particular, the concentration is the same for the old TWA and the new STEL, although they have quite different meanings. These changes need to be internalized by all personnel, particularly those who must make decisions regarding continued operation. It is not enough for an operator to be able to recite the definition and the associated actions: the operator must also be trained in what each concept means and why it is important. As noted above, it may be more difficult for an operator to unlearn a skill than to learn a new skill unrelated to prior experience.
Assessment of the A/DAM System
The A/DAM system has been used at only a few sites to monitor for GB, HD, and VX at the CDC’s 1988 TWA AELs, and for GB and VX at the CDC’s 1988 IDLH levels. For this reason, the committee cannot assess the reliability of the A/DAM system, although reliability is an important consideration for continuous NRT monitoring. Because the A/DAM system is based on the same technology as ACAMS,
MINICAMS, and DAAMS, however, the committee expects that the A/DAM system is capable of monitoring for GB, HD, and VX at the CDC’s 2003/2004 IDLH levels and STELs (equal to the CDC’s 1988 TWAs). If future tests of the A/DAM system demonstrate significantly improved selectivity compared with that from ACAMS and MINICAMS monitors and satisfactory reliability, the use of the A/DAM system for critical applications such as stack monitoring may justify the higher cost and complexity of the system.
Assessment of the DAAMS Monitors
2003/2004 STEL Confirmation and WPL Monitoring
The use of DAAMS monitors to confirm or deny ACAMS and MINICAMS alarms at the CDC’s 2003/2004 STELs should prove no more difficult than confirming or denying alarms at the CDC’s 1988 TWA levels. The CDC’s 2003 WPL for GB is greater than its 1988 GPL for GB and greater than its 1988 TWA level for VX—concentrations that have been monitored using DAAMS for many years. Thus, with respect to sensitivity, it should be possible to use current DAAMS techniques to monitor for GB at the CDC’s 2003 WPL, with only minor modifications. Similarly, because the CDC’s 2004 WPL for HD is greater than its 1988 GPL for HD, which has also been monitored using DAAMS for many years, only relatively minor changes should be necessary with respect to sensitivity to allow DAAMS to monitor for HD at the CDC’s 2004 WPL. These statements assume that the sampling period for DAAMS monitors, when sampling at the WPLs, is no less than 8 hours. (The typical DAAMS sample period used currently for GPL sampling is 12 hours.)
The response of the DAAMS FPD to sulfur-containing compounds, such as HD, is approximately quadratic, since the chemiluminescence detected is due to S2* and each HD molecule contains only one S atom. Thus, although current DAAMS monitors configured with FPDs appear to have adequate sensitivity to monitor at the CDC’s 2004 WPL for HD, the signal obtained will be about 50 times less than for the CDC’s 1988 TWA AEL (for the same sample volume). Because the concentrations of potential chemical interferences in the environments being sampled will, of course, be unaffected by changes in the regulatory limits for HD, it is likely that a much greater rate of false positives will be observed when using DAAMS monitors for HD at the CDC’s 2004 WPL rather than at the CDC’s 1988 TWA AEL.
The V-to-G-analog conversion method is routinely used when sampling for VX. Concentration ranges for 1988 DAAMS methods for VX are shown in Figure 4-3. The CDC’s 2003 WPL value for VX is less than its 1988 GPL for VX, but falls within the concentration range over which DAAMS methods must be certified for monitoring at the CDC’s 1988 VX GPL. Detection limits for VX for 1988 DAAMS methods have been reported to be as low as 30 pg.11 For a sample flow rate of 1 liter per minute, a sample period of 8 hours, and a concentration of 1.00 WPL for VX (1 picogram per liter), 480 pg of VX would be sampled. This mass is about 16 times greater than the lowest detection limit reported. Thus, with respect to instrument sensitivity, it appears that 1988 DAAMS methods can be modified to reliably determine VX at the CDC’s 2003 WPL.
It is anticipated, however, that interference problems are likely to be much greater when using DAAMS methods based on V-to-G-analog conversion to monitor at the CDC’s 2003 VX WPL than at the CDC’s 1988 TWA level for VX, which is 10 times greater than the CDC’s 2003 WPL for VX. The types of interferences expected are those caused by hydrocarbons, sulfur-containing compounds, and phosphorus-containing precursors, impurities, or hydrolysis and decontamination products.
2003/2004 GPL Monitoring
The use of DAAMS to monitor at the CDC’s 2003 GB GPL concentration should be relatively straightforward with respect to sensitivity. The phosphorus-equivalent concentration for GB at the CDC’s 2003 GPL is only about 33 percent less than the phosphorus-equivalent concentration for VX at the CDC’s 1988 GPL, which has been monitored successfully using DAAMS monitors for many years. It is anticipated, however, that the occurrence of false positives for GB GPL monitoring will increase compared with those experienced when using DAAMS to monitor at the CDC’s 1988 VX GPL.
The use of DAAMS to monitor at the CDC’s 2003 VX GPL will be problematic. The 2003 VX GPL level is 5 times less than the 1988 VX GPL. Although it is anticipated that DAAMS monitors will be sensitive enough to detect VX at this concentration, the probability of false positives is expected to increase significantly.
The use of DAAMS monitors configured with an FPD to determine HD at the CDC’s 2004 GPL may be extremely difficult. Although DAAMS monitors have been used successfully at the CDC’s 1988 GPL level for HD, the 2004 GPL for this agent is 5 times less, and the signal obtained from the FPD in the DAAMS GC will be 25 times less, compared with the signal obtained when monitoring at the 1988 GPL. It is therefore likely that the sensitivity of an FPD-based DAAMS will be insufficient to monitor at the 2004 HD GPL level and likely that the occurrence of false positives will be significant.
If interferences (false positives) increase for the CDC’s 2004 HD WPL and HD GPL—compared with the CDC’s 1988 AELs for HD—installing an XSD in the DAAMS GC
in place of or in addition to the FPD may provide a resolution to this problem. The XSD has a linear response to HD, is more sensitive to HD than the FPD is, and has less susceptibility to false positives from hydrocarbons than the FPD does. On the other hand, the XSD is susceptible to false positives caused by the presence of chlorine-containing compounds in the area being monitored, and the XSD requires more maintenance than the FPD (as evidenced, for example, by the fact that the manufacturer of the XSD for use with MINICAMS provides a replacement reactor-probe assembly with this detector).
During the past 3 years, the CMA has conducted research and development with the goal of improving DAAMS methods to enable monitoring for GB and VX at the CDC’s 2003 WPL and GPL concentrations. The new DAAMS equipment and methods have successfully passed laboratory P&A studies for these agents and concentrations. The results of field P&A studies, however, have been mixed. Field P&A studies have been passed for 4-day tests using 1-hour and 12-hour DAAMS samples at WPL levels. For 12-hour GPL DAAMS samples, however, P&A studies using a GC/FPD-based system passed for GB but failed for VX. P&A studies using a GC/MSD to analyze 12-hour GPL DAAMS samples passed for GB and VX, but with some difficulty. The failure and difficulties experienced during P&A studies for 12-hour GPL DAAMS samples were caused by the presence of intermittent chemical interferences in the areas being monitored.12
Finding 4-4. DAAMS has proven effective in monitoring at the CDC’s 1988 TWA and GPL levels at stockpile disposal sites for more than 15 years. Because the 2003/2004 STELs have the same numerical concentration values as the 1988 TWA levels, historical and confirmation monitoring of GB, VX, and HD at the new STELs using DAAMS will be no more difficult than monitoring these agents at the 1988 TWA levels. Also, monitoring at the 2003 WPL for GB using DAAMS will be straightforward, with no significant increase in the occurrence of false positives (compared with DAAMS monitoring for GB at the 1988 TWA level). However, although DAAMS either has or is likely to have adequate sensitivity for monitoring at 2003/2004 AELs, the frequency of false positives is expected to increase in the following cases:
-
The 2003 VX WPL, which is less than the 1988 GPL for this agent;
-
The 2004 HD WPL, which is less than the 1988 GPL;
-
The 2003 GB GPL level, which is one-third of the 1988 GPL level;
-
The 2003 GPL for VX, which is one-fifth of the 1988 GPL value; and
-
The 2004 GPL for HD, which is one-fifth of the 1988 HD GPL value.13
Potential upgrades to existing air monitoring systems used at stockpile sites are addressed in the next section of this chapter.
ENHANCEMENTS TO EXISTING TECHNOLOGIES FOR MONITORING AT THE CDC’S 2003/2004 AIRBORNE EXPOSURE LIMITS
To monitor at the new CDC-recommended STEL levels for airborne chemical agents, automated monitoring systems intended for use in the stockpile disposal program must be capable of determining VX concentrations as low as 0.9 parts per trillion by volume, GB concentrations as low as 16 parts per trillion, and HD concentrations as small as 456 parts per trillion. Manual monitoring systems must be capable of the determination of GPL VX concentrations as low as 0.05 parts per trillion, GB concentrations as low as 0.16 parts per trillion, and HD concentrations as low as 3 parts per trillion. In addition, automated and manual monitoring systems must meet stringent quality assurance/quality control requirements and must operate continuously and reliably.
Incremental improvements to the currently available commercial monitoring systems, which rely on sorbent-based sampling and temperature-programmed gas chromatography, are most likely to achieve improvements in airborne chemical agent detection sensitivity and specificity within a 1- to 2-year time frame. Monitoring systems based on these technologies include ACAMS, MINICAMS, and DAAMS, which have been described and evaluated in this report. The NRT monitor known as the A/DAM system, which is essentially an automated version of DAAMS, was also described in the recent non-stockpile report on air monitoring (NRC, 2005). The A/DAM system, however, although a more flexible analytical system than ACAMS or MINICAMS, has had little use in the stockpile disposal program because the A/DAM system is complex, heavy, and costly, compared with ACAMS and MINICAMS.
There are currently no commercially available automated or manual analytical systems other than those listed above that have demonstrated the capability to meet the monitoring requirements of the stockpile disposal program. Most agent detection technologies currently under development are generally targeting the homeland defense market and thus
are focused on the detection of airborne agent concentrations near or a little less than the CDC’s IDLH AELs. Thus, the concentrations of interest to most developers are several orders of magnitude greater than the STEL, WPL, and GPL AELs of interest in the chemical stockpile program.
There are incremental improvements to the current monitoring systems that are under development or currently available. For example, the CMA has sponsored research during the past 3 years that is expected to result in improvements in the sensitivity and selectivity of DAAMS monitors.14 The DAAMS improvements tested by the CMA included optimizing sample collection, using helium in place of nitrogen as the carrier gas, using a cryotrap to improve resolution and sensitivity, using a Dean’s heart-cut switch15 to improve the separation of agents from potential chemical interferences, optimizing the selection of GC columns to improve peak shape and chromatographic resolution, and so on. However, as noted in the findings presented in the previous section of this chapter, it is unclear whether the improvements under development will result in sufficient DAAMS selectivity to avoid significant levels of false positives when monitoring at the CDC’s 2003/2004 GPL levels.
Although the CMA has begun to monitor at the CDC’s 2003/2004 WPL concentrations using DAAMS, the agency recently sponsored an evaluation of three automated NRT air monitoring systems for the detection of VX, GB, and HD at WPL levels. The three NRT systems tested were an ACAMS equipped with an FPD, a MINICAMS equipped with a pulsed FPD (PFPD), and an A/DAM equipped with an FPD. Each NRT system was also configured with a front-end, high-volume sampler. Even with the high-volume sampler, the sensitivity of the ACAMS proved insufficient to monitor at the WPLs. Both the MINICAMS and the A/DAM systems passed 4-day P&A studies and 20-day baseline-study tests conducted in laboratories. Each of these two systems was then tested at a stockpile disposal plant. Although both systems passed a 4-day field P&A study for each of the three agents, the A/DAM system failed the 20-day field baseline studies for the three agents because of poor precision and calibration drift. The MINICAMS passed a 4-day field P&A study for each agent and also passed 20-day field baseline studies for GB and VX, but failed the baseline study for HD because of poor recovery.16
A number of possible enhancements applicable to the current air monitoring systems used at stockpile sites represent mature technologies that deserve consideration by CMA. These are addressed briefly in the following paragraphs.
The sensitivity of the FPD is directly proportional to the solid angle defined by the light source (that is, the flame) and the area of the light-sensitive surface (photocathode) in the photomultiplier tube (PMT). The sensitivity of the FPD may be increased by installing a convex lens between the flame and the PMT to increase the solid angle from which light is collected and to focus light onto the photocathode of the PMT. As an example, in a recent DAAMS study, the installation of a convex lens between the flame and the PMT resulted in an increase in the signal-to-noise ratio by about a factor of five (FOCIS, 2004). This modification is inexpensive and relatively simple to implement. An improvement in the signal-to-noise ratio may be especially important when using DAAMS to monitor at the CDC’s 2003/2004 GPLs.
Although cryotraps have been used to decrease eluted peak widths on GC/MSD-based DAAMS confirmation systems at stockpile disposal sites, cryotraps have not been used for routine DAAMS analysis by GC/FPD-based systems. A cryotrap is generally installed so that a short length of the front end of the GC’s analytical column can be cooled—using a tank of compressed, liquid carbon dioxide; chemical compounds entering the column are thus trapped in a narrow band. Alternatively, cryotraps may be cooled by a Peltier-based cooling system. A cryotrap may be heated ballistically to release the trapped chemicals to allow them to be separated before entering the detector. In a recent study, the peak widths for GB and the G-analog of VX obtained in a DAAMS were decreased and the heights of the peaks were increased by a factor of about four by the use of a cryotrap installed at the front end of the analytical column (FOCIS, 2004).
A PFPD is somewhat more selective and more sensitive than an FPD (Frischman and Amirav, 2000). This detector exhibits fewer false positives caused by hydrocarbons than the FPD does. The PFPD, however, is more expensive and more complex than the FPD to operate and maintain, and the PFPD will not reduce the frequency of interferences caused by phosphorus-containing compounds such as organophosphorus pesticides.
The XSD is more sensitive to HD than the FPD is, and the response of the XSD is linear (compared with the quadratic response of the FPD in the sulfur-specific mode). The
addition of an XSD to DAAMS may better enable the detection of HD at the CDC’s 2004 WPL and GPL AELs for this agent. Also, the XSD, which detects molecules based on their halogen atoms, may result in fewer false positives compared with those from the FPD because there are few naturally occurring chlorinated compounds versus a large number of naturally occurring sulfur-containing compounds (potential interferences). XSD-based MINICAMS monitors have been used successfully to monitor for HD at the ABCDF site, Aberdeen Proving Ground, Maryland.17,18
Sulfur chemiluminescence detectors (SCDs) use a hydrogen flame to produce SO from sulfur-containing analytes and react the SO with ozone to produce electronically excited SO2*, producing radiation near 340 nm (Benner and Stedman, 1989). SCDs have generally replaced the use of FPDs in the determination of low levels of sulfur-containing compounds in many complex analytical matrices (Sherer et al., 1990; Benner and Stedman, 1991). SCDs typically have a minimum detection limit of about 1 picogram of S per second versus about 100 picograms of S per second for the FPD, and the SCD is typically about 10,000 times more selective with respect to hydrocarbon interferences than the FPD is. Also, the response of the SCD is linear over about 4 to 5 orders of magnitude compared with the quadratic response of the FPD for sulfur-containing compounds. Commercial SCDs were developed specifically for and have been used successfully as detectors for GC systems for more than 15 years (Sherer et al., 1990).
All of the suggested enhancements to ACAMS, MINICAMS, and DAAMS presented above are mature technologies that have been used as accessories for GC systems for many years. There is one published technology that has not yet been fielded commercially as a GC detector but that may be worth considering for use in agent monitoring applications. This technology is a magnetically quenched FPD (Wakayama et al., 1987). In this FPD, the flame is located in a strong oscillating magnetic field, and the signal from the photomultiplier tube is detected using a lock-in amplifier. HPO* emissions are quenched by the strong magnetic field. HPO* emissions can be detected readily as a signal with the same frequency as that of the oscillating magnetic field. Emissions caused by the presence of chemical interferences (e.g., hydrocarbons and sulfur-containing compounds) will not be detected because S2* emissions and hydrocarbon emissions are not quenched by the magnetic field.
The development and testing of a fieldable magnetically quenched FPD are still in the development stage. This detector has the potential to become the most selective FPD for the detection of organophosphorus compounds such as GB and VX (compared with the conventional FPD and the PFPD). Nonetheless—as in the case of the FPD and the PFPD—the magnetically quenched FPD will not resolve interferences caused by phosphorus-containing compounds, such as organophosphorus pesticides.
Finding 4-5. The efforts of the Chemical Materials Agency (CMA) have resulted in the demonstration of significant incremental improvements in MINICAMS and DAAMS. It is clear, however, that even with the improvements demonstrated by the CMA, it will probably be difficult to monitor agents, especially VX and HD at the 2003/2004 GPL levels, without a significant increase in false positives (compared with monitoring at the 1988 GPL levels). Also, despite the success demonstrated to date, false positives may be a significant problem when monitoring at the 2003/2004 WPLs. Finally, false positives for ACAMS and MINICAMS monitors, especially when monitoring at the STEL for VX, are expected to continue.
Recommendation 4-5. The Chemical Materials Agency (CMA) should consider a wider range of incremental improvements to ACAMS, MINICAMS, and DAAMS to allow these monitoring systems to better monitor at the CDC’s 2003/2004 AELs. Some technologies that deserve consideration by the CMA include the following:
-
Adding a convex lens to the FPD to improve the signal-to-noise ratio of this detector in ACAMS, MINICAMS, and DAAMS;
-
The use of cryotraps for all DAAMS monitors to sharpen GC peaks and thereby improve selectivity and sensitivity;
-
The equipping of DAAMS systems with a PFPD in place of the FPD to enhance the selectivity and sensitivity of the DAAMS when monitoring for GB, VX, and HD;
-
The equipping of DAAMS monitors with an XSD to enhance the selectivity and sensitivity of this system when monitoring for HD;
-
The use of an SCD for the detection of HD; and
-
Funding the development of a phosphorus-specific FPD based on the magnetic quenching of HPO* emissions, a detector that is expected to be much more selective for organophosphorus compounds than is the conventional FPD or the PFPD.
ALARM LEVELS FOR NEAR-REAL-TIME MONITORS
This section examines the CDC’s recommendations and the Army’s written guidance regarding alarm levels for NRT monitoring systems. (See also Box 4-1.) Some of the issues presented here are described in more detail in the NRC’s recent report on air monitoring within the non-stockpile program (NRC, 2005).
|
BOX 4-1 Each automated and manual monitoring system (and its associated written methods) used at stockpile disposal sites must meet quality assurance/ quality control requirements for baseline studies that consist of daily 1.00-AEL challenges. Because of errors inherent in any instrument system, agent concentrations reported by NRT monitoring systems (i.e., found concentrations) are generally not in agreement with the true concentrations of agents in areas being monitored. This problem is addressed by requiring that NRT monitoring systems must yield found concentrations in the range of 0.75 to 1.25 AEL 95 percent of the time to pass a baseline study. If this requirement cannot be met, the alarm level for the NRT system must be set so that 95 percent of all 1.00-AEL challenges result in an alarm, and at least 75 percent of daily 1.00-AEL challenges must yield found concentrations in the range of 0.75 to 1.25. For manual monitoring systems, the reportable limit must be set so that 95 percent of daily 1.00-AEL challenges yield found concentrations greater than or equal to the reportable limit. The requirement that an alarm will be sounded at least 95 percent of the time for any NRT monitoring system that is challenged at a true concentration of 1.00 AEL has usually resulted in site-specific alarm levels in the range of about 0.2 to 0.5 AEL, and each monitoring system at a given site that is properly operated and maintained sounds an alarm at least 95 percent of the time that an excursion of agent at a true concentration at or above 1.00 AEL takes place.1 Statements in the CDC’s 2003/2004 Federal Register announcements (Federal Register, 2003, 2004) and the first method for setting NRT alarm levels listed in the CMA’s Programmatic Laboratory and Monitoring Quality Assurance Plan (U.S. Army, 2004a), however, indicate that it is acceptable to set the alarm level for an NRT system to 1.00 AEL, as long as the first-challenge pass rate is ≥95 percent. If the alarm level is set to 1.00, however, an NRT monitoring system will detect true agent excursions above 1.00 AEL and sound an alarm only 50 percent of the time, no matter how accurate the concentration data reported and no matter what the value of the first-challenge pass rate is (for an unbiased, normal distribution). The alarm level determines the probability that an alarm is sounded any time the true agent concentration in an area being monitored equals or exceeds 1.00 AEL. The lower the alarm level, the higher the probability of detecting such excursions. For example, for an alarm level set at 0.20 AEL, ACAMS or MINICAMS monitors typically have a probability of about 99 percent of sounding an alarm for an agent excursion above 1.00 AEL. Setting the alarm level at 0.20 AEL does not mean that the Army has, in effect, lowered the concentration of interest from 1.00 AEL to 0.20 AEL. The purpose of setting the alarm level at 0.20 AEL is to ensure a high probability of sounding an alarm any time that the true agent concentration in an area being monitored exceeds 1.00 AEL. Thus, the setting chosen for the alarm level is based on the desired degree of confidence in sounding an alarm and the distribution of found concentrations obtained for 1.00-AEL challenges. The alarm level has no impact on the calibration or daily operation of the NRT monitoring system. The Army must negotiate alarm levels for each disposal facility with the relevant state regulatory agency, and these alarm levels are typically specified in the facility’s operating permit. The setting chosen as the alarm level does have an impact on the probability of false negatives and the probability of false positives. For example, if an alarm level of 0.50 is chosen, ACAMS or MINICAMS monitors typically sound an alarm for true agent concentrations of 1.00 AEL at least 95 percent of the time, and an alarm fails to be sounded for this concentration less than about 5 percent of the time. For this example, the false-negative rate would be about 5 percent. On the other hand, for an alarm level set at 0.50, true agent concentrations of 0.50 AEL would result in an alarm about 50 percent of the time, and true agent concentrations of 0.80 AEL would result in an alarm about 69 percent of the time for a normal, unbiased distribution. These alarms, however, would be considered false positives because, although such an alarm results from the detection of agent, the true concentration of agent is less than the regulatory limit of 1.00 AEL. Data collected on found concentrations during P&A studies may be used to determine the proper settings for alarm levels to achieve a given probability of sounding an alarm for true agent concentrations at or above 1.00 AEL, and to enable determination of false alarm rates for various true agent concentrations and various alarm-level set points. Another type of false positive is the apparent detection of agent owing to the presence of chemicals in the area being monitored that results in positive signals from the NRT monitoring system. Such false positives may be reduced by raising the alarm level, but the rate of false negatives for the detection of 1.00-AEL concentrations of agent will also increase. As an example of an action that has resulted in a reduction in false alarms, the Army recently obtained approval from the State of Utah to increase the alarm set point from 0.2 to 0.5 when using ACAMS to monitor at the VX old TWA/new STEL level at TOCDF. This action reduced the false alarm rate by about a factor of three while still maintaining a statistical response rate of 95 percent for true VX concentrations of 1.00 TWA for all operational ACAMS at the TOCDF site.2 |
Some of the issues raised in this section of Chapter 4 regarding alarm levels for NRT monitoring systems also apply to reportable limits for manual monitors such as DAAMS.19 The committee chose to limit the discussion presented here to NRT monitoring systems because (1) more than 90 percent of the monitoring data generated at stockpile sites are obtained using NRT monitors; (2) alarm levels are most critical for NRT monitors, which are expected to provide an immediate warning to workers; (3) events causing positive DAAMS results are likely to have been detected by other means or corrected by the time DAAMS samples are analyzed; and (4) it is a simple matter to extract the key points in the discussion above and apply them to manual (DAAMS) monitoring.
Before discussing alarm levels for NRT monitors, it is important to review the following terms:
-
Alarm level. A predetermined value for an NRT method that, when equaled or exceeded, will result in an audible and/or visual alarm at the location of the NRT monitor. The alarm level must be set so that the statistical response rate at the alarm level is greater than or equal to 95 percent (U.S. Army, 2004a).
-
Action level. A predetermined value, usually for an NRT method, that, when equaled or exceeded, indicates the need to conduct a series of required actions in response to the apparent detection of agent. An action level is typically less than the alarm level for an NRT monitor. Actions taken when the action level is exceeded (but the alarm level is not exceeded) may include checking to ensure that the NRT monitor is functioning properly, locating and correcting a leak before the concentration of agent at the location being sampled exceeds the alarm level, and so on.20
The CDC’s 2003 Federal Register announcement regarding AELs for G and V nerve agents states (Federal Register, 2003, p. 58349):
In implementing the WPLs, STELs, and GPLs, specific reduction factors for statistical assurance of action at the exposure limits are not needed because of safety factors already built into the derivation of the exposure limit. This recommendation assumes that the sampling and analytical methods are measuring within ± 25 percent of the true concentration 95 percent of the time. If this criterion is not met, an alarm level or action level below the exposure limit may be required.
The CDC’s 2004 Federal Register announcement addresses airborne exposure limits for HD and includes the following statement (Federal Register, 2004, p. 24167):
Although the CDC does not specifically recommend additional reduction factors for statistical assurance of action at the exposure limit, exposures to sulfur mustard should be minimized given the uncertainties in risk assessment, particularly as related to characterizing carcinogenic potency.
No guidance regarding alarm or action levels for HD are included in the 2004 Federal Register announcement.
The Army’s latest version of its Programmatic Laboratory and Monitoring Quality Assurance Plan states that the alarm level for NRT monitors, which are used to monitor at STEL and IDLH concentrations, can be set one of two ways (U.S. Army, 2004a):
-
If the first-challenge pass rate is ≥95 percent for the NRT monitor, the alarm level may be set at 1.00 AEL.21
-
If a first-challenge pass rate of ≥95 percent cannot be achieved, the alarm level must be set to a value that results in a statistical response rate of ≥95 percent and a first-challenge pass rate of ≥75 percent must be maintained.22
The Army has adopted the CDC’s 2003/2004 recommendations regarding new AELs for the agents GB, VX, and HD. The Army has also prepared documents providing guidance or specific instructions that must be carried out in the event that the concentration of a given agent in an area being monitored exceeds 1.00 AEL (1.00 STEL or 1.00 IDLH for NRT monitoring systems). These documents include the following:
-
Implementation Guidance Policy for Revised Airborne Exposure Limits for GB, GA, GD, GF, VX, H, HD, and HT, June 18, 2004 (U.S. Army, 2004b);
-
Programmatic Monitoring Concept Plan, Final, June 2004 (U.S. Army, 2004c); and
-
Programmatic Laboratory and Monitoring Quality Assurance Plan, Final, June 2004 (U.S. Army, 2004a).
The purpose of an alarm level is to ensure a high degree of confidence that an excursion of the true agent concentration above 1.00 AEL will result in an alarm so that workers can take written required actions in a timely manner to protect themselves, the general public, and the environment. If the alarm level for an NRT monitoring system were set to 1.00 AEL, several potentially serious worker-perception, public-perception, and practical problems will result. These problems include the following:
-
The Army has successfully used a statistical approach to setting alarm levels for the past 20 years so as to ensure at least a 95 percent probability of detecting agent excursions at true concentrations equal to or greater than 1.00 STEL/TWA or 1.00 IDLH. Setting alarm levels at 1.00 and thereby reducing the probability of detecting true agent excursions above 1.00 STEL or 1.00 IDLH to 50 percent or less will be difficult to justify.
-
Because some instruments may be negatively biased and others may be positively biased, on any given day alarm rates (that is, the percentage of 1.00-AEL challenges that result in an alarm) may vary from 100 percent for some instruments to 0 percent for other instruments. This will lead to the impression that there is a large variation in performance from instrument to instrument.
-
Because the bias of a given instrument may vary from day to day or week to week, the alarm rate for a given instrument may vary from 100 percent to 0 percent during a given period of time. This will lead to an impression of widespread instrument instability.
-
HD has been classified as a carcinogen by the International Agency for Cancer Research, and the CDC has stated that exposure should be minimized. If the alarm level is set to 1.00 AEL, NRT monitoring systems will fail to sound an alarm 50 percent of the time that the true concentration of HD exceeds 1.00 AEL (for an unbiased, normal distribution). This seems to violate the CDC’s requirement that exposure to sulfur mustard should be minimized.
Finding 4-6. The Army’s plan to allow alarm levels for NRT monitors to be set at 1.00 AEL, especially for the CDC’s 2003/2004 STEL and IDLH values, has the potential to be perceived by workers and the general public as a significant reduction in safety for workers; will result in widely varying alarm rates from instrument to instrument and from week to week; will increase the probability that a worker may be exposed to unacceptable levels of HD, a classified carcinogen; and will increase the likelihood that the Army will not respond properly or in a timely manner to the presence of agents at true concentrations above the AELs. The only perceived benefit to raising the alarm level to 1.00 AEL is a possible reduction in the rates of false alarms, but this benefit is gained at the expense of a higher probability of false negatives.
Recommendation 4-6. The Army should consider continuing to use alarm levels that ensure that all properly operated and maintained NRT monitors at a given site have at least a 95 percent probability of sounding an alarm any time the true agent concentration in an area being monitored exceeds 1.00 STEL.
Finding 4-7. At some sites, state regulators may insist that alarm levels be set at 0.2 STEL, the lower limit of certification for NRT monitors, even though it is likely that a statistical response rate of 95 percent or better can be achieved with the alarm level set at 0.5 STEL. Although an alarm level of 0.2 STEL typically ensures at least a 99 percent probability of detecting a true agent excursion above 1.00 STEL, alarm levels this low contribute significantly to the frequency of false alarms observed at stockpile disposal sites and contribute to a reduction in worker safety caused by the human tendency to discount an alarm if false alarms are experienced frequently.
MONITORING DATA ACQUISITION SYSTEMS AT STOCKPILE DISPOSAL SITES
Automated NRT monitors in demilitarization facilities are linked to the plants’ process data acquisition and recording system (PDARS), which transmits data to the control room and as well as archiving it for managerial and regulatory use. The PDARS was designed some time ago and has relatively limited data transmission and processing power. Enhancements in automated monitoring system components must be compatible with PDARS interface and bandwidth requirements. Systemization procedures for interfacing automated chemical agent monitors with PDARS and other data acquisition and recording systems are specified in the Programmatic Laboratory and Monitoring Quality Assurance Plan (U.S. Army, 2004a).
The results of DAAMS analyses and other nonautomated analytical measurements are recorded by a laboratory information management system (LIMS), which also archives the data. The LIMS used is specific to each demilitarization site, but general guidance is provided by CMA programmatic documents (U.S. Army, 2004a). Since the LIMS is much more easily upgraded and expanded than the PDARS is, enhancements in laboratory-based chemical agent monitoring for confirmation and historical monitoring should not be constrained by limitations in data acquisition and recording systems.
REFERENCES
Aue, W.A., and X. Sun. 1993. Quenching in the flame photometric detector. Journal of Chromatography A 641(2): 291−299.
Benner, R.L., and D. Stedman. 1989. Universal sulfur detection by chemiluminescence. Analytical Chemistry 61(11): 1268−1271.
Benner, R.L., and D.H. Stedman. 1991. Field evaluation of the chemiluminescent detector. Environmental Science and Technology 24(10): 1592−1596.
Federal Register. 1988. Final recommendations for protecting the health and safety against potential adverse effects of long-term exposure to low doses of agents GA, GB, VX, mustard agent (H, HD, T), and lewisite (L). Federal Register 53(50): 8504−8507.
Federal Register. 2003. Final recommendations for protecting human health from potential adverse effects of exposure to agents GA (tabun), GB (sarin), and VX. Federal Register 68(196): 58348−58351.
Federal Register. 2004. Interim recommendations for airborne exposure limits for chemical warfare agents H and HD (sulfur mustard). Federal Register 69(85): 24164−24168.
FOCIS. 2004. Development of New Technologies to Meet the Proposed General Population Limit (GPL) and the Proposed Time-Weighted Average (TWA) Limits for GB and VX. Final Laboratory Development Report. December 27. Submitted to Chemical Materials Agency, Aberdeen Proving Ground, Md. Newton, Mass.: FOCIS Associates, Inc.
Frischman, G., and A. Amirav. 2000. Fast GC-PFPD system for field analysis of chemical warfare agents. Field Analytical Chemistry and Technology 4(4): 170−194.
NRC (National Research Council). 1994. Review of Monitoring Activities Within the Army Chemical Stockpile Disposal Program. Washington, D.C.: National Academy Press.
NRC. 1999. Tooele Chemical Agent Disposal Facility: Update on National Research Council Recommendations. Washington, D.C.: National Academy Press.
NRC. 2001. Occupational Health and Workplace Monitoring at Chemical Agent Disposal Facilities. Washington, D.C.: National Academy Press.
NRC. 2002. Evaluation of Chemical Events at Army Chemical Agent Disposal Facilities. Washington, D.C.: The National Academies Press.
NRC. 2005. Impact of Revised Airborne Exposure Limits on Non-Stockpile Chemical Materiel Program Activities. Washington, D.C.: The National Academies Press.
Rice, C.W. 1951. Method and apparatus for electrically detecting vapors and the like. U.S. Patent 2,550,498, filed April 24, 1951. Chester W. Rice, inventor. General Electric Company, assignee.
Roberts, J.A. 1957. Electrical vapor detector. U.S. Patent 2,795,716, filed June 11, 1957. John A. Roberts, inventor. General Electric Company, assignee.
Sherer, R.L., D.L. O’Neil, R. Rios, and M.P. Baker. 1990. Analyses of sulfur chemiluminescence detection. Journal of Chromatographic Science 28(1): 24−28.
Thurbide, K.B., and W.A. Aue. 1994. Reactive-flow luminescence detector for gas chromatography. Journal of Chromatography A 684(2): 259−268.
U.S. Army. 1997. The Army Chemical Agent Safety Program. AR 385-61, February 28 . Washington, D.C.: Headquarters, Department of the Army.
U.S. Army. 2001. CERTIFY 4.0 User’s Manual. January. Aberdeen Proving Ground, Md.: Program Manager for Chemical Demilitarization.
U.S. Army. 2003. Resource Conservation and Recovery Act Hazardous Waste Permit Application for the Department for the Army Pine Bluff Non-Stockpile Facility. February. Pine Bluff, Ark.: Pine Bluff Arsenal Public Affairs Office.
U.S. Army. 2004a. Programmatic Laboratory and Monitoring Quality Assurance Plan. Final, June. Aberdeen Proving Ground, Md.: Chemical Materials Agency.
U.S. Army. 2004b. Implementation Guidance Policy for Revised Airborne Exposure Limits for GB, GA, GD, GF, VX, H, HD, and HT. June 18. Washington, D.C.: Department of the Army, Office of the Assistant Secretary of the Army (Installations and Environment).
U.S. Army. 2004c. Programmatic Monitoring Concept Plan. Final, June. Aberdeen Proving Ground, Md.: Chemical Materials Agency.
Wakayama, N.I., H. Nozoye, and I. Ogasawara. 1987. Application of a modulated magnetic field to a flame photometric detection burner in the detection of phosphorus. Analytical Chemistry 59(4): 681−684.


