National Academy of Sciences | 150 Year Anniversary

Questions? Call 800-624-6242

| Items in cart [0]

The National Academies Press

PAPERBACK
price:$48.00
add to cart

Rights & Permissions

topleft topright

Population, Land Use, and Environment: Research Directions (2005)
Board on Environmental Change and Society (BECS)

Citation Manager

. "Plates." Population, Land Use, and Environment: Research Directions. Washington, DC: The National Academies Press, 2005.

Please select a format:

BibTeX EndNote RefMan


Page
323
bottomleft bottomright

The following HTML text is provided to enhance online readability. Many aspects of typography translate only awkwardly to HTML. Please use the page image as the authoritative form to ensure accuracy.


Population, Land Use, and Environment: Research Directions

PLATE 1 Average transport cost (Yuan per ton-kilometer).

Page
323
Front Matter (R1-R14)
PART I--PANEL REPORT: Executive Summary (1-6)
1 The State of Knowledge (7-30)
2 Recommended Research Directions (31-39)
References (40-50)
PART II--PAPERS: 3 Global and Case-Based Modeling of Population and Land Use Change--Günther Fischer and Brian C. O’Neill (51-83)
4 Population and Environment in the U.S. Great Plains--Myron P. Gutmann, William J. Parton, Geoff Cunfer, and Ingrid C. Burke (84-105)
5 Population and Environment in Amazônia: Landscape and Household Dynamics--Emilio F. Moran, Eduardo S. Brondízio, and Leah K. VanWey (106-134)
6 Population Change and Landscape Dynamics: The Nang Rong, Thailand, Studies--Stephen J. Walsh, Ronald R. Rindfuss, Pramote Prasartkul, Barbara Entwisle, and Aphichat Chamratrithirong (135-162)
7 The Urban Ecology of Metropolitan Phoenix: A Laboratory for Interdisciplinary Study--Charles L. Redman (163-192)
8 Economies, Societies, and Landscapes in Transition: Examples from the Pearl River Delta, China, and the Red River Delta, Vietnam--Karen C. Seto (193-216)
9 Beyond Population Size: Examining Intricate Interactions Among Population Structure, Land Use, and Environment in Wolong Nature Reserve, China--Jianguo Liu, Li An, Sandra S. Batie, Scott L. Bearer, Xiaodong Chen, Richard E. Groop, Guangming He, Zai Liang, (217-237)
10 People, Land Use, and Environment in the Yaqui Valley, Sonora, Mexico--Pamela Matson, Amy L. Luers, Karen C. Seto, Rosamond L. Naylor, and Ivan Ortiz-Monasterio (238-264)
11 Patterns of Urban Land Use as Assessed by Satellite Imagery: An Application to Cairo, Egypt--John R. Weeks, Dennis P. Larson, and Debbie L. Fugate (265-286)
12 A Review of 10 Years of Work on Economic Growth and Population Change in Rural India--Andrew Foster (287-308)
Appendix About the Contributors (309-322)
Plates (323-330)

Below are the first 10 and last 10 pages of uncorrected machine-read text (when available) of this chapter, followed by the top 30 algorithmically extracted key phrases from the chapter as a whole.
Intended to provide our own search engines and external engines with highly rich, chapter-representative searchable text on the opening pages of each chapter. Because it is UNCORRECTED material, please consider the following text as a useful but insufficient proxy for the authoritative book pages.

Do not use for reproduction, copying, pasting, or reading; exclusively for search engines.

OCR for page 323
Population, Land Use, and Environment: Research Directions PLATE 1 Average transport cost (Yuan per ton-kilometer).

OCR for page 324
Population, Land Use, and Environment: Research Directions PLATE 2 Results of transport flow model for rice.

OCR for page 325
Population, Land Use, and Environment: Research Directions 
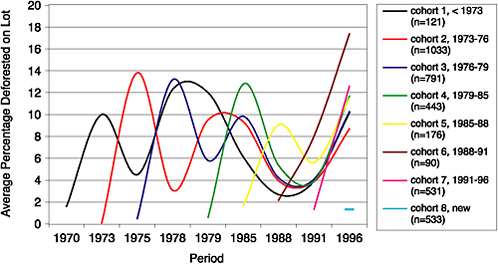
PLATE 3 The Colonist Footprint: Average deforestation trajectories across cohorts. The cohorts refer to dates when groups of settlers first arrived at this location and the deforestation trajectory is the average area deforested by each group or cohort. Adapted from Brondizio et al. (2002). 
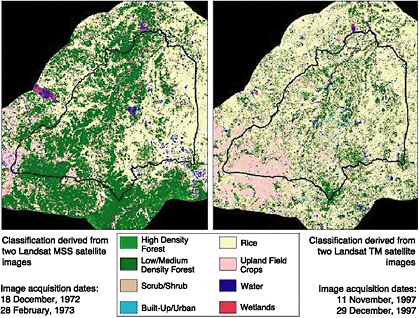
PLATE 4 Image comparison of land use and land cover in Nang Rong district (bounded by dark irregular line) and a surrounding 10 km buffer area, 1972-1973 and 1997.

OCR for page 326
Population, Land Use, and Environment: Research Directions PLATE 5 Finer scale analysis of historic land use change, historic land use, Phase II, for one square mile section around a 200-point survey point

OCR for page 327
Population, Land Use, and Environment: Research Directions PLATE 6 Pearl River Delta study area. The upper left inset shows the Guangdong Province within China; the upper right inset pinpoints the study area in relation to the province; the bottom inset is a satellite composite image of sample data from the Landsat Thematic Mapper circa 1992.

OCR for page 328
Population, Land Use, and Environment: Research Directions PLATE 7 Red River Delta study area. The left inset shows the study area in relation to the country (Vietnam). The right insetis a satellite composite image from the Landsat Thematic Mapper circa 1992.

OCR for page 329
Population, Land Use, and Environment: Research Directions 
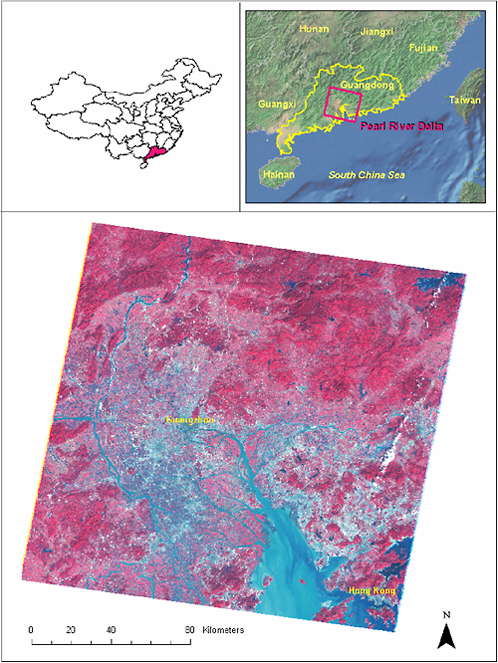
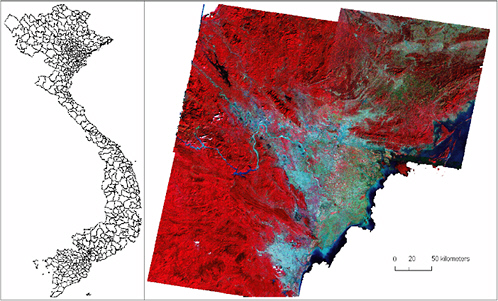
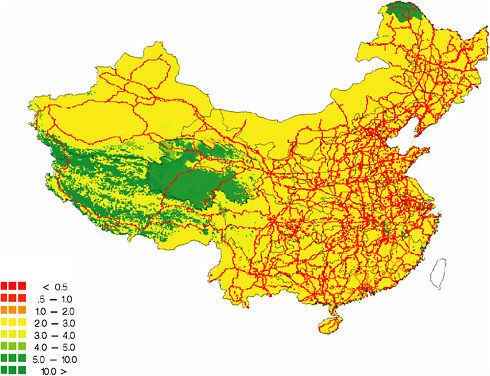
PLATE 8 Location of Wolong Nature Reserve. 
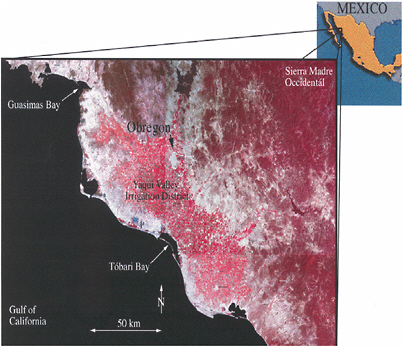
PLATE 9 Yaqui Valley study region in Northwest Mexico. The satellite image is a three-band color composite from Landsat data. Agriculture and other regions of green vegetation show up as red. Water shows as black or blue and urban or barren land show as grey or white.

OCR for page 330
Population, Land Use, and Environment: Research Directions PLATE 10 Survey villages and weather stations used to impute rainfall.

Representative terms from entire chapter:

satellite composite