
Panel III
Peripherals: Current Technology Trends
INTRODUCTION
Kenneth Flamm
University of Texas at Austin
Dr. Flamm, praising the quality of the panel’s speakers, called on Mark Bregman to begin the session.
THE PROMISE OF STORAGE SYSTEMS
Mark F. Bregman
Veritas Software Corporation
Dr. Bregman pointed out that he would be speaking about software, asserting that the area had been overlooked in the discussion of productivity in the computer industry. He argued that this omission accidentally amplified Dr. McQueeney’s point that, to see where productivity gains are coming from, it is necessary to look above the hardware level.
Introducing his company, Veritas Software, he said that with about $1.5 billion in annual revenue it is the number-one player in the storage software busi-
ness. This sector covers all software used to help store, access, or manage data, providing among other things better data availability, data protection, and disaster recovery. Because its software products were independent of any specific underlying hardware platform, he noted, the business stayed clear of the debates over RISC vs. SISC, Sun vs. Intel, or the merits of various operating systems. He characterized software storage as a fairly well-defined yet large niche and said that it had posted a “dramatic” 41 percent compound growth rate over the previous five years.
In his own attempt to deconstruct the computer, Dr. Bregman recounted, he had begun with Moore’s Law, then turned to the communication between the elements that do the computing as reflected in Gilder’s Law: Bandwidth grows three times faster than computing power.13 This latter formulation, he commented, “really just says that bandwidth is growing dramatically—getting cheaper, more available—and that that’s driving something.” He then cited a yet-unnamed law stating that storage achieves 100 percent growth in density annually, saying that translated into better cost at a dramatic rate. “The improvement at the storage element level is happening faster than it has been in the microprocessor level over the last several years,” he asserted.
To illustrate the implications of this advance, he offered a quote from the November 25, 2002, issue of BusinessWeek: “E*Trade finished yanking out 60 Sun servers that cost $250,000 apiece and replaced them with 80 Intel-powered Dell servers running Linux that cost just $4,000 each.” Such instances as this factor-of-50 improvement in underlying capital investment were proving a source of concern for suppliers of storage hardware, whose business had declined by a factor or three over the previous two years, reflecting a major change in the landscape of the marketplace for storage systems. “Just to be fair, not all of this decline is coming about purely because of disk-drive technology,” said Dr. Bregman, who pointed in addition to changes at the storage-subsystem level arising from the combined influence of improvements in communications, in computing capacity, and in software that utilizes and links the underlying disk-drive technology.
Addressing the issue of actual business benefit derived by the customer, Dr. Bregman posited that simply quantifying end users’ investments in information technology might not be the right way to gauge their levels of productivity improvement. He noted that the industry was pervaded by nervousness resulting from the recent slowing of the purchase rates of both software and hardware, which had reflected the vigorous growth of the economy through 2000. He sug-
|
13 |
According to George Gilder, “bandwidth grows at least three times faster than computer power.” This means that if computer power doubles every 18 months (per Moore’s Law), then communications power doubles every six months. Bandwidth refers generally to the amount of information that can be transmitted over a connection over a fixed period of time. See www.netlingo.com. |
gested, however, that it is not so much the amount of hardware and software acquired as the manner in which they are used that “really drives labor.” Turning specifically to storage, he pointed to a 2001 study by the market-intelligence firm IDC indicating that 29 percent of total enterprise spending on storage went to hardware, with 13 percent going to software and 58 percent going to labor. Since it is classed as overhead, a good deal of the labor content is not measured very well, and yet “it’s the driving factor in the investment to get productivity” from IT acquisitions, he argued, adding: “If you’re sitting here as a CIO being told, ‘Do more with less,’ the big nut to crack is labor.”
Given the amount of data currently stored in the United States and an estimate by Forester Research that a single storage administrator could typically handle about 700 gigabytes of capacity, Dr. Bregman put the number of storage administrators in the country at 8 million in 2003. This brought to his mind the old story that the telephone system was going to collapse because everyone was going to become a telephone operator, a threat whose only solution was to adopt automated switching, thus changing the paradigm. Automation was the solution in the case of storage as well, but it would come, in his opinion, from software rather than hardware.
In order to keep the discussion firmly focused on the business drivers rather than the technology drivers, he turned his attention to the issues that preoccupy corporate chief information officers on a day-to-day basis. The CIO, whose responsibility was more and more frequently extending beyond technology to the business itself, faced two conflicting, or apparently conflicting, demands. The first demand was to increase service levels, driven by both employees’ growing need for online access to applications from inside the enterprise and—even more important—customers’ growing need for access from outside. The second demand, particularly over the previous couple of years, was to shrink the IT budget. “‘Do it all,’” is what Dr. Bregman said the CIO had been hearing from the CEO. “‘Increase the performance, increase the service levels, give me a better result—but spend less money.’”
Expanding on the first demand, that service levels be increased in line with burgeoning need for online access, he posited that if a firm were running its payroll or accounting system using its own IT infrastructure, which wasn’t visible to the employees directly, and the payroll ran and didn’t complete, it could be run again—with the worst consequence being that employees would receive their paychecks an hour late. But in the case of an online transaction, going offline could mean losing the transaction, and perhaps even the customer. Officials with an options exchange in Chicago had told him that if they were offline for a matter of minutes, they would lose millions of dollars; if they were offline for hours, they would permanently lose a part of their business, which would go to a different exchange; and if they were offline for a week, they would be out of business altogether because the work would be taken up in Philadelphia, London, or elsewhere and would not come back. CIOs were thus being asked to raise availability
and quality of service in an increasingly complex environment. “Throwing more hardware at the problem,” Dr. Bregman declared, “doesn’t solve that problem.”
What this first demand, coupled with the second—the need to save money—translated to for CIOs of many IT organizations was the quest to get more efficient use of the hardware and storage they had while making staff both more effective and more productive. Software’s value here, Dr. Bregman said, was that it could provide increased serviceability and service levels and at that same time produce better effectiveness and efficiency. While noting that the traditional approach to making a system highly available was to build redundant hardware and highly available hardware platforms, he said that now high availability was increasingly being provided with software—which made possible the use of lower-cost and potentially less reliable or available hardware and relied on software to manage overall system availability. This could be observed in those storage subsystems in which disk drives were put together with RAID and other software solutions.
But it could be observed in high-end servers as well, he said, citing as an example the changes made at eBay since a major outage had brought its auctions to a standstill several years before. “You don’t hear that anymore,” Dr. Bregman noted, asking: “Is that because somehow magically the servers have gotten to a much lower mean time between failure?” In fact, eBay’s servers were continuing to fail just about as often as they did when the outage occurred, but the company in the meantime had set them up in a clustered configuration so that when one failed, operations went on without interruption.
Software could be used not only to shore up availability but also to improve performance. Dr. Bregman conceded that the notion might seem “odd”; experience with the PC, he acknowledged, suggested that each succeeding version of a software package ran more slowly and that only the advent of the next-generation microprocessor could restore or improve system speed. He stated, however, that high-quality software could in reality optimize efficiency, particularly in storage systems: Intelligent software can manage storage and improve performance efficiency, and “you can do things like drive the storage subsystem to look ahead and fetch information from a disk—which is intrinsically slower than DRAM memory—and put it into a cache.” As an example of the dramatic difference software could make, he pointed to a Veritas file system designed to run on top of UNIX operating systems that, when substituted for the UNIX file system that Sun Microsystems shipped with its Solaris, provided a 15-fold performance improvement in “real-world, transactional applications” without additional hardware. He further pointed out that, although software is certainly not free, its price is far more negotiable than that of hardware because there is no intrinsic manufacturing cost, which he called “a real leverage point” and “something that has been overlooked in the debate about IT productivity metrics.”
Finally, software could provide value by managing complexity, achieving lower cost both through labor efficiency—better tools, so that a storage adminis-
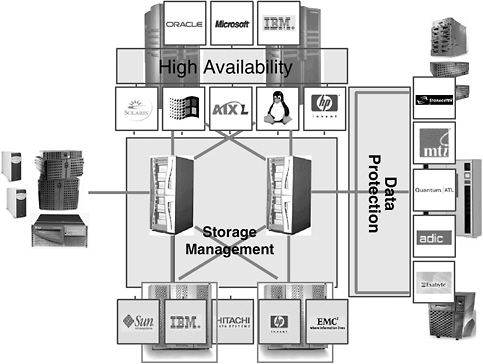
FIGURE 17 Better availability and performance.
trator could manage a distributed storage facility much larger than a mere 700 gigabytes—and through better hardware utilization. Typical storage utilization in enterprises was only about 40 percent of its capacity; firms could acquire very large amounts of storage as a result of buying another server for each new application required, but the storage remained in islands. Through technology whereby Veritas had put high-density storage together with high-performance communication, the entire storage capacity could be connected into a single storage network accessible from all servers, so that actual storage needs could be met across the network. Different categories of storage might be established, so that a high-performance application would be placed on a high-end array and low-performance needs could be met at lower cost. “The software can manage that in a way that takes the labor out of it at the same time,” Dr. Bregman noted.
Displaying a chart he described as “my version of the complexity picture,” he called the audience’s attention to a server and its backup, interconnected for failover, that were partially hidden by the label “High Availability” at the top (see Figure 17).14 Below them, in the middle of the field, were storage directors, de-
vices that allowed connection of the storage shown at the bottom to any of the servers; these storage directors were also redundant in order that high availability and high throughput could be achieved. On the right-hand side were tape and other devices used for data protection, backing up the data and in some instances storing it offsite. All of these elements needed to be connected or managed through three categories of storage software: data protection software, the traditional backup or data-replication software; high-availability software, which manages the failover between systems and the dynamic workload provisioning between systems; and storage management software, which handles the virtualization of that storage pool, the management of those file systems, and the performance of the storage system. He called these three areas “critical to being unable to unlock the value that people have invested in by buying all this high-performance hardware.”
Focusing on the storage capacity represented at the bottom of the graphic, Dr. Bregman noted that it could be a pool of heterogeneous storage of different categories acquired from different vendors—some being high-density storage array, some the low-cost, low-performance capacity known as JBOD for “just a bunch of disks”—connected to a network. Storage-virtualization software allowed applications to treat that storage as a uniform pool and to select what was needed. Newly emerging, he said, was server-virtualization software, which performs a similar function for the server pool, allowing applications to be distributed across that pool of servers and not only to be provisioned as needed but even to be provisioned dynamically as needed, “so if an application sees a spike in demand, it can grab more resources out of that pool, perhaps at the expense of an application of lower priority.”
To conclude, Dr. Bregman presented a matrix showing eight markets in which Veritas and its subsidiaries were active: availability software for storage, servers, and applications; performance software in the same three fields; and automation software for storage and servers. His company led the market in all three varieties of availability products, he said, through clustering, backup, and data replication. The storage performance category was characterized by very specialized, very high-tech kernel-level software that he called “the software world’s equivalent to microprocessor design”; a company Veritas was acquiring, Precise, offered similar products at the server and applications levels. Automation or utilization-improvement software provided automated server provisioning and automated storage provisioning.
Software of this kind, Dr. Bregman contended, had escaped the attention of those studying which metrics might reflect the relationship of IT investment to productivity. “My single message,” he stated, “is that as we think about trying to understand what is driving the new economy—or simply the economy—in terms of IT investment and IT return, we should not lose sight of software, and particularly of infrastructure software.” While it might be easier to think about application-level software, such as ERP [enterprise resource planning] application sys-
tems, as a business process, he warned, a great deal of value and innovation was being created in the system infrastructure software of the type that he had been discussing.
GRAPHICS
Chris A. Malachowsky
NVIDIA Corporation
Mr. Malachowsky, NVIDIA’s co-founder and Vice President of Engineering, introduced his company as the largest fabless semiconductor company in the world, having been the first to reach $1 billion and then $2 billion in annual revenue. Employing around 1,600 and headquartered in Santa Clara, CA, NVIDIA focused on graphics and media processors—which he called a “volume niche in the computing space”—selling into the professional workstation, mobile device, consumer electronics, personal computer, and chipset markets. The company concentrated on the intellectual property that went into the design of its chips: It defined the formula according to which they were manufactured, but it outsourced their production, then forwarded the devices on to its customers. NVIDIA, he said, took responsibility for manufacturing quality without managing the manufacturing process directly. The risk of outsourcing was “mitigated somewhat when you keep your expertise in the area in which you’ve outsourced,” he commented, adding that “when you take ownership of that, you’re not losing a skill, you’re just not investing in the infrastructure of that process.”
Although NVIDIA itself was marketing a card it made for the workstation market, in the PC market it was selling integrated circuits that went onto add-on cards rather than selling the actual add-ons. The company designed a device along with the PC board it would go onto and sent its own components to a contract manufacturer, which procured the other needed components, put the board together according to NVIDIA’s formulation, and tested it according to NVIDIA’s standards. Having numerous distribution channels—some production was going to OEMs like Dell, Compaq, or HP, some to value-added resellers—had ensured the company a diversity it had found valuable in an economy in which customer segments could grow at varying rates. Recalling a juncture “when the branded PCs were challenged by no-name guys who were using similar components and selling cheaper,” Mr. Malachowsky remarked that “when the economy got tough, people seemed to go back” to the Dells and Compaqs, perceiving them to be “a safer investment.”
Turning to graphics as a technology, he remarked that, in contrast to the rest of the computer, the graphic element is one that “you can see,” that allows “you [to] touch progress or sense progress.” Although full accuracy in visual representation—which is complete correspondence between a visual representation and that which is being represented—had not been achieved, graphics capability had been improving—and, in any case, the goal of graphics is not literal accuracy but
rather the ability to “fool the eye” into seeing what the artist wants to convey. Still, an enormous amount of computation was required to make “something that was a still photo last year into something that can spin and twirl and that you can interact with this year,” Mr. Malachowsky noted, adding that Moore’s Law had allowed his industry to do more with the resources available as time had progressed.
The film industry provided an illustration of how graphics was in the process of catching up with some of the other digital media: Movie-making chores that previously required farms of thousands of machines had become possible using consumer PCs at dramatically lower costs. Describing the advance in the sophistication of images as semiconductor complexity grew to the level of 120 million–130 million transistors per chip, Mr. Malachowsky noted that without the storage software Dr. Bregman had discussed, “we’re nothing.” He displayed a chart tracking the rapid increase in power and complexity through four generations, each separated from the next by about 12–18 months, of one of NVIDIA’s product lines: the GPU, or graphics processor unit, in which independent logic elements predominate over memories and caches.
A second chart documented product performance improvements between the second half of 1997 and the first half of 2003, which ran at an annualized rate of 215–229 percent. He touted the graphics industry’s exploitation of not only semiconductor technology and architecture, but also algorithmic advancement, to further its development.
NVIDIA had moved its compute resources onto what he characterized as “small, cheap, no-name, small-form-factor, space-efficient processing” in 1U and 2U packages with dual or quad processors that had “a couple gigabytes” of memory on them.15 The company was in the process of buying, every other month, about 250–300 of these units, which cost little enough “that you don’t have to worry about fixing them”; and even though it was taking out older units, the computing capability of its farm was doubling every six months. “We have, I think, two guys that run 5,000 computers,” Mr. Malachowsky said. “You plug a new one in, it configures itself, it downloads its operating system, it puts itself in all the queues, identifies itself to everybody—pretty impressive.” The company was allocating its computing resources between a Sun farm—“traditional workstation-class compute resources”—and thousands of smaller Linux-based machines, and it was the capability of the Linux kernel16 that was keeping the Sun
|
15 |
This refers to the size of a relatively small server. A server is a host computer on a network. It houses information and responds to requests for information (for example, it houses Web sites and executes their links to other Web sites). The term server also refers to the software that makes the act of “serving information” possible. See www.netlingo.com. |
|
16 |
A kernel is the central module of an operating system. It loads first and remains in memory to control memory management, disk management, and process and task management. It’s called a kernel because it stays as small as possible while still providing all the essential nutrients required by other applications. See www.netlingo.com. |
farm active.17 “As 64-bit computing comes about, the processing elements are available,” he noted. “As the kernel gets stable, and the processing elements are pervasive, and manufacturers test basic PC components with very large amounts of memory, we’ll switch over. All the pieces are there, but it needs to stabilize long enough for it to run.” Jobs needing to run for four or five days were therefore directed to the Sun farm. “Twenty-gigabyte databases doing place and route of chips—not large by some standards, but you need it to stay running and you need it to have a large memory access, a large dataset,” he explained. NVIDIA had, over the preceding three years, purchased $200 million worth of CAD (computer-aided design) tools, which are indispensable to the design business. It also owned $45 million worth of emulation, a technology used to map a design onto programmable hardware elements that then act like a chip. “It’s slower,” he conceded, “but it’s operating on hardware and it gives you the ability to plug it into a real system.”
According to Mr. Malachowsky, graphics was one among only three classes of semiconductors that could continually take advantage of Moore’s Law without being regarded as a commodity, which he named and remarked on as follows:
-
Processors: “You can always include more cache or provide multiple parallel processors on a die—give me more transistors, I can build you a better mousetrap”
-
Field-programmable gate arrays (PGAs): “You give me more transistors, it will have a larger programmable device that can satisfy more applications”
-
Graphics: “You give us more transistors. We’ll do better algorithms. We’ll do them more in parallel. We’ll get more real. We’ll offload more of the software burden.”
Adding “too many more transistors” was, in the case of most other semiconductors, commoditizing: “You’re competing just on price, not on the value.” In the graphics sector, in contrast, transistors were consumed as quickly as they became available and performance increased commensurately.
Beginning a quick overview of the evolution of computer graphics, Mr. Malachowsky noted that expensive machines were required to produce images of the pre-1987 first generation, which nonetheless consisted of little more than line segments in a “wireframe” design. In the second generation, dating from 1987 to 1992, more colors and solid backgrounds were added in the interest of verisimilitude. Even though emphasis on literal accuracy was limited and the viewer would
|
17 |
A farm is a group of networked servers that are housed in one location in order to streamline internal processes, distributing the workload between the individual components. In other words, a server farm expedites computing processes by harnessing the power of multiple servers. See www.netlingo.com. In this instance, the speaker is referring to Sun Microsystems’ network. |
not have confused these images with reality, he remarked, “You could now get lost in it. You could start focusing on the training aspects of the flight simulator, or exploring geographies, or whatever you were using it for.” Introduced in 1992 and lasting through the end of the decade was the succeeding, third generation, in which “texture mapping,” described by Mr. Malachowsky as a “decaling process,” allowed textures and not just colors to be imposed on surfaces so that images approximated nature. With hardware doing all the mathematics, a two-dimensional picture could be transformed, mapped, scaled, rotated, and projected onto a three-dimensional surface, with the result that the eye believed it was seeing something real.
Through these first generations, semiconductors captured specific algorithms in order to make the images’ appearance conform to the preferences of mechanical engineers at large industrial corporations who used CAD. Application writers in NVIDIA’s industry, which produced video games, wanted their own look, however. “They didn’t need it to be real,” Mr. Malachowsky commented, but “they wanted shadows to be emphasized, things to be glowing, things to look one way or another.” To achieve this, they built customized algorithms in software on top of the standardized hardware. A more recent trend was to put programmability into the hardware: Once the hardware, its fixed function removed, was made more flexible, developers could get the distinctive look they wanted and still take advantage of the acceleration offered by the wealth of transistors.
The phase marked by programmability started off with a very low-level language; on the order of an assembly language, it was both primitive and tedious. In the previous year, however, a number of companies had come out with compilers which operate on higher-level language descriptions of the effects desired, which raised the level of abstraction, making programming at this level easier and more widely available. This allowed developers to focus on the look and feel they desired in their applications while leaving implementation to the device manufacturer. Mr. Malachowsky offered three-dimensional graphics as an example of what was possible with programmability. Three-dimensional graphics typically involved decomposing the three-dimensional object into triangles, which are planar and therefore suited to having algorithms mapped onto them. Pointing to the turning, rotation, and scaling of the vertices, he said, “You can do all sorts of math on the vertices, and then eventually you’re going to figure out what all the individual elements or fragments within the triangle are.” Once a program was written covering all of the fragments, different looks could be achieved simply by making changes within the program. The graphics processor now became a programmable unit that could mimic the capabilities of a proprietary software, and the added capability arising from the software had opened the door to increased creativity, he noted. “We still haven’t re-created reality,” Mr. Malachowsky admitted. “We’re not even close, although we could fool you if somebody spent a whole bunch of time thinking about it before they got around to rendering things.” He said that, to rise to another level of realism, many of the simplifications that
had been effected to make things algorithmically tractable would need to be relieved.
Mr. Malachowsky was reluctant to make detailed predictions for the graphics industry, other than to say that its role as one of the interfacing elements of the computer ensures its further existence. Alluding to the rise in resolution of displays, the subject of the program’s next talk, he said the higher the resolution, the more elements one might want to process, something that offered graphics a future beyond the PC “as more and more displays and computing elements find themselves embedded in all sorts of applications.” The graphics industry would pursue the higher end of the market—with its “‘hell-and-brimfire, make-it-the-best-you-can-at-any-cost’ type of solutions”—because that was the segment driving innovation, which then bled into the mainstream product line. As the largest consumer of wafers from the world’s largest fab, NVIDIA drove technology, said Mr. Malachowsky, adding that the graphics industry as a whole was “an important player in technology push.” His expectation was that, since the graphics industry had not yet progressed that far down the learning curve, it was in for significant improvement over the succeeding 10–15 years, at which point semiconductors incorporating graphics technology would turn up in a wide variety of embedded applications.
FLAT PANEL DISPLAYS
Dalen E. Keys
DuPont Displays
Dr. Keys began his presentation by underlining the tendency of humans to be visual and by arguing for the enabling role played by the display for both software and graphics. But he joked that his conviction in the display’s significance had been shaken earlier in the day, first when he found that only seven lines of Dr. Triplett’s lengthy paper on “Performance Measures for Computers” referred to displays and again when David McQueeney proclaimed the display to be “good enough.” He had decided nonetheless to carry on with his presentation, in which he was speaking not only as chief technology officer of DuPont Displays but also chairman of the U.S. Display Consortium (USDC).
Commencing an introduction of DuPont, which as he noted was not generally considered to be a display company, he posed the rhetorical question: “Why is it we’re in this realm?” He pointed out that the 200-year-old company had started as an explosives company specifically focused on black powder, then a century later had become a chemical company, moving into polymers and energy as well as providing raw stock for its own chemicals. As it was moving into the next century, he said, DuPont believed displays to offer it an opportunity to build from some of the chemical and polymer capabilities it had developed over the
previous century. “We have some background,” he said, pointing out that the science of displays matched many of the company’s skill sets.
In 2002 DuPont formulated five growth platforms—Agriculture & Nutrition, Electronics & Communication Technologies, Performance Materials, Coatings & Color Technologies, and Safety & Protection—in the second of which displays was housed. The Electronics & Communication Technologies platform comprised four business units: Electronic Technologies, covering electronic materials, where DuPont was the world’s second-largest supplier; Fluoroproducts, of which an outstanding example was Teflon®; Display Technologies; and Imaging Technologies, where the company had focused on professional imaging for the printing industry. DuPont considered its experience—with components of color fidelity, printing, and pixelation, as well as with materials from its fluorochemicals business—an asset that it could bring to the display sector, which Dr. Keys described as being “in the midst of some technical revolutions” destined to enable graphics, software, and consumer applications. DuPont was active in several areas of displays: LDCs (liquid-crystal displays), although as an enhancer rather than as a fabricator; OLEDs (organic light-emitting diodes); thick-film materials, which it provided to plasma-display producers, being qualified with 90 percent of OEMs worldwide; and field-emission displays, for which the company retained enthusiasm because of new approaches opened up by the carbon nanotube.
Dr. Keys then turned to USDC, a consortium formed in 1993 and supported by the U.S. Army Research Laboratory, whose mission is to support its 15 member companies and their affiliates in building a world-class U.S. display industry. Both large and small companies, as well as a variety of display technologies, were represented among USDC’s members, something that, he said, “creates some very interesting dynamics in the group.” The consortium funds projects predominantly outside its membership companies to advance the technology manufacturing infrastructure.
Beginning the technical portion of his presentation by focusing on the interface of the display with the consumer, Dr. Keys praised as “great” the marriage of the cathode-ray tube (CRT) with the computer, which had held up for over a decade and determined users’ expectations regarding image performance. Over time, however, portability became an issue and its solution, the union of the LCD with the PC, rated a “good” but no better even though it had enabled the laptop computer. “What about power?” he asked, observing that although the LCD’s image quality was showing continual improvement, it was “not to where it needed to be.” In addition, he faulted its design, pointing out that 80–90 percent of an LCD’s light is wasted.
The display had come increasingly to represent the product of which it was a feature, Dr. Keys asserted. Recalling the cries of “‘I love your computer!’” coming from classmates of his daughter as they got their first look at her new system, he stated: “They’re not looking at the computer—they have no idea what the
computer does—they’re looking at the screen. That’s also true for your cell phone: If the display goes out, you hate the phone; you want to yell at the service provider. And the same with your PDA.” Out of this came a question: What, these days, is the computer? Data from Korea showed that much of the use of the mobile Internet through cell phones there was unrelated to making calls; instead, downloading pictures and other forms of entertainment, accessing travel and financial information, and e-mail were key applications—in all of which displays played a key role. The display’s assumption of additional functionality, a trend that was expected to become more pronounced, sowed confusion about what the nature of the computer is and which market display manufacturers were attempting to serve. While the display accounted for about $53 billion of the communication industry’s approximately $1 trillion in annual sales, Dr. Keys noted, the lines in the industry were being blurred.
This was particularly acute in such portable devices as the cell phone or PDA, in which the display takes up a lot of space. In addition to providing the user with information, there was a possibility that other functions might be built in. “Can it sense me as the user? Can it take a photograph? Can it generate power?” asked Dr. Keys, noting that these questions and their implications were generating considerable research activity. Although flat-panel display sales had suffered a dip of slightly more than 10 percent in 2001, they were back up by some 30 percent in 2002—a far stronger showing than that of the integrated-circuit sector—and the forecast for growth in subsequent years was positive. A negative for the producers, in contrast, was pricing. The fact that the consumer PC market was the lowest-price market was no source of contentment among the display fabricators, who had taken to looking to other applications and market segments in search of profitability. One advantage display makers enjoyed over chip makers was that the former could change their substrates almost on a routine basis—there had been seven changes over the previous 15 years—with the result that profitability was enhanced. Attempting to come up with an equivalent for Moore’s Law that might apply to his sector of the industry, Dr. Keys detailed the increase in display size from one product generation to the next. For Generation 0, dated 1987, the figure he gave was 270 × 200 mm; for Generation 1, 1990, 300 × 350 mm; Generation 3, 1995, 550 × 650 mm; Generation 5, 2002, 1200 × 1300 mm; and Generation 7, 200x, 1850 × 2100 mm.
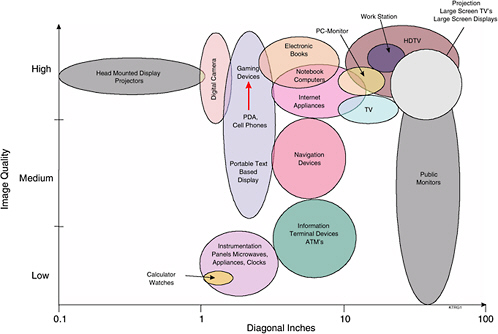
A chart on which various applications were located as a function of their image quality, or resolution, and their screen size demonstrated that the computer, whether desktop or notebook, ranked high in both parameters (see Figure 18). Because the technology and resolution were becoming similar in many applications, Dr. Keys said, it had become “easier to back off” technologically, and he cited as a trend that manufacturers “target the high resolution and back off.” Showing a chart categorizing display technologies, he said LCD is a direct-view technology that is nonemissive, meaning that it emits no light itself but depends on a backlight (see Figure 19). While most familiar to those in the audience was
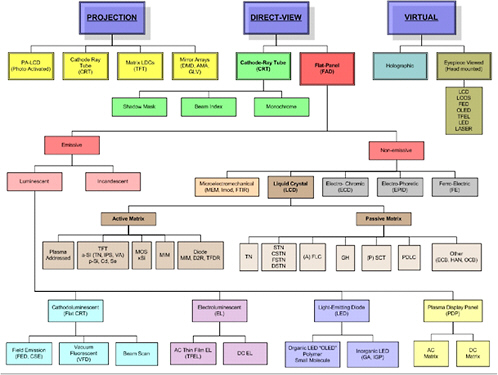
the realm of the active-matrix LCDs, he pointed to a “tremendous explosion in the technologies available depending on the application,” adding that their number was “growing yet.” He singled out OLED as causing a great deal of excitement in the industry even though it was still in its infancy.
Turning to the current state of affairs, Dr. Keys declared his industry “unhappy with performance,” “not where we want to be to meet consumer demand,” and “especially not happy with cost or return.” In the years 1995–2001, earnings from LCDs were −$2 billion despite capital investment of $34 billion and cumulative sales of $61 billion. “We really have to do something,” he acknowledged. “Whether it’s with the existing technology or new technology, we’re seeking ways to turn this around because the opportunity is there. We as consumers want more.” On the cost side, the industry was looking at more automated procedures that might move it away from lift-based processing and toward other ways of putting down materials in a one-pass operation that Dr. Keys called “more printing-like—Gutenberg-like, inkjet-like.”
Also under consideration was moving away from glass, a change that might not be a low-cost alternative in itself but would be worthwhile if the manufacturer could become more automated. Mounting a display on a uniform or some other sort of clothing—“wearability” being the buzzword—might improve the display’s durability. The possibility of making a flexible display was what brought DuPont into the business: The company saw revolutions in applications resulting from the manufacture of a plastic display using roll-to-roll techniques. While these novel applications had yet even to hit the drawing board—it would be “up to the designers to unleash their imagination,” he said—the company believed this “dream” would be realized.
The roll-to-roll manufacturing concept—envisioned, in fact, as more in line with the sheet-fed printing press than as a pure roll-to-roll technique—centers on integrating components from the flex-circuit industry with ink-jet printing from the graphic arts industry to get rolls of materials that could be “sliced and diced” into displays. Expected to be very compatible with both roll-to-roll manufacturing and a flexible product was the OLED. As an emissive device, the OLED does not need the backlight that is always on in the LCD, which not only removes a level of structural complexity but also offers an operational improvement: Since in the OLED light is on only when needed, the LCD’s light losses are eliminated.
In conclusion, Dr. Keys said that the display industry in the United States “must move away from LCD technology to have a future hope, not only from performance but also from applications.” In part because of the industry’s problems achieving profitability, and in part because no killer market application existed as yet for a flexible display, industry would not make the necessary moves alone and needed the government to participate, he said. “The manufacture paradigm related to cost, as well as the form factor, will come from the above functions,” he explained. “So we would be betting a lot of money, from an industrial point of view, on a hope.” Having seen what was coming, the U.S. Display Con-
sortium had begun to redirect its funding, devoting 31 percent of its outlays to each of two leading areas, flexible substrate processing and “specific materials and components.” Dr. Keys said he anticipated spending on flexible displays to continue at significant levels, although the consortium still believed in projection displays and certain aspects of the microdisplay and continued to fund some of them.
DISCUSSION
Jack Triplett, the day’s first presenter, asked the three panelists to summarize the performance measures used in their industries to assess technical progress, as well as to indicate where such data might be obtained. Also, in reference to Dr. Bregman’s contention that software had escaped the attention of those studying which metrics might reflect the relationship of IT investment to productivity, Dr. Triplett stated: “It isn’t actually that we’re unaware of the importance of software and the crucial part of the investment in software in looking at the whole computer. It’s that we don’t have a good metric for measuring its performance.” If one were available, he said, far more material on software would be incorporated into studies of computer productivity.
Responding first, Dr. Bregman pointed to the existence of both internal and external metrics as a complicating factor. Taking up the former, he said that whereas progress in the microprocessor industry might be equated to more transistors per square centimeter, in software progress was no longer measured in lines of code. One of Veritas’s most profitable products, from which it had earned in excess of $100 million, consisted of 14 lines of code. “Because core intellectual property is not found in a physical embodiment,” he noted, “it is very hard to measure.” Externally, software was measured by the practical impact of its use; crucial in the current environment, where money for new investment was scarce within IT organizations, was how much it allowed customers to reduce operating costs. “We often see returns on investments, or payback periods, that are within days to weeks,” he stated, while nonetheless conceding that systematic metrics did not in fact exist. Moreover, he questioned how eager the industry was to see systematic metrics adopted. “If we all had systematic metrics,” he posited, “then it would be clear: You’d publish who’s the best according to some abstract measurement, and all the customers would buy that, and the game would be over.” Still, he acknowledged that it was problematic to neglect the things one could not measure and said the industry should persist in trying to find a way to measure them.
In the graphics industry, said Mr. Malachowsky, there was a marketing view of performance in addition to internal and external views. At its founding NVIDIA wanted to show the value of its products by differentiating them on performance; since there was no benchmark, however, its first goal became to create one. Its benchmark not only turned out to be too narrow, measuring only speeds and
feeds, but it also failed to measure end-user value. Currently, NVIDIA was measuring itself internally on “very engineering-specific, design-specific things” such as bandwidth utilization factors, and externally according to application benchmarks. “Synthetic benchmarks that came out of the CPU world just don’t cut it,” he said. “They’re just not real enough, not end-user-experience enough.” The application benchmarks used were to be found at hundreds of Web sites run by “teenagers, scientists, [and] frustrated computer geeks” who were attempting to survive financially by serving clients in need of performance measures for applications they thought valuable.
Dr. Keys began the recitation of an extensive list of metrics by naming technical specifications that allowed benchmarking from display type to display type: diagonal size of the display and pixel count. More complex was measuring power consumption, because how the display was being driven and how long it was in its “on” state had to be factored in. Switching speed, which indicated whether a product could do video-grade displays, was also a common metric. The measure of luminance, while technical, related to the user although it was complicated by the issue of consumer preference. Manufacturing metrics were based on yield and on the size of the substrate used in the manufacturing process. Indicating that there were many more metrics to name, he referred the audience to the Web site of the USDC for “references to competitive information and studies” incorporating such information.
Reflecting on the preceding remarks, Dr. Bregman observed that many external metrics or benchmarks used in industry were aimed at being able to compare products at a particular moment, making them unsuitable for the type of longitudinal study that economists seeking to establish the connection between product performance and productivity were engaged in. Industry had been known to change benchmarks from year to year. The result was a fundamental conflict between what industry was trying to deliver and what economists were trying to ascertain.
David Peyton of the National Association of Manufacturers asked Mr. Malachowsky about the relationship between offshore and onshore manufacturing for NVIDIA, a virtual manufacturer. He asked how much of the company’s outsourced work was done in America and how much abroad; whether that ratio had changed in the previous several years; and, if so, what factors had driven the change.
Stressing that he was leaving his personal area of expertise, Mr. Malachowsky answered that all of NVIDIA’s semiconductor manufacturing was done by TSMC, the Taiwan Semiconductor Manufacturing Co. While noting that TSMC had an interest in a joint-venture fab in the U.S. Pacific Northwest in addition to owning facilities in Taiwan, he guessed that TSMC did most of NVIDIA’s work in Taiwan itself. The majority of NVIDIA’s product, perhaps as much as 70 percent, was shipped to manufacturers outside the United States that then incorporated the components in products and reshipped them in turn. In addition to its
manufacturing, a very high percentage of NVIDIA’s testing and packaging were done overseas, whereas all the design, test development, and manufacturing process development were done in the United States. Mr. Malachowsky expressed doubt that the design function would move offshore, but he acknowledged that “more and more of the manufacturing does seem to be showing up overseas, in multiple countries where the products don’t have to come back into the United States and be shipped back out.” He pointed to the existence of a penalty, which he recalled as a tax disadvantage, attached to bringing goods in and out of this country that made doing so an economic burden; because latency of manufacturing, from component delivery through end user delivery, was “actually a big deal,” shortening travel time was an important issue as well.
Recalling earlier allusions to internal technical metrics on the one hand and to external metrics such as “usability” and “customer likeability” on the other, Victor McCrary of the National Institute for Standards and Technology asked Mr. Malachowsky and Dr. Keys when color and fidelity could be expected to follow word processing to the level of WSYWYG [“what you see is what you get”].
Mr. Malachowsky said that graphics products were being held to a higher and higher standard in that they were being measured according to the electrical fidelity of the signals sent to the display, something he called a relatively new development. Elaborating, he said that some of the newer displays received a digital signal from the processor and “the display processe[d] that digital information internal to the display,” with the fidelity quantized such that small perturbations originating in the processor did not show up on the display. In this sense, a subsystem of the display is responsible for the display’s quality. On the analog side, he noted, in driving a CRT, the quality of the signal transmitted by the semiconductors through a board, a connector, and a cable into the electronics of the display dictated a large part of what showed up on the screen. Now algorithmic mapping had been added to offset the transfer function that the display would insert so that the user could get WYSWYG; the processor provided the mechanism to improve that, and applications software would make use of it. More often than not, the developers of the Web-based benchmarks analyses mentioned earlier had decided that the quality of that signal was an important metric for the consumer, and as a consequence NVIDIA and its competitors had begun devoting increased attention to it. But the innovation would have to take place in a narrow bandwidth envelope to avoid problems with the FCC, because the wires act as antennas, and the better the fidelity of the information, the bigger radiators they become.
Dr. McCrary indicated that his concern about image quality was focused in the realm of health care, and specifically on the fact that lack of fidelity could lead ultimately to liability.
This question brought to Mr. Malachowsky’s mind an incident that took place when he was responsible for the first color accelerated display at Sun Micro-
systems. The display’s introduction at Lawrence Livermore Laboratory was met with the comment: “Thank God, you finally got color to be as fast as grayscale!” Inquiring into the motive for this statement, Mr. Malachowsky was told: “Even though it’s now fast enough to be usable, I can’t use it because you don’t have enough shades”; the Livermore researcher, it turned out, was in medical imaging and was concerned that he might misread a tumor because of a density interpretation. As a technology advances, it does not necessarily cover all the applications of the prior technology, he commented. Noting that NVIDIA’s chips had gone from 8-bit color to 128-bit color with 32-bit floating-point components, he speculated that “maybe now that guy will say, ‘Thank God, you’ve done that, because now I can use a color display at all.’” A large number of transistors are “tied up” with 32-bit color components, he noted.
Dr. Keys, remarking that he had spent his first 14 years at DuPont in its x-ray film and graphic arts film business, declared that the display industry was “still at the Gutenberg stage.” He denied, however, that another 200 years would have to pass before that quality was reached. LCDs had reached a pinnacle in color fidelity, he noted, but acknowledged that fidelity was highly dependent on the color filter and that having to add additional layers causing color shifts and angle dependencies that are a detriment was a disadvantage. To do what Dr. McCrary was referring to would, Dr. Keys guessed, require 5–10 years to get a material set with the color fidelity to enable progress beyond consumer applications and into the medical realm; and, he added, contrast capabilities reside not just in the materials set but also in how the display is fabricated and driven.
Kenneth Walker, another of the day’s presenters, pointed out that the system described was an open-loop system and that the discussion involved the comparison between transmitted and reflected color. “Although you might lay the same densities of color from any set of standard measures,” he cautioned, “you’re going to get different effects in terms of how the human eye perceives that color.”
NIST worked on standards for color and had representatives come from the printing industry asking for the standard for red. Dr. McCrary could, he said, “give them a laser line and say, ‘O.K., that’s about red,’ but that standard for color has not been further articulated since the color diagram over 60 years ago.”
Agreeing, Mr. Walker noted that a closed loop would have to be built in order to provide a system for digital cameras and similar products. It would be necessary to have a monitor such that when a signal was sent out of a graphics card that was intended to be Red 23, it could be measured to determine whether or not the phosphors in the monitor had aged to the point that the color had shifted, so that the card’s manufacturer could learn how to change the signal in the card to get it back up to Red 23.
Corroborating this statement, Dr. Keys exclaimed: “If you sit in the back of a jet and look down the stream of LCDs, how many of them match? None!” He asked in addition: “When I print a document in L.A., does it match the document I’m printing in Chicago?” Remarking that the problem had not yet been brought
to the display industry, he argued that there was a tremendous opportunity to build on what companies in the printing business had learned in controlling and matching color.
Dale Jorgenson, the STEP Board’s chairman and host of the conference, asked whether road maps existed in the speakers’ segments of the software, semiconductor, and display industries and, if so, where they might be found.
Dr. Bregman answered that there was neither an equivalent to the SIA road map in Veritas’s part of the storage software industry, nor was there the same sense of cooperative effort. “If we had a road map, we wouldn’t tell you,” he said, “unless you were a prospective customer, and then we might show you a little bit of it.” Because barriers to entry were much lower in the software than in the hardware sector of the industry, revealing a software road map would be tantamount to handing over intellectual property—so that the road map was not an appropriate solution there. Nor were internal road maps adhered to very well, since a brilliant idea can make its way from an engineer’s mind to the market “within a quarter or two,” most of which would be taken up with testing rather than with product development. As a result, road maps in the sector generally focused on customer requirements rather than being technology driven; they were intended to guide engineering teams as to what management thought was important from a customer point of view.
Dr. Flamm, noting that NVIDIA had very few competitors, asked what use the firm might make of a road map.
Describing the market for graphics processors as half in the hands of Intel—with NVIDIA and ATI, a Canadian firm, owning the other half—Mr. Malachowsky characterized a typical road map as “soft and fuzzy, and quantized into nonspecifics: ‘photorealistic,’ ‘cinematic quality,’ ‘speeds and feeds at double or triple algorithmically.’” To the extent that his own company’s road maps were accurate, it was only because “we’re progressing like that and we’ll call it that when we get there regardless.” On an industry-wide level, there might be projections for a few years out or for a generation or two out for each product segment, but there was nothing analogous to the semiconductor industry’s road map.
For displays, Dr. Keys recommended Stanford Resources’ work on the display industry, as well as trends reports by Display Search, based in Austin. Kanzai Research Reports of Japan also rated a mention. The USDC had recently released a report on flexible displays.
Mick Silver of Cardiff Business School harked back to Dr. Triplett’s initial point: that to measure productivity, price change needs to be measured but also to be corrected for change in performance. This could be particularly difficult in software, he argued, where technology undergoes “sea changes.” Although it was relatively simple once a software product has been on the market for successive periods—assuming the quality to have stayed constant, one could just measure the price—the trick was to measure the price change between the period before introduction and the period of introduction, as well as to measure its value to
users compared with the value of the technology used before it was introduced. “This is where the productivity change comes in,” he emphasized, “between the old technology and the new.” Econometricians attempted to estimate such hypothetical prices—what the price might have been before introduction—but it was not easy to do. Locating the heart of the productivity question in the initial period when leaps are made in software, Dr. Silver suggested that the way forward might come through employing market-research techniques to work out how users value the productivity change and through asking what the price might have been had a product been available but not sold.
Concurring, Dr. Bregman chose as an example the introduction of software to simulate crash testing in the auto industry. “What’s the productivity value of that software?” he asked. “If we have to look inside the whole system, how did they satisfy this task in the past—including the cost of the cars they destroyed—vs. how do they do it today?” Similarly, the value of software within the information technology sector itself could not be measured without looking at the overall task. If it was managing data, then how was it done before the software became available? By employing hundreds of people. “Now,” he asked, “what’s the relative economic value? But we don’t tend within the industry to look at it that way except to the extent that we build an ROI model for that transaction to sell it. We don’t look at it over time.”
In the graphics industry, declared Mr. Malachowsky, “if you were looking at price, you’d be deceiving yourself or leading yourself astray.” In an industry that started off with gross margins in the 5–6 percent range, NVIDIA was now posting an average gross margin of around 35 percent. “The cost is something you might track,” he admitted, “but we’re in a business, we’re a public company, we’re trying to make more money, more margin. And prices don’t necessarily reflect costs. We’re trying hard to have them not be a linear extrapolation.”
In software, where the incremental cost is zero, Dr. Bregman pointed out, that was an even larger issue.
Mr. Malachowsky added that NVIDIA’s virtual manufacturing business model, under which it owned the manufacturing line but not the infrastructure, was designed for extracting more value out of the product chain. The firm takes more margin from the manufacturers than they would have had before, but the total chain still spends so many dollars. “We just try to keep all of it,” he said. “We want our users to pay more over time, even for the same thing.”
Allowing himself the final question, Dr. Flamm called attention to the presence of two representatives of the visual arts on the panel and raised a point he looked upon with some amazement: that in past discussions of technological advances in graphics and displays, the high-end graphics market had been the scientific and design market. Noting that NVIDIA was active in what was basically a consumer market, he asked whether the high-end, performance-driving piece of the market had shifted from scientific and engineering users to consumers and whether that was also true for displays.
Both Mr. Malachowsky and Dr. Keys answered in the affirmative.
“Has that had any impact on the ways you’re driving your product forward: the aspects of resolution or what kinds of shapes you paint on the screen?” Dr. Flamm asked.
Again answering in the affirmative, Dr. Keys said that upon entering the display market only five years before, DuPont had laid out its own road map. But that road map, which included what he called “a substantial period of monochrome display supply,” had been abandoned. In just the previous two years, there had been revolutions in the industry, in the move to full-color displays in hand-held devices, and in the advent of HDTV and the infrastructure to support it. “That drives all of us, as consumers, to want that latest thing,” Dr. Keys observed, “so patience with monochrome just doesn’t exist.” Even for day-to-day, utility functions, technology had moved toward the high end. DuPont was now testing technologies on such lower-end applications as cell phones and games before implementing them in higher-end computing products. “But,” he noted, “everyone wants the same capability.”
The economies of scale of the consumer world “have removed the economic motivation from the very high end” and caused “the real high-end players to focus on narrow niches now,” added Mr. Malachowsky.18 The overall advancement of technology, in which the entire industry moved forward to satisfy needs arising in a variety of applications—some of them very high end—had given way to concentration on small market segments. High-end developers had moved into simulation and modeling. NVIDIA had entered the workstation market two years before and, at the medium and low end, had established dominant market share—producing around 20 million processors per quarter—and had put in a minimum feature set in order to be in a position to supply extremely fast machines for very focused, high-end manufacturing customers.
Dr. Flamm observed that the technology going into the high end and that being developed for the consumer market were the same, to which Mr. Malachowsky assented.


