
K–12 Science, Mathematics, and Technology Education
SUMMARY
US education in science, technology, engineering, and mathematics is undergoing great scrutiny. Just as the launch of Sputnik 1 in 1957 led the United States to undertake the most dramatic educational reforms of the 20th century, the rise of new international competitors in science and technology is forcing the United States to ask whether its educational system is suited to the demands of the 21st century.
These concerns are particularly acute in K–12 education. In comparison with their peers in other countries, US students on average do worse on measures of mathematics and science performance the longer they are in school. On comparisons of problem-solving skills, US students perform more poorly overall than do the students in most of the countries that have participated in international assessments. Some believe the United States has failed to achieve the objective established in the Goals 2000: Educate America Act—for US students to be first in the world in mathematics and science achievement in the year 2000.
National commissions, industrial groups, and leaders in the public and private sectors are in broad agreement with policy initiatives that the federal government could undertake to improve K–12 science, mathematics, and technology education. Some of these are listed below:
Increasing the Number of Excellent Teachers
-
Allocate federal professional-development funds to summer institutes that address the most pressing professional-development needs of mathematics and science teachers.
-
Keep summer-institute facilitators—teachers current with the most effective teaching methods in their disciplines and who have shown demonstrable results of higher student achievement in mathematics and science—abreast of new insights and research in science and mathematics teaching by providing funding for training them.
-
Encourage higher education institutions to establish mathematics and science teaching academies that include faculty from science, mathematics, and education departments through a competitive grant process.
-
Support promising students to study science, mathematics, and engineering teaching—particularly those obtaining degrees in science, mathematics, or engineering who plan to teach at the K–12 level following graduation through scholarships and loan programs for students as well as institutional funding. Qualified college students and midcareer professionals need to be attracted into teaching and given the preparation they require to succeed. Experts in mathematics, science, and technology should be able to become teachers by completing programs to acquire and demonstrate fundamental teaching skills. Recruitment, preparation, and retention of minority-group teachers are particularly important as groups underrepresented in science, mathematics, and engineering become a larger percentage of the student population.
-
Conduct an aggressive, national-outreach media campaign to attract young people to teaching careers in mathematics and science.
-
Work for broad improvements in the professional status of science, mathematics, and technology teachers. Structured induction programs for new teachers, district–business partnerships, award programs, and other incentives can inspire teachers and encourage them to remain in the field. Most important, salaries for science, mathematics, and technology teachers need to reflect what they could receive in the private sector and be in accord with their contributions to society, and teachers need to be treated as professionals and as important members of the science and engineering communities.
Enhancing the Quality and Cohesion of Educational Standards
-
Help colleges, businesses, and schools work together to link K–12 standards to college admissions criteria and workforce needs to create a seamless K–16 educational system.
-
Provide incentives for states and coalitions of states to conduct benchmarking studies between their standards and the best standards available.
-
Foster the development of high-quality curricula and assessments that are closely aligned with world-class standards.
-
Establish ambitious but realistic goals for student performance—for example, that 30% of high school seniors should be proficient in science by 2010 as measured by the National Assessment of Educational Progress (NAEP).
Changing the Institutional Structure of Schools
-
Provide seed money or incentives for new kinds of schools and new forms of schooling. Promising ideas include small high schools, dual-enrollment programs in high schools and colleges, colocation of schools with institutions of higher education, and wider use of Advanced Placement and International Baccalaureate courses.
-
Help districts institute reorganization of the school schedule to support teaching and learning. Possibilities include devoting more time to study of academic subjects, keeping schools open longer in the day and during parts of the summer, and providing teachers with additional time for development and collaboration.
-
Provide scholarships for low-income students who demonstrate that they have taken a core curriculum in high school that prepares them to study science, mathematics, or engineering in college.
The challenge for policy-makers is to find ways of generating meaningful change in an educational system that is large, complex, and pluralistic. Sustained programs of research, coordination, and oversight can channel concerns over K–12 science, mathematics, and technology education in productive directions.
THE CHALLENGE OF K–12 SCIENCE, MATHEMATICS, AND TECHNOLOGY EDUCATION
The state of US K–12 education in science, mathematics, and technology has become a focus of intense concern. With the economies and broader cultures of the United States and other countries becoming increasingly dependent on science and technology, US schools do not seem capable of producing enough students with the knowledge and skills needed to prosper.
On the 1996 NAEP, fewer than one-third of students performed at or above the proficiency level in mathematics and science—with “proficiency” denoting competence in challenging subject matter.1 Alarmingly, more than
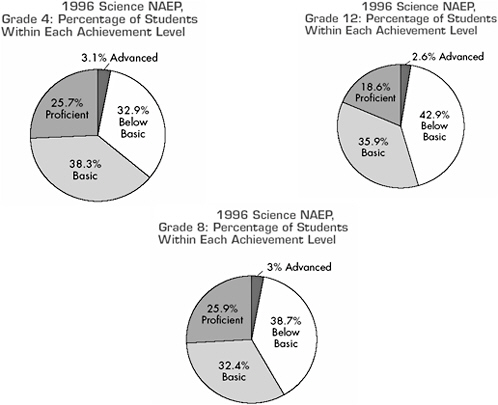
FIGURE K–12-1A NAEP 1996 science results, grades 4, 8, and 12. Studies suggest that a large portion of US students are lacking in science skills. In 1996, at least one-third of students in 4th, 8th, and 12th grade performed below basic in national tests.
SOURCE: S. C. Loomis and M. L. Bourque, eds. National Assessment of Educational Progress Achievement Levels, 1992-1998 for Science. Washington, DC: National Assessment Governing Board, July 2001. Available at: http://www.nagb.org/pubs/sciencebook.pdf.
one-third of students scored below the basic level in these subjects, meaning they lack the fundamental knowledge and skills they will need to get good jobs and participate fully in our technologically sophisticated society (see Figures K–12-1A and K–12-1B).
International comparisons document a gradual decline in performance and interest in mathematics and science as US students get older. Though 4th graders in the United States perform well in math and science compared with their peers in other countries (see Tables K–12-1 and K–12-2), 12th graders in 1999 were almost last in performance among the countries that participated in the Third International Mathematics and Science Study
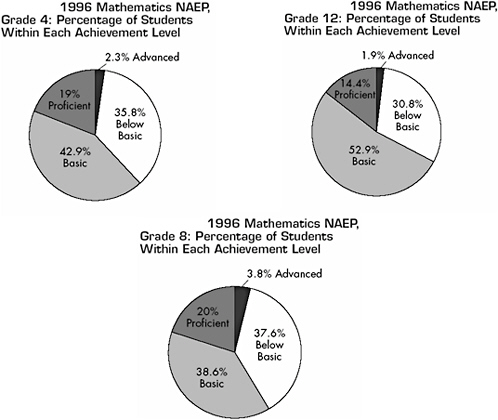
FIGURE K–12-1B NAEP 1996 mathematics results, grades 4, 8, and 12. The results are similar for mathematics: 30% of students scored below basic.
SOURCE: S. C. Loomis and M. L. Bourque, eds. National Assessment of Educational Progress Achievement Levels, 1992-1998 for Science. Washington, DC: National Assessment Governing Board, July 2001. Available at: http://www.nagb.org/pubs/sciencebook.pdf.
(TIMSS).2 Among the 20 countries assessed in advanced mathematics and physics, none scored significantly lower than the United States in mathematics, and only one scored significantly lower in physics.
There has been some good news about student achievement.3 US 8th graders did better on an international assessment of mathematics and science in 2003 than they did in 1995 (see Tables K–12-3 and K–12-4). The
TABLE K–12-1 Average TIMSS Mathematics Scale Scores of 4th-Grade Students, by Country: 1995 and 2003
|
|
|
SOURCE: National Center for Education Statistics. Highlights from the Trends in International Mathematics and Science Study: TIMSS 2003. Washington, DC: United States Department of Education, December 2004. P. 8. Available at: http://nces.ed.gov/pubs2005/2005005.pdf. |
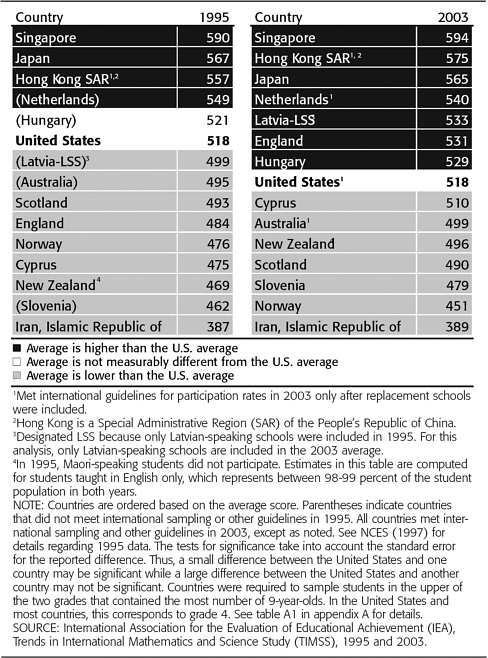
TABLE K–12-2 Differences in Average TIMSS Science Scale Scores of 4th-Grade Students, by Country: 1995 and 2003
|
Country |
1995 |
2003 |
Difference1 |
|
Singapore |
523 |
565 |
42 ▲ |
|
Japan |
553 |
543 |
-10 ▼ |
|
508 |
542 |
35 ▲ |
|
|
England3 |
528 |
540 |
13 ▲ |
|
United States3 |
542 |
536 |
-6 |
|
(Hungary) |
508 |
530 |
22 ▲ |
|
(Latvia-LSS)4 |
486 |
530 |
43 ▲ |
|
(Netherlands)3 |
530 |
525 |
-5 |
|
New Zealand5 |
505 |
523 |
18 ▲ |
|
(Australia)3 |
521 |
521 |
-1 |
|
Scotland2 |
514 |
502 |
-12 ▼ |
|
(Slovenia) |
464 |
490 |
26 ▲ |
|
Cyprus |
450 |
480 |
30 ▲ |
|
Norway |
504 |
466 |
-38 ▼ |
|
Iran, Islamic Republic of |
380 |
414 |
34 ▲ |
|
▲ p<.05, denotes a significant increase. ▼ p<.05, denotes a significant decrease. 1Difference calculated by subtracting 1995 from 2003 estimate using unrounded numbers. 2Hong Kong is a Special Administrative Region (SAR) of the People's Republic of China. 3Met international guidelines for participation rates only after replacement schools were included. 4Designated LSS because only Latvian-speaking schools were included in 1995. For this analysis, only Latvian-speaking schools are included in the 2003 average. 5In 1995, Maori-speaking students did not participate. Estimates in this table are computed for students taught in English only, which represents between 98-99 percent of the student population in both years. NOTE: Countries are ordered based on the 2003 average scores. Parentheses indicate countries that did not meet international sampling or other guidelines in 1995. All countries met international sampling and other guidelines in 2003, except as noted. See NCES (1997) for details regarding 1995 data. The tests for significance take into account the standard error for the reported difference. Thus, a small difference between averages for one country may be significant while a large difference for another country may not be significant. Countries were required to sample students in the upper of the two grades that contained the largest number of 9-year-olds. In the United States and most countries, this corresponds to grade 4. See table A1 in appendix A for details. Detail may not sum to totals because of rounding. SOURCE: International Association for the Evaluation of Educational Achievement (IEA), Trends in International Mathematics and Science Study (TIMSS), 1995 and 2003. SOURCE: National Center for Education Statistics. Highlights from the Trends in International Mathematics and Science Study: TIMSS 2003. Washington, DC: United States Department of Education, December 2004. P. 16. Available at: http://nces.ed.gov/pubs2005/2005005.pdf. |
|||
TABLE K–12-3 Average TIMSS Mathematics Scale Scores of 8th-Grade Students, by Country: 1995 and 2003
|
|
|
SOURCE: National Center for Education Statistics. Highlights from the Trends in International Mathematics and Science Study: TIMSS 2003. Washington, DC: United States Department of Education, December 2004. P. 19. Available at: http://nces.ed.gov/pubs2005/2005005.pdf. |
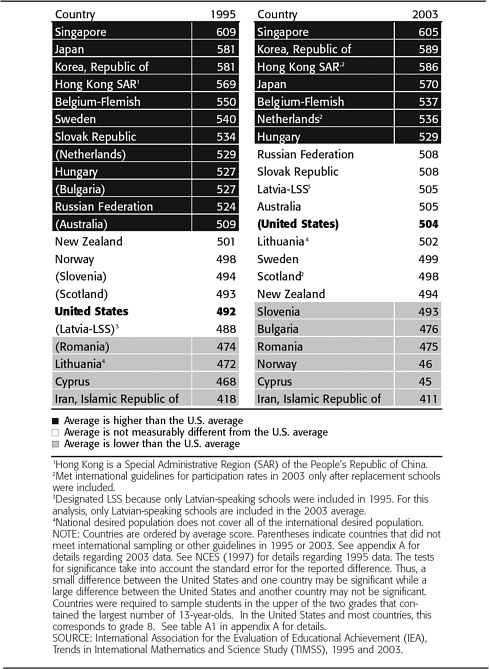
TABLE K–12-4 Difference in Average TIMSS Science Scale Scores of 8th-Grade Students, by Country: 1995, 1999, and 2003
|
Country |
|
|
|
Difference1 |
|
|
1995 |
1999 |
2003 |
(2003-1995) |
(2003-1999) |
|
|
Singapore |
580 |
568 |
578 |
-3 |
10 |
|
Chinese Taipei |
— |
569 |
571 |
† |
2 |
|
Korea, Republic of |
546 |
549 |
558 |
13 ▲ |
10 ▲ |
|
510 |
530 |
556 |
46 ▲ |
27 ▲ |
|
|
Japan |
554 |
550 |
552 |
-2 |
3 |
|
Hungary |
537 |
552 |
543 |
6 |
-10 ▼ |
|
(Netherlands)2 |
541 |
545 |
536 |
-6 |
-9 |
|
(United States) |
513 |
515 |
527 |
15 ▲ |
12 ▲ |
|
(Australia)4 |
514 |
— |
527 |
13 ▲ |
† |
|
Sweden |
553 |
— |
524 |
-28 ▼ |
† |
|
(Slovenia)4 |
514 |
— |
520 |
7 ▲ |
† |
|
New Zealand |
511 |
510 |
520 |
9 |
10 |
|
(Lithuania)5 |
464 |
488 |
519 |
56 ▲ |
31 ▲ |
|
Slovak Republic |
532 |
535 |
517 |
-15 ▼ |
-18 ▼ |
|
Belgium-Flemish |
533 |
535 |
516 |
-17 ▼ |
-19 ▼ |
|
Russian Federation |
523 |
529 |
514 |
-9 |
-16 ▼ |
|
(Latvia-LSS)6 |
476 |
503 |
513 |
37 ▲ |
11 |
|
(Scotland)2 |
501 |
— |
512 |
10 |
† |
|
Malaysia |
— |
492 |
510 |
† |
18 ▲ |
|
Norway |
514 |
— |
494 |
-21 ▼ |
† |
|
Italy7 |
— |
493 |
491 |
† |
-2 |
|
(Israel)7 |
— |
468 |
488 |
† |
20 ▲ |
|
(Bulgaria) |
545 |
518 |
479 |
-66▼ |
-39 ▼ |
|
Jordan |
— |
450 |
475 |
† |
25 ▲ |
|
Moldova, Republic of |
— |
459 |
472 |
† |
13 ▲ |
|
(Romania) |
471 |
472 |
470 |
-1 |
-2 |
|
Iran, Islamic Republic of |
463 |
448 |
453 |
-9▼ |
5 |
|
(Macedonia, Republic of) |
— |
458 |
449 |
† |
-9 |
|
Cyprus |
452 |
460 |
441 |
-11 ▼ |
-19 ▼ |
|
Indonesia5 |
— |
435 |
420 |
† |
-15▼ |
|
Chile |
— |
420 |
413 |
† |
-8 |
|
Tunisia |
— |
430 |
404 |
† |
-26 ▼ |
|
Philippines |
— |
345 |
377 |
† |
32 ▲ |
|
South Africa8 |
— |
243 |
244 |
† |
1 |
|
—Not available. †Not applicable. ▲ p<.05, denotes a significant increase. ▼ p<.05, denotes a significant decrease. 1Difference calculated by subtracting 1995 or 1999 from 2003 estimate using unrounded numbers. 2Met international guidelines for participation rates in 2003 only after replacement schools were included. 3Hong Kong is a Special Administrative Region (SAR) of the People’s Republic of China. 4Because of national-level changes in the starting age/date for school, 1999 data for Australia and Slovenia cannot be compared to 2003. 5National desired population does not cover all of the international desired population in all years for Lithuania, and in 2003 for Indonesia. 6Designated LSS because only Latvian-speaking schools were included in 1995 and 1999. For this analysis, only Latvian-speaking schools are included in the 2003 average. 7Because of changes in the population tested, 1995 data for Israel and Italy are not shown. 8Because within classroom sampling was not accounted for, 1995 data are not shown for South Africa. NOTE: Countries are sorted by 2003 average scores. The tests for significance take into account the standard error for the reported difference. Thus, a small difference between averages for one country may be significant while a large difference for another country may not be significant. Parentheses indicate countries that did not meet international sampling and/or other guidelines in 1995, 1999, and/or 2003. See appendix A for details regarding 2003 data. See Gonzales et al. (2000) for details regarding 1995 and 1999 data. Countries were required to sample students in the upper of the two grades that contained the largest number of 13-year-olds. In the United States and most countries, this corresponds to grade 8. See table A1 in appendix A for details. Detail may not sum to totals because of rounding. SOURCE: International Association for the Evaluation of Educational Achievement (IEA), Trends in International Mathematics and Science Study (TIMSS), 1995, 1999, and 2003. SOURCE: National Center for Education Statistics. Highlights from the Trends in International Mathematics and Science Study: TIMSS 2003. Washington, DC: United States Department of Education, December 2004. P. 17. Available at: http://nces.ed.gov/pubs2005/2005005.pdf. |
|||||
TABLE K–12-5 Trends in Average NAEP Mathematics Scale Scores for Students Ages 9, 13, and 17: 1973-2004
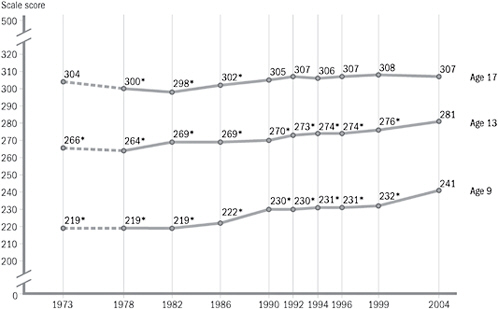
achievement gap separating Black and Latino students from European-American students narrowed during that period (see Figure K–12-2). However, a recent assessment by the Program for International Student Assessment found that US 15-year-olds are near the bottom of all countries in their ability to solve practical problems requiring mathematical understanding. Additionally, testing for the last 30 years has shown that although scores among 9- and 13-year-olds have increased, scores for 17-year-olds have remained stagnant (see Table K–12-5) and there is a gender gap (see K–12-6).
Perhaps the hardest trend to document is a sense of disillusionment with careers based on science and technology.4 Fewer children respond posi-
FIGURE K–12-2 TIMSS math and science scores, 4th (1995 and 2003) and 8th (1995, 1999, and 2003) graders.
SOURCE: National Center for Education Statistics. Highlights from the Trends in International Mathematics and Science Study: TIMSS 2003. Washington, DC: US Department of Education, December 2004. Figure 1-4. Available at: http://nces.ed.gov/pubs2005/2005005.pdf.
TABLE K–12-6 Students at or Above Basic and Proficient Levels as Measured in NAEP Mathematics and Science Tests, Grades 4, 8, and 12, by Sex: 1996 and 2000
tively when surveyed to statements such as “I like math” than has been the case in the past. The number of schools offering advanced courses, such as Advanced Placement and International Baccalaureate has increased dramatically, but the vast majority of students in high school will never take an advanced science or mathematics course (see Tables K–12-7 and K–12-8; see Figure K–12-3). And a lack of interest in science, mathematics, and technology is particularly pronounced among disadvantaged groups that have been underrepresented in those fields.
In general, many Americans do not know enough about science, technology, and mathematics to contribute to or benefit from the knowledge-based society that is taking shape around us. At the same time, other countries have learned from our example that preeminence in science and engineering pays immense economic and social dividends, and they are boosting their investments in these critical fields.
The traditions of autonomy and pluralism in American education limit
TABLE K–12-7 High-School Graduates Completing Advanced Mathematics Courses (1990, 1994, and 1998), by Students and School Characteristics in 1998
|
Year and characteristic |
Any trigonometry/ algebra III |
Any precalculus/ analysis |
Any statistics/ probability |
Calculus |
|||
|
Any |
AP/IB |
||||||
|
1990 ....................................... |
20.7 |
13.6 |
1.0 |
7.2 |
NA |
||
|
1994 ....................................... |
24.0 |
17.4 |
2.1 |
10.2 |
NA |
||
|
1998 ....................................... |
20.8 |
23.1 |
3.7 |
11.9 |
6.3 |
||
|
|
Male.................................... |
19.4 |
23.1 |
3.4 |
12.0 |
6.8 |
|
|
|
Female................................ |
22.5 |
22.9 |
4.0 |
11.6 |
6.0 |
|
|
|
White................................... |
23.6 |
25.1 |
4.3 |
13.1 |
7.0 |
|
|
|
Asian/Pacific Islander .......... |
18.0 |
41.4 |
3.8 |
20.1 |
13.1 |
|
|
|
Black................................... |
15.5 |
14.0 |
2.1 |
7.2 |
3.3 |
|
|
|
Hispanic .............................. |
10.9 |
15.4 |
1.7 |
7.1 |
3.7 |
|
|
|
School urbanicity |
|
|
|
|
|
|
|
|
|
Urban.............................. |
19.0 |
28.5 |
3.6 |
13.2 |
7.7 |
|
|
|
Suburban ........................ |
20.9 |
26.7 |
4.0 |
12.1 |
7.5 |
|
|
|
Rural............................... |
22.6 |
13.4 |
3.4 |
10.4 |
3.5 |
|
|
School sizea |
|
|
|
|
|
|
|
|
|
Small............................... |
22.2 |
21.9 |
3.6 |
10.8 |
3.4 |
|
|
|
Medium........................... |
21.9 |
22.8 |
3.8 |
12.9 |
6.9 |
|
|
|
Large .............................. |
16.7 |
25.1 |
3.4 |
10.3 |
7.7 |
|
|
School povertyb |
|
|
|
|
|
|
|
|
|
Very low.......................... |
26.3 |
35.4 |
6.5 |
15.6 |
8.8 |
|
|
|
Low................................. |
18.1 |
23.6 |
4.3 |
12.0 |
6.7 |
|
|
|
Medium........................... |
22.4 |
14.9 |
1.7 |
9.2 |
3.9 |
|
|
|
High ................................ |
23.6 |
9.8 |
0.8 |
6.9 |
4.9 |
|
aSmall = fewer than 600 students enrolled, medium = 600-1,800, and large = more than 1,800. bMeasured by percentage of students eligible for free or reduced-price lunches: very low = 5 percent or less, low = 6-25 percent, medium = 26-50 percent, and high = 51-100 percent. NOTE: AP = Advanced Placement, IB = International Baccalaureate, NA = not available. AP and IB courses were coded separately in 1998 and 2000 but not in prior years. AP/IB calculus courses are counted both in their specific column and in the “any calculus” column. Before 1998, AP and IB courses were coded with the general set of courses. SOURCE: National Science Board. Science and Engineering Indicators 2004. NSB 04-01. Arlington, VA: National Science Foundation, 2004. Appendix Table 1-10. This table was based on US Department of Education, Center for National Education Statistics, High School Transcript Studies, various years. |
|||||||
the influence that the federal government can exert on state educational systems, school districts, and individual schools. Nevertheless, the federal government can enable change by leveraging its investments in K–12 education, by providing information and other resources to organizations, and by helping to coordinate the many groups and individuals with a stake in science, mathematics, and technology education. Three policy arenas seem particularly promising: teacher preparation, educational standards, and institutional change.
TABLE K–12-8 High-School Graduates Completing Advanced Courses (1990, 1994, and 1998), by Students and School Characteristics in 1998
|
Year and characteristic |
Advanced biology |
Chemistry |
Physics |
Advanced biology, chemistry, and physics |
|||||
|
Any |
AP/IB |
Any |
AP/IB |
Any |
AP/IB |
||||
|
1990 ................................ |
27.5 |
NA |
45.0 |
NA |
21.5 |
NA |
7.4 |
||
|
1994 ................................ |
34.8 |
NA |
50.4 |
NA |
24.5 |
NA |
9.9 |
||
|
1998 ................................ |
37.4 |
4.9 |
56.4 |
2.9 |
28.6 |
1.7 |
12.1 |
||
|
|
Male............................. |
33.8 |
4.0 |
53.3 |
3.3 |
31.0 |
2.3 |
11.8 |
|
|
|
Female ......................... |
40.8 |
5.8 |
59.2 |
2.6 |
26.6 |
1.2 |
12.3 |
|
|
|
White............................ |
38.5 |
5.0 |
58.8 |
2.9 |
31.1 |
1.8 |
13.4 |
|
|
|
Asian/Pacific Islander … |
43.0 |
14.0 |
63.7 |
9.5 |
37.4 |
4.8 |
15.7 |
|
|
|
Black............................ |
35.8 |
3.4 |
51.1 |
1.2 |
20.3 |
0.8 |
7.6 |
|
|
|
Hispanic ....................... |
31.2 |
3.1 |
45.5 |
2.9 |
19.4 |
1.3 |
8.2 |
|
|
|
School urbanicity |
|
|
|
|
|
|
|
|
|
|
|
Urban....................... |
43.0 |
5.9 |
62.4 |
3.9 |
30.8 |
2.7 |
14.0 |
|
|
|
Suburban ................. |
39.4 |
5.9 |
56.1 |
3.2 |
31.2 |
2.0 |
14.6 |
|
|
|
Rural........................ |
29.3 |
2.6 |
50.9 |
1.6 |
23.1 |
0.4 |
7.3 |
|
|
School sizea.................. |
|
|
|
|
|
|
|
|
|
|
|
Small........................ |
36.4 |
2.9 |
57.7 |
0.9 |
25.7 |
0.3 |
11.7 |
|
|
|
Medium.................... |
36.8 |
4.9 |
56.6 |
2.9 |
31.0 |
1.9 |
13.4 |
|
|
|
Large ....................... |
40.1 |
6.6 |
55.0 |
4.8 |
24.8 |
2.6 |
9.2 |
|
|
School povertyb |
|
|
|
|
|
|
|
|
|
|
|
Very low................... |
37.9 |
6.4 |
71.2 |
4.8 |
43.0 |
3.6 |
17.8 |
|
|
|
Low.......................... |
39.4 |
4.6 |
54.2 |
1.9 |
26.9 |
0.9 |
11.7 |
|
|
|
Medium.................... |
34.1 |
3.4 |
52.4 |
2.2 |
23.6 |
1.3 |
10.2 |
|
|
|
High ......................... |
37.7 |
5.3 |
50.7 |
2.1 |
17.4 |
1.0 |
7.5 |
|
aSmall = fewer than 600 students enrolled, medium = 600-1,800, and large = more than 1,800. bMeasured by percentage of students eligible for free or reduced-price lunches: very low = 5 percent or less, low = 6-25 percent, medium = 26-50 percent, and high = 51-100 percent. NOTE: AP = Advanced Placement, IB = International Baccalaureate, NA = not available. AP and IB courses were coded separately in 1998 and 2000 but not in prior years. AP/IB courses are counted both in their specific columns and in columns that correspond to the general course category. For example, AP chemistry is included in the “any chemistry” column in addition to being listed in its own column. Before 1998, AP and IB courses were coded with the general set of courses. SOURCE: National Science Board. Science and Engineering Indicators 2004. NSB 04-01. Arlington, VA: National Science Foundation, 2004. Appendix Table 1-11. This table was based on US Department of Education, Center for National Education Statistics, High School Transcript Studies, various years. |
|||||||||
IMPROVING THE QUALITY OF MATHEMATICS, SCIENCE, AND TECHNOLOGY TEACHING
Students learn about science, mathematics, and technology first and foremost through interactions with teachers. Changing the nature of those
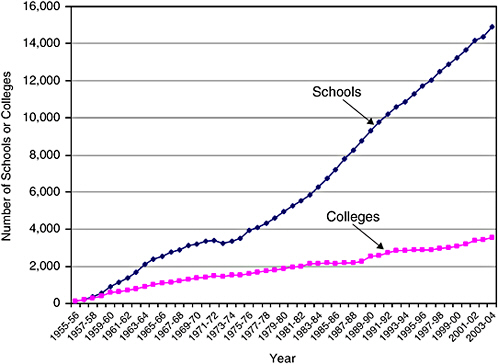
FIGURE K–12-3 Number of schools and colleges participating in AP programs.
SOURCE: National Research Council. Learning and Understanding: Improving Advanced Study of Mathematics and Science in US High Schools. Washington, DC: National Academy Press, 2002. Data courtesy of Jay Labov, Center for Education, National Academies.
interactions is the surest way to improve education in these subjects in the United States.
Many mathematics and science teachers in US schools do not have backgrounds needed to teach these subjects well (see Figure K–12-4).5 Many of these teachers at the high school level—and even more at the middle school level—do not have a college degree in the subject they are teaching (see Tables K–12-9 and K–12-10). Many lack certification to teach mathematics and science, and a subset of teachers start in the classroom without any formal training. The lack of adequate training and background is especially severe at schools serving large numbers of disadvantaged students, creating a vicious circle in which a substandard education and low achievement are intertwined (see Table K–12-11). The stresses on teachers are equally se-
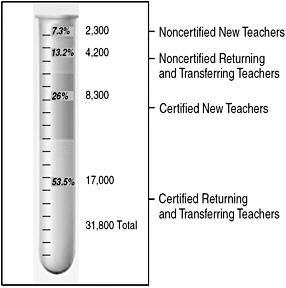
FIGURE K–12-4 Middle and high school mathematics and science positions filled during the 1993-1994 school year by certified and noncertified teachers.
SOURCE: National Center for Education Statistics. Schools and Staffing Survey (1993-1994). Washington, DC: United States Department of Education, 2006.
vere: Of new mathematics and science teachers, about one-third leave teaching within the first 3 years.
The best predictors of higher student achievement in mathematics and science are (1) full certification of the teacher and (2) a college major in the field being taught.6 Teachers need a high-quality education and continued development as professionals throughout their careers. Federal policy initiatives that could help meet these objectives include the following:
-
Allocate federal professional-development funds to summer institutes that address the most pressing professional-development needs of mathematics and science teachers.7
-
Keep summer-institute facilitators—teachers current with the most effective teaching methods in their disciplines and who have shown demonstrable results of higher student achievement in mathematics and science—abreastof new insights and research in science and mathematics teaching by providing funding for training them.8
TABLE K–12-9 Public High School Students Whose Mathematics and Science Teachers Majored or Minored in Various Subject Fields, by Poverty Level and Minority Enrollment in School: 1999-2000
-
Encourage higher-education institutions to establish mathematics and science teaching academies that include faculty from science, mathematics, and education departments through a competitive grant process.9
-
Support promising students to study science, mathematics, and engineering teaching—particularly those obtaining degrees in science, mathematics, or engineering who plan to teach at the K–12 level following graduation through scholarships and loan programs for students as well as institutional funding.10 Qualified college students and midcareer profession-
TABLE K–12-10 Public Middle and High School Mathematics and Science Teachers Who Entered Profession Between 1995-1996 and 1999-2000 and Reported Feeling Well Prepared in Various Aspects of Teaching in First Year, by Participating in Induction and Mentoring Activities: 1999-2000
|
Subject and activity |
Handle classroom management and discipline |
Use variety of instructional methods |
Teach subject matter |
Use computers in classroom instruction |
Plan lessons effectively |
Assess students |
Select/adapt curriculum and instructional materials |
||
|
All mathematics teachers ............... |
50.5 |
65.1 |
90.1 |
41.5 |
77.5 |
69.7 |
53.9 |
||
|
|
Induction program |
|
|
|
|
|
|
|
|
|
|
|
Yes......................................... |
50.8 |
67.2 |
89.4 |
45.1 |
78.2 |
70.9 |
55.8 |
|
|
|
No.......................................... |
50.0 |
61.8 |
91.1 |
35.7 |
76.4 |
67.9 |
51.0 |
|
|
Mentor |
|
|
|
|
|
|
|
|
|
|
|
Yes......................................... |
53.5 |
68.7 |
89.6 |
41.8 |
79.3 |
72.6 |
57.1 |
|
|
|
No.......................................... |
44.6 |
58.2 |
91.0 |
40.8 |
74.0 |
64.1 |
47.8 |
|
All science teachers........................ |
50.8 |
66.0 |
82.9 |
48.0 |
69.4 |
68.8 |
58.6 |
||
|
|
Induction program |
|
|
|
|
|
|
|
|
|
|
|
Yes......................................... |
51.7 |
70.1 |
83.8 |
51.3 |
74.7 |
72.5 |
63.6 |
|
|
|
No.......................................... |
49.1 |
58.0 |
81.0 |
41.5 |
59.0 |
61.6 |
48.6 |
|
|
Mentor |
|
|
|
|
|
|
|
|
|
|
|
Yes......................................... |
56.6 |
73.6 |
84.9 |
51.5 |
75.3 |
74.3 |
64.6 |
|
|
|
No.......................................... |
42.0 |
54.4 |
79.7 |
42.6 |
60.3 |
60.4 |
49.2 |
|
SOURCE: National Science Board. Science and Engineering Indicators 2004. NSB 04-01. Arlington, VA: National Science Foundation, 2004. Appendix Table 1-15. This table was based on US Department of Education, National Center for Education Statistics, Schools and Staff ing Survey, 1999-2000. |
|||||||||
TABLE K–12-11 Public School Students, Teachers, and Cost Data
|
Fall 2003 enrollment K–12a |
48,132,518 |
|
High school graduates—2003-2004a |
2,771,781 |
|
Male graduates going to college—2001b |
60% |
|
Female graduates going to college—2001b |
64% |
|
Total number of school teachers—2003-2004a |
3,044,012 |
|
Total number of math and science teachers (K–12)c |
1,700,000 |
|
Total number of math teachers (6–12) 1999-2000d |
191,214 |
|
Total number of science teachers (6–12) 1999-2000d |
159,488 |
|
Average public school teacher salary—2003-2004a |
$46,752 |
|
Average spent per studenta |
$8,248 |
|
Operating school districts in the United Statesa |
15,397 |
|
SOURCES: aNational Education Association. Rankings & Estimates: Rankings of the States 2004 and Estimates of School Statistics 2005. Atlanta, GA: NEA Research, June 2005. Available at: http://www.nea.org/edstats/images/05rankings.pdf. bNational Science Board. Science and Engineering Indicators 2004. NSB 04-01. Arlington, VA: National Science Foundation, 2004. Appendix Table 1-19. cNational Commission on Mathematics and Science Teaching for the 21st Century. Before It’s Too Late: A Report to the Nation. Washington, DC: National Assessment of Education Progress, September 27, 2000. Available at: http://www.ed.gov/inits/Math/glenn/toc.html. dNational Center for Education Statistics. Digest of Education Statistics 2003. Washington, DC: US Department of Education, 2004. Table 67. |
|
-
als need to be attracted into teaching and given the preparation they require to succeed. Experts in mathematics, science, and technology should be able to become teachers by completing programs to acquire and demonstrate fundamental teaching skills. Recruitment, preparation, and retention of minority-group teachers are particularly important as groups underrepresented in science, mathematics, and engineering become a larger percentage of the student population.11
-
Conduct an aggressive national-outreach media campaign to attract young people to teaching careers in mathematics and science.12
-
Work for broad improvements in the professional status of science, mathematics, and technology teachers.13 Structured induction programs for new teachers, district–business partnerships, award programs, and other incentives can inspire teachers and encourage them to remain in the field. Most
-
important, salaries for science, mathematics, and technology teachers need to reflect what they could receive in the private sector and be in accord with their contributions to society, and teachers need to be treated as professionals and as important members of the science and engineering communities.
ENHANCING THE QUALITY AND COHESION OF EDUCATIONAL STANDARDS
Since the early 1990s, states have been developing academic standards in mathematics, science, and technology education based in part on national standards developed by the National Council of Teachers of Mathematics, the National Research Council, the American Association for the Advancement of Science, and other organizations. The use of these standards in curriculum development, teaching, and assessment has had a positive effect on student performance and probably contributed to the recent increased performance of 8th-grade students in international comparisons.14
But standards still vary greatly from state to state and across districts and often are not well aligned with the tests used to measure student performance. In addition, many sets of standards remain focused on lower-level skills that may be easier to measure but are not necessarily linked to the knowledge and skills that students will need to do well in college and in the modern workforce. A common flaw in mathematics and science curricula and textbooks is the attempt to cover too much material, which leads to superficial treatments of subjects and to needless repetition when hastily taught material is not learned the first time. Standards need to identify the most important “big ideas” in mathematics, science, and technology, and teachers need to ensure that those subjects are mastered.
The No Child Left Behind legislation requires testing of students’ knowledge of science beginning in 2006-2007, and the science portion of the NAEP is being redesigned. Development of such assessments raises profound methodologic issues, such as how to assess inquiry and problem-solving skills using traditional large-scale testing formats.
Several federal initiatives can serve the national interest in establishing and maintaining high educational standards while respecting local responsibility for teaching and learning:
-
Help colleges, businesses, and schools work together to link K–12 standards to college admissions criteria and workforce needs to create a seamless K–16 educational system.15
-
Provide incentives for states and coalitions of states to conduct benchmarking studies between their standards and the best standards available.
-
Foster the development of high-quality curricula and assessments that are closely aligned with world-class standards.
-
Establish ambitious but realistic goals for student performance—for example, that 30% of high school seniors should be proficient in science by 2010 as measured by the NAEP.
CHANGING THE INSTITUTIONAL STRUCTURE OF SCHOOLS
Students and teachers remain constrained by several of the key organizational features of schools.16 The structure of the curriculum, of individual classes, of schools, and of the school day keeps many students from taking advantage of opportunities that could build their interest in science and technology.
Possible federal initiatives include these:
-
Provide seed money or incentives for new kinds of schools and new forms of schooling. Promising ideas include small high schools, dual-enrollment programs in high schools and colleges, colocation of schools with institutions of higher education, and wider use of Advanced Placement and International Baccalaureate courses.
-
Help districts institute reorganization of the school schedule to support teaching and learning.17 Possibilities include devoting more time to study of academic subjects, keeping schools open longer in the day and during parts of the summer, and providing teachers with additional time for development and collaboration.
-
Provide scholarships for low-income students who demonstrate that they have taken a core curriculum in high school that prepares them to study science, mathematics, or engineering in college.
CATALYZING CHANGE
The federal government has an important role to play in catalyzing the efforts of states, school districts, and schools to improve science, mathematics, and technology education. Promising actions include the following:
-
Launch a large-scale program of research, demonstration, and evaluation in K–12 science, mathematics, and technology education.18 Such a program should include distinguished researchers working in partnership with practitioners and policy-makers and supported by a national coalition of public and private funding organizations and other stakeholders.
-
Help create a nongovernment Coordinating Council for Mathematics and Science Teaching that would bring together groups with a stake in mathematics and science teaching and monitor progress on teacher recruitment, preparation, retention, and rewards.19
-
Support the creation of state councils of business leaders, higher-education representatives, and K–12 educators to achieve comprehensive, coordinated, system-level improvement in science, mathematics, and technology education from prekindergarten through college.20
The United States brings unique strengths to the challenge of reforming K–12 science, mathematics, and technology education, including the flexibility of its workforce and its unparalleled legacy of achievement in science and technology. The challenge facing policy-makers is to find ways of generating meaningful change in an educational system that is large, complex, and pluralistic.


