
2
Cancer Survivors
Who are cancer survivors and what does cancer survivorship mean? The terms have different meanings to different people, and how to refer to this growing population has stirred some controversy. The recent report of the President’s Cancer Panel describes some of the issues associated with the definition (Box 2-1).
This section of the report reviews the history and conceptual development of the terms “cancer survivor” and “survivorship.” In addition, some of the clinical and sociodemographic characteristics of cancer survivors are described using epidemiological data from the National Cancer Institute (NCI). Some attention is paid to the definitions developed by the National Coalition for Cancer Survivorship (NCCS) and NCI’s Office of Cancer Survivorship, for they have been adopted by the committee. While adopting these definitions, the committee decided to focus much of its attention on a particular period of survivorship—the period following first diagnosis and treatment and prior to the development of a recurrence of cancer or death. This period of survivorship represents a distinct phase of the cancer control continuum that has not been well described (Box 2-2). Chapter 4 discusses in further detail the trajectory of cancer care and provides more detail on the committee’s rationale for focusing on this particular phase of survivorship.
DEFINING CANCER SURVIVORS AND SURVIVORSHIP
The NCI and the Centers for Disease Control and Prevention (CDC) estimate that as of 2002 there were 10.1 million living persons who had
|
BOX 2-1 Among health professionals, people with a cancer history, and the public, views differ as to when a person with cancer becomes a survivor. Many consider a person to be a survivor from the moment of diagnosis; in recent years, this view has become increasingly prevalent. Some, however, think that a person with a cancer diagnosis cannot be considered a survivor until he or she completes initial treatment. Others believe a person with cancer can be considered a survivor if he or she lives 5 years beyond diagnosis. Still others believe survivorship begins at some other point after diagnosis or treatment, and some reject the term “survivor” entirely, preferring to think of people with a cancer history as fighters, “thrivers,” champions, patients, or simply as individuals who have had a life-threatening disease. A considerable number of people with a cancer history maintain that they will have survived cancer if they die from another cause. SOURCE: President’s Cancer Panel (2004b). |
|
BOX 2-2 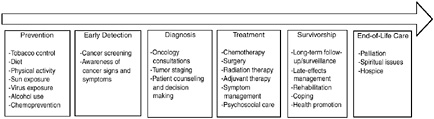 The cancer control continuum has been used at least since the mid-1970s to describe the various points from cancer prevention, early detection, diagnosis, treatment, survivorship, and end of life. The continuum has changed somewhat over time. Because survivors are now a large and growing population, survivorship has been added to the continuum. Rehabilitation was once a specific phase; now it is generally considered part of treatment and survivorship care. Like many other useful concepts, the continuum is oversimplified. As modern biology has changed our understanding of cancer, it is now recognized that the categories are useful labels, but the processes are not so discrete. For example, colonoscopy is now recognized as both a screening test for colon cancer and a prevention strategy if polyps are found. Moreover, many topics are cross-cutting. For example, communication, decision making, quality of care, and health disparities are of concern at each point along the continuum. SOURCE: Adapted from National Cancer Institute figure on the “Cancer Control Continuum” (NCI, 2005a). |
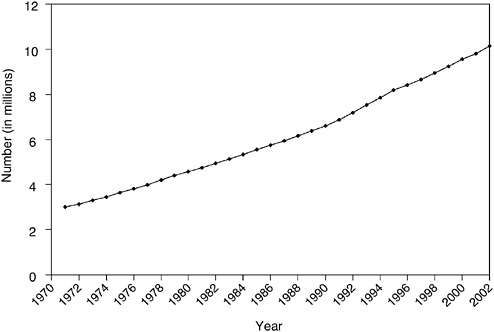
FIGURE 2-1 Estimated number of cancer survivors in the United States from 1971 to 2002.
DATA SOURCES: U.S. prevalence counts were estimated by applying U.S. population counts to SEER 9 Limited Duration Prevalence proportions and historical Connecticut Limited Duration Prevalence proportions and adjusted to represent complete prevalence (2004 submission). Complete prevalence is estimated using the completeness index method (Capocaccia and De Angelis, 1997; Merrill et al., 2000). Populations from January 2002 were based on the average of the July 2001 and July 2002 population estimates from the U.S. Census Bureau.
SOURCE: NCI (2005c).
ever received a diagnosis of cancer (NCI, 2005c). This represents a tripling of the number of survivors since 1971 (Figure 2-1). Much of this increase can be traced to the advent of widespread screening for breast, cervical, and prostate cancers, which identified many more cases of early disease. Advances in treatment also account for a portion of the increase, albeit to a lesser extent (Welch et al., 2000a,b).
Only since the mid-1970s have half of individuals diagnosed with cancer been expected to be alive 5 years following their diagnosis (Rowland et
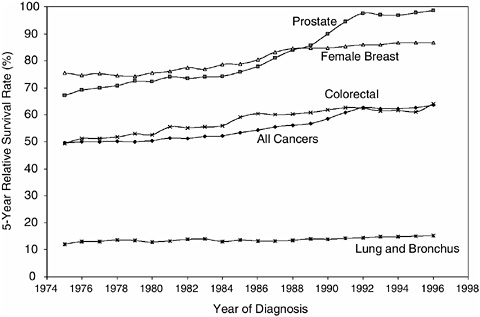
FIGURE 2-2 Five-year relative survival rates.
SOURCE: NCI (2004c).
al., 2004). By the late 1990s, the overall 5-year relative survival rate1 had increased to 64 percent (Ries et al., 2004) (Figure 2-2). When cancer was considered incurable, the term “survivor” applied to the family members whose loved one died from the disease (Leigh, 2004). As improvements in treatment occurred in the 1960s, physicians began to refer to “cancer survivors” as those who had survived 5 years past their diagnosis or treatment, a time when the risk of a recurrent cancer had diminished substantially (Leigh, 2004).
The number of survivors of cancer is expected to balloon with the anticipated growth of the U.S. population and the aging of the baby boom cohort (individuals born between the years 1946 to 1964) (Yancik, 1997; Cheeseman Day, 2001). In 2011, the first members of this group will reach age 65, the age at which the risk of cancer steadily rises. From 2000 to
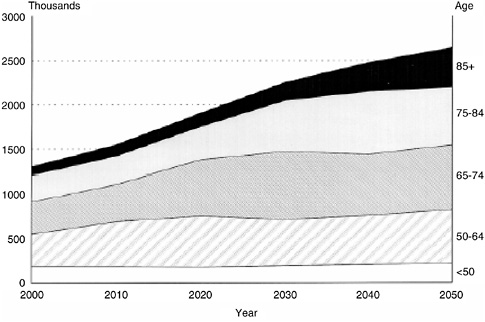
FIGURE 2-3 Projected number of cancer cases for 2000 through 2050. Projections based on (1) U.S. Census Bureau population projections (2000–2050) and (2) age-specific cancer incidence rates (1995–1999) from the Surveillance, Epidemiology, and End Results (SEER) Program and the National Program of Cancer Registries (NPCR), 1995–1999.
SOURCE: Edwards et al. (2002). Reprinted by permission of Wiley-Liss, Inc., a subsidiary of John Wiley & Sons, Inc. Cancer 94(10):2766–2792. Copyright © 2002. American Cancer Society.
2050, the absolute number of people aged 65 and older diagnosed with cancer is expected to double (Figure 2-3) (Edwards et al., 2002). This estimate is based on applying current cancer incidence rates to Census Bureau population projections. If accurate, these estimates would indicate that the number of cancer survivors will grow at an even greater rate than incident cancers, putting great demands on service providers and systems of care.
As the number of cancer survivors increased throughout the 1970s and 1980s, a cancer survivorship advocacy community emerged and identified medical, psychosocial, economic, and legal issues related to their history of cancer. The National Coalition for Cancer Survivorship (NCCS), a cancer advocacy group founded in 1986, defined cancer survivorship as “the experience of living with, through, and beyond a diagnosis of cancer” (NCCS, 1996). Full articulation of the concept of “cancer survivorship” can be traced to a 1985 article written by one of NCCS’s founders, Fitzhugh
Mullan, in the New England Journal of Medicine (Mullan, 1985). It describes his personal experience as a cancer survivor.
Actuarial and population-based figures give us survival estimates for various cancers, but those figures do not speak to the individual patient, whose experience is unique and not determined or described by aggregate data. Many patients are “cured” long before they pass the five-year mark, and others go well beyond the five-year point with overt or covert disease that removes them from the ranks of the “cured,” no matter how well they feel. Survival is a much more useful concept, because it is a generic idea that applies to everyone diagnosed as having cancer, regardless of the course of the illness. Survival, in fact, begins at the point of diagnosis, because that is the time when patients are forced to confront their own mortality and begin to make adjustments that will be part of their immediate, and to some extent, long-term future (Mullan, 1985).
Mullan described three “seasons” of survival, each with unique sets of concerns:
-
Acute survival begins with the diagnosis of the illness and is dominated by diagnostic and therapeutic efforts. Fear and anxiety are important and constant elements of this phase.
-
Extended survival is a period during which a patient goes into remission or has terminated the basic, rigorous course of treatment and enters a phase of watchful waiting, with periodic examinations and “consolidation” or intermittent therapy. Psychologically, this time is dominated by fear of recurrence. This is usually a period of physical limitations since the tumor and treatment have exacted a corporal price. Diminished strength, fatigue, a reduced capacity for exercise, amputation of a body part, or hair loss may have occurred in the acute phase, but now they must be dealt with in the home, the community, and the workplace.
-
Permanent survival is roughly equated with “cure,” but the person who has come through a cancer experience is indelibly affected by it. Problems with employment and insurance are common for persons who have been treated for cancer and are ready to resume a full life. The long-term, secondary effects of cancer treatment on health represent another area in which permanent survivors are at risk.
Welch-McCaffrey and colleagues (1989) further developed the concept of survivorship and described several potential cancer survival trajectories:
-
Live cancer free for many years
-
Live long cancer free, but die rapidly of late recurrence
-
Live cancer free (first cancer), but develop second primary cancer
-
Live with intermittent periods of active disease
-
Live with persistent disease
-
Live after expected death
This new focus on both the short- and long-term consequences of cancer represented a radical departure from earlier conceptualizations of survivorship. These consequences include changes in self-concepts and personal horizons, modifications in social relationships, and considerations of costs of treatment and follow-up.
NCI established an Office of Cancer Survivorship in 1996. The Office of Cancer Survivorship adopted the NCCS definition of a cancer survivor (NCI, 2004b):
An individual is considered a cancer survivor from the time of diagnosis, through the balance of his or her life. Family members, friends, and caregivers are also impacted by the survivorship experience and are therefore included in this definition.
While adopting this broad definition, the Office of Cancer Survivorship decided to focus its research on the post-acute diagnosis and treatment phase of cancer care.
Cancer Survivorship research encompasses the physical, psychosocial, and economic sequelae of cancer diagnosis and its treatment among both pediatric and adult survivors of cancer. It also includes within its domain, issues related to health care delivery, access, and follow up care, as they relate to survivors. Survivorship research focuses on the health and life of a person with a history of cancer beyond the acute diagnosis and treatment phase. It seeks to both prevent and control adverse cancer diagnosis and treatment-related outcomes such as late effects of treatment, second cancers, and poor quality of life, to provide a knowledge base regarding optimal follow-up care and surveillance of cancers, and to optimize health after cancer treatment (NCI, 2004b).
Even if survivorship is defined to begin with the post-treatment period, advances in treatment have obscured when this phase of care begins (Marcus, 2004). Although some have considered cancer survivors to be those who have completed the traditional treatments for cancer—radiation, chemotherapy, or surgery—adjuvant care and treatments such as tamoxifen may now be given to patients for years.
Further complicating the definition of survivors are the consequences of cancer screening. Among those counted as “survivors” are people treated for cancers that would never have come to light clinically, but were diagnosed after a positive screening test (so-called “latent disease”). Men with early-stage prostate cancer diagnosed following prostate-specific antigen (PSA) screening are probably the largest and fastest growing such group
today. In addition, mammography leads to the identification of many cases of ductal carcinoma in situ (DCIS), a cancer that typically remains indolent if left untreated. In both cases, it is difficult at the diagnosis stage to separate which cancers will progress and which will not.2 Physicians are likely to recommend treatment for everyone in these categories, and most will elect to be treated. As “survivors,” they may be at a very different risk for certain events—particularly recurrences—but at equal risk for adverse effects of treatment. Until better diagnostic and prognostic tools become available, these “survivors” of treatment for cancers identified through screening programs will continue to join the ranks of the larger survivor pool.
Aside from the inherent clinical vagaries associated with survivorship, some so-called cancer survivors find the term objectionable because it is so closely associated with the Holocaust or victims of violent crime such as rape (Marcus, 2004). Some people may not want to be labeled as a survivor, and reject the notion that they are different than anyone else. “Survivor” in the context of cancer may be an American construct. The President’s Cancer Panel found in its report, Living Beyond Cancer: A European Dialogue, that Europeans rarely use the term “survivor” to refer to life beyond a cancer diagnosis (President’s Cancer Panel, 2004a). Having cancer still carries a heavy social stigma in Europe and so may not be discussed at all. Europeans and others, however, are increasingly viewing survivorship as an important topic for research and health care.
CHARACTERISTICS OF CANCER SURVIVORS
For statistical purposes, cancer survivors are “prevalent cases”3 and estimates of the number and characteristics of cancer survivors are derived using incidence and survival information from cancer registries overseen by NCI, called the Surveillance, Epidemiology, and End Results (SEER) Program.4
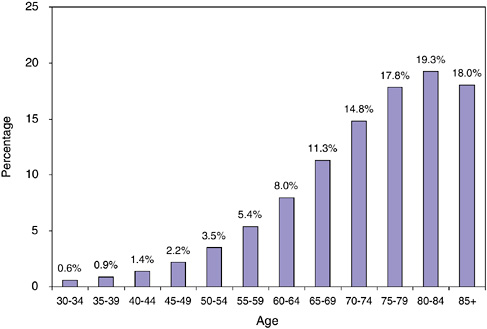
FIGURE 2-4 Cancer prevalence by age, 2002.
SOURCE: NCI (2005b).
The prevalence of cancer is calculated as the number of prevalent cases per total population. Cancer prevalence rises sharply with age as is shown in Figure 2-4. By age 40 to 44, an estimated 1.4 percent of the U.S. population has a history of cancer. This rises steadily by age, and by age 80 to 84, the prevalence of cancer is 19.3 percent (prevalence is 15 percent for those aged 65 and older; 3.5 percent for the total U.S. population). These estimates are limited to prevalent cases diagnosed within the past 27 years.
Type of Cancer
According to the most recent estimates for 2002, the most frequent sites for invasive primary cancer among survivors were breast cancer among women (22 percent), prostate cancer among men (18 percent), and colorectal cancer (10 percent) (Figure 2-5). Half (50 percent) of cancer survivors had a history of one of these cancers. Figures 2-6 and 2-7 show the distribution of prevalent cases by type of cancer and by gender. Among male cancer survivors the three leading types of cancer are prostate cancer (41 percent), colorectal cancer (11 percent), and cancer of the urinary bladder (8 percent). Among female cancer survivors the three leading types of cancer are
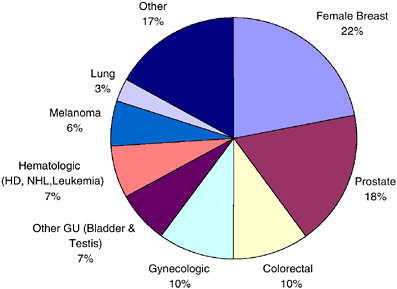
FIGURE 2-5 Distribution of cancer survivors in the U.S. by site, 2002.
DATA SOURCE: U.S. prevalence counts were estimated by applying U.S. population counts to SEER 9 and historical Connecticut Limited Duration Prevalence proportions and adjusted to represent complete prevalence (2004 submission). Complete prevalence is estimated using the completeness index method (Capocaccia and De Angelis, 1997; Merrill et al., 2000). Populations from January 2002 were based on the average of the July 2001 and July 2002 population estimates from the U.S. Census Bureau. The size of the survivorship population was 10.1 million. HD = Hodgkin’s disease, NHL = non-Hodgkin’s lymphoma, GU = genital or urinary. Gynecologic includes cancer of the cervix, corpus uteri, and ovary.
SOURCE: NCI (2005c).
breast cancer (40 percent), cancers of the corpus and uterus (excluding the cervix, 10 percent), and colorectal cancer (10 percent).
Age
As of 2002, more than one-third (38 percent) of survivors were of working age (ages 20 to 64), and 5 percent were in their primary reproductive years (ages 20 to 39) (Figure 2-8). Most (61 percent) cancer survivors were over the age of 65 and therefore eligible for Medicare coverage. Survivors of childhood cancer who are under age 20 make up a small fraction of all cancer survivors (1 percent).
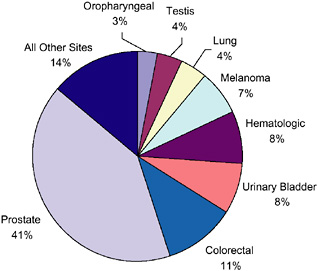
FIGURE 2-6 Distribution of male cancer survivors in the U.S. by site, 2002.
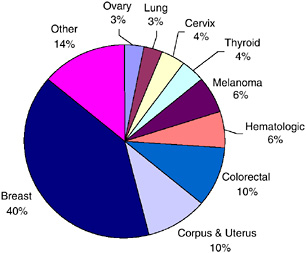
FIGURE 2-7 Distribution of female cancer survivors in the U.S. by site, 2002.
DATA SOURCES: U.S. prevalence counts were estimated by applying U.S. population counts to SEER 9 and historical Connecticut Limited Duration Prevalence proportions and adjusted to represent complete prevalence (2004 submission). Complete prevalence is estimated using the completeness index method (Capocaccia and De Angelis, 1997; Merrill et al., 2000). Populations from January 2002 were based on the average of the July 2001 and July 2002 population estimates from the U.S. Census Bureau. The estimated size of the survivorship population in 2002 was 10.1 million (men: N = 4.5 million; women: N = 5.6 million).
SOURCE: NCI (2005c).
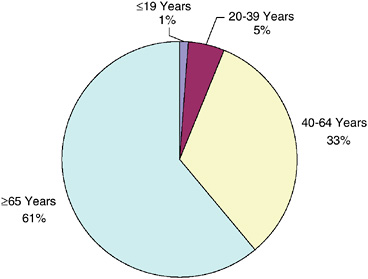
FIGURE 2-8 Estimated percentage of persons alive in the U.S. diagnosed with cancer by current age, 2002.
DATA SOURCES: U.S. prevalence counts were estimated by applying U.S. population counts to SEER 9 and historical Connecticut Limited Duration Prevalence proportions and adjusted to represent complete prevalence (2004 submission). Complete prevalence is estimated using the completeness index method (Capocaccia and De Angelis, 1997; Merrill et al., 2000). Populations from January 2002 were based on the average of the July 2001 and July 2002 population estimates from the U.S. Census Bureau. Includes invasive/first primary cases only. The estimated size of the survivorship population in 2002 was 10.1 million.
SOURCE: NCI (2005c).
Years Since Diagnosis
Most cancer survivors (62 percent) had their cancer diagnosed within the previous 10 years (Figure 2-9). Females are more likely to be long-term cancer survivors, with 19 percent diagnosed 20 or more years ago. Among male survivors, 8 percent were diagnosed 20 or more years ago.
Racial, Ethnic, and Economic Characteristics
Individuals who are poor and members of medically underserved groups are less likely to be represented among cancer survivors. When diagnosed with cancer, such individuals are more likely to be diagnosed at later cancer stages, to have worse treatment outcomes, and to experience a shortened period of survival (IOM, 2003). Health disparities arise from a
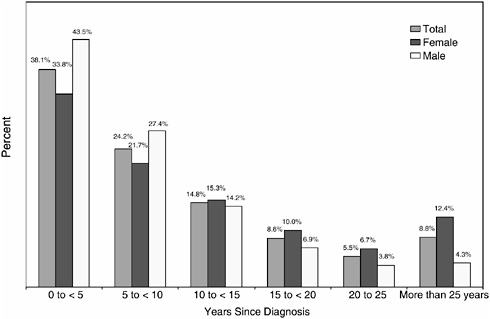
FIGURE 2-9 Distribution of cancer survivors by year since diagnosis, 2002.
DATA SOURCES: U.S. prevalence counts were estimated by applying U.S. populations to SEER 9 and historical Connecticut Limited Duration Prevalence proportions and adjusted to represent complete prevalence (2004 submission). Complete prevalence is estimated using the completeness index method (Capocaccia and De Angelis, 1997; Merrill et al., 2000). Populations from January 2002 were based on the average of the July 2001 and July 2002 population estimates from the U.S. Census Bureau. Includes invasive/first primary cases only. The estimated size of the survivorship population in 2002 was 10.1 million.
SOURCE: NCI (2005c).
complex interplay of economic, social, and cultural factors, with poverty being a key determinant of poor outcomes (Freeman, 2003). In general, when compared to non-Hispanic whites, members of racial and ethnic minority groups are more likely to be poor, have lower education levels, lack health insurance coverage, and have no source of primary care (ACS, 2004a). Cultural factors, including language, values, traditions, and trust in providers, can influence underlying risk factors, health behaviors, beliefs about illness, and approaches to medical care. Social inequities and racial discrimination can also influence the interactions between patients and physicians (IOM, 2003). Racial and ethnic disparities in the receipt of cancer treatment have been documented that could not be completely explained by racial/ethnic variation in clinically relevant factors (Shavers
and Brown, 2002). The consequences of these treatment disparities include more frequent recurrence, shorter disease-free survival, and higher mortality rates. The unequal burden of cancer has been widely recognized and efforts are underway to reduce the gaps in access to care that often contribute to the resultant excess cancer morbidity and mortality (ACS, 2004a). These efforts include interventions to reduce cancer risk factors, improve screening, and improve access to state-of-the-art medical care, including diagnosis and cancer treatment.
This section of the chapter summarizes information on survival for certain racial and ethnic groups provided by the American Cancer Society (Ward et al., 2004; ACS, 2004a).5 Compared to whites and other racial ethnic groups, African-American men and women have the highest mortality rates for all cancer sites combined (Figure 2-10). African Americans have the highest overall incidence rates among men but, among women, whites have the highest incidence rates.
As a group, African Americans are underrepresented in the cancer survivor population—they made up approximately 13 percent of the U.S. population in 2000 (Grieco and Cassidy, 2001; Ingram et al., 2003), but only 8 percent of the survivor population. Furthermore, among cancer survivors in 2000, African Americans are less likely than whites to be long-term survivors (29 percent versus 38 percent had survived 10 years or more).
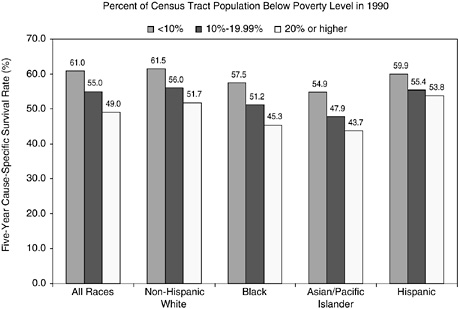
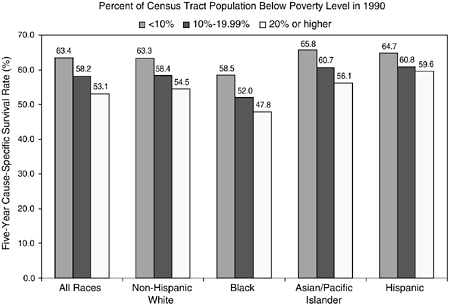
Cancer registries do not routinely collect information on an individual’s educational attainment, income, and other socioeconomic characteristics, so it is not possible to use registry data to analyze cancer statistics by individual socioeconomic status. However, the relationship between cancer survival and the areawide poverty level of an individual’s residence has been examined (Singh et al., 2003). Across all racial and ethnic groups, the 5-year survival rate is more than 10 percent higher for persons who live in affluent census tracts (tracts with less than 10 percent of the population below the poverty line) than for persons who live in poorer census tracts (tracts with more than 20 percent of the population below the poverty line) (Figures 2-11 and 2-12). Racial and ethnic differences persist, however, when county poverty level is accounted for, especially for African Americans.
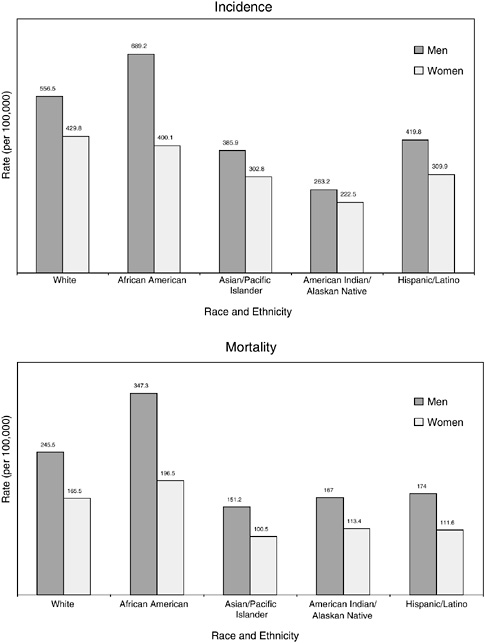
FIGURE 2-10 Age-standardized incidence and death rates, by race and ethnicity, U.S., 1997 to 2001. Rates are age adjusted to the 2000 U.S. standard population. Hispanics/Latinos are not mutually exclusive from whites, African Americans, Asian/Pacific Islanders, and American Indians/Alaskan Natives.
SOURCE: Jemal et al. (2005).
Disability
Disability among older adults is now caused primarily by chronic disease (Ostir et al., 1999). In large studies of physical disability in the community setting, self-report has traditionally been employed to assess the degree of difficulty individuals face in self-maintenance and active involvement in the community (Ostir et al., 1999). The Activities of Daily Living (ADLs) and Instrumental Activities of Daily Living (IADLs) scales are the two most commonly used measures to assess physical disability. ADL items cover basic mobility and activities required for community living (e.g., bathing, dressing, using the toilet, transferring from bed to chair, feeding, walking). Difficulty in performing ADLs can reflect serious health problems, and ADLs are the most frequently used indicators of the ability to live independently. IADLs are intended to identify individuals who are having difficulty performing important activities of living and who may be at risk for loss of independence. The items shown in Box 2-3 are activities that are frequently measured IADLs.
Information on the health and disability status of cancer survivors is available from the National Health Interview Survey (NHIS). However, only those residing in households and well enough to participate in the Survey are interviewed for important components of the Survey. Another limitation of the NHIS is that cancer cases are self-reported and not validated with medical records or cancer registry data. A strength of these data are that they provide estimates that are population based and nationally representative. Analyses of the 1998–2000 NHIS provide information on the prevalence of disability among those reporting a history of cancer (Hewitt et al., 2003). According to these national survey data, adults who
|
BOX 2-3
|
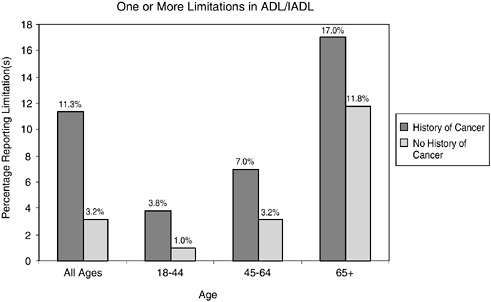
FIGURE 2-13 Limitations in ADL/IADL in cancer survivors versus those with no history of cancer. Data include individuals reporting one or more limitations in ADL/IADL. Individuals with limitations in ADLs include those who reported needing the help of other persons with personal care needs, such as eating, bathing, dressing, or getting around inside the home because of a physical, mental, or emotional problem. Limitations in IADLs included needing the help of other persons in handling routine needs, such as everyday household chores, doing necessary business, shopping, or getting around for other purposes because of a physical, mental, or emotional problem.
SOURCE: Hewitt et al. (2003).
report a history of cancer have higher levels of disability relative to the general population (Figures 2-13 and 2-14). By age group, they are more likely to report having limitations in ADLs (e.g., personal care needs) and functional limitations (e.g., walking, participating in social activities) (see Chapter 6 for a description of work limitations).
Results from other large, nationally representative surveys also associate a history of cancer with relatively high rates of disability (McNeil and Binette, 2001). In 1999, 2 percent of individuals with a history of cancer reported cancer as a main cause of disabilities, including ADL/IADLs, functional limitations, and work limitations. This finding came from the Census Bureau’s Survey of Income and Program Participation in which 36,700 households were represented. Cancer ranked 13th of the conditions most associated with disability (the leading causes of disability were arthritis or rheumatism, back or spine problems, and heart trouble).
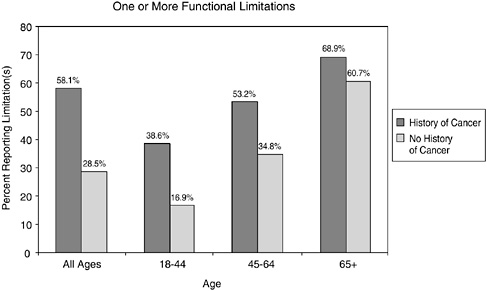
FIGURE 2-14 Functional limitations in cancer survivors versus those with no history of cancer. Data include individuals reporting one or more functional limitations. Functional limitations include those having any degree of difficulty without using any special equipment with walking a quarter of a mile; walking up 10 steps without resting; standing or being on your feet for about 2 hours; sitting for about 2 hours; stooping, bending, or kneeling; reaching up over head; using fingers to grasp or handle small objects; lifting or carrying something as heavy as 10 pounds; pushing or pulling large objects; going out to do things such as shopping, movies, or sporting events; participating in social activities, such as visiting friends, attending clubs and meetings, going to parties, and relaxing at home or for leisure.
SOURCE: Hewitt et al. (2003).
Comorbidity
The term “comorbidity” refers to the co-occurrence of two disorders or syndromes (not symptoms) in the same patient (Yates, 2001; Krishnan et al., 2002). Comorbidities are causally unrelated to the primary diagnosis and so exclude complications of the primary diagnosis or its treatment. The presence of comorbid conditions can affect treatment options, survival, and risk of late effects. In some cases, the factor contributing to the development of cancer (e.g., smoking, obesity) can contribute as well to comorbid disorders (e.g., heart disease).
Cancer survivors often report having comorbid chronic illnesses, in part because many are elderly (Yates, 2001; Yancik et al., 2001a). To learn more about the prevalence of comorbid illness among individuals with cancer and to the assess the implications of comorbidity on cancer out-
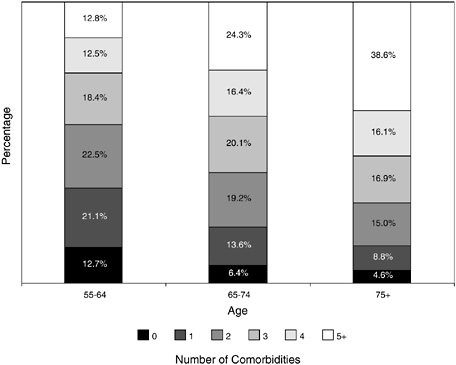
FIGURE 2-15 Number and percentage of chronic conditions among cancer patients, by age group.
SOURCE: Adapted from Yancik (1997).
comes, the National Institute on Aging (NIA) and NCI co-sponsored the SEER Collaborative Study on Comorbidity and Cancer in the Elderly (Yancik, 1997).6 As expected, the prevalence and number of chronic comorbid conditions among cancer patients increases with age (Figure 2-15).
Information regarding the severity of comorbidity is available from a large cohort of 17,712 cancer patients seen at two teaching hospitals in St. Louis, MO, from 1995 to 2001 (Piccirillo et al., 2004).7 Although this
|
6 |
The NIA/NCI study included a random sample of 7,638 cancer patients diagnosed in 1992 and identified through SEER registries. Information on comorbidity was obtained from the SEER registry and from hospital and medical records. |
|
7 |
The certified tumor registrars at these hospitals were trained to code 27 different comorbid ailments from their review of the medical record during the usual chart abstraction process (see information about the comorbidity training course at http://cancercomorbidity.wustl.edu) (Washington University School of Medicine, 2004). The research group has validated a comorbidity index for use with cancer patients (called Adult Comorbidity Evaluation 27 or ACE-27). |
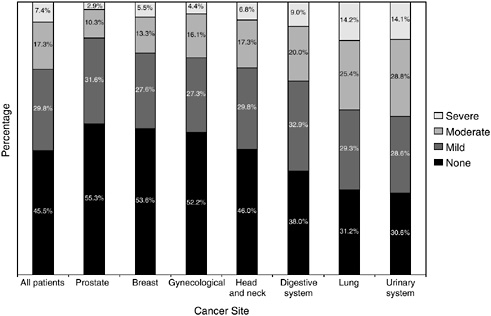
FIGURE 2-16 Severity of comorbidity for all patients and each tumor site.
SOURCE: Piccirillo et al. (2004).
cohort of cancer patients is not representative of the larger population of patients with cancer, it does provide some information on the widespread prevalence and severity of comorbid conditions among patients cared for at selected institutions. Prostate and breast cancer patients were least likely to have comorbid conditions, and individuals with urinary system and lung cancer were most likely to have severe comorbid conditions (Figure 2-16). Severity was graded according to information on diseases and conditions in patients’ medical charts.
SITE-SPECIFIC EPIDEMIOLOGY
Summary statistics by cancer site/type—the numbers of survivors, incident cases, and deaths, and the rates of incidence, mortality, and 5-year relative survival—are shown for 2002 in Table 2-1. Another useful statistic for cancer survivors is the “conditional” relative survival rate (Henson et al., 1995; Merrill et al., 1998). The commonly reported survival statistics shown in Table 2-1 provide information that is pertinent to cancer patients at the time of their diagnosis. Once individuals have survived for a period of time, however, they are more interested in how their subsequent prospects for survival have changed. Cancer patients who have already survived 1
TABLE 2-1 Estimated Number of Cancer Survivors, Incident Cases, and Deaths as Well as Age-Adjusted Incidence and Mortality Rates, and 5-Year Relative Survival Rates, United States, 2002
|
Site |
Numbers |
||
|
Survivors |
New Cases |
Deaths |
|
|
All sites |
10,146,324 |
1,284,900 |
555,500 |
|
Female breast |
2,278,269 |
203,500 |
39,600 |
|
Prostate |
1,831,929 |
189,000 |
30,200 |
|
Colorectal |
1,051,682 |
148,300 |
56,600 |
|
Corpus and uterus, NOSc |
571,854 |
39,300 |
6,600 |
|
Melanoma |
629,822 |
53,600 |
7,400 |
|
Urinary bladder |
499,199 |
56,500 |
12,600 |
|
Lung and bronchus |
350,679 |
169,400 |
154,900 |
|
Non-Hodgkin’s lymphoma |
347,039 |
53,900 |
24,400 |
|
Cervix uteri |
223,441 |
13,000 |
4,100 |
|
Leukemia |
189,865 |
30,800 |
21,700 |
|
Testes |
164,009 |
7,500 |
400 |
|
Hodgkin’s disease |
145,501 |
7,000 |
1,400 |
|
NOTE: Includes invasive cancers only, except urinary bladder, which includes invasive and in situ cancers. aRates per 100,000 and age-adjusted to the 2000 U.S. standard population by 5-year age groups (1997–2002). bFive-year relative survival rates expressed as percentages (1997–2002). For cancer, the relative survival rate is calculated by adjusting the survival rate to remove all causes of death except cancer. Relative survival is defined as the ratio of the proportion of observed survivors in a cohort of cancer patients to the proportion of expected survivors in a comparable set of cancer-free individuals. The formulation is based on the assumption of independent competing causes of death. If age, race, sex, or year information is missing, that individual is excluded from the analysis (NCI, 2004d). |
|||
year after diagnosis usually have a better chance of surviving the next 5 years than during the first 5 years after diagnosis.
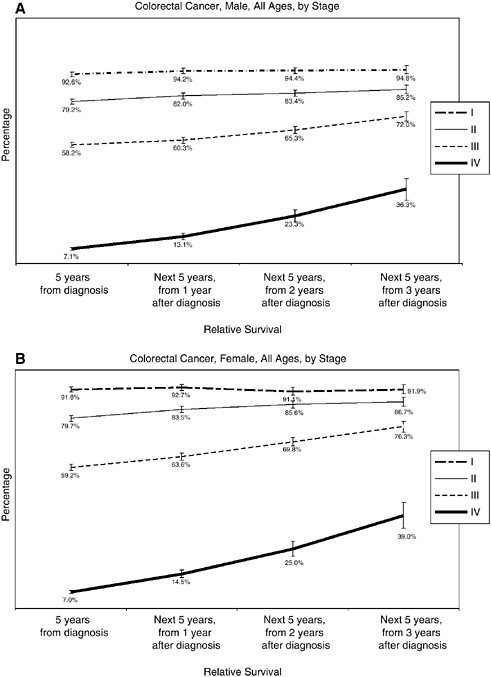
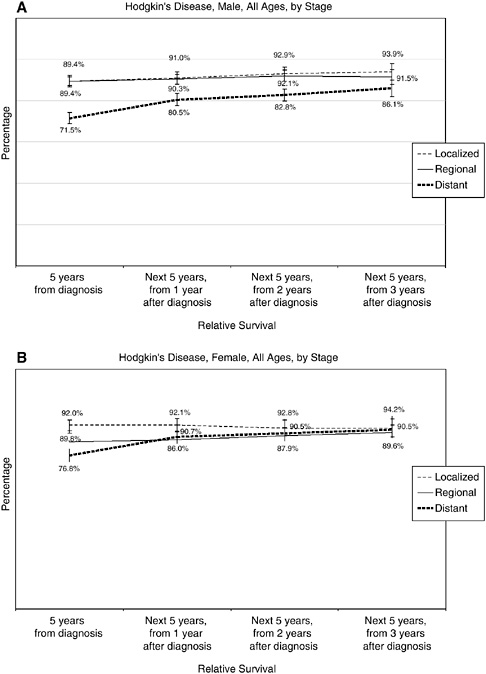
What follows are several figures showing, for selected cancers, the 5-year relative survival rates at diagnosis, and then the 5-year conditional survival rates at 1, 2, and 3 years following diagnosis. Differences in conditional survival are most pronounced among those with late-stage disease. For example, a person with Stage IV colorectal cancer has an estimated 7 percent chance of surviving 5 years from the time of diagnosis, but a 23 to 25 percent chance of surviving 5 additional years if he or she has already survived 2 years beyond diagnosis (Figures 2-17 to 2-19). These estimates were based on analyses of SEER cancer registry data for cases diagnosed from 1993 to 2000 and provided to the committee by NCI (see source information in Figures 2-17 to 2-19).
The next section of the chapter provides more detailed statistics to describe people who are newly diagnosed (the incident population) and
|
Rates |
||
|
Age-Adjusted Incidencea |
Age-Adjusted Mortalitya |
5-Year Relative Survivalb |
|
471.4 |
193.5 |
64.8 |
|
132.9 |
25.5 |
88.5 |
|
176.3 |
28.1 |
99.7 |
|
51.9 |
19.6 |
63.1 |
|
24.5 |
4.2 |
84.9 |
|
18.3 |
2.6 |
90.4 |
|
20.7 |
4.4 |
80.7 |
|
62.1 |
54.9 |
15.4 |
|
19.3 |
7.6 |
61.0 |
|
7.2 |
2.5 |
72.1 |
|
11.7 |
7.5 |
48.4 |
|
5.6 |
0.3 |
95.0 |
|
2.9 |
0.5 |
88.1 |
|
cNOS = not otherwise specified. SOURCES: ACS (2002); Ries et al. (2005). |
||
those who are cancer survivors living with a history of cancer (the prevalent population). Information specific to four types of cancer are provided: female breast cancer, prostate cancer, colorectal cancer, and Hodgkin’s disease (HD). Together, these cancers account for more than half of the survivorship population. These four cancer sites will be used to illustrate the variable nature of survivorship discussed in Chapter 3.
Characteristics of the incident population, such as cancer stage and age at diagnosis, can significantly affect disease prognosis, treatment options, insurance status, and other circumstances, as well as emotional responses to cancer. The makeup of the survivorship population is determined by the dynamics of who is diagnosed with cancer (and at what age), and who dies from cancer (and the length of their lives). Well represented in the survivorship population are people who are diagnosed at an early age with cancers with a good prognosis (e.g., early-stage breast and prostate cancer). Not well represented in the survivorship population are people with cancers that
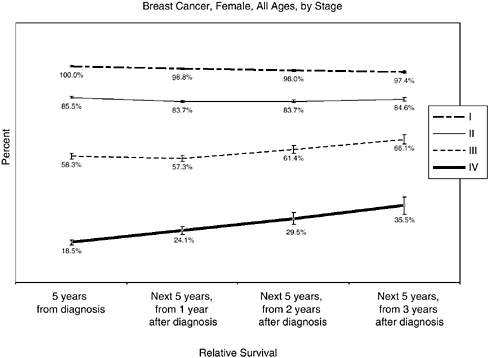
FIGURE 2-17 Conditional 5-year relative survival rates, breast cancer, by stage (modified American Joint Committee on Cancer [AJCC] staging).
NOTE: For Figures 2-17 to 2-19, bars around the point estimates indicate 95 percent confidence intervals.
SOURCE: Estimates based on NCI analyses of Surveillance, Epidemiology, and End Results (SEER) cancer registry data for cases diagnosed from 1993 to 2000 using SEER*Stat software and SEER 12 registries. Software: Surveillance Research Program, NCI SEER*Stat software (www.seer.cancer.gov/seerstat), version 6.0.0-beta. Data: SEER Program SEER*Stat database: Incidence—SEER 11 Regs + AK, Public Use Nov 2003 Sub (1973-2001 varying), NCI, Division of Cancer Control and Population Sciences, Surveillance Research Program, Cancer Statistics Branch, released April 2004, based on the November 2003 submission.
are diagnosed at older ages and those with late-stage disease (e.g., pancreatic and lung cancer). The availability of screening tests for certain cancers has changed the composition of the survivorship population, increasing greatly the number of survivors living long term with preclinical and treatable early-stage disease. Differential use of these tests has contributed to an underrepresentation of certain groups in the survivorship population, for example, those with poor access to health care. Because there is unequal access to health care in the United States, significant disparities arise in cancer survivorship. This section will describe the nature of some of these
disparities and highlight some important distinctions between the incident and prevalent populations that have policy implications, for example, different age distributions that affect health insurance coverage.
Female Breast Cancer
Breast cancer is the most common invasive cancer among women in the United States, and 211,240 new cases will be diagnosed in 2005 (ACS, 2005a). There is a one in seven probability for women to develop breast cancer in their lifetime (ACS, 2005a). The incidence of breast cancer among women increased on average 0.5 percent per year during the period 1987 to 2001, while mortality declined an average of 2.3 percent per year during the period 1990 to 2001 (Jemal et al., 2004; Ries et al., 2004). This has resulted in a 12.8 percent increase in 5-year survival (from 74.9 percent in 1975–1979 to 87.7 percent in 1995–2000) (Figure 2-20). In 2005 the number of deaths from breast cancer is expected to be 40,410.

FIGURE 2-20 Trends in breast cancer incidence, mortality, and survival. Five-year relative survival is reported as an average for diagnosis years 1975–1979 and 1980–1984.
SOURCE: Ries et al. (2005).
Mammography is effective in the early diagnosis of breast cancer, and it is recommended that women age 40 and older have a mammogram every 1 to 2 years (USPSTF, 2002). Most (70 percent) women aged 40 and older reported in 2000 that they had a mammogram in the past 2 years (ACS, 2004b). The widespread use of mammographic screening has resulted in diagnosis at younger ages and with smaller tumors. The 20 to 30 percent decrease in mortality associated with mammographic screening (among women aged 50 and older) has also contributed to the growing population of breast cancer survivors, estimated at 2.3 million as of 2002 (NCI, 2005b). High screening rates have also resulted in more women being diagnosed with DCIS, a type of noninvasive breast cancer of uncertain clinical significance (IOM, 2005). In 2005, an estimated 58,490 women will be diagnosed with DCIS (ACS, 2005a). These women were not counted among the 211,240 cases of invasive breast cancer but, because women with DCIS usually receive the same treatment as women with invasive early breast cancer, the rise in DCIS detection has increased the use of breast-cancer-related services and created a new cohort of women who are worried about their future risk of invasive disease but for whom clear prognostic guidance is lacking.
Lower rates of use of screening among certain groups result in certain women being diagnosed at later stages when treatment is less effective. Rates of mammography use in 2000, for example, was significantly lower among American Indians and Alaskan Natives relative to women who are white (37 percent versus 57 percent, respectively) (ACS, 2004a). This lower rate of screening likely accounts for the relatively low percentage of American Indians and Alaskan Natives diagnosed with localized breast cancer as compared to whites (56 versus 66 percent, respectively) (Figure 2-21).
African-American women, despite having rates of mammography use similar to white women (53 versus 57 percent) and lower incidence rates, have higher rates of breast cancer death (Table 2-2) (ACS, 2005a). This anomaly persists even when adjusting for age, socioeconomic status, and disease stage. Recent research suggests that African-American women are more likely to be diagnosed at a younger age with aggressive breast cancer than are white women (Cross et al., 2002; Porter et al., 2004; Jones et al., 2004; Chlebowski et al., 2005).
African-American women are more likely to have later stage tumors (larger tumors and/or positive lymph nodes), tumors with higher histological and nuclear grades, and genetic characteristics that are associated with a poor outcome. While African-American women have tumors that are more aggressive biologically, socioeconomic status is also consistently associated with poor outcomes and is a better predictor of outcomes than race (Bradley et al., 2002). Breast cancer strikes African-American women at
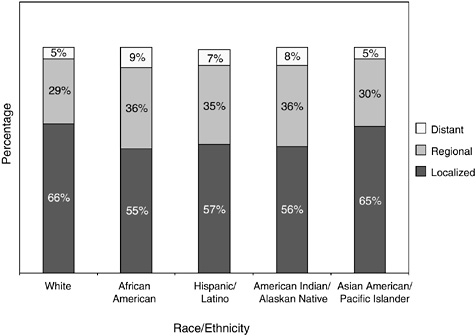
FIGURE 2-21 Percentage distribution of stage at diagnosis of breast cancer, by race and ethnicity, 1996 to 2000. Hispanics/Latinos are not mutually exclusive from whites, African Americans, Asian/Pacific Islander, and American Indians/Alaskan Natives.
SOURCE: ACS (2004a).
TABLE 2-2 Age-Standardized Incidence and Death Ratesa for Breast Cancer (Female) by Race and Ethnicity, U.S., 1997 to 2001
|
Race/Ethnicity |
Incidence |
Mortality |
|
White |
141.7 |
26.4 |
|
African American |
119.9 |
35.4 |
|
Asian/Pacific Islander |
96.8 |
12.6 |
|
American Indian/Alaskan Native |
54.2 |
13.6 |
|
Hispanic/Latinob |
89.6 |
17.3 |
|
aRates are per 100,000 and age-adjusted to the 2000 U.S. standard population. bHispanics/Latinos are not mutually exclusive from whites and other groups shown. SOURCE: ACS (2005a). |
||
younger ages, at a median age of 57 as compared to age 63 for white women (Ries et al., 2004).
Women with newly diagnosed breast cancer tend to be younger than women who are breast cancer survivors. As many as two-thirds (66 percent) of incident cases of breast cancer occur under age 65 and roughly one-third (35 percent) occur before age 55. Given this relatively young age distribution, many of these women would be expected to be working and have responsibilities as mothers with school-age children, caregivers to aging parents, and spouses. In contrast, breast cancer survivors as a group are older with most (55 percent) women being aged 65 and older. This older age distribution of prevalent as compared to incident cases of breast cancer is illustrated in Figure 2-22. With this age distribution, most breast cancer survivors are of retirement age, are likely to be facing other chronic illnesses associated with aging, and are eligible for Medicare health insurance coverage.
Many women with breast cancer have other chronic illnesses at the time of their diagnosis. Such comorbid conditions can affect treatment
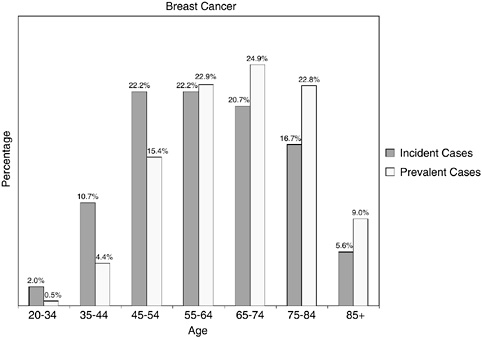
FIGURE 2-22 Age distribution of incident and prevalent cases of breast cancer. Incidence figures are for 1998–2002; prevalence figures are for SEER 2002 and are limited to individuals diagnosed within the past 27 years.
SOURCES: Ries et al. (2005); NCI (2005b).
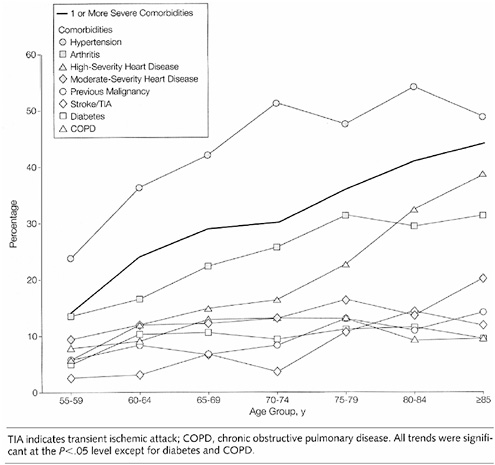
FIGURE 2-23 Prevalence of selected comorbidities among postmenopausal women with breast cancer, by age.
SOURCE: Yancik et al. (2001b).
choices and outcomes. In a population-based sample of 1,800 breast cancer patients diagnosed in 1992, the prevalence of one or more comorbid conditions increased from roughly 15 percent at ages 55 to 59 to more than 40 percent among women aged 85 and older (Figure 2-23) (Yancik et al., 2001b). The most prevalent condition in all age groups was hypertension. Arthritis ranked second or third across all age groups. The proportion of patients with previous cancers increased by age: 11 percent for those aged 55 to 64 years, 14 percent for those aged 65 to 74 years, and 20 percent for patients aged 75 and older.
Prostate Cancer
Prostate cancer is the most common invasive cancer diagnosed among men; in 2005 an estimated 232,090 cases will be diagnosed. One in six men develop prostate cancer in their lifetimes (ACS, 2005a). Between 1988 and 1992, prostate cancer incidence rates increased dramatically; this is probably due to earlier diagnosis through PSA blood testing (Figure 2-24). Prostate cancer incidence rates subsequently declined and have increased at a less rapid rate since 1995. This trend could reflect a decline in true incidence, lower use of PSA testing, or a combination of these factors.
It is recommended that PSA testing be offered annually, beginning at age 50, to men who have a life expectancy of at least 10 years. Men at high risk (African-American men and men with a strong family history of prostate cancer) should begin testing at age 45 (ACS, 2005b). In 2002, an estimated 54 percent of men over age 50 (who did not have prostate cancer) had a PSA test in the past year (ACS, 2004b). Despite its popularity, there is insufficient evidence to recommend for or against early prostate cancer testing using PSA. Definitive answers regarding the value of PSA screening
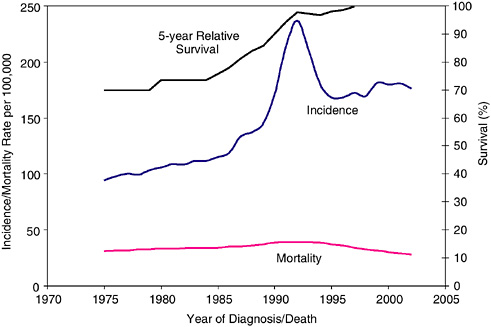
FIGURE 2-24 Trends in prostate cancer incidence, mortality, and survival. Five-year relative survival is reported as an average for diagnosis years 1975–1979 and 1980–1984.
SOURCE: Ries et al. (2005).
TABLE 2-3 Age-Standardized Incidence and Death Ratesa for Prostate Cancer by Race and Ethnicity, U.S., 1997 to 2001
|
Race/Ethnicity |
Incidence |
Mortality |
|
White |
167.4 |
28.8 |
|
African American |
271.3 |
70.4 |
|
Asian/Pacific Islander |
100.7 |
13.0 |
|
American Indian/Alaskan Native |
51.2 |
20.2 |
|
Hispanic/Latinob |
140.0 |
23.5 |
|
aRates are per 100,000 and age-adjusted to the 2000 U.S. standard population. bHispanics/Latinos are not mutually exclusive from whites and other groups shown. SOURCE: ACS (2005a). |
||
from clinical trials may be available by 2008 (Brenner and Arndt, 2005). According to recommendations, men at average or high risk should be given information about the benefits and limitations of testing so they can make informed decisions about testing. Men diagnosed with prostate cancer tend to be better educated, in part because they are more likely to use (and be aware of recommendations for) PSA screening (Steenland et al., 2004).
Prostate cancer death rates declined an average of 4.1 percent per year from 1994 to 2001 (Jemal et al., 2004) (Figure 2-24). The majority of men diagnosed with prostate cancer in the PSA screening era do not have excess mortality compared to the general population under current patterns of medical care (Wilding and Remington, 2005; Brenner and Arndt, 2005). This finding does not suggest that PSA screening is either beneficial or ineffective, but it is reassuring information that can be provided to individuals recently diagnosed with prostate cancer.
With an estimated 30,350 deaths in 2005, prostate cancer is the second leading cause of cancer death in men (after lung cancer) (ACS, 2005a). Although death rates have been declining among white and African-American men since the early 1990s, rates in African-American men remain more than twice as high as rates in white men (Table 2-3). It is unclear what accounts for the marked racial differences in incidence and mortality among men with prostate cancer, but explanations include differences in biological and environmental factors, disparities in treatment, or combinations of these factors (Moul et al., 1996; Horner, 1998; Hsing and Devesa, 2001; Hsieh and Albertsen, 2003). Prostate cancer occurs at
younger ages in African-American men and recommendations are that they begin screening earlier than white men.
Men who are American Indians and Alaskan Natives are much more likely than white men to have their prostate cancer detected at a more advanced stage (12 versus 5 percent) (Figure 2-25). African-American men are somewhat more likely than white men to have advanced disease at diagnosis (7 versus 5 percent).
In one recent study, comorbidity at the time of diagnosis explained some of the increased mortality among African Americans. However, men without any comorbid conditions at the time of diagnosis had higher mortality (Freeman et al., 2004). Investigators speculate that these men may have had more limited contact with the health care system and therefore failed to have their cancer detected at an early stage. Other research has indicated that men with less than a high school education have much lower survival rates from prostate cancer, even after controlling for stage and
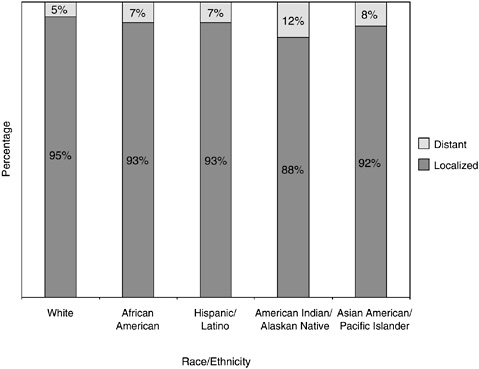
FIGURE 2-25 Stage at prostate cancer diagnosis, by race and ethnicity, U.S., SEER 1996 to 2000.
SOURCE: Ward et al. (2004).
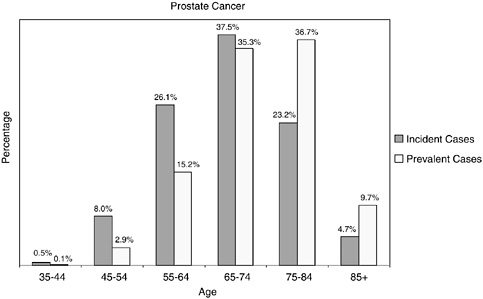
FIGURE 2-26 Age distribution of incident and prevalent cases of prostate cancer. Incidence figures are for 1998–2002; prevalence figures are for SEER 2002 and are limited to individuals diagnosed within the past 27 years.
SOURCES: Ries et al. (2005); NCI (2005b).
grade at diagnosis (Steenland et al., 2004). This finding may reflect disparities in diagnosis and treatment by educational attainment.
One-third of prostate cancer cases are diagnosed in men under the age of 65, but because men tend to live a long time with prostate cancer, the age distribution of prevalent cases is shifted to older ages, and 82 percent of prevalent cases are among men aged 65 and older (Figure 2-26). Issues related to the health care provided to survivors of prostate cancer should be of great concern to the Centers for Medicare and Medicaid Services, as four in five prostate cancer survivors are likely Medicare beneficiaries.
Colorectal Cancer
Colorectal cancer is the third most common invasive cancer overall (ACS, 2005c). There is a 1 in 17 probability for men and a 1 in 18 probability for women to develop colorectal cancer in their lifetimes (ACS, 2005a). In 2005 about 145,290 people will be diagnosed with colorectal cancer and about 56,290 people will die of the disease. Colorectal cancer is the second leading cause of cancer death after lung cancer. The great majority of these cancers and deaths could be prevented by applying existing knowledge
about cancer prevention and by wider use of established screening tests. Although recommendations are for adults aged 50 and older to be screened for colorectal cancer, only 39 percent of people aged 50 or older in the United States have had a fecal occult blood test within the past year or endoscopy (i.e., either sigmoidoscopy or colonoscopy) within the past 5 years. Screening rates are lower among those without health insurance, recent immigrants, people with lower educational attainment, and Hispanics/Latinos (ACS, 2005c). Individuals at higher risk for colorectal cancer include those with a family history of colorectal cancer, those with a history of inflammatory bowel disease, and those with certain lifestyle risk factors (e.g., obesity, cigarette smoking, high alcohol use, physical inactivity).
Mortality rates from colorectal cancer continued to decline in both men and women from 1984 to 2001, at an average of 1.8 and 1.4 percent per year, respectively (Jemal et al., 2004). This decline reflects the decreasing incidence rates since the mid-1980s and improvements in survival. The decreases in incidence may reflect detection and removal of precancerous polyps during endoscopic screening. They may also reflect the increased use of hormone replacement therapy in women and anti-inflammatory drugs, both of which appear to reduce the risk of colorectal cancer.
Colorectal cancer incidence and mortality rates are highest in African-American men and women (Table 2-4). African Americans and American Indians and Alaskan Natives are more likely than whites to be diagnosed after the disease has spread beyond the bowel wall (Figure 2-27). The higher incidence rates, later stages at diagnosis, and higher mortality rates among certain racial and ethnic group members results in their
TABLE 2-4 Age-Standardized Incidence and Death Ratesa for Colorectal Cancer by Race and Ethnicity, U.S., 1997 to 2001
|
Race/Ethnicity |
Incidence |
Mortality |
||
|
Males |
Females |
Males |
Females |
|
|
White |
63.1 |
45.9 |
24.8 |
17.1 |
|
African American |
72.9 |
56.5 |
34.3 |
24.5 |
|
Asian/Pacific Islander |
56.3 |
38.6 |
15.8 |
10.8 |
|
American Indian/Alaskan Native |
38.3 |
32.7 |
17.1 |
11.7 |
|
Hispanic/Latinob |
49.6 |
32.5 |
18.0 |
11.6 |
|
aRates are per 100,000 and age-adjusted to the 2000 U.S. standard population. bHispanics/Latinos are not mutually exclusive from whites and other groups shown. SOURCE: ACS (2005c). |
||||
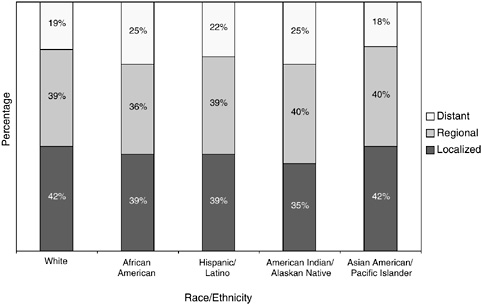
FIGURE 2-27 Stage at colorectal cancer diagnosis, by race and ethnicity, U.S., SEER 1996 to 2000.
SOURCE: Ward et al. (2004).
underrepresentation among cancer survivors. Efforts are needed to improve screening for colorectal cancer within these groups.
As is the case for other cancer sites, prevalent cases of colorectal cancer are more likely than incident cases to be aged 65 and older (76.7 versus 68.1 percent) (Figure 2-28).
Hodgkin’s Disease
In 2005, there will be about 7,350 new cases of Hodgkin’s disease and 1,410 HD deaths in the United States. Epidemiologic evidence suggests that HD results from a complex of related conditions that are in part mediated by infectious diseases, immune deficits, and genetic susceptibilities (Cartwright and Watkins, 2004). Death rates have fallen more than 60 percent since the early 1970s because of better diagnosis and treatment. There are no recommended screening tests for HD. Improvements in treatment have increased the size of the survivorship population, estimated at 145,501 in 2002.
HD is an unusual cancer in that as many as 64 percent of new cases of HD and 60 percent of survivors of HD are under age 45 (Figure 2-29).
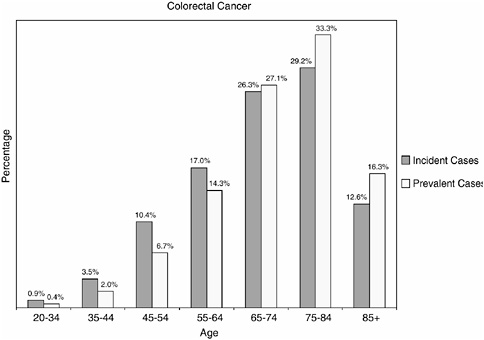
FIGURE 2-28 Age distribution of incident and prevalent cases of colorectal cancer. Incidence figures are for 1998–2002; prevalence figures are for SEER 2002 and are limited to individuals diagnosed within the past 27 years.
SOURCES: Ries et al. (2005); NCI (2005b).
Because HD is a rare cancer, relatively little has been published to describe the sociodemographic characteristics of the HD survivor population.
SUMMARY
It has been 20 years since Fitzhugh Mullan described survivorship as a unique phase of the cancer trajectory and spoke of the need to minimize its medical and social hazards. The concept of survivorship has evolved and to some extent continues to stir controversy. But for many, an accepted definition of cancer survivors includes all of those who are living with a history of cancer. In this report, the committee decided to focus on the phase of survivorship that follows primary treatment and lasts until cancer recurrence or end of life. This period represents largely uncharted territory in terms of evidence-based guidance for providers of survivorship care. The psychosocial issues that arise during this phase have also been relatively unexamined.
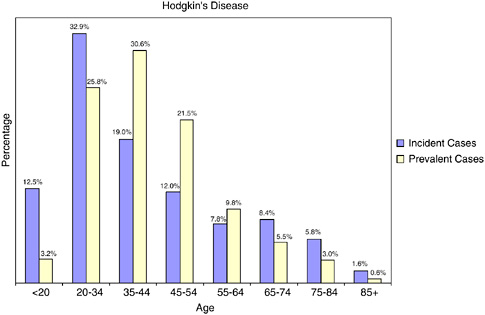
FIGURE 2-29 Age distribution of incident and prevalent cases of Hodgkin’s disease. Incidence figures are for 1998–2002; prevalence figures are for SEER 2002 and are limited to individuals diagnosed within the past 27 years.
SOURCES: Ries et al. (2005); NCI (2005b).
There are about 10 million cancer survivors in the United States, representing 3.5 percent of the population. Prevalence rises steadily with age so that by age 80 to 84, prevalence is 19 percent. Although most cancer survivors are over age 65, more than one-third are young to late-middle-age adults and facing cancer-related concerns regarding reproduction, child rearing, employment, and the care of their aging parents. Factors that will continue to drive the increase in the number of survivors include the aging of the baby boom cohort, increased use of effective cancer screening, and improvements in treatment. Survival has improved as individuals with cancer are increasingly being diagnosed at younger ages with early-stage disease. The probability of long-term survival depends on many factors, including age, type of cancer, stage of illness, and comorbidity, but estimates of “conditional” survival provided to the committee by NCI generally show that cancer patients who have already survived 1 year after diagnosis have a better chance of surviving the next 5 years than the first 5 years after diagnosis.
Cancer survivors are likely to have comorbid illnesses, ADL limitations, and functional limitations. The relatively high prevalence of these
conditions and limitations poses challenges to those providing survivorship care and points to the need for the integrated delivery of chronic health care and rehabilitation services.
Half of cancer survivors in the United States have been diagnosed with cancers of the breast, prostate, colon, and rectum. An examination of the epidemiology of these cancers reveals consistent disparities in incidence, mortality, and survival by race and ethnicity. The sources of the disparities have not been completely explained, but an important reason that African Americans and other members of minority groups are underrepresented among cancer survivors is their relatively poor access to primary health care and effective screening tests and treatments for cancer. To increase the number of long-term, disease-free cancer survivors and ensure that the full cross-section of Americans with cancer live beyond their cancer, efforts are needed to improve access to cancer prevention and health care services.
REFERENCES
ACS (American Cancer Society). 2002. Cancer Facts & Figures, 2002. Atlanta, GA: ACS.
ACS. 2004a. Cancer Facts & Figures 2004. Atlanta, GA: ACS.
ACS. 2004b. Cancer Prevention & Early Detection Facts & Figures 2004. Atlanta, GA: ACS.
ACS. 2005a. Cancer Facts & Figures 2005. Atlanta, GA: ACS.
ACS. 2005b. Can Prostate Cancer Be Found Early? [Online]. Available: http://www.cancer.org/docroot/CRI/content/CRI_2_4_3X_Can_prostate_cancer_be_found_early_36.asp [accessed April 28, 2005].
ACS. 2005c. Colorectal Cancer Facts and Figures Special Edition 2005. Atlanta, GA: ACS.
Bradley CJ, Given CW, Roberts C. 2002. Race, socioeconomic status, and breast cancer treatment and survival. J Natl Cancer Inst 94(7):490–496.
Brenner H, Arndt V. 2005. Long-term survival rates of patients with prostate cancer in the prostate-specific antigen screening era: Population-based estimates for the year 2000 by period analysis. J Clin Oncol 23(3):441–447.
Capocaccia R, De Angelis R. 1997. Estimating the completeness of prevalence based on cancer registry data. Stat Med 16(4):425–440.
Cartwright RA, Watkins G. 2004. Epidemiology of Hodgkin’s disease: A review. Hematol Oncol 22(1):11–26.
Cheeseman Day J (U.S. Census Bureau). 2001. National Population Projections. [Online]. Available: http://www.census.gov/population/www/pop-profile/natproj.html [accessed August 4, 2004].
Chlebowski RT, Chen Z, Anderson GL, Rohan T, Aragaki A, Lane D, Dolan NC, Paskett ED, McTiernan A, Hubbell FA, Adams-Campbell LL, Prentice R. 2005. Ethnicity and breast cancer: Factors influencing differences in incidence and outcome. J Natl Cancer Inst 97(6):439–448.
Cross CK, Harris J, Recht A. 2002. Race, socioeconomic status, and breast carcinoma in the U.S: What have we learned from clinical studies? Cancer 95(9):1988–1999.
Edwards BK, Howe HL, Ries LA, Thun MJ, Rosenberg HM, Yancik R, Wingo PA, Jemal A, Feigal EG. 2002. Annual report to the nation on the status of cancer, 1973–1999, featuring implications of age and aging on U.S. cancer burden. Cancer 94(10):2766–2792.
Freeman HP. 2003. Commentary on the meaning of race in science and society. Cancer Epidemiol Biomarkers Prev 12(3):232s–236s.
Freeman VL, Durazo-Arvizu R, Keys LC, Johnson MP, Schafernak K, Patel VK. 2004. Racial differences in survival among men with prostate cancer and comorbidity at time of diagnosis. Am J Public Health 94(5):803–808.
Grieco EM, Cassidy RC. 2001. Overview of Race and Hispanic Origin: Census 2000 Brief. Washington, DC: U.S. Census Bureau.
Henson DE, Ries LA, Carriaga MT. 1995. Conditional survival of 56,268 patients with breast cancer. Cancer 76(2):237–242.
Hewitt M, Rowland JH, Yancik R. 2003. Cancer survivors in the United States: Age, health, and disability. J Gerontol A Biol Sci Med Sci 58(1):82–91.
Horner RD. 1998. Racial variation in cancer care: A case study of prostate cancer. Cancer Treat Res 97:99–114.
Hsieh K, Albertsen PC. 2003. Populations at high risk for prostate cancer. Urol Clin North Am 30(4):669–676.
Hsing AW, Devesa SS. 2001. Trends and patterns of prostate cancer: What do they suggest? Epidemiol Rev 23(1):3–13.
Ingram DD, Parker JD, Schenker N, Weed JA, Hamilton B, Arias E, Madans JH. 2003. United States Census 2000 Population With Bridged Race Categories. Vital Health Stat 2(135). Hyattsville, MD: National Center for Health Statistics, Centers for Disease Control and Prevention.
IOM (Institute of Medicine). 2003. Unequal Treatment: Confronting Racial and Ethnic Disparities in Health Care. Washington, DC: The National Academies Press.
IOM. 2005. Saving Women’s Lives: Strategies for Improving Breast Cancer Detection and Diagnosis. Joy JE, Penhoet EE, Petitti DB, eds. Washington, DC: The National Academies Press.
Jemal A, Clegg LX, Ward E, Ries LA, Wu X, Jamison PM, Wingo PA, Howe HL, Anderson RN, Edwards BK. 2004. Annual report to the nation on the status of cancer, 1975–2001, with a special feature regarding survival. Cancer 101(1):3–27.
Jemal A, Murray T, Ward E, Samuels A, Tiwari RC, Ghafoor A, Feuer EJ, Thun MJ. 2005. Cancer statistics, 2005. CA Cancer J Clin 55(1):10–30.
Jones BA, Kasl SV, Howe CL, Lachman M, Dubrow R, Curnen MM, Soler-Vila H, Beeghly A, Duan F, Owens P. 2004. African-American/white differences in breast carcinoma: p53 alterations and other tumor characteristics. Cancer 101(6):1293–1301.
Krishnan KR, Delong M, Kraemer H, Carney R, Spiegel D, Gordon C, McDonald W, Dew M, Alexopoulos G, Buckwalter K, Cohen PD, Evans D, Kaufmann PG, Olin J, Otey E, Wainscott C. 2002. Comorbidity of depression with other medical diseases in the elderly. Biol Psychiatry 52(6):559–588.
Leigh S. 2004. Cancer survivorship: Defining our destiny. In: Hoffman B, ed. A Cancer Survivor’s Almanac. 3rd ed. Hoboken, NJ: John Wiley & Sons.
Marcus AD. 2004, March 24. Debate heats up on defining a cancer survivor. Wall Street Journal. P. D4.
Mausner JS, Kramer S. 1985. Epidemiology—An Introductory Text. 2nd ed. Philadelphia, PA: W.B. Saunders.
McNeil JM, Binette J. 2001. Prevalence of disabilities and associated health conditions among adults—United States, 1999. MMWR 50(7):120–125.
Merrill RM, Capocaccia R, Feuer EJ, Mariotto A. 2000. Cancer prevalence estimates based on tumour registry data in the Surveillance, Epidemiology, and End Results (SEER) Program. Int J Epidemiol 29(2):197–207.
Merrill RM, Henson DE, Ries LA. 1998. Conditional survival estimates in 34,963 patients with invasive carcinoma of the colon. Dis Colon Rectum 41(9):1097–1106.
Moul JW, Douglas TH, McCarthy WF, McLeod DG. 1996. Black race is an adverse prognostic factor for prostate cancer recurrence following radical prostatectomy in an equal access health care setting. J Urol 155(5):1667–1673.
Mullan F. 1985. Seasons of survival: Reflections of a physician with cancer. New England Journal of Medicine 313(4):270–273.
NCCS (National Coalition for Cancer Survivorship). 1996. Imperatives for Quality Cancer Care: Access, Advocacy, Action, and Accountability. Clark EJ, Stovall EL, Leigh S, Siu AL, Austin DK, Rowland JH. Silver Spring, MD: NCCS.
NCI (National Cancer Institute). 2004a. About SEER. [Online]. Available: http://seer.cancer.gov/about/ [accessed December 13, 2004].
NCI. 2004b. About Survivorship Research: Survivorship Definitions. [Online]. Available: http://dccps.nci.nih.gov/ocs/definitions.html [accessed April 9, 2004].
NCI. 2004c. Cancer Progress Report—2003 Update. [Online]. Available: http://progressreport.cancer.gov/index.asp [accessed May 31, 2004].
NCI. 2004d. Relative Survival. [Online]. Available: http://seer.cancer.gov/seerstat/WebHelp/Relative_Survival.htm [accessed May 10, 2004].
NCI. 2005a. Cancer Control Continuum. [Online]. Available: http://cancercontrol.cancer.gov/od/continuum.html [accessed April 19, 2005].
NCI. 2005b. Cancer Query System: Cancer Prevalence Database. [Online]. Available: http://srab.cancer.gov/prevalence/canques.html [accessed June 2, 2005].
NCI. 2005c. Estimated U.S. Cancer Prevalence. [Online]. Available: http://cancercontrol.cancer.gov/ocs/prevalence/prevalence.html [accessed May 31, 2005].
Ostir GV, Carlson JE, Black SA, Rudkin L, Goodwin JS, Markides KS. 1999. Disability in older adults. Prevalence, causes, and consequences. Behav Med 24(4):147–156.
Piccirillo JF, Tierney RM, Costas I, Grove L, Spitznagel EL Jr. 2004. Prognostic importance of comorbidity in a hospital-based cancer registry. JAMA 291(20):2441–2447.
Porter PL, Lund MJ, Lin MG, Yuan X, Liff JM, Flagg EW, Coates RJ, Eley JW. 2004. Racial differences in the expression of cell cycle-regulatory proteins in breast carcinoma. Cancer 100(12):2533–2542.
President’s Cancer Panel. 2004a. Living Beyond Cancer: A European Dialogue. Bethesda, MD: National Cancer Institute.
President’s Cancer Panel. 2004b. Living Beyond Cancer: Finding a New Balance. Bethesda, MD: National Cancer Institute.
Ries LAG, Eisner MP, Kosary CL, Hankey BF, Miller BA, Clegg L, Mariotto A, Feuer EJ, Edwards BK, eds. 2004. SEER Cancer Statistics Review, 1975–2001. Bethesda, MD: National Cancer Institute. [Online]. Available: http://seer.cancer.gov/csr/1975_2001/ [accessed April 29, 2004].
Ries LAG, Eisner MP, Kosary CL, Hankey BF, Miller BA, Clegg L, Mariotto A, Feuer EJ, Edwards BK, eds. 2005. SEER Cancer Statistics Review, 1975–2002. Bethesda, MD: National Cancer Institute. [Online]. Available: http://seer.cancer.gov/csr/1975_2002/, based on November 2004 SEER data submission [accessed June 7, 2005].
Rowland J, Mariotto A, Aziz N, Tesauro G, Feuer EJ, Blackman D, Thompson P, Pollock LA. 2004. Cancer survivorship—United States, 1971–2001. MMWR 53(24):526–529.
Shavers VL, Brown ML. 2002. Racial and ethnic disparities in the receipt of cancer treatment. J Natl Cancer Inst 94(5):334–357.
Singh GK, Miller BA, Hankey BF, Edwards BK. 2003. Area Socioeconomic Variations in U.S. Cancer Incidence, Mortality, Stage, Treatment, and Survival, 1975–1999. NCI Cancer Surveillance Monograph Series, No. 4. Bethesda, MD: National Cancer Institute.
Steenland K, Rodriguez C, Mondul A, Calle EE, Thun M. 2004. Prostate cancer incidence and survival in relation to education (United States). Cancer Causes Control 15(9):939–945.
USPSTF (United States Preventive Services Task Force). 2002. Screening for Breast Cancer. [Online]. Available: http://www.ahrq.gov/clinic/uspstf/uspsbrca.htm [accessed April 13, 2005].
Ward E, Jemal A, Cokkinides V, Singh GK, Cardinez C, Ghafoor A, Thun M. 2004. Cancer disparities by race/ethnicity and socioeconomic status. CA Cancer J Clin 54(2):78–93.
Washington University School of Medicine. 2004. Comorbidity Coding Course. [Online]. Available: http://cancercomorbidity.wustl.edu [accessed September 13, 2004].
Welch HG, Schwartz LM, Woloshin S. 2000a. Are increasing 5-year survival rates evidence of success against cancer? JAMA 283(22):2975–2978.
Welch HG, Schwartz LM, Woloshin S. 2000b. Do increased 5-year survival rates in prostate cancer indicate better outcomes? JAMA 284(16):2053–2055.
Welch-McCaffrey D, Hoffman B, Leigh SA, Loescher LJ, Meyskens FL Jr. 1989. Surviving adult cancers. Part 2: Psychosocial implications. Ann Intern Med 111(6):517–524.
Wilding G, Remington P. 2005. Period analysis of prostate cancer survival. J Clin Oncol 23(3):407–409.
Yancik R. 1997. Epidemiology of cancer in the elderly. Current status and projections for the future. Rays 22(1 Suppl):3–9.
Yancik R, Ganz PA, Varricchio CG, Conley B. 2001a. Perspectives on comorbidity and cancer in older patients: Approaches to expand the knowledge base. J Clin Oncol 19(4):1147–1151.
Yancik R, Wesley MN, Ries LA, Havlik RJ, Edwards BK, Yates JW. 2001b. Effect of age and comorbidity in postmenopausal breast cancer patients aged 55 years and older. JAMA 285(7):885–892.
Yates JW. 2001. Comorbidity considerations in geriatric oncology research. CA Cancer J Clin 51(6):329–336.


