
Chapter 2
The Shared Vision Model
This chapter discusses the Shared Vision Model that includes a planning process, a simulation model, and a suite of associated models. The first section of the chapter introduces the Shared Vision approach including its planning framework and modeling efforts. The second section of the chapter evaluates the Shared Vision Model, beginning with its scientific qualities, followed by its integration and display of key information, and its overall sufficiency for informing decision-making. Documents provided for this review included:
-
SVM 1 – Evaluation Process Overview – a two-page broad description of the Shared Vision Model;
-
SVM 2 – Shared Vision Model for the Design and Evaluation of Alternative Regulation of Lake Ontario Releases into the St. Lawrence River – this document includes the “Toronto Board Room April 24.xls” spreadsheet file and 83 linked files. The linked files include:
-
Contextual Narratives that describe scenarios of economic impacts on commercial navigation, environmental effects, recreational boating and tourism, land use along the Lower Saint Lawrence River, and hydropower;
-
Regulation Plan descriptions; and
-
Approximately 70 Performance Indicator fact sheets;
-
SVM 3 – SVM Documentation Report – a six-page description of the structure of the model.
The contextual narratives were provided as background rather than for review, along with a document on “Preliminary Criteria and Metrics for the Plan Formulation and Evaluation Group” and an “Informal Decision Tool Program,” a spreadsheet file that provides an example of multi-attribute decision analysis. Staff members of the LOSLR Study made slide presentations and engaged in a three-hour question and answer period on the Shared Vision Model.
Shared Vision Planning and Modeling in the LOSLR Study
The LOSLR Study Board describes the Shared Vision Model (SVM) as “a unified computer simulation of the system” (SVM 1, p. 1; Werick, 2005). Its purpose is to evaluate previously formulated plans and alternative regulation plans as they are formulated. It is designed to be used by technical experts and stakeholders in a collaborative planning process for which its advocates have coined the term
“Shared Vision Planning.” An article reproduced on the U.S. Army Corps of Engineers’ Institute for Water Resources website describes shared vision planning as:
…deliberative, inclusive decision-making processes as the forum in which to debate how water resources will be used among competing ends. What is unique about shared vision planning, however, is how analytical technical expertise and analysis is integrated into a collaborative planning process. Through a structured planning process, an analytical computer model of the water resource system, called a shared vision model, is constructed with the participation of stakeholders. The shared vision model is designed to be used by stakeholders themselves to develop a mutually satisfactory water supply plan… (Stephenson, 2003, p. 1)
The U.S. Army Corps of Engineers introduced this approach to shared vision planning in its 1995 National Study of Water Management During Drought (IWR, 1995). The approach consists of three elements: (1) a structured planning process, similar to that described in the Economic and Environmental Principles and Guidelines for Planning Water and Related Land Resources (U.S. Water Resource Council, 1983) that states objectives and identifies problems and opportunities; formulates and evaluates alternatives; and displays effects of each alternative on each of the stated objectives; (2) a collaborative, negotiation process involving stakeholders; and (3) use of scientific and technical information through the use of computer models that accounts for the complex linkages among various elements of the water resource system under investigation (Stephenson, 2003). This last element of Shared Vision Planning is the Shared Vision Model.
The LOSLR Plan of Study is the official document that authorizes and defines the scope of the study (BACK 2). It was prepared by the IJC and approved by the two governments. The Plan of Study contains directives that are consistent with the three elements of a structured planning process, stakeholder collaboration, and computer simulation models described by Stephenson (2003). The Plan of Study mandated the use of a multiple-criteria rational planning model, similar to the one in the Principles and Guidelines, which guides water resource planning by federal agencies in the United States (U.S. Water Resources Council, 1983). The Plan of Study directed the LOSLR Study to investigate existing criteria within the IJC’s Orders of Approval, and to determine the requirements for establishing new criteria for improved operation of the Lake Ontario-St. Lawrence River system. Existing criteria were primarily related to economic effects and functional requirements, particularly of hydropower, commercial navigation, and flooding. In referencing the 1996 Scope of Work, the Plan of Study emphasizes the need to consider wetlands, other environmental factors, and recreational boating interests, which had not been addressed in the original regulation plan. The LOSLR Plan of Study called for formulation of alternative regulation plans and evaluation of them with respect to multiple criteria, including both existing and new criteria that may be added. These directives comprise a structured planning process, which is the first element of the shared vision approach.
The Plan of Study mandated the formulation and evaluation of regulation plans
using a collaborative, negotiation process involving a wide range of stakeholders. This process is the second element of the shared vision approach, it provided for creation of the LOSLR Study Board and assigned the Study Board overall responsibility for the Study. The Study Board’s 14 members, half from the U.S. and half from Canada, are predominantly government personnel, academics, other technical experts, and Native peoples. The Study Board was further authorized to establish bi-national work groups to support its work. The Plan of Study (BACK 2, p. 13) emphasized that:
Public consultation is critical to the assessment of plan criteria. It is recognized that progress in addressing water levels issues is dependent in large part on public understanding that most proposed solutions could have consequences for others. To achieve this understanding, it is recommended that the major interests and the relevant public be involved directly in the studies, by the formation of an Interest Advisory Group… The continuous involvement of all interests throughout the criteria review process is critical to the success of the study.
The Plan of Study (BACK 2, p. 76) also directed that computer simulation models would be used, i.e., the third element of Shared Vision Planning. It stated:
The evaluation of Lake Ontario regulation plans, the practicality of proposed criteria, and the hydrologic impacts on the interests, require computer simulation of water levels and flows of the Great Lakes–St. Lawrence River system downstream as far as Trois-Rivères, Quebec. …While separate computer models exist for different parts of the system, and substantial progress has been made in the development of a coordinated routing and regulation model for the upper lakes, additional work is required to develop and integrate Lake Ontario regulation plan(s) and St. Lawrence River components into the model to simulate water levels and flows of the entire system (including the Ottawa River and other tributaries).
The Plan of Study even specified the time step for the simulation: because Lake Ontario outflows are regulated on a weekly basis, the computer simulation would use a quarter-month time-step. In this specification is the recognition that effects dependent upon shorter time periods would not be captured by models using the quarter-month time-step. Therefore, the Plan of Study called for development of a supplemental, two-dimensional hydrodynamic model for the St. Lawrence River upstream of Cornwall-Massena from near Kingston to the Moses-Saunders dam to simulate short-term effects on commercial navigation, recreational boating, environmental questions, hydropower, and ice formation.
The Shared Vision Planning approach has been used in other venues prior to its use in the LOSLR basin, including the following large-scale studies : (1) Reservoir Operating Plan Evaluation (ROPE) Study for the Mississippi Headwaters (Cardwell et al., 2004); (2) the Rappahannock River Basin Commission Water Supply Planning Project
(Connor et al., 2004; Werick, 2000); (3) the Interstate Commission on the Potomac River Basin (ICPRB) Water Supply (Hagen and Kiang, 2003); and (4) the Alabama-Coosa-Tallapoosa-Apalachicola-Chattahoochee-Flint (ACT-ACF) River Basins (Palmer, 1998). These examples represent a subset of a much larger literature on adaptive water resources management that has relevance for this study (e.g., NRC, 2004).
The LOSLR Study is commended for building upon this shared vision planning approach, and for addressing the three criteria described by Stephenson (2003). The LOSLR Study attempts to integrate these criteria in an innovative water resources planning process in the Lake Ontario-St. Lawrence River basin. Although integrated water resources planning is increasing in scope and application (e.g., NRC, 2004), the norm is still for scientific and technical analyses to be conducted separately from one another and from various facets of public decision-making processes and for models to lack transparency. These issues will be discussed further in relation to the Shared Vision Model, which is introduced below.
Shared Vision Modeling
As noted earlier, the LOSLR Study uses the term Shared Vision Model to describe a (1) planning process, (2) suite of sub-models, and (3) core simulation model. This section describes the computer modeling. The structure of the SVM consists of the suite of models shown in Figure 2-1 and described in general terms in the LOSLR Documentation Report (SVM 3).
The heart of the SVM is a computer model (the “STELLA” model in Figure 2.1) that simulates behavior of the Lake Ontario-St. Lawrence River system to Batiscan, downstream of Montreal, for any given regulation plan and time series of inflows. The STELLA model gets its name from the fact that it was written in the STELLA computer language. A simplified flow diagram of the simulation model as the committee understood it is shown in Figure 2-2.
The decision or control variables in the model are given in a Plan of Regulation that governs releases to be made from Lake Ontario through the Moses-Saunders Dam under various system inflow conditions. That time series of releases from the dam is then used to route a time series of quarter-month system inflows through a water balance model for the Lake; the outputs are a time series of lake and river levels. Downstream tributary flows are added to the dam releases at points of confluence to calculate time series of river flows and stages at various locations.
Flows are used within the STELLA model to calculate lake elevations, power, and navigation benefits, which are forwarded to three other programs that evaluate impacts on coastal, environmental, and recreation systems. Results from all four models are then presented in a “Board Room” spreadsheet.
The Shared Vision Model also includes several research components that supported development of the simulation model and related calculations of economic and environmental effects. Hydrologic and hydraulic (H&H) research activities
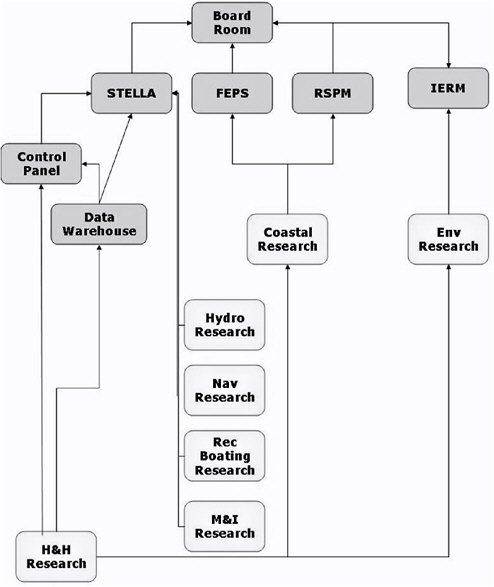
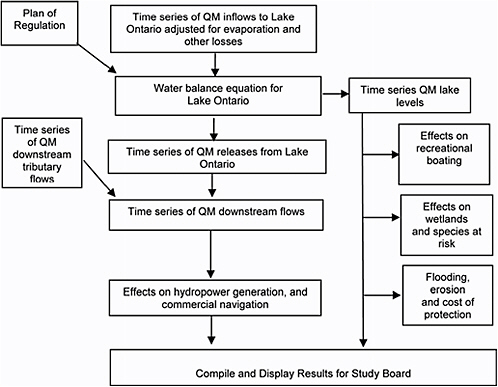
FIGURE 2-2 Committee interpretation of the Shared Vision Model.
produced time series of quarter-month system inflows adjusted to account for lake evaporation and other losses. Time series were generated for historical conditions, for historical conditions adjusted for climate change, and for stochastic series intended to represent probabilistically a wide range of possible future conditions. The hydrology and hydraulic research also produced estimates of ice and channel roughness and changes in temperature that may result from alternative plans. The Committee received a report on Lake Erie outflows (Fan and Fay, 2003) but did not receive other documentation of the time series of inflows to Lake Ontario used in the LOSLR study, and was not charged to review the hydrologic and hydraulic work.
Research was also undertaken to establish relationships between water levels and flows and important effects of regulation, namely municipal and industrial water supply (M&I), recreational boating (Rec Boating), the environment (Env), commercial navigation (Nav), coastal flooding and erosion (Coastal), and hydropower production (Hydro). The relationships established through these research activities were used to build three sub-models. One is the Flooding and Erosion Prediction System (FEPS), used to predict flooding and erosion along the coasts of Lake Ontario and the river above the regulating dam. FEPS takes a time series of
lake levels from the STELLA model (passed through the Board Room) to calculate a time series of (1) erosion of developed land that has no shoreline protection, (2) costs of maintenance and repair to land that has coastal shore protection structures, and (3) flood damages. A second sub-model, the River Shore Protection Model (RSPM), calculates impacts and costs of erosion of existing shore protection below the Moses-Saunders dam. The third sub-model, the Integrated Ecological Response Model (IERM), uses relationships established in the environmental research program to estimate a large number of environmental performance indicators resulting from a given regulation plan and a given time series of lake levels. FEPS and IERM are reviewed in chapters 3 and 4, respectively; the RSPM was not subject to this review.
The Board Room is a spreadsheet file. It takes the simulated time series of hydrologic attributes from the STELLA model and sends them to the FEPS, RSPM, and IERM models to estimate effects on performance indicators. It then receives results from those sub-models, and prepares statistical summaries as “…requested by decision makers and stakeholders, including average annual, worst case, persistence of bad performance, etc.” (SVM 3, p. 2). The Data Warehouse stores alternative time series of inflows for use in the SVM. The Control Panel is described as “…a spreadsheet file that helps the SVM user design new regulation plans…” (ibid, 4). It also provides the user with options from which to select a time series of inflows stored in the Data Warehouse as an input to the SVM. The Data Warehouse and Control Panel were not included in this review.
Brief Description of Regulation Plan Options
The primary purpose of the LOSLR study is to formulate regulation plan options for the releases from Lake Ontario and the upper St. Lawrence River through the Moses-Saunders dam. The Board Room includes information on seven plans formulated and evaluated in detail. Brief descriptions of the plans included in the Board Room are:
-
Plan 1958 D – the plan that went into operation in October of 1963;
-
Plan 1958 D with Deviations (Plan 1958DD) – Plan 1958D with deviations that the Control Board has been using in recent years to cope with outcomes it considered to be unacceptable;
-
Plan A (also known as Cornell V) – described by the Study Board as “the balanced economic plan,” (Available on-line at http://www.losl.org/PDF/17062005_NewsR-EN.pdf. Accessed August 7, 2005).
-
Plan B (also known as NaturalLy) – described by the Study Board as, “the balanced environmental plan” (Available on-line at http://www.losl.org/PDF/17062005_NewsR-EN.pdf. Accessed August 7, 2005).
-
Plan D – described by the LOSLR Study Board as, “the blended benefits plan” (Available on-line at http://www.losl.org/PDF/17062005_NewsR-EN.pdf. Accessed August 7, 2005).
-
Plan E – The Pre-project Plan with Ice Limits incorporates historic pre-project winter ice retardation effects on pre-project flow.
-
Plan 1998 – versions of the plan proposed in 1998 that was rejected by the IJC.
Outcomes from the current “Plan 1958 D with Deviations” (or Plan 1958DD) were used as a baseline against which other plans were compared. Although this review does not comment on the specific regulation plan options listed above, it does note here and discuss below that the plan formulation process appears to have focused on specifying release criteria to accommodate future hydroclimatic scenarios under current economic and environmental conditions. Plan formulation does not appear to have focused on provisions for monitoring, testing, evaluating, and, if necessary, adapting plans and criteria to changing conditions and priorities.
EVALUATION OF THE SVM OVERALL FINDINGS AND ACCOMPLISHMENTS
The overall strength of the SVM is its ability to support multi-stakeholder decision-making with data-driven comparisons of tradeoffs among the economic, environmental, and social effects of regulation plan options. The inter-disciplinary scope of inquiry of the SVM and its inclusive approach will likely serve as an important case study for other large-scale, multi-interest, water resources planning projects. These SVM strengths, however, are undercut by the poor model documentation that leaves unanswered many questions of the rationale behind unexpected modeling choices, methodology, treatment of model error and uncertainty, and whether the SVM in fact is integrating scientific and economic components in a technically and scientifically sound manner. A more detailed evaluation of the SVM follows that corresponds with the three charges in the statement of task: scientific foundations, integration and display of key information, and overall appropriateness and sufficiency of the SVM to inform regulation plan decision-making.
EVALUATION OF SCIENTIFIC METHODS, ASSUMPTIONS, AND SUPPORTED FINDINGS
Charge A of the statement of task focuses on the extent to which the studies and models reflect reasonable scientific methods, assumptions, and supported findings. Three evaluation criteria are used to assay the scientific foundations of the SVM: empirical foundations, quality assurance, and treatment of risk and uncertainty.
Criterion 1: Empirical Foundations
The primary purpose of the SVM is to convey how changes in lake level and river flow will impact a variety of other dependent conditions in the LOSLR system (e.g., wetlands, recreational boating, flood damages to property, etc.). To fulfill this purpose, the SVM is designed to draw from several empirical bases, the majority of which are either not subject to this NRC review or are reviewed in subsequent chapters of this report. Therefore, this section focuses on three specific empirical issues: lake level calculations, use of regression analysis for modeling the St. Lawrence system, and assumptions about related processes and trends within the STELLA model.
Single Lake Level Calculation
Water levels and flows in the LOSLR system are generated using hydrologic time series input from a limited number of points in the lake and the river. The input flows used by the SVM were generated from (1) historical records adjusted for current diversions, (2) historical flows adjusted for climate change, and (3) stochastic flow series intended to probabilistically represent a wide range of possible future conditions. Most input flow evaluations were based on 101 years of record (4,848 quarter-months). A stochastic sequence of flow for 50,000 years was generated and, from that sequence, 101-year records of very wet and very dry centuries were selected to evaluate plan performance under extreme conditions. IJC documents do not discuss how flow sequences were generated or why 101 years was chosen as the length of record. Stochastic time series would normally include multiple realizations that can be used to generate probabilistic model outputs, but documentation did not indicate that multiple realizations were used in the LOSLR application.
The STELLA model produces a single water elevation value for Lake Ontario for each quarter-month time period. This STELLA model value must be accurate for the SVM to function reliably because it is used in other models as input for wetlands, fauna, erosion, and bathymetric calculations. One problem in using a single value in the quarter-month time step is that Lake levels can be more dynamic than this value can capture. For example, the average change in water elevation of Lake Ontario may be as much as 20 cm in one week (http://www.glerl.noaa.gov/data/now/wlevels/levels.html). This large range in water elevation values is nontrivial because erosion and ecological models use the average values to calculate coastal and environmental responses, respectively. Although some of the sub-models generate variable water level conditions from the average values, any inaccuracies in the average water level values would propagate through the erosion and ecological model outputs and the SVM. It is therefore surprising that the SVM documents do not report on how the accuracy of average water level values is determined, or how sensitive the other models are to the accuracy of this value.
The problems of relying on a single water elevation value for Lake Ontario can be summarized in three points. First, water level data are available at multiple locations on Lake Ontario and at a finer time step than quarter-month period. The decision to calculate a single model output for a larger area and longer time period needs better justification. Second, the coastal and environmental models use these less precise single value quarter-monthly outputs to calculate finer-scale water level and wave processes in different areas of Lake Ontario and the Upper St. Lawrence River. Third, those finer-scale hydrologic scenarios are subsequently used to calculate a chain of environmental, coastal, and economic impacts. Thus, the decision to use a single lake-wide water level value needs fuller explanation and an analysis of the accuracy of a single water level value in the SVM and submodels.
Use of Regression for Modeling the St. Lawrence System
The STELLA model calculates river water levels and flows at a limited number of points based on regression equations (Fan and Fay, 2001, 2002, 2003). Regression analysis is straightforward and inexpensive, which may be the reasons it was chosen for use in the LOSLR work.
Several questions remain unanswered with respect to regression analysis in the SVM. First, why were regression analyses used to a greater extent than conventional hydraulic models? Given that hydraulic models are empirically feasible, and were recommended in the Plan of Study (BACK 2), it is unclear why the SVM relied more heavily on a different and less accurate water level calculation method. Second, how were the regression analyses developed, and how accurate were the results? Regression is a common statistical tool that is described by standard statistical descriptors, such as r2 and confidence intervals. These descriptors are not included in the SVM documents, and no measures of accuracy or reliability are presented to support the regression analysis approach. Without proper documentation of the development and accuracy of the regression analyses, and the relationships between the STELLA model and the hydrodynamic modeling, it is not possible to render a judgment about the adequacy or accuracy of the regression approach. In fact, regression could lead to inaccurate results, which spurs concerns about the use and application of regression analyses in the Shared Vision Model. The ways that lake and river hydraulics models and regression analysis were used with the SVM need additional justification to defend their selection and application.
Assumptions about Related Processes and Trends within the STELLA Model
The SVM has the ability to support multi-stakeholder decision-making using tradeoffs among economic, environmental and social effects of water level regulation. However, the reviewed documents suggest that related socioeconomic trends
and their possible feedback on system operation were not incorporated into the SVM. For example, population, land uses along the coastline, and demands for commercial navigation and recreational boating were specified externally. For the most part, values for these variables were fixed at current levels such that it is not possible to determine the effects of water level and flow regulation on these processes. Also omitted from the SVM analysis are the impacts of changes in externally specified water demands and land uses on the economic and environmental performance indicators modeled under alternative regulation plans. These deficiencies in socioeconomic analysis, forecasting, and scenario construction limit the long-term utility of the SVM, and the influence of dynamic socioeconomic factors on modeled output variables must be treated more fully.
Criterion 2: Quality Assurance and Quality Control
Model verification and sensitivity analysis are commonly used to compute and report model accuracy. Sensitivity analysis determines model parameter effects on model results and assesses model uncertainty, but sensitivity analyses of the SVM were not presented in the review documents. IJC documentation (SVM 3) states that validation and verification of the SVM involve a system of internal, self-assessments by the Technical Working Groups responsible for the development of each sub-model. Questions in these self-assessments included the following (SVM 3, p. 5):
-
“Is the underlying research trustworthy?”
-
“Is this the information you [stakeholders] were looking for?”
-
“Is this information being interpreted correctly?”
-
“Is a 101 year average a misleading metric?”
Although these questions are important, they indicate a different approach to validation, and it is unstated as to why these types of questions were used in lieu of traditional model validation, verification, and sensitivity analyses that would quantify inaccuracies due to underlying computational components, incorrect model choice, inappropriate approximations, or poor parameter estimation. Expanding the validation process to include these types of more traditional methods of model verification would yield greater levels of confidence in the SVM and its sub-models. To give the highest confidence that the SVM and its sub-models are accurate and perform as designed to meet model expectations, traditional validation and verification methods should be employed and the results should be presented for formal external peer-review.
Criterion 3: Treatment of Error and Uncertainty
Treatment of uncertainty in the SVM raised questions similar to the treatment
of model validation (Criterion 2). Overall, uncertainty aspects of modeling have not received adequate attention; a consistent approach is needed to deal with various aspects of uncertainty but is not presented in the SVM materials. An exception to this overall finding is the sound approach found in the Cornell V modeling procedure. In this procedure uncertainty about future inflows was accounted for by dividing historic inflow sequences into five categories from very dry to very wet (SVM 2, 2005). Probabilities were assigned to each category based on relative frequencies in the historic record. That process was repeated for each initial lake level and each future flow sequence. Results are used to find the release that minimizes the expected deviation of performance indicators from established targets and limits and are attempts to account for random uncertainties that affect water supply by including synthetic input data, e.g., “stochastic” and “climate change” series, in the analysis.
The SVM works via input/output connections among environmental, engineering, economic, and scientific data and models. These connections provide an opportunity to track error and uncertainty throughout the entire SVM structure (Figure 2-1). However, the SVM model and sub-models have been run deterministically and have not analyzed errors and uncertainty propagated through the modeling system to the outputs used to compare regulatory plans. The SVM Board Room displays scatter plots for some variables, and it has links for contextual narratives that address uncertainty in qualitative terms, but it lacks a comprehensive framework to assess uncertainty among its interacting models. The LOSLR Study should inform decision-makers about the ways that uncertainties were, and were not, addressed in the Shared Vision Model, and provide a detailed discussion of their relevance for decision-making.
Summary of Scientific Methods, Assumptions, and Supported Findings
In summary, the scientific foundations of the SVM present questions that will need to be addressed before determining whether the SVM is scientifically sound. Some of these questions can be addressed through more thorough documentation. Others require more substantial work to strengthen the scientific basis for using the SVM results in decision-making. Specific recommendations to improve the scientific foundations of the SVM include the following:
-
Hydrologic time flow series need better documentation as to how they were composed
-
The decision to use the quarter-month time step needs more thorough explanation, examination of its use and interpolation in environmental and economic models, and better defense of its accuracy
-
The influence of socio-economic factors on output variables of interest to the stakeholders needs to be considered more fully
-
Standard practices for model calibration, validation, and sensitivity analy-
-
sis must be implemented in the SVM system with better documentation and clearer explanation
-
A process is needed to treat uncertainty in ways consistent with standards of modeling practice.
INTEGRATION AND DISPLAY OF KEY INFORMATION
The second charge in the statement of task probes how well the SVM studies and models integrate and present key information for use in the regulation plan decision-making process. Display and integration of information in the SVM were evaluated using these criteria: (1) linkages and feedbacks among related studies, sub-models, and external factors, (2) resolution of spatial and temporal scales, (3) thorough documentation, and (4) effective scientific communication.
Criterion 4: Linkages and Feedbacks among Related Studies and Models
Integration and linkages among the SVM sub-components may be the most important aspect of the SVM structure. The SVM is composed of several levels of information: empirical research data support a range of sub-models; these submodels provide analyses and values for hydrologic, environmental, and economic variables; and the STELLA model and Board Room integrate output from other sub-models. This structure depends upon smooth integration among all of its components, strong linkages between the models and the Board Room, and feedback from exogenous factors, such as economic and demographic trends (Figure 2-1).
Internal and external problems are noted with SVM integration and linkages. Internal problems relate to linkages between the SVM and its sub-models and a lack of feedback between the SVM and other sub-models. For example, there are missing links between bathymetric models and environmental models (see Chapter 4 for environmental sciences modeling discussion), and the STELLA model quarter-month output is used in environmental models that were designed with daily time steps. The introduction of error due to the lack of model feedback is unexamined, but could be significant. The SVM and its sub-models need better integration to limit error and provide important feedback.
External problems relate most strongly to alternative economic and demographic scenarios that will be relevant for the water regulation plan that replaces Plan 1958DD. For example, the changing socio-economic context of the LOSLR system will influence demands for various services from the LOSLR system (e.g., municipal water supplies, recreation, navigation, ecosystem services, etc.), but the SVM does not incorporate these scenarios in its structure. Likewise, socioeconomic factors relevant to water level regulation (urban runoff will affect wetland restoration and net benefits even if water levels are favorable) are not well de-
scribed or incorporated in the model structure. These issues are briefly outlined in conceptual narratives, but they are not modeled. More robust linkages among the SVM and its sub-models, and integration between empirical research, exogenous factors, and SVM models are needed.
Criterion 5: Spatial and Temporal Resolution and Scaling
Variable water levels and flows within the LOSLR system need to be determined at appropriate temporal and spatial resolutions for the entire system in order to assess the effects of changes in those levels and flows. As discussed above, the STELLA model generates water levels and flows in quarter-monthly intervals. The Flooding Erosion and Prediction System, the Integrated Ecological Response Model, and other environmental sub-models use water-related information on shorter time-steps. These time-step differences were partially recognized at the formulation phase of the study, but the decision was made to proceed with a quarter-monthly model because Lake Ontario outflows are regulated on that basis. Some efforts were taken to mitigate effects of inconsistency among different time-steps. Information about a 2-D hydrodynamic model developed for the upper St. Lawrence River and details regarding its calibration and validation were not provided for NRC review (BACK2; LOSLR Study, 2005, p. 20). In some cases, algorithms were developed to superimpose shorter-term variability on quarter-month averages and to introduce spatial variability (Fan and Fay, 2001, 2002, 2003). Even so, the quarter-monthly time step creates problems of temporal resolution with other components of the LOSLR and SVM that operate on finer temporal and geographic scales than those generated by the STELLA model. The amount of error introduced by these differences in temporal and spatial scales between the STELLA model and other SVM sub-models is unknown. Too many critical processes, including environmental and shipping impacts, occur on shorter time frames, and the reconciliation does not seem adequate between the shorter time frames in some model subsystems and the quarter-month intervals in the SVM.
Criterion 6: Thorough Documentation
Documentation of the SVM created systemic problems for this NRC review. Few materials describing the SVM were presented for review. Of those materials, some reports were incomplete, and some of the modeling components were not operable. These documentation problems limited the review committee’s ability to test and fully understand the design and operation of the SVM and its sub-models. One example of the documentation deficiencies can be seen in the main report on the SVM, a 6-page document entitled, “SVM 3 SVM Documentation Report.” The last sentence of that report states, “…the following pages list the equations, equation documentation and embedded array data from the STELLA model, the main component of the SVM,” but the report ends without listing the equations or
documentation of the STELLA model.
The limited access to and poor documentation of the inner workings of the STELLA model raised questions about how the model is programmed and how it incorporates stakeholder participation. In addition, the accuracy of the resulting calculations could not be verified. The equations that comprise the SVM models need better documentation to convey the model structure and logic.
The SVM Board Room includes descriptions for four regulation plan options and analyses for several others. During the time of the NRC review, the IJC was presenting three possible regulation plans for public comment, referred to as Plans A, B, and D. Although this review does not comment on the plans themselves, it does note that plan descriptions vary in level of documentation on the Board Room spreadsheet. For example, Plan A has a full description of the optimization model used to find the current quarter-month release by minimizing the percentage deviations from specified upper and lower targets for the performance measures over the next year (48 quarter-months). It indicates that the target levels come from the Public Interest Advisory Group presentations at public meetings in summer 2004 (see Cornellreport.doc and PIAG_Yr4_Draft_17.ppt). By comparison, the two-page description of Plan B provides limited insight into how that plan was derived because details were not included, and Plan D is not clearly described at all (Toronto Board Room April 24.xls [SVM 2]). Any plans presented for consideration should be described in a detailed, consistent format.
The state of SVM documentation raises serious questions as to how effective the SVM can be in generating a shared vision. One of the difficulties with plan documentation, and SVM output documentation more generally, is that the models were continuously adjusted over the course of the NRC review. These refinements made it difficult to keep up with current model versions, specifications, output, and documentation. The incomplete documentation is particularly troubling because some aspects of the SVM are very complex and need explanation to be transparent and comprehensible to outside, interested parties. More thorough documentation of the SVM is needed to convey transparency, specifically on the rationale for model choices, methods used, treatment of error and uncertainty, and resolution of spatial and temporal scales.
Criterion 7: Effective Scientific Communication
The primary venue for communicating information in the SVM is the “Board Room,” a spreadsheet that displays the effects of regulation plans for visualization, deliberation, and further modeling decisions by the LOSLR Study Board. Through the Board Room, output from the Integrated Ecological Response Model, the Flooding and Erosion Prediction System model, and other models are compiled, displayed, and communicated. The Board Room displays information about the results of scientific studies and models, and to some extent how those results informed decisions about regulation plan formulation and evaluation in the SVM process. It thus provides a partial basis for assessing the appropriateness and sufficiency of the scientific studies for informing further decision-making. The Board
Room also houses and displays some background memos that have guided the LOSLR Study. Compared to other SVM materials reviewed, the Board Room offers a broader perspective on the appropriateness and sufficiency of the Shared Vision Model because it presents a wide range of comparative information on effects of regulation plan options on performance indicators.
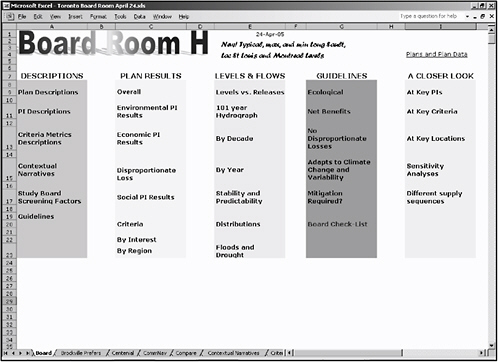
The Board Room has a clearly organized home page consisting of five broad columns: Descriptions; Plan results; Levels and flows; Guidelines; and A Closer Look (at mitigation, climate change, and other issues) (Figure 2-3).
It also indicates the array of documents, tables, graphs, and diagrams developed to compare the potential effects of different regulation plan options, including the following information in Figure 2-3:
-
Plan Descriptions (column 1)
-
Criteria Metrics Description (column 1)
-
Plan Results by Regions (Economic benefits and environmental benefits by region. These results are based in part on group workshops held in Montreal, Brockville, Burlington, and Syracuse) (column 2)
-
Plan Results by Interest (coastal [flooding, erosion/shore protection], recreational boating, commercial navigation, environment, and hydropower stability and predictability) (column 2)
-
Plan Results, including: environmental performance indicators results; economic performance indicators results; and social performance indicators results (the hydropower link was not live in the current version) (column 2)
-
Study Board Screening Factors (a list of 21 factors points used by board members to evaluate each plan) (column 1)
By presenting water level effects in these manifold ways, the Board Room offers detailed and, in some measure, transparent insights into the types of information used to make comparisons among potential plans. Similarly, the Board Room presents many different ways of visualizing these data including:
-
tables of impacts
-
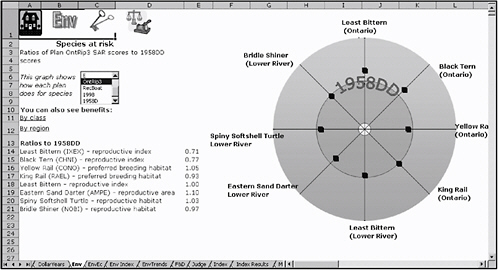
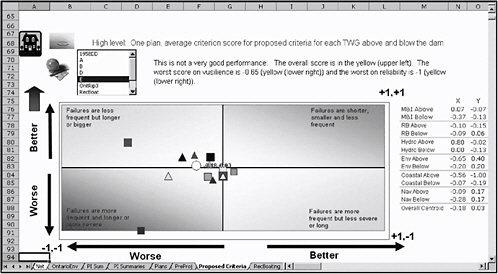
circular ratio plots of multiple performance indicators (Figure 2-4)
-
2D graphs of overall results [-1,-1 to 1,1] (Figure 2-5) bar graphs.
Many of these displays are creative and useful. Some, like the circular ratio plots, allow comparison of a wide suite of performance indicators (Figure 2-5), while others present data aggregation problems that will be elaborated in chapter 4.
Although the Board Room is an excellent idea for communicating the results of the SVM modeling process to decision makers and stakeholders, it does not yet live up to its full promise. For example, the Board Room lacks an introduction on its homepage or a detailed user’s manual, and it has some broken links. More substantively, some of the broken links are on important and relevant aspects of the
SVM including climate change, mitigation, sensitivity analyses, and water supply sequences. In addition, it lacks an archiving function of the regulation plan options that were formulated and evaluated. This archive function would improve the transparency of the SVM process, and enhance its long-term value for water management. Therefore, the Board Room should present information on the uncertainty of the SVM data, analyses, and comparisons; and it should “archive” model runs that revealed model weaknesses and regulation plan option strengths and weaknesses.
Summary: Integration and Display of Key Information
Four evaluation criteria were used to assess how well the SVM integrated and presented key information: model linkages, spatial and temporal scale resolution, model documentation, and effective scientific communication. Overall integration among internal SVM components and feedback with external factors, such as socio-economic factors, were found to be lacking. Model linkages were found to be problematic both for internal linkages within SVM components, and for external feedback of exogenous factors (such as socioeconomic factors) into the SVM. Spatial and temporal scaling present challenges for the SVM because the STELLA model produces water levels and flows per quarter month time step while many of the SVM sub-models operate on a much shorter time step. In addition, disparities in reporting economic and environmental indicators constrain stakeholders and decision-makers’ ability to weigh these outputs intuitively. Inadequate documentation of the SVM was systemic. It was manifested in: (1) lack of information about the equations incorporated in the STELLA model; (2) incomplete SVM models and sub-models that precluded off-site execution; and (3) inadequate description of the development, selection, and elimination of alternative water regulation plans. The inability to determine what was done, how the SVM was constructed, and the rationale behind many unconventional approaches reflects a failure of the SVM to achieve the overall goal of transparency of the modeling process.
Recommendations to improve the integration and display of key information in the SVM follow.
-
Linkages among SVM sub-models should be strengthened
-
Feedback between exogenous factors needs to be strengthened in the SVM structure
-
In cases where temporal and spatial scales are different, efforts should be made to improve compatibility, or to more clearly present the error and uncertainty created by scaling issues
-
SVM documentation should be improved, at a minimum, in the following ways:
-
Better description of the SVM and its role in the development, selection, and elimination of alternative water regulation plans, and
-
Clearer rationale behind choices different from those of standard
-
-
practice for methodologies of model development and its use in plan formulation and evaluation.
OVERALL APPROPRIATENESS AND SUFFIENCY TO INFORM REGULATION OPTIONS
Charge C in the statement of task questions the extent to which the models and studies are sufficient and appropriate to evaluate the various regulation plans and the impacts of changes in water levels and flows in the LOSLR system. Three evaluation criteria are used to address this charge with respect to the SVM: breadth of inquiry and scope of the SVM, its balance between scientific and practical professional approaches; and identification of future studies needed to fill information gaps.
Criterion 8: Breadth of Study Scope
The SVM and its related planning process involved over 150 scientists, nine Technical Work Groups, a Public Interest Advisory Group, numerous stakeholder meetings, and a management structure of engineers and planners. It sought to expand the scope of water regulation planning to address hydrologic, environmental, and economic processes on timescales ranging from hours to decades and spatial scales ranging from meters to hundreds of kilometers. By historical standards in Great Lakes water regulation, it achieves an unprecedented breadth of scope in its coordination of various management aspects of a complex international water system.
The SVM aims to facilitate a transparent process to replace water regulation Plan 1958DD that includes inter-disciplinary approaches (as described in Breadth of Scope in Chapter 1). The inter-disciplinary approach was used to ensure that the selected plan best reflects the range of input received from the scientific, policy, and public communities. Range of choice issues, as related to the scope of the SVM approach, are identified as: 1) expanding the range of choice among regulation plan options; 2) analyzing the range of choice among regulation plan options; and 3) comparable treatment of environmental and economic effects of regulation plan options.
Scientific Basis for Expanding the Range of Choice
The SVM expanded the domain of water regulation to consider environmental, recreational, and coastal indicators, as well as established water uses. It also formulated and evaluated a large yet unknown number of regulation plan options that presumably expanded the range of choice. It did so through a multi-party stakeholder negotiation and evaluation process that used the SVM. Although that
process does not fall within the scope of this review, several points are pertinent to the evaluation of the SVM.
In open session, LOSLR staff stated that participants were invited to submit plans for evaluation using the SVM, but they do not appear to have provided detailed technical guidance, directions, or tools to help stakeholders prepare candidate regulation plans. It is possible that in such multi-party negotiations, the parties’ self interest would motivate them to propose plans that they favor; other parties would counter with proposals that they favor, and this could eventually lead to an exploration of the feasible space for solutions. In such a process stakeholders may propose alternatives, examine results, “learn” about how the system might respond, and iterate again. However, multi-party negotiation approaches may miss opportunities for joint gains and alternatives that expand the range of choice significantly beyond existing water regulation regimes.
The SVM Board Room includes mitigation measures, which constitute another important set of ways to expand the range of choice by reducing losses and increasing net benefits. Approaches for incorporating mitigation analytically in the SVM may involve non-structural as well as structural adjustments to water regulation impacts (e.g., flood damages, see FEPS 8 for an example of structural mitigation). They can involve (1) changes in a specific regulation plan that reduce a negative impact; (2) measures applicable to all regulation plan options; or (3) a combination of these two approaches. The Board Room includes a link labeled “Mitigation Required?” but that link is empty, so it is not clear if it encompasses the modeling opportunities noted above. The LOSLR Study has examined a large number of alternatives that need to be documented to indicate the range of choice explored through the SVM.
Scientific Bases for Evaluating the Range of Choice—The Possibility Frontier and No Disproportionate Losses
The process of evaluating and screening potentially attractive plans from the overall set of possible plans is critical to the success of the Study. The number of plans that were formulated through the 5-year Study was not presented for review, although anecdotal estimates indicate that over 100 plans were developed and evaluated. Several important steps in the SVM plan evaluation process remain unclear: (1) how it narrowed the universe of possible plans to the seven plans listed on the Board Room, (2) how it narrowed those plans to the three candidate plans under consideration, and (3) how the SVM was used for evaluating, screening and selecting these alternatives (see Leger et al., 2005 for a draft account).
The SVM would benefit from a clearer presentation about how it was used to evaluate the range of choice among regulation plan options. The Board Room contains much evidence of evaluation (e.g., tables and diagrams comparing impacts, and Study Board screening factors), but it is less clear how the Study Board evaluated the range of choice among the emergent alternatives (Wescoat, 1987; White, 1964). This process can be pursued in a number of ways, and the SVM took sev-
eral approaches. The Board Room spreadsheet includes a list of 21 screening factors used by the Study Board. Although it does not provide supporting information about how those factors were applied to specific options, it does indicate the importance attached to different evaluation criteria. It is still not clear whether the SVM was used to identify the possibility frontier of feasible alternatives.
The Possibility Frontier. A “possibility frontier” of efficient solutions (Cohon, 1978; Goicochea et al., 1982) can be depicted as a curved boundary that that separates technically feasible plans (inside the boundary) from technically infeasible plans (outside the boundary). In an illustrative case of two objectives, improving the environment and increasing net economic benefits, plans on the boundary are efficient, in the sense that it is not possible to improve the performance for one objective without decreasing performance of the other (Figure 2-4). A possibility frontier can also be developed for a multi-objective optimization problem, where the boundary is a 3- or more-dimensional surface. In either case, the possibility frontier can be used as a guide for those who are charged with deciding among efficient plans. Although the SVM does not identify a possibility frontier of efficient alternatives, it does enable evaluation of plans that are relatively better or worse for different indicators, regions, and interests, which the Board Room displays in detail. SVM materials do not document the process employed to formulate plans that increase one set of benefits without decreasing others (i.e., Pareto-optimal type solutions), or increase benefits for some without causing disproportionate loss to others (though see Leger et al., 2005).
Disproportionate Loss Criteria. The SVM presents board members’ screening factors in a level of detail that is commendable. The Study Board uses the criterion of no disproportionate losses, for instance, to eliminate water management plans that produce unacceptable damages for one or more sectors, regardless of benefits to other sectors. For example, IJC and LOSLR Study representatives reported that the economically most beneficial plan, particularly beneficial to hydropower, was rejected because it produced disproportionate losses to the environmental sector. The Board Room spreadsheet displays losses from selected plans, but it does not provide a record of the versions of those and other plans rejected as unacceptable, the progress made toward Pareto optimality through the SVM, the quantitative criteria for judgments of disproportionate loss, or changes in those criteria over time (though again see Leger et al., 2005). The IJC and the public would be informed by knowing the range of choice defined by both possibility frontier and loss criteria, as well as the record of tradeoff analysis made through SVM modeling. It is not clear from the SVM documentation which tradeoffs were made when various plans were screened, selected, or rejected. This information is crucial to create a transparent process. The SVM plan evaluation process should document the range of efficient and minimally acceptable plans considered in order to facilitate informed decisions.
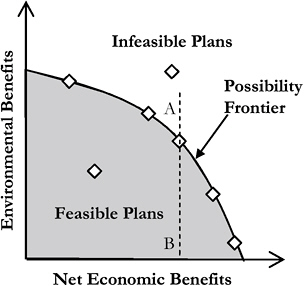
FIGURE 2-4 The possibility frontier for regulation plans with two objectives.
Comparable Treatment of Economic and Environmental Aspects of Performance Indicators
The LOSLR Study treats economic and environmental effects differently. While it is acceptable to forgo a full multi-attribute utility theory model (that is, not put economic and environmental indicators on common footing, whether via multi-attribute utility models or via monetizing environmental indicators), environmental and economic indicators should be treated in ways that enable proper integration of the two types of indicators in decision making. For example, while environmental performance indicators were subjected to an arbitrary “10% rule” to assess their significance, economic indicators were not. There is no statistical or practical justification offered for the decision to use the “10% rule” to express confidence in the significance of environmental performance indicator ratios.
The environmental indicator ratios are problematic. Although ratios may be reasonably well-behaved when used to evaluate plans that represent minor deviations from a baseline plan, they do not allow expression of variability and confidence limits to assess whether differences between plans are significant. In addition, the ratios were constructed in a variety of ways (sometimes aggregating before and sometimes after forming ratios, using moving averages for some indicators, etc.), which makes it difficult to compare dissimilar metrics across plans consistently, leading to inconsistent and unstable ordering of plans (SAR 3A discusses these issues nicely).
The Economics Advisory Committee raised a similar question about the comparability (i.e., fungibility) of economic variables. Economic indicators,
although not a specific subject of this review, are a major aspect of the SVM, and the report of the Economics Advisory Committee (2004) was supplied to the Committee as a background document. The Committee shares the Economics Advisory Committee concerns about the treatment of economic factors in the SVM. It is not clear from SVM documents which of the Economics Advisory Committee recommendations have been implemented. For example, while the SVM has “net benefits” as an evaluation criterion, it does not follow standard procedures for evaluating the time streams of economic benefits associated with alternative plans. A generally accepted method for treating economic consequences over time is to use the present value of discounted benefits and costs over an economic time horizon. The present value of discounted stream of net benefits over T years (PVB) is defined as annual benefits (B) discounted by a rate that reflects economic time preference (r) (EAC, 2004, pp. 5-6):
In the SVM application, the time horizon is 101 years. Values of PVB can be calculated for each 101-year sequence of inflows. Expected values of PVB could be estimated as the average value of PVB for multiple sequences of inflows. In this application, the 50,000 years of simulated flow sequences would provide about 500 possible sequences and 500 possible values of PVB. This series could also be used to estimate a probability distribution for PVB.
By holding external economic factors at present levels, the Study appears to have estimated only values of current benefits, B0, under a range of possible annual sequences. This value does not capture effects of changes in economic factors and changes to physical and biological conditions over time.
The Study Board is aware of these issues (LOSLR, Year 3 Report, 2004, pp. 54-55). The coastal erosion performance indicator discounts future expenditures on shore protection, which vary under different hydroclimatic and water regulation scenarios (FEPS 7, pp. 23-7; and FEPS 14, p. 4). However, it is not clear how economic time preference has been addressed across different economic sectors and submodels in the SVM; and it is even less clear whether the present value of future environmental changes has been considered (e.g., as matters of intergenerational equity).
Because of problems with the way individual indicators were treated, and the different ways in which environmental and economic indicators were treated (e.g., the “10% rule”), the SVM output does not enable decision makers to comprehensively weigh trade-offs between environmental and economic indicators, as they will need to do in the absence of a fully formulated multi-attribute model.
Criterion 9: Balance of Scientific and Practical Professional Approaches
Evaluating the balance between scientific and practical professional approaches in the Shared Vision Model is contingent upon its performance under the other evaluation criteria, its constitutive models (FEPS, IERM, etc.), and its documentation. The constitutive models are discussed in chapters 3 and 4. This section focuses on the balance achieved within and among the other evaluation criteria. Each criterion has scientific and professional aspects, but the main scientific evaluation criteria employed in this review focus on empirical foundations, QA/QC, and treatment of error and uncertainty (Criteria 1, 2, and 3). Criteria 4 and 5 on study linkages and feedback, and spatial and temporal resolution, respectively, have strong scientific as well as practical professional roles in the LOSLR Study. Documentation, communication, and breadth of study scope criteria are common to both practical professional and scientific approaches. Two examples of the balance in the SVM are presented: one is drawn from the scientific criteria (Criterion 2) and the other from the practical professional side (Criterion 6).
Peer review is a standard scientific practice (Criterion 2). According to SVM materials, the SVM was to undergo two rounds of review: an intensive internal review and now this NRC review at the end of the study. The internal “peer” review is described in SVM documentation (BACK 6):
The Shared Vision Planning (SVP) process provided perhaps the most detailed and intensive collegial review in that all the research and data was incorporated into the SVM. All the scientific and technical information had to be encoded as algorithms in the model, and each part of the model was validated independently.
Through the course of this NRC review, however, it became clear that the SVM was likely neither “validated independently” nor presented for external peer review in refereed publications. Peer review among practitioners and scientists in refereed publications would have given strong indication as to whether the SVM has struck the important balance between the scientific and practical professional approaches.
Documentation is standard practice for scientists and practitioners alike. It is used to explain methods, analyses, and treatment of error and uncertainty within and across different audiences. Problems with SVM documentation have been noted (see Criterion 6). These problems contribute to a lack of clarity and understanding about why certain decisions were made, such as the choice of regression analyses or rationale for using a single lake water elevation. These decisions, if better defended in stronger documentation, could have shed light on the balance between scientific and practical professional approaches in the SVM. However, this balance cannot be duly assessed without improved documentation.
Remedying the lack of documentation and quality assurance is necessary to assess the overall balance between scientific and practical profes-
sional approaches in the SVM, and in some of its specific modeling choices and applications.
Criterion 10: Identification of Future Study Needs
The LOSLR Study was initially planned to span five years. Now at the end of its 5-year life, the enormous amount of work and resources expended on the SVM development will be put to the best use over a multi-decadal time line. The history of the current single static plan, Plan 1958DD, demonstrates the need for flexibility and adaptability in water regulation in this dynamic watershed. However, future study needs were not explicitly identified in SVM review materials, and the LOSLR Study would benefit from a long-term plan that identifies future needs and potential changes. In support of the SVM being used over a multi-decadal time scale to assess changes in performance indicator responses to water level management, three needs are identified: revision and maintenance of the SVM, further environmental scenario analysis (e.g., climate change); and development of a systems dynamics approach to water regulation.
Revision and Maintenance of the SVM
SVM materials did not disclose a plan to revise, maintain, and update data collection and modeling activities. Like the first iteration in most studies undertaken to support important and controversial political decisions, current versions of the SVM are based on numerous assumptions and simplified representations of the real system. As noted in earlier sections of this chapter, the SVM has several deficiencies: existing documentation is incomplete, and there are several important gaps in the modeling structure and database. As a first step, these revisions need to be made. After the revisions are made and a new regulation plan is selected, the new plan will need on-going evaluation to determine how well it satisfies performance objectives under conditions of dynamic change in the Lake Ontario-St. Lawrence River basin. The history of change in Plan 1958D/Plan 1958DD shows that a single, static plan cannot be maintained over multiple decades, and ability is needed to adapt plans to changing conditions. For the LOSLR Study to have a lasting effect, the SVM needs initial revision and then continued maintenance to keep current with changing conditions in the LOSLR basin.
Further Environmental and Socioeconomic Scenario Analysis
Scenarios of long-term environmental and socioeconomic change also need a prospective approach that can be adapted with advances in scientific understanding of the region. Climate change is one example of dynamic human-environment relationships that has environmental and socioeconomic implications. Most recent re-
search on climate change in the Great Lakes region indicates that the direction of possible effects on water levels and flows (up or down) is highly uncertain—as are the magnitude, timing, and spatial variability of change at regional and local scales. Although the potential impacts of climate change on the resources of Great Lakes basin have been extensively researched (Croley, 2003; Lofgren et al., 2002; Lofgren, 2003, 2004; Sousounis, 2002), and addressed to some degree in SVM scenarios of climate change, the need for further analysis of this and other long-term environmental processes may be anticipated. Similarly, as noted earlier, socioeconomic trends will likely have substantial relevance for future water level and flow regulation. The LOSLR Study takes an important step by examining scenarios of climate change and water regulation, but these and other environmental and socioeconomic scenarios will likely change and require further evaluation.
Toward a System Dynamics Approach
System dynamics simulation is a powerful tool for understanding complex feedback relationships among social and environmental components of a system (Simonovic, 1999; Simonovic and Rajasekaram, 2004; Sterman, 2000). The STELLA model is a system dynamics model as well as the modeling platform for the SVM. However, the STELLA model is not an immediate good fit for purposes of the SVM for several reasons. The value of system dynamics simulation lies in understanding the relationships within a complex system, and it is not typically used to predict the future behavior of a system. The STELLA model has capabilities that extend far beyond the simple water balance application for which it is being used in the SVM. The STELLA model, as developed and utilized in the Study has a very limited purpose: to calculate the response of the LOSLR hydraulic system to modification of rules governing release of water from Lake Ontario and the upper St. Lawrence River. The structure of the system is defined by the physical configuration of the network of rivers and lakes and the structures that regulate the flow of water through this system. This physical model of the hydraulic system is rigid. It is characterized by the same-state variables, and it does not add or subtract any elements or introduce any new interactions. For a given set of inputs (inflows to Lake Ontario, inflows from tributaries) the role of any model is to calculate flows and water levels at locations within the network where this information is required for other modeling purposes. Based on the structure of the SVM and its submodels, this task can be performed by a spreadsheet using mass balance equations.
The STELLA model could have been the modeling engine for all sub-models in the SVM, but for reasons unexplained, it is not being used that way. The important feature of the hydraulic network in the STELLA model is that it remains static: whatever is happening in other subsystems has no impact on how the water is being distributed through the network over time. On the other hand, changes in the operating rules (new plans) do have an effect both on the spatial and temporal distribution of water flows and levels and on how other subsystems behave and respond. Although the hydraulic system can be modeled independently of other subsystems, which may be the purpose for using the STELLA model for the SVM, this
rationale is not explained in the documentation.
Partial implementation of system dynamics simulation has the effect of under-utilizing the STELLA model in the SVM applications. The SVM should include feedback loops to account for treatment of exogenous dynamic variables such as socio-economic and demographic factors, but it does not in its current design. This limitation was previously discussed under Criterion 4. Had the SVM included these feedback loops, the STELLA model would be a suitable application to simulate those feedbacks. This partial implementation of the systems dynamics modeling approach (i.e., using the STELLA model and not including feedback loops) is a major conceptual limitation of the SVM as used in this study.
SUMMARY
The LOSLR study is commended for its incorporation of broader water management goals for the LOSLR system and its commitment to public participation. Technically, however, its formulation and evaluation of alternative water regulation plans using the SVM modeling system are not likely to serve the intended purpose as well as they could. The SVM does not document its exploration and evaluation of the range of choice among regulation plan options and associated mitigation measures. Its deficiencies in documentation and quality assurance are uncharacteristic of scientific and practical professional approaches, and it does not lay out priorities for future modeling improvements and applications. As discussed in criteria 1 through 7, some important linkages between the SVM and supporting empirical research, sub-models, and exogenous variables are found wanting.
In spite of these criticisms, the Shared Vision Model approach represents an enormous investment in science to support decision making, and that investment should be captured to the maximum extent. Doing so requires an ongoing commitment to maintain and augment the databases and the models developed during the LOSLR studies in an adaptive management framework.
Experience with the Plan 1958DD plan indicates that it is unrealistic to think that a single plan can be adopted and then implemented for years into the future, given the dynamic physical and social context of the LOSLR system. Whether the issue is climate change, population growth, or new technologies for energy production, any water regulation plan for the LOSLR will be need to adapt to the dynamism of the Lake Ontario-St. Lawrence River basin. The SVM modeling system provides the kernel for an adaptive management system, but only if resources are invested in repairing its deficiencies and managing it for long-term use.
Specific recommendations to improve the overall appropriateness and sufficiency of the SVM to inform decision making include the following:
-
The decisions to treat economic and environmental indicators differently should be justified in the SVM documentation or changed
-
Incompatibilities in temporal and spatial scales between the STELLA
-
model and SVM sub-models could introduce untold error and need fuller exploration and explanation
-
For the LOSLR Study to have a lasting effect, the SVM needs continued maintenance and updating to keep current with changing conditions in the LOSLR basin
-
A systematic process is needed to document the unfolding range of choice among alternative regulation plans.
-
Use of the STELLA model in the SVM represents a partial implementation of the systems dynamics modeling approach and is a major conceptual limitation of the SVM as used in the LOSLSR study.
REFERENCES
BACK 2. IJC (International Joint Commission). 1999. Plan of Study for Criteria Review in the Orders of Approval for Regulation of Lake Ontario-St. Lawrence River Levels and Flows. Available on-line at http://www.ijc.org/php/publications/html/pos/pose.html. Accessed September 2005.
BACK 6. Peer Review Triage Strategy (draft).doc.
Cardwell, H., B. Faber, and K. Spading. 2004. Reservoir Operating Plan Evaluation (ROPE) Study for the Mississippi Headwaters Collaborative Models for Planning in the Mississippi Headwaters. Available on-line at http://www.iwr.usace.army.mil/iwr/svp/rope.htm. Adapted from Conference Proceedings of the ASCE Environmental and Water Resources Conference, Salt Lake City, UT., June 28-July 1, 2004.
Cohon, J. L. 1978. Multiobjective Programming and Planning. New York: Academic Press.
Cohon, J. L., and D. H. Marks. 1975. A review and evaluation of multiobjective programming techniques. Water Resources Research 11(2):208-220.
Connor, J. L., L. Cartwright, and K. Stephenson. 2004. Collaborative water supply planning: A shared vision approach for the Rappahannock Basin in Virginia. World Water and Environmental Resources Congress 2004. In Sehlke, G., D. F. Hayes, and D. K. Stevens (eds.) Critical Transitions in Water and Environmental Resources Management. ASCE Environmental and Water Resources Conference, Salt Lake City, UT, June 27–July 1, 2004.
Croley II, T. E. 2003. Great Lakes Climate Change Hydrologic Impact Assessment. IJC Lake Ontario–St. Lawrence River Regulation Study. NOAA Technical Memorandum GLERL-126, Great Lakes Environmental Research Laboratory, Ann Arbor, MI, September 2003.
Fan, Y., and D. Fay. 2001. Variation of St. Lawrence River Hourly Water Levels About the Quarter-Monthly Mean. Hydrology and Hydraulics Technical Working Group. Lake Ontario–St. Lawrence River Study, International Joint Commission.
Fan, Y., and D. Fay. 2002. Final Report on the Development of Empirical Relationships to Estimate Water Levels of the St. Lawrence River from Montreal
to Trois Rivères. Great Lakes–St. Lawrence Regulation Office, Meteorological Service of Canada–Ontario Region, Environment Canada. March 28, 2002 (with corrections of October 2002).
Fan, Y., and D. Fay. 2003. Estimation of Lake Erie Outflows for Use in the Lake Ontario–St. Lawrence River Study. Great Lakes–St. Lawrence Regulation Office, Meteorological Service of Canada–Ontario Region, Environment Canada. December 20.
Goicochea, A., D.R. Hansen, and L. Duckstein. 1982. Multiobjective Decision Analysis with Engineering and Business Applications. New York: John Wiley & Sons.
Great Lakes Climate Change Hydrologic Impact Assessment I.J.C. Lake Ontario– St. Lawrence River Regulation Study . NOAA Technical Memorandum GLERL-126, September 2003.
Hagen, E., and J. Kiang. 2003. Interstate Commission on the Potomac River Basin Water Supply. Available on-line at http://www.iwr.usace.army.mil/iwr/svp/icprbstudy.htm. Accessed on. August 7, 2005.
IWR (Institute for Water Resources). 1995. National Study of Water Management During Drought: The Report to the US Congress IWR Report 94-NDS-12 (September).
Leger, W., F. Lupi, and W. Werick. 2005. Lake Ontario St. Lawrence River Study: Plan evaluation, rankings, and tradeoffs. Draft July 13, 2003. Copy on file at The National Academies, Water Science and Technology Board, 500 5th St., NW Washington, DC 20001.
Lofgren, B. M. 2003. Simulation of possible future effects of Greenhouse Warming on Great Lakes water supply using a regional climate model. Proceedings, 17th Conference on Hydrology, Long Beach, CA., February 8-13, 2003. Boston, MA: American Meteorological Society.
Lofgren B. M. 2004. Global warming effects on Great Lakes water: More precipitation but less water? In Proceedings of the 18th Conference on Hydrology, 84th Annual Meeting of the American Meteorological Society, Seattle, WA., January 11-15, 2004.
Lofgren, B. M., F. H. Quinn, A. H. Clites, R. A. Assel, A. J. Eberhardt, and C. L. Luukkonen. 2002. Evaluation of potential impacts on Great Lakes water resources based on climate scenarios of two GCMs. Journal of Great Lakes Research 28(4):537-554.
LOSLR Study (Lake Ontario-St. Lawrence River Study Board [LOSLR]). 2005. Options for Managing Lake Ontario and St. Lawrence River Water Levels & Flows: Final Report. July 1, 2005 Draft. Copy on file at The National Academies, Water Science and Technology Board, 500 5th St., NW Washington, DC 20001.
National Assessment Synthesis Team. 2000. Climate Change Impacts on the United States. A Report of the National Assessment Synthesis Team–US Global Change Research Program, 2000. Available on-line at http://www.usgcrp.gov/usgcrp/Library/nationalassessment/overview.htm. Accessed September 2005.
NRC (National Research Council). 2004. Adaptive Management for Water Resources Planning. Washington, DC: The National Academies Press.
NRC. 2005. Valuing Ecosystem Services: Toward Better Environmental Decision-Making. Washington, DC: The National Academies Press.
Palmer, R. N. 1998. A history of shared vision modeling in the ACT-ACF comprehensive study: A modeler’s perspective, presented at the 25th Annual Conference on Water Resources Planning and Management, Chicago, IL., June, 1998.
Palmer, R. N. 1999. Modeling Water Resources Opportunities, Challenges, and Trade-offs: The Use of Shared Vision Modeling for Negotiation and Conflict Resolution, Keynote Invited Presentation, presented at the 26th Annual National Conference, Water Resources Planning and Management Division of ASCE, Tempe, AZ., June, 1999.
Simonovic, S. P., and H. Fahmy. 1999. A new modeling approach for water resources policy analysis. Water Resources Research 35(1):295-304.
Simonovic, S. P., and V. Rajasekaram. 2004. Integrated Analyses of Canada’s Water Resources: A System Dynamics Model. Canadian Water Resources Journal 29(4):223-250.
Sousounis, P. J. 2002. Special issue on Global Warming. Journal of Great Lakes Research 28(4).
Stephenson, K. 2003. The what and why of shared vision planning for water supply. A paper prepared for the panel session on Collaborative Water Supply Planning: A Shared Vision Approach for the Rappahannock River Basin, Universities Council on Water Resources, Water Security in the 21st Century Conference. Washington, DC. July 30, 2003. Available on-line at http://www.iwr.usace.army.mil/iwr/svp/WaterSecurity03Text.pdf.
Sterman, J. D. 2000. Business Dynamics–Systems Thinking and Modeling for a Complex World. New York: McGraw-Hill.
SVM 1. LOSLR Study Board. n.d. Evaluation Process: The Shared Vision Model. Provided for review as SVM document.
SVM 2. Shared Vision Model for the Design and Evaluation of Alternative Regulation of Lake Ontario Releases into the St. Lawrence River. Includes Toronto Board Room April 24.xls.
SVM 3. Shared Vision Model for the Design and Evaluation of Alternative Regulation of Lake Ontario Releases into the St. Lawrence River. Documentation Report. February 15, 2005.
U.S. Water Resources Council. 1983. Economic and Environmental Principles and Guidelines for Water and Related Land Resources Implementation Studies. Available on-line at http://www.iwr.usace.army.mil/iwr/pdf/p&g.pdf. 48 CFR 10249 (March 10).
Werick, W. 2000. The future of shared vision planning. In Hotchkiss, R. H. and M. Glade (eds.) Water Resources 2000: Building Partnerships. Joint Conference on Water Resource Engineering and Water Resources Planning and Management 2000, Minneapolis, MN., July 30–August 2, 2000.
Werick, W. 2005. Presentations on shared vision planning and modeling in the LOSLR Study to the NRC committee. Niagara-on-the-Lake, Ontario, CA. June 11-13, 2005.
Wescoat, J. L. Jr. 1987. The ‘Practical Range of Choice’ in water resources geography. Progress in Human Geography (1987): 41-59.


