2
Procedures, Requirements, and Standards
This chapter provides a context for the committee’s review and analysis of physical, medical, and mental health standards. It presents information on the existing medical processing system, military policies regarding personnel readiness, and the current status of fitness standards and testing.
The U.S. Department of Defense (DoD) is the nation’s largest employer. In fiscal year (FY) 2005 alone, DoD planned to recruit 168,861 people to active duty and succeeded in recruiting 163,259 people (Office of the Deputy Under Secretary of Defense/Military Personnel Policy/ Accession Policy, October 10, 2005). That number is somewhat lower than in recent years,1 primarily because the Air Force is dramatically reducing recruiting in FY 2005 as part of a force-shaping initiative, while the Army fell 6,627 recruits short of its goal. Still, few organizations have annual requirements that even approach these numbers. In addition to the magnitude of these personnel requirements, the military services also confront a complex system of legal and policy constraints that exclude a substantial proportion of potential recruits from enlisting (see Appendix 2-A for an overview of recruiting practices and conditions). Those constraints include mental and physical minimum standards, educational and moral requirements, age limits, and security clearance issues. Our focus here is on the physical, medical, and mental health standards for military service.
TABLE 2-1 Race/Ethnicity and Gender of Active-Component First-Time Applicants, by Service, FY 2002 (percentage)
The military services’ personnel requirements are further complicated by a desire to have the racial and ethnic characteristics of the force reasonably representative of society as well as by legal and policy constraints that prevent the assignment of women to some direct-combat military occupational specialties. These concerns are important because medical and physical fitness requirements for service are likely to have differential impacts by race and sex.
As shown in the Tables 2-1 through 2-4, the military services have been extremely successful maintaining a racial and ethnic mix. Among applicants for military service (Table 2-1) and among new recruits (Table 2-2), blacks are slightly overrepresented compared with the population ages 18 to 24, while Hispanics are slightly underrepresented. Compared with the population ages 18 to 24, blacks are substantially overrepresented among all active-duty military personnel and Hispanics are somewhat underrepresented (Table 2-3). Although women make up a substantial proportion of the force, that proportion is far less than their representation in society (Table 2-4).
TABLE 2-2 Race/Ethnicity and Gender of Active-Component First-Time Accessions, by Service, and Civilians Ages 18-24, FY 2002 (percentage)
MEDICAL AND PHYSICAL FITNESS
Medical Standards and Screening
DoD’s medical enlistment standards are contained in DoD Instruction 6130.4 (Box 2-1 provides a listing of the areas covered). This instruction was updated in 2004 on the basis of a review by the Accessions Medical Standards Working Group (AMSWG), which was guided in part by research findings provided by the Accessions Medical Standards Analysis and Research Activity (AMSARA). DoD Instruction 6130.4 forms the basis for screening recruits for all accessions. The new standard clearly emphasizes the importance of correct coding of all health events related
TABLE 2-3 Race/Ethnicity of Active-Component Enlisted Members, by Service, and Civilian Labor Force, Ages 18-44, FY 2002 (percentage)
TABLE 2-4 Gender of Active-Component Enlisted Members, by Service, and Civilian Labor Force, Ages 18-44, FY 2002 (percentage)
|
Gender |
Army |
Navy |
Marine Corps |
Air Force |
DoD |
Civilians Ages 18 to 44 |
|
Men |
85.4 |
85.6 |
93.9 |
80.1 |
85.2 |
54.2 |
|
Women |
14.6 |
14.4 |
6.1 |
19.9 |
14.8 |
45.8 |
|
Total |
100.0 |
100.0 |
100.0 |
100.0 |
100.0 |
100.0 |
|
SOURCE: Civilian data from Bureau of Labor Statistics Current Population Survey File, September 2002, Office of the Assistant Secretary of Defense (2002). |
||||||
to the accession process and provides definitions for use by examining physicians.
In addition to this instruction, each Service has its own guidance and regulations for entrance and job assignment. There are several points in the enlistment process at which screening takes place: (1) at the recruiting station, (2) at the military entrance processing station (MEPS)/U.S. Military Entrance Processing Command, and (3) in waiver authorities in each Service.
Recruiting Stations
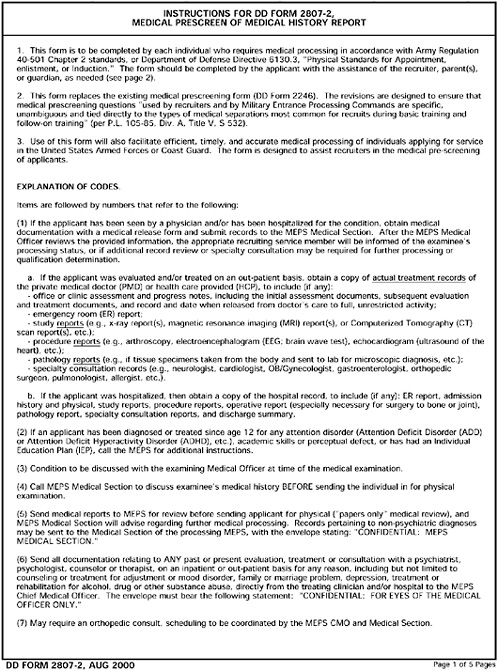
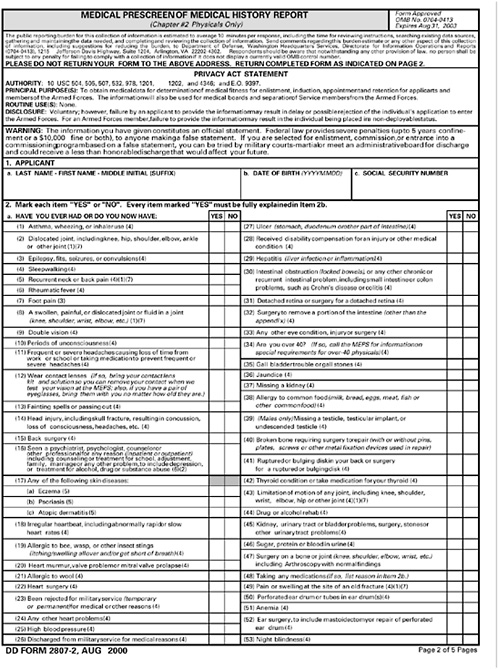
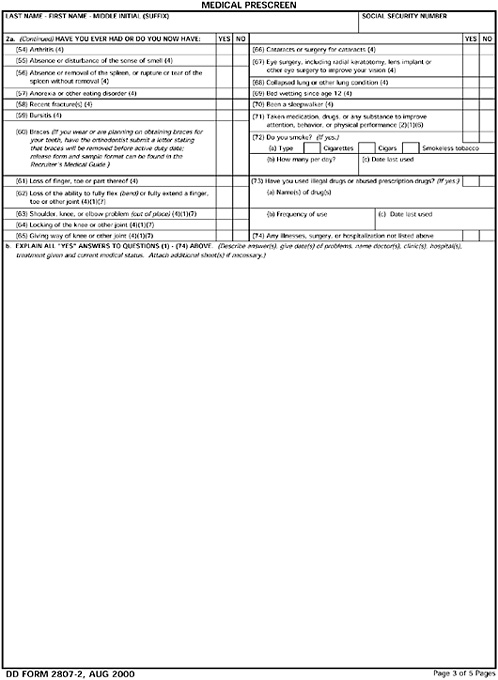
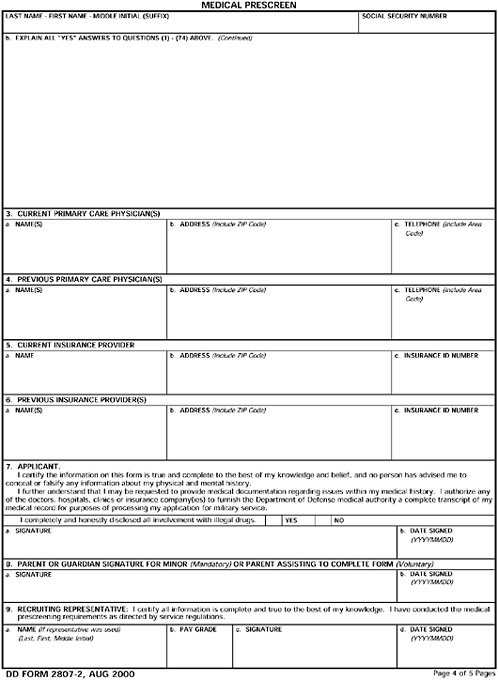
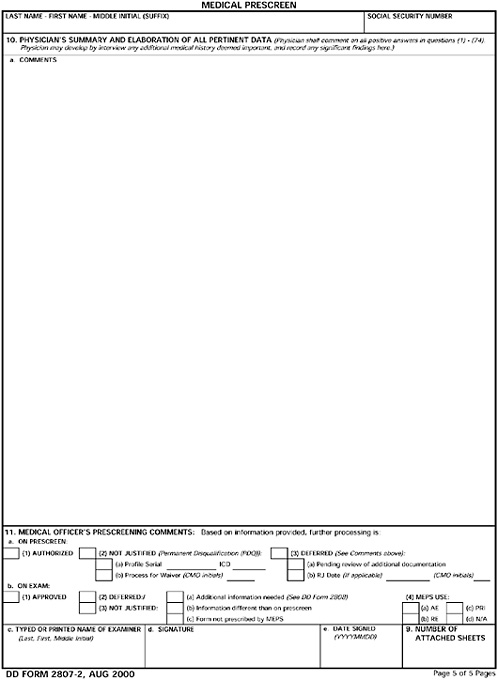
The enlistment screening process begins at the recruiting stations, where each applicant completes the medical prescreen using DoD Form 2807-2 (see Appendix 2-B). The medical prescreen includes a series of questions based on standards put forth in DoD Instruction 6130.4. If a disqualifying condition is indicated, the applicant is required to provide
|
BOX 2-1 Head Eyes Vision Ears Hearing Nose, sinuses, and larynx Dental Neck Lungs, chest wall, pleura, and mediastinum Heart Abdominal organs and gastrointestinal system Genitalia (male) Genitalia (female) Urinary system Spine and sacroiliac joints Upper extremities Lower extremities Miscellaneous conditions of the extremities Vascular system Skin and cellular tissues Blood and blood forming tissue diseases Systemic Endocrine and metabolic disorders Neurological disorders Learning, psychiatric, and behavior Tumors and malignant diseases Miscellaneous |
an explanation and, in some cases, the recruiter may assist the applicant in obtaining all relevant medical records. Also, each applicant’s body mass index (BMI) is estimated at the recruiting station to ensure that it meets the standard of the Service to which the applicant is applying (there is some variation among the Services; see Chapter 5 for a full discussion). An applicant will be temporarily disqualified at the MEPS if he or she does not meet the BMI or body fat standards.
If a recruiter has a concern about a particular medical condition, he or she can call a MEPS medical technician through the Dial-A-Medic Program to ask questions regarding an applicant’s medical eligibility. Medical prescreening forms and associated documentation are forwarded to the local MEPS for further processing; this paperwork precedes the applicant’s visit to the MEPS. Applicant transportation to the MEPS is
provided at the expense of the military. If a recruiter determines that an applicant is unlikely to meet medical standards because of a condition that is either not eligible for a waiver or unlikely to be granted a waiver, the processing of that applicant stops and the applicant’s Form 2807-2 is filed for a limited time in the recruiting office.
Military Entrance Processing Stations
MEPS are responsible for screening all applicants in accordance with DoD Instruction 6130.4. MEPS are staffed with chief medical officers. These medical officers go through a training regimen and attend an annual chief medical officer’s conference. They are responsible for profiling applicants for medical fitness to enter the military, making medical decisions, and ensuring that all medical documents are examined and appropriately routed. In addition to the chief medical officer, MEPS are staffed by military medical specialists, noncommissioned officers in charge, medical technicians, fee-basis practitioners, and consultants (medical specialists). Fee-basis practitioners also conduct medical examinations; however, prior to practicing at the MEPS, they must complete a training program and be approved by a credentialing committee. Table 2-5 shows the number and distribution of medical personnel in the current MEPS system. The procedures for medical personnel and medical examinations are contained in U.S. Military Entrance Processing Command (USMEPCOM) Regulation 40-1.
Standards are used by the MEPS to determine whether an applicant is medically and mentally qualified for military service. If an applicant is disqualified, he or she has the option of applying, through the recruiter, to the chosen Service for a waiver of the disqualification; the granting of these waivers can be used to control the flow of enlistees. Each Service has its own policy on waivers; an examination of these policies was outside the scope of the committee’s charge.
Medical Processing The medical processing at a MEPS is shown in Figure 2-1. It includes (1) vision and hearing tests, (2) an individual examination and medical history specifying past or existing medical conditions taken by a physician (according to the guidance in DoD Instruction 6130.4) and recorded on Form 2807-1, (3) HIV and drug testing, (4) height and weight (BMI) measurement (in accordance with Service standards), (5) body fat if BMI is exceeded, and (6) an orthopedic/neurological examination intended to identify abnormalities that must be further investigated by the examining practitioner (see Box 2-2 for factors considered in the orthopedic/neurological test). The outcome of the medical evaluation process is a profile that contains document reviews, recommendations for
TABLE 2-5 Medical Personnel
|
|
|
Physicians |
Staff |
|
Military Enlistment Processing Command HQ |
3 |
9 |
|
|
Sector (eastern and western) |
2 |
4 |
|
|
Chief medical officers |
65 |
|
|
|
Assistant chief medical officers |
3 |
|
|
|
MEPS support staff |
|
|
|
|
Medical noncommissioned officer |
|
65 |
|
|
Civilian health technicians |
|
405 |
|
|
Military medical specialists |
|
207 |
|
|
Fee-basis practitioner network |
419 |
|
|
|
In-house consultants network |
48 |
|
|
|
Out-of-house consultants |
± 305 |
|
|
|
Total |
817 |
|
|
|
SOURCE: Committee briefing by USMEPCOM. |
|||
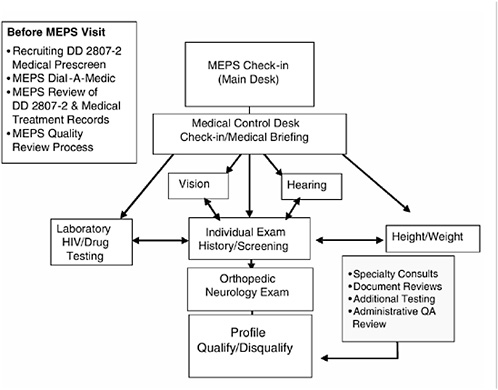
FIGURE 2-1 Medical evaluation process.
SOURCE: Committee briefing by USMEPCOM.
|
BOX 2-2 Goal: Identify orthopedic/neurological abnormalities that must be further investigated by appropriate medical personnel. Ask applicants:
Observe:
Testing: Each test movement is demonstrated by a technician—posture, arm, and leg extensions and flexions, etc. |
additional testing and consultations, weight reduction programs, etc. This profile determines whether the applicant in medically qualified to enlist, has a medical or physical condition that is likely to be considered for a waiver by the Services, or has a permanently disqualifying condition. For some conditions, further testing or consultation with a specialist is recommended.
As noted above, each service applies its own BMI and body fat standards. Applicants who exceed the weight standard and the body fat standard (used only for those who exceed the BMI standard) are advised
to bring their weight to the standard and return to the MEPS for reevaluation. The date the applicant may return is based on the amount of weight loss required. According to USMEPCOM Regulation 40-1, this date is set based on a waiting period of four days for every pound to be lost. If the applicant loses the required weight, it is not necessary to reevaluate body fat.
Figure 2-2 provides an overview of applicant medical outcomes. The MEPS perform approximately 380,000 medical examinations a year at a cost of $183 per examination (based on 1998 data). Applicants who receive a medical disqualification at the MEPS may apply to their respective Services for a waiver. Each Service has its own waiver authority. Those listed below are for active-duty service.
-
Army waivers are granted by the U.S. Army Recruiting Command.
-
Navy waivers are reviewed by the Bureau of Medicine and Surgery with recommendations forwarded to the chief, Naval Recruiting Command.
-
Air Force waivers are granted by the Air Education and Training Command surgeon general.
-
Marine Corps waivers are reviewed by the Bureau of Medicine and Surgery with recommendations forwarded to the commandant of the U.S. Marine Corps for a decision.
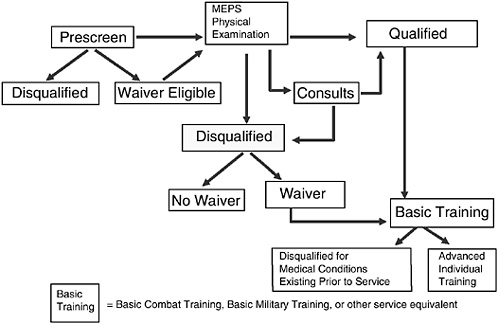
FIGURE 2-2 Applicant medical outcomes.
SOURCE: USMEPCOM (2004).
Data on each applicant are entered into the MEPCOM Integrated Resource System (MIRS). These data include biographical information, medical profile, disqualification coding by parts of the body, and waiver approvals. They can be used to describe the distribution of recruits across medical disqualification codes and corresponding International Classification of Diseases (ICD-9) codes. In addition, the percentage of applicants receiving waivers in each disqualification code can be obtained. However, there is no easy or routine mechanism for linking these data to injury and attrition in training or in the first term of service. In addition, as noted above, there is no information available about applicants who are turned away at the recruiting station without having been seen at the MEPS.
Physical Profile Serial System The military services have developed a medical profile system to relate body systems to military jobs. This system, dubbed PULHES, constitutes the minimum medical standards for military jobs. PULHES evaluates jobs in terms of the following six body systems:
-
P—Physical capacity or stamina. This factor, general physical capacity, normally includes conditions of the heart; respiratory system; gastrointestinal system; genitourinary system; nervous system; allergic, endocrine, metabolic, and nutritional diseases; diseases of the blood and blood forming tissues; dental conditions; diseases of the breast; and other organic defects and diseases that do not fall under other specific factors of the system.
-
U—Upper extremities. This factor concerns the hands, arms, shoulder girdle, and upper spine (cervical, thoracic, and upper lumbar) with regard to strength, range of motion, and general efficiency.
-
L—Lower extremities. This factor concerns the feet, legs, pelvic girdle, lower back musculature, and lower spine (lower lumbar and sacral) with regard to strength, range of motion, and general efficiency.
-
H—Hearing and ears. This factor concerns auditory acuity and disease and defects of the ear.
-
E—Eyes. This factor concerns visual acuity and diseases and defects of the eye.
-
S—Psychiatric. This factor concerns personality, emotional stability, and psychiatric diseases.
Numbers 1 through 4 are used to reflect levels of functional capacity. The basic purpose of the physical profile is to provide an index to overall functional capacity; that is, the functional capacity of a particular organ or system of the body is evaluated in determining the numerical designation
1, 2, 3, or 4. Specifically, 1 indicates a high level of medical fitness for the system being rated, 2 indicates some medical condition or physical defect that may require some activity limitations, 3 signifies one or more medical conditions or physical defects that may require significant limitations, and 4 signifies one or more medical conditions or physical defects of such severity that performance of military duty must be drastically limited. There are few military jobs that permit a 3 or 4. Thus, for those applying for military service, a 3 or 4 on any factor usually means a medical disqualification. Specific definitions of each number for each system can be found in Army Regulation 40-501, February 1, 2005.
Physical Fitness Testing The only physical fitness test currently given at the MEPS is the Air Force Strength Test. Recently AMSARA initiated an experiment to test recruit motivation and strength using the five-minute step test, the number of push-ups performed in one minute, and the Air Force Strength Test. This battery is called the Assessment of Recruit Motivation and Strength (ARMS). The hypotheses are that these tests will (1) identify those with undisclosed medical conditions or low motivation and (2) predict injury and attrition in basic training and advanced individual training. This experiment is currently being conducted at seven MEPS with Army applicants. Its intended use is to screen in applicants who were disqualified on body fat percentage or other fitness measures.
Delayed Entry Program
For most new recruits, there is a gap between the time when they sign their enlistment contract and the time when they actually travel to basic training. This gap—which can last up to one year in the case of a high school senior—is referred to as the delayed entry program (DEP)—(see Appendix 2-A for further detail). Some physical fitness testing and training is provided in the DEP. The Army is experimenting with the 1 1 1 test (1 mile run, 1 minute of push-ups, and 1 minute of sit-ups). There are criteria values the recruit is expected to reach before shipping to basic training. The Marine Corps also has an active program of physical fitness in the DEP, and the Air Force and the Navy provide information designed to encourage those in the DEP to maintain or improve their physical conditioning.
Current Physical Fitness Standards and Testing
Physical Fitness Standards
Technology may be reducing the physical demands of some civilian and military jobs. However, the DoD and the Services direct that every
member must maintain some minimal level of physical fitness (DoD Directive 1308.1). The philosophy that every member of a uniformed Service—regardless of job assignment—is a warrior is emphasized in all the Services. The demands expected to be placed on Service members in the future reinforce this notion. For example, Sager, Russell, Campbell, and Ford (2003) identified Army-wide common tasks for the future force that include numerous physically demanding tasks—such as react to combat situations, move through the battlefield, employ hand-to-hand techniques, control or evacuate crowds—that all soldiers will be required to perform.
While military service is now and is expected to remain a physically demanding occupation, there is little objective documentation of the level of fitness necessary to perform in most military occupational specialties (MOSs).2 With the exception of the Air Force’s Strength Aptitude Test (SAT)—and certain specialties with extreme physical fitness requirements, such as Navy SEALS, Army Special Forces, and Air Force Pararescue/ Recovery team members—the Services do not attempt to match the existing (or potential) physical fitness of recruits (or of Service members in general) with their MOSs. Rather, a collateral purpose of the military’s training system is to function as a screening system. The Air Force’s SAT—which includes no measures of aerobic fitness, endurance, or flexibility—sets a minimum standard for each Air Force specialty, based on actual measurement of physical job demands (weight lifted, pushed, pulled, etc.) in the specialty (Air Force Manual 36-2108, October 2003). The weight/force of each task is converted into equivalent performance on the SAT; the conversions are based on regression equations. Strength standards range from less than 40 up to 110 lbs. on the SAT for various Air Force jobs.
Documentation does not exist that would allow the committee to conduct an in-depth examination of the physical demands of each MOS in each Service (literally hundreds of distinct military jobs). On the surface, it is obvious that these jobs vary widely in the physical demands they place on incumbents as they go about their routine job tasks. For example, the daily tasks performed by an infantry soldier are far more physically demanding than the tasks performed by a personnel or accounting specialist. At the same time, the Services expect that all uniformed Service
TABLE 2-6 Military Service Physical Fitness Test Components
|
|
Army |
Navy |
Air Force |
Marine Corps |
|
Aerobic capacity |
2-mile run |
1.5-mile run |
1.5-mile run |
3-mile run |
|
Upper body muscular fitness |
Push-ups (2 minutes) |
Push-ups (2 minutes) |
Push-ups (1 minute) |
Pull-ups (men) Flexed arm hang (women) |
|
Abdominal muscular fitness |
Sit-ups (2 minutes) |
Curl-ups (2 minutes) |
Crunches (1 minute) |
Crunches (2 minutes) |
|
SOURCE: Adapted from Singer, Palmer, Rogers, and Smith (2002). |
||||
members will be able to perform numerous tasks that lie outside their “job” tasks. As noted in DoD Instruction 1308.3: “It is DoD policy that physical fitness is essential to combat readiness and is an important part of the general health and well-being for Armed Forces personnel.” Thus, the committee accepted the policy that military service itself requires a minimum level of physical fitness of all uniformed Service members. Accepting that assumption nonetheless requires some specification of what level of fitness is required. A reasonable starting point is an examination of the Services’ policies with regard to physical fitness, its maintenance, and its measurement.
Physical Fitness Testing
All Services have some form of routine physical fitness testing for all members. Consequences of failure to pass this test vary but may include involuntary discharge from the Service. The components included in these tests vary considerably by Service. Table 2-6 presents the components of the tests by Service. In addition, the standards for passing these tests also vary by Service (Table 2-7). Although the Services use different measures in their physical fitness tests, they all include components measuring aerobic capacity, upper body muscle strength, and abdominal muscle strength.
PHYSICAL ABILITY TESTING FOR CIVILIAN JOBS
It is useful to compare the civilian workplace with the military work setting in terms of the role and treatment of physical ability. The two differ in at least two dramatic ways. The first is that while physical performance is relevant for 100 percent of military jobs (since basic military
TABLE 2-7 Selected Minimum Standards on Service Physical Fitness Tests
training is a requirement for all), it is a factor in only a relatively limited set of civilian jobs.
The second is that while the military at present adopts a strategy of training to develop physical ability, rather than selecting for physical ability, civilian employers generally use a strategy of selecting for physical ability. Perhaps the prototypic civilian job with high physical demands is that of firefighter; physical ability testing is typically a part of the firefighter selection process (e.g., Biddle and Sill, 1999; Hogan and Quigley, 1994; Truxillo, Donahue, and Sulzer, 1996; Sharkey, 2000). While interests in increasing the number of women qualified for firefighter jobs may lead employers to encourage or even sponsor physical training programs, such programs are designed to prepare a potential applicant to take a preemployment physical test, in contrast to the postenlistment training done in the military setting. Consistent with the earlier observation of limited relevance of physical ability for civilian jobs, surveys of test use show that fewer than 10 percent of employers make use of physical ability measures (Salgado, Viswesvaran, and Ones, 2001).
A handbook chapter by Hogan (1991) remains the best compendium of research on the validity of physical ability measures in the civilian workplace. Hogan notes the use of two approaches to physical testing in the workplace, which use two very different types of tests. The first focuses on simulating the performance of a job-specific physical task (e.g., a firefighter dragging a hose, climbing a ladder). This approach relies on the fidelity with which the test matches exact job conditions as the basis for establishing the content validity of the test. In other words, the basis for the inference that the test is job-relevant is established on logical grounds due to the similarity of test content and job content. The second focuses on measurement of more fundamental physical constructs (e.g., muscular endurance, cardiovascular endurance). This approach uses job analysis to identify physical constructs that appear to be relevant to effective job performance and then examines empirical relationships between individuals’ scores on tests of those constructs and measures of criteria of interest (e.g., job performance).
Hogan provides tables with about 100 validity coefficients relating physical test scores to various criteria. The general finding is that physical tests chosen on the basis of job analysis as relevant for the criterion of interest do prove to be predictive of performance on the criterion of interest. Examining gender differences, she found consistent and large mean differences on measures involving strength and cardiovascular endurance. These test differences correspond to differences on the criteria of interest, leading Hogan to conclude that gender differences on the test are not a function of bias in the test. The focus is exclusively on gender and not on race. Legal challenges to the use of physical tests are not uncom-
mon; reviews of such litigation are found in Hogan and Quigley (1986) and Terpstra, Mohamed, and Kethley (1999).
Thus the civilian literature does document that individuals’ standing on physical ability measures relevant to the job setting is correlated with subsequent job performance. Because measures of individual job performance are generally not available in military settings, this civilian research reinforces the importance of attending to physical ability and fitness as a determinant of performance. One example of military research accomplished in this regard is a study of Marine Corps physical fitness testing and the relationship of the tests to performance of rifleman tasks in arduous environments (Davis, Dotson, and Sharkey, 1986). The researchers developed a taxonomy of combat tasks, created simulated combat missions, and identified a set of criterion tasks. The ability to perform effectively was predicted by various parts of the Marine Corps physical fitness test. This work was accomplished with using subjects and tasks from one military occupational specialty.
CONCLUSIONS AND RECOMMENDATIONS
To adequately assess the impact of medical standards on applicant flow and disqualification rates, information about screening that takes place before the MEPS physical is required.
Recommendation 2-1: The Services should develop a procedure for maintaining data from the DD Form 2807-2 (Medical Prescreening of Medical History Report) in an automated form for all applicants, including those who are disqualified at the recruiting station.
In order to understand the fitness requirements needed to perform the set of common military tasks in each service, an analysis of the requirements of each task is needed. While the requirements of a few tasks (e.g., carrying a loaded pack) have been studied, there is no systematic analysis of the entire set of common tasks within each service.
Recommendation 2-2: We recommend that research be undertaken to determine the fitness requirements (based on defining the functional requirements) of the common tasks cutting across military occupational specialties in each Service, with the goal of using this research to set fitness standards.
We note that the use of different fitness measures by the Services makes it difficult to assess fitness across the Services. While acknowledging that each Service may have reason to set standards differently from the others and may have reason to implement additional Service-specific
measures, the use of a common set of basic fitness measures would aid understanding of fitness across the Services.
Recommendation 2-3: We recommend that an inter-Service panel develop a common core set of uniformly administered fitness measures for use across the Services in research studies on physical fitness and its policy implications for military service. This does not preclude the use of additional Service-specific measures or the setting of differing standards by each Service.
APPENDIX 2-A: THE RECRUITING PROCESS3
Initial contacts between military recruiters and youth interested in military service are exploratory. In most cases, youth seek information from recruiters in more than one Service. In addition to providing information to the prospective enlistee, recruiters determine an applicant’s initial eligibility for military service. They ask questions regarding age, citizenship, education, involvement with the law, use of drugs, and physical and medical conditions that could preclude enlistment. Most prospects take an aptitude screening test at a recruiting office. Estimates are that 10 to 20 percent of prospects do not continue beyond this point (Waters, Laurence, and Camara, 1987:12).
Armed Services Vocational Aptitude Battery
Prospects who meet initial qualifications take the Armed Services Vocational Aptitude Battery (ASVAB), the first formal step in the process of applying to enlist in the Armed Forces. The ASVAB is a battery of tests used by DoD to determine enlistment eligibility and qualifications for military occupations. It consists of 10 tests (11 if the applicant takes the computer-adaptive test at a MEPS), four of which comprise the Armed Forces Qualification Test (AFQT): arithmetic reasoning, mathematics knowledge, word knowledge, and paragraph comprehension. The AFQT, a general measure of trainability and predictor of on-the-job performance, is the primary index of recruit aptitude.
AFQT scores, expressed on a percentile scale, reflect an applicant’s standing relative to the national population of men and women ages 18 to
|
3 |
Adapted from the web version of Population Representation in the Military Services, FY2002 (<http://www.dod.mil/prhome/poprep2002/>). |
TABLE 2-A-1 Armed Forces Qualification Test (AFQT) Categories and Corresponding Percentile Score Ranges
|
AFQT Category |
Percentile Score Range |
|
I |
93-99 |
|
II |
65-92 |
|
IIIA |
50-64 |
|
IIIB |
31-49 |
|
IV |
10-30 |
|
V |
1-9 |
23.4 The scores are grouped into five categories based on the percentile score ranges shown in Table 2-A-1. Persons who score in Categories I and II tend to be above average in trainability; those in Category III, average; those in Category IV, below average; and those in Category V, markedly below average. By law, Category V applicants and those in Category IV who have not graduated from high school are not eligible for enlistment. Over and above these legal restrictions, each Service prescribes its own aptitude and education criteria for eligibility. Each Service uses combinations of ASVAB test scores to determine an applicant’s aptitude and eligibility for different military occupations.
Education Credentials
DoD implemented a three-tier classification of education credentials in 1987, as follows:
-
Tier 1—Regular high school graduates, adult diploma holders, and nongraduates with at least 15 hours of college credit.
-
Tier 2—Alternative credential holders, including those with a General Education Development (GED) certificate of high school equivalency.
-
Tier 3—Those with no education credential.
The system was developed after research indicated a strong relationship between education credentials and successful completion of the first
term of military service (Flyer, 1959; Elster and Flyer, 1981). Research shows that educational attainment of youth predicts first-term military attrition (U.S. Department of Defense, 1996; Laurence, 1997). In consultation with the National Research Council/National Academy of Sciences, DoD developed a mathematical model that links recruit quality and recruiting resources to job performance (U.S. Department of Defense, 2000). The model was then used to establish the recruit quality benchmarks now in effect. Service programs are required to ensure that a minimum of 90 percent of first-time recruits are high school diploma graduates. At least 60 percent of recruits must be drawn from AFQT Categories I–IIIA; no more than 4 percent of the recruits can come from Category IV. This DoD policy does not prohibit the Services from setting their own targets above these benchmarks. These benchmarks were set by examining the relationship between costs associated with recruiting, training, attrition, and retention using as a standard the performance level obtained by the reference cohort of 1990, the cohort that served in Operation Desert Shield and Operation Desert Storm. Thus, these benchmarks reflect the recruit quality levels necessary to minimize personnel and training costs while maintaining Desert Shield/Desert Storm cohort performance (Sellman, 1998).
The Services have different standards for individuals in each tier. Generally, Tier 3 applicants must have higher AFQT test scores than Tier 2 applicants, who must have higher test scores than Tier 1 individuals.
Physical Examinations
If an applicant achieves qualifying ASVAB scores and wants to continue the application process, he or she is scheduled for a physical examination and background review at one of the MEPS. The examination assesses medical fitness for military service. It includes measurement of blood pressure, pulse, visual acuity, and hearing; blood testing and urinalysis; drug and HIV testing; and medical history. Some Services also require tests of strength and endurance. If a correctable or temporary medical problem is detected, the applicant may be required to get treatment before proceeding. Other applicants may require a Service waiver of some disqualifying medical conditions before being allowed to enlist.
Moral Character Standards
Each applicant must meet rigorous moral character standards. In addition to the initial screening by the recruiter, an interview covering each applicant’s background is conducted at the MEPS. For some individuals,
a financial credit check or a computerized search for a criminal record is conducted. Some types of criminal activity are clearly disqualifying; other cases require a waiver, wherein the Service examines the applicant’s circumstances and makes an individual determination of qualification. Moreover, applicants with existing financial problems are not likely to overcome those difficulties on junior enlisted pay. Consequently, credit histories may be considered as part of the enlistment decision.
Occupational Area Counseling
If the applicant’s ASVAB scores, education credentials, physical fitness, and moral character qualify for entry, he or she meets with a Service classification counselor at the MEPS to discuss options for enlistment. Up to this point, the applicant has made no commitment. The counselor has the record of the applicant’s qualifications as well as computerized information on available Service training or skill openings, schedules, and enlistment incentives.
A recruit can sign up for a specific skill or for a broad occupational area (such as the mechanical or electronics areas). In the Army, most recruits (95 percent) entered for specific skill training; the others were placed in a military occupational specialty during basic training. In the Air Force, approximately 70 percent of recruits entered for a specific skill, while the rest signed up for an occupational area and were classified into a specific skill while in basic training. In the Navy, approximately 77 percent of recruits enlisted for a specific skill, while the rest went directly to the fleet after basic training, 20 percent classified in airman, fireman, or seaman programs and 3 percent entered school 12 to 18 months later. Approximately 97 percent of Marine Corps enlistees entered with a guaranteed occupational area and were assigned a specific skill in that area after recruit training; the rest enlisted with either a specific job guarantee or assignment to a job after recruit training.
Normally, an applicant will be shown a number of occupations. In general, the higher the individual’s test scores, the more choices he or she will have. While the process differs by Service, specific skills and occupational groupings are arranged similarly to an airline reservation system, with the training “seat” and time of travel (to recruit training) based either on the school or the field unit position openings. The counselor discusses the applicant’s interests and explains what the Service has to offer. The counselor may suggest incentives to encourage the applicant to choose hard-to-fill occupational specialties. The applicant, however, is free to accept or reject the offer. Some applicants do not decide immediately but take time to discuss options with family and friends; others decide not to enlist.
The Delayed Entry Program
When the applicant accepts an offer, he or she signs an enlistment contract. Only a small proportion of new enlistees is sent to a recruit training center from the MEPS within a month of enlistment. Most enter the DEP, which allows up to a year before the individual reports for duty, with up to a 365-day extension upon approval by the respective Service secretary (10 U.S.C. 513, as amended October 1999). The DEP controls recruit flow into training seats at technical schools. The Services also use the DEP to prepare enlistees for basic training, providing them with supervised exercise programs, if needed. The DEP acclimates recruits to the military and enhances training performance, which decreases attrition (Gilmore, 2001). Average time in the DEP is between three and five months.
Qualified high school students may enlist in the DEP with a reporting date after graduation; their enlistment contract is contingent upon successfully completing high school. Not all DEP enlistees actually enter active duty. By Service, an average of 13 to 21 percent of individuals in the DEP changed their minds and asked to be released from their enlistment contracts in FY 2002. The Services consider enlistment in the DEP a serious commitment, but they do not require youth to enter military service against their will.