
4
Physical Fitness and Musculoskeletal Injury
Military basic training is designed to be an intense program that orients and indoctrinates new recruits to the Service. The selection process for enlisted personnel, as currently designed, does not include any measurement of physical fitness. Thus, the basic training system must be capable of providing effective physical fitness training to individuals who vary widely in the levels of fitness they bring to the system. According to the Army, “Few soldiers enter the Army physically fit for the arduous duties ahead of them” (U.S. Department of the Army, 2005:5). As noted in Chapter 2, all Services routinely test the physical fitness of personnel during basic training, and in order to graduate from basic training, recruits must have demonstrated that they will be capable of passing these routine physical fitness tests.1 In that respect, basic training performs an expensive screening function for the Services.
Because a key purpose of basic training is to ensure that graduates are able to meet the physical demands of serving as a combat soldier, physical training is a central element of the basic training protocol for all Services. While specific physical training procedures differ across the Services, the demands are substantial in all branches. Since the physical
fitness of entering recruits is not evaluated in advance of basic training and recruits are not required to meet physical fitness standards prior to their transportation (“shipping”) to basic training, the physical training element of basic training is expected to have widely varying effects on recruits. Those who enter basic training with a relatively low level of physical fitness would be expected to find the physical training component of basic training to be more demanding and stressful than those who enter with high physical fitness.
This chapter summarizes the available evidence regarding the relationship between physical fitness and negative outcomes during the first term of military service. Particular focus is given to orthopedic injuries and attrition, both being frequent and very expensive negative outcomes in military recruits. Because military personnel are recruited from the adolescent population, the physical fitness status of contemporary American youth is also reviewed. Our knowledge of the impact of low physical fitness on negative outcomes in military populations is summarized, and the scientific basis of musculoskeletal injuries is briefly presented. Finally, several possible approaches to reducing injuries and attrition in basic trainees are considered. The approaches presented are based on application of the scientific evidence regarding the relationship between physical fitness and injury or attrition in military personnel.
CONCEPTS OF PHYSICAL FITNESS
Definitions of Physical Fitness
Physical fitness has been verbally and operationally defined in numerous ways. Nonetheless, certain common themes are evident in most of the verbal and operational definitions that have come into wide use over the past century. Most verbal definitions of physical fitness allude to a person’s ability to perform vigorous physical tasks. For example, Clarke defined physical fitness as “the ability to perform daily tasks with vigor and alertness, without undue fatigue, and with ample energy to enjoy leisure pursuits and to meet unforeseen emergencies” (Clarke, 1967). If Clarke’s classic and widely cited definition is applied to first-term military personnel in combat occupational specialties, a soldier who is physically fit would be capable of meeting the considerable physical demands of combat soldiering without experiencing fatigue at a level that unduly limits job performance. In other words, physical fitness is one of the functional capacities of the soldier’s job (see the discussion of functional capacity later in this chapter).
Operational definitions of physical fitness have evolved dramatically over previous decades. However, virtually all accepted operational defi-
TABLE 4-1 Definitions of Health-Related Fitness Components
|
Component of Physical Fitness |
Definitiona |
Relationship to Physical Performance and Healthb |
|
Cardiorespiratory endurance |
Ability to sustain moderate intensity, whole-body activity for extended periods |
Enhanced physical working capacity Reduced fatigue Reduced risk of coronary heart disease |
|
Muscular strength |
Maximum force applied with a single muscle contraction |
Enhanced functional capacity (lifting, carrying) Reduced risk of low back pain |
|
Muscular endurance |
Ability to perform repeated, high-resistance muscle contractions |
Enhanced functional capacity (lifting, carrying) Reduced risk of low back pain |
|
Flexibility |
Range of motion in a joint or series of joints |
Enhanced functional capacity (bending, twisting) Reduced risk of low back pain |
|
Body composition |
Fatness; ratio of fat weight to total body weight |
Enhanced functional capacity Reduced risk of chronic disease |
|
aFrom Clarke (1967). bFrom Pate and Shepard (1989). |
||
nitions present physical fitness as a multidimensional construct. While many earlier operational definitions of physical fitness included numerous motor performance capacities (e.g., coordination, balance, agility), most contemporary definitions view physical fitness as comprised of a small number of core components, each of which is known to determine one’s ability to perform certain types of demanding physical tasks. These core components include cardiorespiratory endurance, muscular strength, muscular endurance, flexibility, and body composition. Collectively, these components have sometimes been referred to as “health-related physical fitness” (U.S. Department of Health and Human Services, 1996). Table 4-1 presents definitions of each of these components of physical fitness; the table also provides a brief indication of the relationship of each component to physical performance and to health.
Measurement of Physical Fitness
Because physical fitness has been conceptualized as a multidimensional construct comprised of several independent factors, comprehensive tests of physical fitness typically include multiple test items. Numerous test batteries have been developed for use in laboratory, quasi-
laboratory, and field settings. The laboratory measures of physical fitness typically have been used as criterion measures for development and validation of quasi-laboratory and field measures. For example, maximal aerobic power or maximal oxygen consumption (VO2max) is a laboratory measure of cardiorespiratory endurance that involves performance of exhaustive exercise on an ergometric device (e.g., treadmill, cycle ergometer) while metabolic gases are collected and analyzed. VO2max is the “gold standard” that has been used as the basis for validating quasi-laboratory measures such as the Physical Work Capacity-170 test (McMurray et al., 1998) and field measures, such as distance runs (Kline et al., 1987; Cureton et al., 1995).
Most contemporary field tests of physical fitness developed for use in the civilian population include test items that are designed to measure cardiorespiratory endurance, muscular strength and endurance of the abdominal musculature, muscular strength and endurance of the upper arm musculature, flexibility of the low back or hamstring region, and body composition. An example is FITNESSGRAM, which is the most widely used physical fitness test battery in U.S. schools (Cooper Institute, 2004). Table 4-2 summarizes the alternate test items that are available in the FITNESSGRAM protocol. Each of the items included in FITNESSGRAM has been validated against criterion laboratory measures of fitness. For each item, health-related criterion-referenced standards are available (Cooper Institute, 2004).
TABLE 4-2 FITNESSGRAM Test Battery
|
Components of Physical Fitness |
FITNESSGRAM Test Itemsa |
|
Cardiorespiratory endurance |
The PACER, one-mile run, or walk test |
|
Muscular strength and endurance of the abdominal musculature |
Curl-up |
|
Muscular strength and endurance of upper arm musculature |
90-degree push-up, modified pull-up, pull-up, or flexed arm hang |
|
Flexibility of the low back or hamstring region |
Back-saver sit and reach |
|
Body composition |
Skinfold measurements or body mass index |
|
aFrom Cooper Institute (2004). |
|
MILITARY FITNESS STANDARDS AND TESTS
Test Protocols
We addressed the issue of physical fitness requirements for military service in Chapter 2. As noted there, each Service routinely tests the physical fitness of its personnel. Administration of these tests is highly decentralized; tests are usually administered at the unit level, wherever in the world that unit happens to be located. The Services have implemented instructions to help ensure that these tests are administered in a standardized fashion regardless of unit or location. For example, the Army notes: “The APFT [Army Physical Fitness Test] consists of push-ups, sit-ups, and a 2-mile run, done in that order on the same day. Soldiers are allowed a minimum of ten minutes and a maximum of twenty minutes rest between events. All three events must be completed within two hours. The test period is defined as the period of time that elapses from the start to the finish of the three events” (U.S. Department of the Army, 2005:5). Table 4-3 displays the components of each Service’s physical fitness assessment.
Fitness Standards
The Services take physical fitness seriously. As noted by a joint-Service workshop (Military Operational Medicine Research Program, 1999):
All military personnel, regardless of occupational specialty, unit assignment, age, or gender should acquire a base level of general physical fitness. This physical fitness promotes a standard of physical readiness
TABLE 4-3 Military Service Physical Fitness Test Components
|
|
Army |
Navy |
Air Force |
Marine Corps |
|
Aerobic capacity |
2-mile run |
1.5-mile run |
1.5-mile run |
3-mile run |
|
Upper body muscular fitness |
Push-ups (2 minutes) |
Push-ups (2 minutes) |
Push-ups (1 minute) |
Pull-ups (men) Flexed arm hang (women) |
|
Abdominal muscular fitness |
Sit-ups (2 minutes) |
Curl-ups (2 minutes) |
Crunches (1 minute) |
Crunches (2 minutes) |
|
SOURCE: Adapted from Singer et al. (2002). |
||||
commensurate with the active life style and deployability of the military profession. Such a DoD-wide generalized fitness standard will enhance overall health, physical well-being, military readiness, and appearance. This base level of fitness can then be used as a springboard to train personnel for further physically demanding occupational specialties or unit assignments and deployable combat readiness.
Military personnel who cannot maintain adequate levels of physical fitness are subject to various administrative penalties, up to and including dismissal from military service. As one Army publication notes, “Soldiers without medical profiles, who repeatedly fail the APFT [Army Physical Fitness Test], will be barred from re-enlistment or processed for separation from the service. A repetitive failure occurs when a soldier fails a record test, the soldier is provided adequate time and assistance to improve his or her performance, and failure occurs again” (U.S. Department of the Army, 2003:73).
Table 4-4 displays selected minimum requirements for passing the physical fitness assessments for personnel who have completed their initial entry training.
The rationale for physical fitness assessment components—and for the levels required to pass the assessments—varies by Service. For example, “The APFT [Army Physical Fitness Test] provides a measure of upper and lower body muscular endurance. It is a performance test that indicates a soldier’s ability to perform physically and handle his or her own body weight” (U.S. Department of the Army, 2005:5). Constable and Palmer (2000) describe the Services’ programs and their history and (to some extent) the rationale behind their programs. Standards to pass these assessments have generally been set on the basis of normative data collected by each Service.
FITNESS IN THE YOUTH POPULATION AND IN MILITARY PERSONNEL
This section presents a comparison of the physical fitness of military personnel (as reported in a variety of published studies) to the physical fitness of contemporary American youth (as assessed by the National Health and Nutrition Examination Survey).
The U.S. Population
The National Health and Nutrition Examination Survey (NHANES) began in 1970. It was designed to monitor the trends in prevalence, awareness, and treatment of selected risk factors and diseases of Americans. The participants in NHANES are civilian, noninstitutionalized residents
TABLE 4-4 Selected Minimum Standards on Service Physical Fitness Tests
and are randomly sampled to be representative of Americans. The examination consists of an in-home interview followed by medical tests in the mobile exam center. Beginning in 1999, NHANES examined the cardiorespiratory fitness of participants, which provides population data on the fitness levels of Americans.
Cardiorespiratory fitness was measured with a submaximal treadmill exercise test. The protocol consisted of a 2-minute warm-up, two 3-minute exercise periods, and a 3-minute recovery period. The grade and speed of the treadmill was dependent on the participant’s physical activity readiness code, age, and body mass index (BMI). During the first exercise stage, the participant should attain approximately 55 to 65 percent of their age-predicted maximal heart rate. During the second stage of exercise, the participant should attain approximately 70 to 80 percent of it. VO2max was estimated according to the heart rates achieved at the submaximal work rates. Values that were greater than 75 ml/kg/min were recoded to 75 ml/kg/min.
Datasets were obtained from the web site of the Centers for Disease Control and Prevention (CDC). Both NHANES 1999-2000 and NHANES 2001-2002 were used in the analyses. The downloaded files provided demographic information and estimated VO2max. Percentile ranks of estimated VO2max of 16- to 24-year-olds were calculated. The sample size for VO2max for men and women was 1,115 and 927, respectively. Separate analyses were conducted to assess the association between race and cardiorespiratory fitness. The participants were stratified into three groups: non-Hispanic white, non-Hispanic black, and Mexican American. Due to small numbers in the “other” category, those participants were excluded from the racial analysis (n = 175). All analyses were performed using SUDAAN (a program of analytic procedures designed to analyze complex data sets) to allow for the population weights and sampling design.
Military Personnel
A search of the National Library of Medicine’s online MEDLINE database was conducted using the key words: fitness, weight status, military, and recruits. Articles were included if cardiorespiratory fitness expressed as ml/kg/min or two-mile run time was reported. A total of seven articles were included in the final analysis. All seven of the articles measured Army recruits, and the mean age ranged from 18 to 21.5 years. Three studies (Knapik et al., 2001b; Patton, Daniels, and Vogel, 1980; Sonna et al., 2001) administered a treadmill running protocol using open-circuit indirect calorimetry to determine VO2peak, and one study used the Astrand cycle ergometer test to estimate VO2max (Kowal, Patton, and Vogel, 1978). The remaining three studies measured cardiorespiratory fitness with the
two-mile run (Snoddy and Henderson, 1994; Popovich et al., 2000; Knapik et al., 2003a).
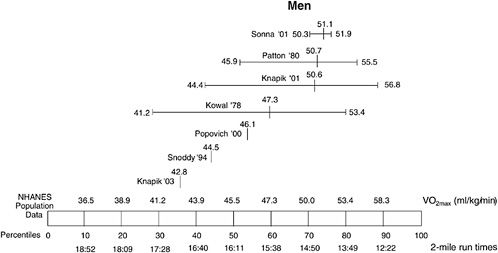
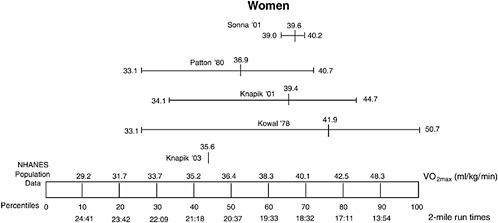
The mean estimated or measured VO2max and standard deviations of military personnel were extracted from seven articles and were plotted against the percentile rank of estimated VO2max of 16- to 24-year-olds from NHANES 1999-2000 and NHANES 2001-2002. Some articles reported cardiorespiratory fitness as two-mile run times. These values were transformed to estimated VO2max in ml/kg/min using regression equations from Mello, Murphy, and Vogel (1988). The correlations between VO2max and two-mile run times were -0.91 for men and -0.89 for women (Mello, Murphy, and Vogel, 1988). The two-mile run times that correspond to VO2max for the percentile ranks are displayed in the figures, which were also transformed using the regression equations from Mello and colleagues (Mello, Murphy, and Vogel, 1988).
The VO2max of male military recruits relative to the U.S. population of 16- to 24-year-olds is presented in Figure 4-1, and the same information is presented in Figure 4-2 for female recruits. For men, the mean VO2max ranged from the 35th to 75th percentiles, and the standard deviations ranged from the 30th to 90th percentiles. Fitness levels of male military personnel were in the upper 70 percent of the distribution, corresponding to a minimum VO2max of 41.2 ml/kg/min or a 2-mile run time of 17 minutes and 28 seconds. For women, the mean VO2max ranged from the 43rd to 77th percentiles, and the standard deviations ranged from the 27th to 99th percentiles. Fitness levels of female military personnel were in the upper 75 percent of the distribution, corresponding to a minimum VO2max of 33.1 ml/kg/min or a 2-mile run time of 22 minutes and 29 seconds. To assess the relationship between fitness and race, maximal oxygen consumption of non-Hispanic whites, non-Hispanic blacks, and Mexican Americans was compared. There were no differences in VO2max among the three races for the men; and for women, non-Hispanic blacks had lower VO2max compared with Mexican Americans (p = 0.042).
Secular Trends
In 1954, the Kraus-Weber Test battery found that the fitness levels of American children were much lower than those of European children (Kraus and Hirschland, 1954). These results brought national attention to children’s fitness levels, and President Eisenhower responded by creating the President’s Council on Youth Fitness (now the President’s Council on Physical Fitness and Sports) to promote youth fitness (Corbin and Pangrazi, 1992). This began four decades of field tests to measure components of fitness (U.S. Department of Health and Human Services, 1985, 1987; Reiff et al., 1986). It is difficult to determine secular trends of cardio-
respiratory fitness with these different field tests because the mile run was not included in test batteries until the 1980s (Corbin and Pangrazi, 1992).
Other sources of data to assess secular trends in cardiorespiratory fitness are the Health Examination Survey Cycle III (1966-1970) and the most recent NHANES (1999-2002). The Health Examination Survey included a treadmill exercise test for 12- to 17-year-olds (McDowell, 1989; Gillum, 1989) and NHANES (1999-2002) administered a treadmill exercise test to persons ages 12 to 49. Both protocols had two incremental work stages ranging from 2-3 minutes. The protocols were not identical; therefore, the comparison should be interpreted with caution. For youth ages 12 to 17, the mean VO2max for boys decreased approximately 10 percent during the 35-year period, whereas there was no difference in mean VO2max for girls.
Sharp and colleagues (2002) compared the cardiorespiratory fitness levels of men and women entering the Army over a 20-year period (1978-1998). VO2max was measured using open-circuit indirect calorimetry during a treadmill running protocol. The mean VO2max of men in the 1978 sample was equivalent to the 1998 sample (50.7 ± 4.8 ml/kg/min in 1978 and 50.6 ± 6.2 ml/kg/min in 1998). Among women, the mean VO2max in the 1998 sample was 6 percent higher than the 1978 sample (36.9 ± 3.8 ml/ kg/min in 1978 and 39.2 ± 5.1 ml/kg/min in 1998). Thus, the recruits in 1998 had cardiorespiratory fitness levels that were equal to or greater than recruits in 1978.
PHYSICAL FITNESS, MUSCULOSKELETAL INJURY, AND ATTRITION IN MILITARY BASIC TRAINING
This section focuses on the relationship of physical fitness to injury and attrition in basic training. Data are presented demonstrating that low physical fitness is closely associated with diminished performance in basic training (as measured by injury and attrition status).
Prevalence of Musculoskeletal Injuries in the Applicant Population
Even before they are shipped to basic training, some potential recruits arrive at the military entrance processing station (MEPS) with chronic injuries and other musculoskeletal conditions. Some of these conditions preclude military service, while others, following review through the waiver system, are deemed to be admissible. It is also highly probable that there is a group of recruits with musculoskeletal conditions that go undetected at the MEPS.
As a general marker of the prevalence of musculoskeletal conditions in the applicant population, the committee accessed information on reasons for medical disqualifications (or “failures”) at the MEPS. These data were provided by the U.S. Military Enlistment Processing Command (USMEPCOM). It should be noted that, in general, recruiters do not send a potential applicant to a MEPS if he or she has a musculoskeletal condition that the recruiter perceives will not be waived. Thus, in terms of providing information about the prevalence of musculoskeletal conditions in the applicant population, these data suffer from a recruiter selection bias common to all MEPS databases.
For the period May 1, 2003, to April 30, 2005, there was a total of approximately 429,116 applicants who underwent the physical/medical screen at the MEPS (this is essentially the number of potential applicants who successfully completed the Armed Services Vocational Aptitude Battery exam). Of these, 239,940 (60 percent) entered a Service. Among the total accessions, there were 26,326 (11 percent) who were “medically disqualified” (i.e., did not pass the screen) at the MEPS and received a waiver. An additional 43,708 applicants were medically failed and either did not apply for a waiver or else were not waived and thus were not accessed. (See tables in Appendix B.)
The most common reasons for medical failure were being overweight (23 percent), self-reported marijuana use (13 percent), and musculoskeletal conditions of the upper or lower extremities (10 percent). The codes used for upper or lower extremity musculoskeletal conditions reflect a great variety of disorders, and many of the codes are unspecific (i.e., “other lower extremity conditions”). To the extent possible, the basic distribution of these codes is described below.
For the lower extremity, knee and patella conditions were the most common category, accounting for 15 percent of lower extremity failures. Within the knee category, repairs to the anterior cruciate ligament accounted for 7 percent of lower extremity failures. However, it should be noted that a history of this repair is widely perceived by the military Services to be a waiverable condition, and thus is probably overrepresented in this data source relative to the general applicant population. Ankle and foot conditions accounted for 4 percent of lower extremity failures, joint pain or stiffness for 8 percent, and presence of an orthopedic device or “complications of medical care” for an additional 5 percent. The remaining conditions (68 percent of all lower extremity failures) represented a wide variety of conditions, no single one of which was larger than 2 percent.
For the upper extremity, shoulder conditions were the most common category, accounting for 12 percent of all upper extremity failures. Within the shoulder category, a variety of types of shoulder dislocation codes
accounted for 8 percent of all upper extremity failures, and rotator cuff conditions accounted for 2 percent. Elbow, forearm, and upper arm conditions accounted for 3 percent, finger and wrist fractures and amputations for 3 percent, and presence of an orthopedic device or complications of medical care for 7 percent. The remaining 75 percent comprised a wide variety of conditions, no single one of which is larger than 2 percent.
There is no systematic linkage of the information from the MEPCOM medical failure database to medical data on incident injury in basic training. There is also no routine linkage of the medical failure database to administrative data on basic training attrition. Because of the lack of linkage to outcomes and the great diversity and lack of specificity of the musculoskeletal conditions reported above, the committee did not make any further use of this data source.
Incidence of Injury and Attrition
Musculoskeletal injuries resulting from basic and advanced individual training pose the single most significant medical impediment to military readiness (Jones and Hansen, 2000). In 1994 and 1995, these types of injuries were the leading cause of disability in all the Services and were the leading cause of hospitalizations for the Army, the Navy, and the Marine Corps (DoD Injury Surveillance and Prevention Work Group, 1999). High incidence rates of musculoskeletal injuries impose enormous consequences on the military, including monetary costs, lost work or training time, and recruit attrition. Depending on the data source and the type of injury, average days lost per injury can range from 2.3 days for strains and sprains to over 100 days for more acute conditions, such as bone fractures (DoD Injury Surveillance and Prevention Work Group, 1999; Knapik et al., 1993; Lauder et al., 2000; Reynolds et al., 1994). Overuse bone injuries such as stress fractures also account for a significant number of lost duty days (averaging 6.2 days per injury) (Reynolds et al., 1994). In addition, studies have shown that musculoskeletal injuries are responsible for a significant number of limited-duty days. Common soft-tissue overuse injuries such as tendonitis and muscle strains have resulted in 3 to 7 limited-duty days per injury (Knapik et al., 1993).
Training injury rates have been estimated from 10 to 15 per 100 recruits per month for male recruits, 10 to 25 per 100 recruits per month for female recruits, and 6 to 12 per 100 recruits per month for infantry (Almeida et al., 1999; Bell et al., 2000; Jones et al., 1993b; Knapik et al., 1993; Kowal, 1980; Reinker and Ozburne, 1979; Riddell, 1990; Shaffer et al., 1999b; Tomlinson, Lednar, and Jackson, 1987). Among these populations, the cumulative incidence of musculoskeletal injuries that required medical attention has been reported to be between 8 and 55 percent for
men and between 17 and 62 percent for women (Almeida et al., 1999; Cowan et al., 1996; Jones et al., 1993a, 1993b; Kaufman et al., 1999; Knapik et al., 1993; Kowal, 1980; Reinker and Ozburne, 1979; Reynolds et al., 1994; Shaffer et al., 1999b). In studies that reported injury rates for both male and female recruits, the injury rate for women was twice as high as the injury rate for men.
A number of previous studies have established a range of risk factors for injury during military training. Recent reviews of risk factors for training-related injuries (Jones and Knapik, 1999; Kaufman, Brodine, and Shaffer, 2000) identified a range of risk factors for injury in the military, including low levels of physical fitness (Shaffer, 1999a; Jones et al., 1993a; Knapik et al., 1993), high and low flexibility (Knapik et al., 1993), anatomical factors (Kaufman et al., 1999), and smoking (Reynolds et al., 1994).
As noted throughout this volume, attrition is a substantial problem among first-term military enlistees. However, the degree to which the problem is attributed directly to musculoskeletal injuries is less clear. A Government Accounting Office report has stated that the Department of Defense lacks consistent and complete information on the causes of attrition (U.S. Senate Committee on Armed Services, Subcommittee on Personnel, 1997). According to this report, a significant portion of first-term attrition occurs during the first six months in the service. For instance, in 1994, 6-month attrition rates were 15.7 percent for the Army, 15.7 percent for the Navy, 12.5 percent for the Marine Corps, and 11.6 percent for the Air Force. This means that, in one year, more than 25,000 new recruits did not remain in the military beyond the training phase.
Poor Physical Fitness as a Risk Factor for Injury and Attrition
Injury
Research on the relationship between physical fitness and training injuries in men and women has been conducted by several researchers (Jones, 1992; Jones et al., 1993a; Westphal et al., 1996). These studies found that individuals with faster performance on a timed run (more aerobically fit) suffered significantly fewer injuries than slow runners. For men, 36 percent of the fast runners and 61 percent of the slow runners reported musculoskeletal injuries (Jones, 1992); for women, 50 percent of the fast runners and 71 percent of the slow runners reported injuries (Westphal et al., 1996). More recent research suggests that the effect of cardiorespiratory fitness may possibly interact with BMI, with leaner, slower recruits tending to have the highest risk of injury (Jones, Darakjy, and Knapik, 2004).
To model the effect of low cardiorespiratory fitness on injury and attrition, the committee used data provided by the U.S. Army Center for
Health Promotion and Preventive Medicine (USACHPPM) from Fort Jackson, South Carolina. Injury data came from a prospective cohort study of six battalions of male (n = 2,945) and female (n = 2,080) Army trainees during nine weeks of the basic combat training at Fort Jackson between 1997 and 2001 (Knapik et al., 2001a; Jones, Darakjy, and Knapik, 2004). Injury data were abstracted from clinic and hospital medical records. Attrition data were taken from the same source for 2000 and from another Fort Jackson study conducted in 2001 (Knapik et al., 2004a) in order to ensure sufficient numbers and a consistent definition of attrition. Attrition was defined as failure to graduate from basic training for any reason, including preexisting medical conditions, failure to adapt to military life, serious injury during basic training, or failure to meet standards on skills. Some of these soldiers go on to repeat basic training and eventually graduate. Height and weight data were taken at the MEPS and performance on the timed run was measured at entry to basic training. Demographic characteristics of the recruits used in the injury analyses are shown in Table 4-5. Although this data source provides information only for Army recruits, comparable data for the other Services were not readily accessible.
To examine injury and attrition risk, USACHPPM initially stratified subjects by quartiles of BMI and run-time performance. Following examination of the data, they combined the middle two quartiles to improve the precision of the estimates of injury attrition risk. Table 4-6 shows the associations of successive levels of run time and BMI with injury, and
TABLE 4-5 Demographic Features of Fort Jackson Study Sample
Table 4-7 shows their association with attrition. Two immediate conclusions can be made from these tables:
-
The risk of both injury and attrition is markedly higher for female recruits.
-
Physical fitness and BMI both affect the risk of injury and attrition; however, fitness generally appears to be a stronger predictor than BMI.
A further analysis of these data by the commitee, controlling for the confounding effects of gender and BMI, indicate that the risk of injury rises by 13 percent for each 1-quartile drop in performance (increase in run time), averaged across gender and BMI categories (Table 4-8). This analysis assumes an approximately average effect of cardiorespiratory fitness across gender and BMI categories, which is reasonable based on the pattern of risk presented in Tables 4-6 and 4-7.
There are striking differences between men and women in the risk of injury during Army basic training (adjusted risk ratio of 2.26, 95 percent confidence interval, CI: 2.08, 2.45). It has been argued that these gender differentials are largely driven by the lower physical fitness of the female recruit population (Bell et al., 2000). However, we observed that adjustment for cardiorespiratory fitness (in quartiles) had limited impact on the risk ratio for women relative to men, even when we assigned midpoint scores to the cardiorespiratory fitness quartiles (adjusted risk ratio of 2.12, 95 percent CI: 1.95, 2.31)
The committee also projected the effect on injury risk of increases or decreases in the distribution of cardiorespiratory fitness of the recruit population (as measured by the APFT standardized timed 2-mile run test), controlling for BMI within quartiles. Our analysis shows modest but definite gradients in injury risk associated with cardiorespiratory fitness. For men, decreases in the cardiorespiratory fitness of the recruits (e.g., due to decreases in the general youth population) so that all recruits were at currently accepted minimal standards (i.e., almost all in the lowest quartile of fitness) would increase the injury risk from 21.2 percent (95 percent CI: 19.7, 22.7) to 26.2 percent (95 percent CI: 24.7, 27.8). If all female recruits were in the current lowest quartile, the injury risk would increase from 47.8 percent (95 percent CI: 45.7, 50.0) to 54.4 percent (95 percent CI: 52.3, 56.6). Correspondingly, there would be reductions in the injury risk for both men and women if the distribution of cardiorespiratory fitness could be shifted so that recruits had greater physical fitness (e.g., through introducing a standard for cardiorespiratory fitness). Figure 4-3 illustrates the shifts in injury risk that would occur as a result of changes in the distribution of physical fitness.
TABLE 4-6 Risk of Injury by Body Mass Index (BMI) and 2-Minute Run Time
|
|
Fast Run Time (25%) |
Medium Run Time (50%) |
Slow Run Time (25%) |
||||
|
|
Injury Risk |
Risk Ratio (95% CI) |
Injury Risk |
Risk Ratio (95% CI) |
Injury Risk |
Risk Ratio (95% CI) |
Total |
|
Men |
|||||||
|
Low BMI (25%) |
16.5% |
1.0 (referent) |
21.4% |
1.3 (0.9, 1.8) |
28.7% |
1.7 (1.2, 2.6) |
20.7% |
|
Medium BMI (50%) |
19.6% |
1.2 (0.7, 2.1) |
19.3% |
1.2 (0.9, 1.6) |
25.1% |
1.5 (1.1, 2.1) |
20.5% |
|
High BMI (25%) |
20.5% |
1.2 (0.7, 2.1) |
19.8% |
1.2 (0.9, 1.7) |
26.5% |
1.6 (1.2, 2.2) |
22.8% |
|
Total |
18.6% |
|
20.0% |
|
26.2% |
|
21.1% |
|
Women |
|||||||
|
Low BMI (25%) |
45.0% |
1.0 (referent) |
52.2% |
1.2 (1.0, 1.4) |
60.8% |
1.4 (1.1, 1.7) |
50.9% |
|
Medium BMI (50%) |
35.7% |
0.8 (0.6, 1.0) |
47.7% |
1.0 (0.8, 1.1) |
55.2% |
1.2 (1.0, 1.5) |
45.7% |
|
High BMI (25%) |
38.2% |
0.9 (0.6, 1.2) |
48.3% |
1.1 (0.9, 1.3) |
50.8% |
1.1 (0.9, 1.4) |
47.6% |
|
Total |
39.2% |
|
48.9% |
|
54.4% |
|
47.5% |
|
NOTE: BMI = body mass index. SOURCE: Jones, Darakjy, and Knapik (2004). U.S. Army Center for Health Promotion and Preventive Medicine. Previously unpublished data from samples of male and female trainees at Fort Jackson, South Carolina, 1997-2001. See Figure 4-3 for cutpoints used to define categories. |
|||||||
TABLE 4-7 Risk of Attrition by Body Mass Index (BMI) and 1-Minute Run Time
|
|
Fast Run Time (25%) |
Medium Run Time (50%) |
Slow Run Time (25%) |
||||
|
|
Attrition Risk |
Risk Ratio (95% CI) |
Attrition Risk |
Risk Ratio (95% CI) |
Attrition Risk |
Risk Ratio (95% CI) |
Total |
|
Men |
|||||||
|
Low BMI (25%) |
6.0% |
1.0 (referent) |
10.1% |
1.7 (1.0, 2.9) |
16.1% |
2.7 (1.4, 5.1) |
9.5% |
|
Medium BMI (50%) |
6.1% |
1.0 (0.6, 1.8) |
7.0% |
1.2 (0.7, 2.0) |
16.2% |
2.7 (1.6, 4.6) |
8.6% |
|
High BMI (25%) |
6.6% |
1.1 (0.4, 3.2) |
6.8% |
1.1 (0.6, 2.1) |
14.3% |
2.4 (1.4, 4.1) |
10.2% |
|
Total |
6.1% |
|
7.7% |
|
15.4% |
|
9.2% |
|
Women |
|||||||
|
Low BMI (25%) |
7.2% |
1.0 (referent) |
15.3% |
2.1 (1.1, 4.0) |
25.6% |
3.5 (1.8, 7.2) |
14.4% |
|
Medium BMI (50%) |
7.6% |
1.0 (0.5, 2.1) |
14.1% |
2.0 (1.1, 3.6) |
30.5% |
4.2 (2.3, 7.8) |
15.8% |
|
High BMI (25%) |
10.3% |
1.4 (0.6, 3.5) |
15.9% |
2.2 (1.1, 4.2) |
33.7% |
4.7 (2.5, 8.6) |
21.8% |
|
Total |
7.9% |
|
14.8% |
|
30.8% |
|
16.9% |
|
NOTE: BMI = body mass index. SOURCE: Jones, Darakjy, and Knapik (2004). U.S. Army Center for Health Promotion and Preventive Medicine. Previously unpublished data from samples of male and female trainees at Fort Jackson, South Carolina, 2001, 2003. See Figure 4-4 for cutpoints used to define categories. |
|||||||
TABLE 4-8 Multivariate Analysis of Risk Factors for Injury during Army Basic Combat Training, Fort Jackson, South Carolina, 1998-2000
|
|
Injury Risk Ratio (95% CI) |
|
|
Variable |
Unadjusted |
Adjusteda |
|
Low cardiorespiratory fitness |
|
|
|
1 quartile decrease in run time |
1.11 (1.07, 1.15) |
1.13 (1.09, 1.17) |
|
Body fatness |
|
|
|
1 quartile increase in BMI |
1.00 (0.96, 1.04) |
0.97 (0.93, 1.00) |
|
Gender (female versus male) |
2.25 (2.07, 2.45) |
2.26 (2.08, 2.45) |
|
NOTE: CI = confidence interval. aControlling for the other variables listed in this table. SOURCE: Jones, Darakjy, and Knapik (2004). U.S. Army Center for Health Promotion and Preventive Medicine. Previously unpublished data from samples of male and female trainees at Fort Jackson, South Carolina. See Figure 4-3 for cutpoints used to define categories. |
||
These results underscore the importance of strengthening the role of fitness testing (at least for cardiorespiratory fitness) in current recruitment procedures. Potentially, fitness could be improved by introducing a new standard based on a simple test of physical fitness. The Accessions Medical Standards Analysis and Research Activity has experimented with the introduction of a simple step test into the MEPS (Krauss, 2004).
Attrition
There is clear evidence that preservice fitness is directly related to attrition. In a longitudinal study of Army recruits who entered military service in 1999, the physical fitness levels of recruits when arriving at basic training predicted attrition both during training and years later, in operational units.2 Specifically, recruits who passed the Army’s physical fitness test both very early in training and later in training had an 18.9 percent attrition rate from their operational unit, whereas those who failed the test both early and later in training had a 26 percent attrition rate from
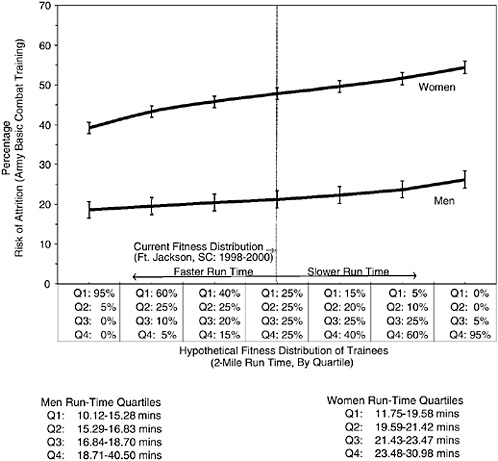
FIGURE 4-3 Relationship between risk of injury and physical fitness (2-mile run time).
SOURCE: Jones, Darakjy, and Knapik (2004). U.S. Army Center for Health Promotion and Preventive Medicine. Previously unpublished data from samples of male and female trainees at Fort Jackson, South Carolina.
their unit. A recruit’s race was not predictive of pass/fail status on either the early or the later fitness tests during basic training; however, women were much more likely to fail, while those who self-rated their fitness level as high were much more likely to pass.
To further analyze the relationship between fitness and attrition, the committee used data provided by USACHPPM (data from two studies conducted at Fort Jackson in 2000 and 2003; see the description in the previous section).
The analysis of the USACHPPM injury data in the previous section identified poor physical fitness as a strong risk factor for injury, and the analysis of the attrition data shows that it is an even stronger risk factor for attrition (Table 4-9). Each 1 quartile decrease in performance on the timed run test was associated with about a 50 percent increase in the risk of attrition (adjusted risk ratio of 1.51, 95 percent CI: 1.40, 1.62). Gender was a strong risk factor for attrition, although less so than it was for injury. When we assigned midpoint scores to the fitness quartiles, the risk ratio for women was reduced to 1.34 (95 percent CI: 1.14, 1.59).
As it did with injury, the committee conducted an analysis that involved shifting the distribution of cardiorespiratory fitness toward the least fit and measuring the effect on the outcome of attrition. For both men and women, improving the cardiorespiratory fitness of the recruit population has considerable potential to reduce the risk of attrition. Figure 4-4 illustrates these effects. For men, decreases in the cardiorespiratory fitness of the recruits so that almost all recruits were in the lowest quartile of fitness would increase the attrition risk from 9.2 percent (95 percent CI: 8.2, 10.3) to 15.4 percent (95 percent CI: 14.1, 16.6). If all female recruits were in the current lowest quartile, the attrition risk would increase from 17.1 percent (95 percent CI: 15.5, 18.3) to 30.8 percent (95 percent CI: 28.8, 32.0). Correspondingly, there would be reductions in the
TABLE 4-9 Multivariate Analysis of Risk Factors for First-Term Attrition During Army Basic Combat Training, Fort Jackson, South Carolina, 2000, 2003
|
|
Attrition Risk Ratio (95% CI) |
|
|
Variable |
Unadjusted |
Adjusteda |
|
Low cardiorespiratory fitness |
|
|
|
1 quartile decrease in speed |
1.49 (1.39, 1.60) |
1.51 (1.40, 1.62) |
|
Body fatness |
|
|
|
1 quartile increase in body weight |
1.09 (1.02, 1.16) |
0.99 (0.93, 1.06) |
|
Gender (female versus male) |
1.84 (1.59, 2.13) |
1.87 (1.62, 2.15) |
|
aControlling for the other variables listed in this table. SOURCE: Jones, Darakjy, and Knapik (2004). U.S. Army Center for Health Promotion and Preventive Medicine. Previously unpublished data from samples of male and female trainees at Fort Jackson, South Carolina. See Figure 4-4 for cutpoints used to define categories. |
||
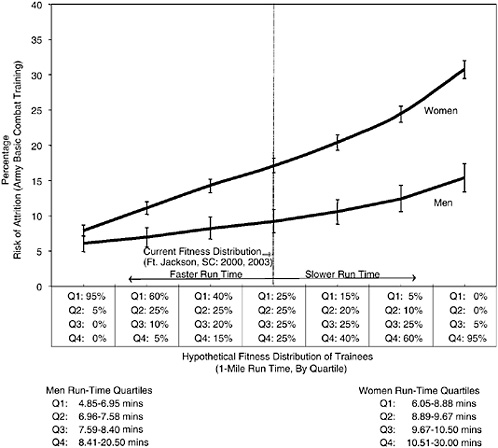
FIGURE 4-4 Relationship between risk of attrition and physical fitness (1-mile run time).
SOURCE: Jones, Darakjy, and Knapik (2004). U.S. Army Center for Health Promotion and Preventive Medicine. Previously unpublished data from samples of male and female trainees at Fort Jackson, South Carolina.
attrition risk for both men and women if the distribution of cardiorespiratory fitness could be shifted towards increasing fitness.
These analyses confirm the importance of low cardiorespiratory fitness as a readible, measurable, and modifible risk factor for injury and attrition in military recruits, and they underscore the potential for current qualifying standards to include some test of physical fitness. At a minimum, such a test would be useful for screening those recruits who would benefit from remedial fitness training. Such programs have been shown to reduce injury and attrition (Knapik et al., 2001a, 2003a, 2004a, 2004c).
Programs that modify the training environment so that the physical challenge is presented in a gradual or incremental fashion for all recruits are also effective (Rice et al., 2001).
SCIENCE OF MUSCULOSKELETAL INJURIES
Multidimensional Nature of Risk
Military and civilian research efforts have identified several risk factors for musculoskeletal injury, categorized as individual characteristics, physical demands, and psychosocial demands. Table 4-10 presents a list of studies that have identified risk factors for overuse and traumatic injury, classified by whether the study addressed individual characteristics, physical demands, or psychosocial demands. Individual characteristics include age, gender, race, physical structure, previous injury, previous physical activity, and physical fitness. Physical demands are physical stressors, such as running, marching, lifting, carrying, and jumping, imposed by the training and work environment. Psychosocial demands include pressure to perform and requirements to conform to a particular social or organizational structure. Because the causal pathways to musculoskeletal injury include a consideration of all these factors, it is important to consider their interactions. That is, the investigation of any one potential risk factor may shed only partial light on how injuries occur and how they might be prevented. The following sections examine the scientific literature characterizing each of these risk factors with the purpose of illuminating its contribution to the occurrence and prevention of injury.
Physical Demands
Load-Tolerance Relationship A fundamental concept in understanding biomechanical risk associated with physical activity involves the concept of the load-tolerance relationship. This concept suggests that for an activity to minimize risk, the activity should be designed so that the load imposed upon a tissue during the execution of the task does not exceed the tolerance of the structure. This concept is illustrated in Figure 4-5. During an activity, a loading pattern is developed on a body structure that is repeated as the activity is repeated. When the magnitude of the load imposed on a structure is less than the tissue tolerance, the task is considered safe and the magnitude of the difference between the load and the tolerance is considered the safety margin. Implicit in this figure is the idea that risk occurs when the imposed load exceeds the tissue tolerance. While tissue tolerance is defined as the ability of the tissue to withstand a
TABLE 4-10 Risk Factors for Developing Overuse and Traumatic Injuries in Military Populations
|
Risk Category |
Risk Factor |
Supporting Literature |
|
Physical factors |
Greater physical demand levels (including exercise) |
Berkowitz et al., 1999; DiBenedetto et al., 2002; Dybel and Seymour, 1997; Feuerstein, Berkowitz, and Peck, 1997; Huang and Feuerstein, 2004; Jones, Cowan, and Knapik, 1994; Lincoln et al., 2002; Potter et al., 2002; Shaffer et al., 1999b; Smith and Cashman, 2002; Tomlinson, Lednar, and Jackson, 1987 |
|
Individual factors |
Low levels of past physical activity |
Almeida et al., 1999; Gardner et al., 1988; Jones et al., 1993a, 1993b; Kowal, 1980; Shaffer et al., 1999a; Winfield et al., 1997 |
|
|
Low levels of physical fitness |
Almeida et al., 1999; Bell et al., 2000; Jones et al., 1993a, 1993b; Knapik et al., 1993; Kowal, 1980; Reynolds et al., 1994; Schneider et al., 2000; Shaffer et al., 1999a; Pope, 2002 |
|
|
Smoking |
Jones et al., 1993a; Lincoln et al., 2002; Reynolds et al., 1994 |
|
|
Age (older) |
Brudvig et al., 1983; Jones et al., 1993a; Lincoln et al., 2002; Pope, 2002 |
|
|
Age (younger) |
Feuerstein, Berkowitz, and Peck, 1997; Knapik et al., 1993; Tomlinson, Lednar, and Jackson, 1987; Winfield et al., 1997 |
load without structural damage, current research is beginning to expand the concept of tolerance to include not only mechanical tolerance of the tissue but also the point at which the tissue exhibits an inflammatory reaction.
Many activities associated with exercise as well as work tasks involve lighter tissue loads yet have become increasingly repetitive. The conceptual load-tolerance model can also be adjusted to account for this type of risk exposure. Figure 4-6 shows that biomechanics logic can account for this trend by decreasing the tissue tolerance over time. As suggested in this figure, during repetitive activities the load imposed on a tissue remains relatively constant; however, the ability of the tissue to tolerate the load decreases over time. This is believed to be the mechanism of risk during highly repetitive activities or activities that are performed for extended periods of time.
|
Risk Category |
Risk Factor |
Supporting Literature |
|
|
Gender (male) |
Tomlinson, Lednar, and Jackson, 1987 |
|
|
Gender (female) |
Brudvig et al., 1983; Feuerstein, Berkowitz, and Peck, 1997; Geary et al., 2002; Gemmell, 2002; Kelly and Bradway, 1997; Kowal, 1980; Pester and Smith, 1992; Smith et al., 2000; Snedecor et al., 2000 |
|
|
Short stature |
Jones et al., 1993a |
|
|
Race (Caucasian) |
Bell et al., 2000; Brudvig et al., 1983; Sulsky et al., 2000 |
|
|
Lower extremity morphology |
Beck et al., 1996; Cowan et al., 1993, 1996; Jones, Cowan, and Knapik, 1994 ; Jones et al., 2000; Kaufman et al., 1999, Winfield et al., 1997 |
|
|
Previous injury history |
Almeida et al., 1999; Jones et al., 1993a; Lincoln et al., 2002; Smith and Cashman, 2002 |
|
Psychosocial/organizational factors |
Occupational stress |
Feuerstein, Berkowitz, and Peck, 1997; Huang and Feuerstein, 2004; Lincoln et al., 2002 |
|
|
Job satisfaction |
Huang and Feuerstein, 2004; Lincoln et al., 2002 |
|
|
Low pay grade |
Lincoln et al., 2002 |
|
|
Greater cognitive processing |
Huang and Feuerstein, 2004 |
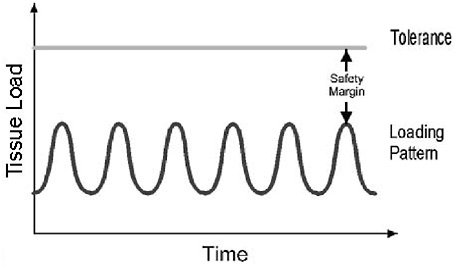
FIGURE 4-5 Traditional load-tolerance relationship between loads imposed upon a tissue and the ability of a tissue to withstand (tolerate) the load.
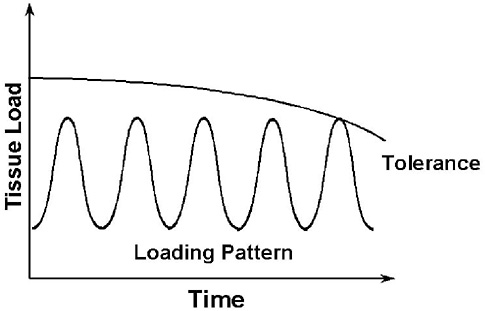
FIGURE 4-6 Load-tolerance relationship during repetitive activities. The load remains relatively constant; however, the tolerance decreases with increasing repetition.
Acute Injuries Versus Cumulative Trauma Two types of trauma can affect the human body and lead to musculoskeletal disorders in occupational settings. Acute trauma can occur when a single application of force is so large that it exceeds the tolerance of the body structure during an occupational task. Acute trauma is associated with large exertions of force that would be expected to occur infrequently, such as when a person falls and creates a large impact on a limb. This situation would result in a peak load that exceeds the load tolerance.
Cumulative trauma refers to the repeated application of force to a structure that tends to wear it down, lowering its tolerance to the point at which the tolerance is exceeded through a reduction of this tolerance limit (Figure 4-6). Cumulative trauma represents wear and tear on the structure. This type of trauma is becoming more common in occupational settings, as more repetitive jobs requiring lower force exertions become more prevalent.
The cumulative trauma process can initiate a response resulting in an inflammatory cycle that is extremely difficult to break. The cumulative trauma process begins by exposure to manual exertions that are either frequent (repetitive) or prolonged. The repetitive application of force can affect either the tendons or the muscles of the body. If the tendons are
affected, these are subject to mechanical irritation as they are repeatedly exposed to high levels of tension. Groups of tendons may undergo friction due to the repetitive activity. The physiological response to this mechanical irritation can result in inflammation and swelling of the tendon. The swelling will stimulate the nociceptors surrounding the structure and signal the central control mechanism (the brain) via pain perception that a problem exists.
In response to this pain, the body attempts to control the problem via two mechanisms. First, the muscles surrounding the irritated area will coactivate in an attempt to stabilize the joint and prevent motion of the tendons. Since motion will further stimulate the nociceptors and result in further pain, motion avoidance is indicative of the start of a cumulative trauma disorder and often indicated when workers shorten their motion cycle and move slower. Second, in an attempt to reduce the friction occurring within the tendon, the body can increase its production of lubricants (synovial fluid) within the tendon sheath. However, given the limited space available between the tendon and the tendon sheath, the increased production of synovial fluid often exacerbates the problem by further expanding the tendon sheath. This action further stimulates the surrounding nociceptors.
This initiates a vicious cycle in which the response of the tendon to the increased friction results in a reaction (inflammation and the increased production of synovial fluid) that exacerbates the problem. Once this cycle is initiated, it is very difficult to stop. Anti-inflammatory agents are often prescribed in order to break this cycle. The process results in chronic joint pain and a series of musculoskeletal reactions, including reduced strength, reduced tendon motion, and reduced mobility. Together, these reactions result in a functional disability.
Cumulative trauma can also affect the muscles. Muscles are over-loaded when they become fatigued. Fatigue lowers the tolerance to stress and can result in micro trauma to the muscle fibers. This micro trauma typically means the muscle is partially torn, which causes capillaries to rupture and results in swelling, edema, or inflammation near the site of the tear. The inflammation can stimulate nociceptors and result in pain. Once again, the body reacts by cocontracting the surrounding musculature and minimizing the joint motion. However, since muscles do not rely on synovial fluid for their motion, there is no increased production of synovial fluid. Nevertheless, the end result of this process is the same as that for tendons—reduced strength, reduced tendon motion, and reduced mobility. The ultimate consequence of this process is, once again, a functional disability.
Although the stimulus associated with the cumulative trauma process is somewhat similar for tendons and muscles, there is a significant
difference in the time required to heal the damage to a tendon compared with a muscle. The mechanism of repair for both tendons and muscles is dependent on blood flow. Blood flow provides nutrients for repair as well as dissipates waste materials. However, the blood supply to a tendon is a fraction of that supplied to a muscle (typically about 5 percent in an adult). Thus, given an equivalent strain to a muscle and a tendon, the muscle will heal rapidly (if not reinjured), whereas the tendon could take months to accomplish the same level of repair. For this reason, ergonomists must be particularly vigilant in the assessment of workplaces that could pose a danger to the tendons of the body. In industrial settings, this lengthy repair process becomes the motivation for early reporting of musculoskeletal discomfort. It is common for industry to incorporate ergonomic processes that place a high value on identifying potentially risky jobs before a lost-time incident occurs through such mechanisms as discomfort surveys.
Building Tolerance—Wolff’s Law Biological tissue has the ability to adapt to load demands up to a point. Specifically, bone can be considered to be a dynamic tissue and thus can respond to loading conditions. Bone responds to loading through remodeling of the bone structure. The nature of the load defines how the bone will remodel. Typically, bone remodels so that the trabecular network within the bone optimally resists compression and bending.
Bone tissue is capable of changing its shape, size, and structure in response to mechanical loads imposed on the structure over time. This bone change or adaptation in response to tissue load was first described by Wolff in 1892 and is referred to as Wolff’s law. Wolff’s law states that bone will be deposited where needed and reabsorbed where it is not needed (Chaffin, Andersson, and Martin, 1999:579). Although the general concept of bone remodeling is well known, the precise relationships governing the response have not been described. Conversely, immobilization will result in adaptation of the tissue and a decrease in tolerance. It should be emphasized that adaptation to increase tolerance occurs only up to a certain point. All tissue will fail if loaded sufficiently.
The ability for bone to remodel is also influenced by age and gender. Maximum skeletal bone mass occurs around age 30 and then decreases with increasing age. In addition, large differences in bone mass begin to occur once women reach menopause.
Adaptation also occurs in muscle tissue. Increases in muscle mass can occur if muscle is loaded and then permitted to rest for a sufficient period of time. This concept is well known to body builders, who stress the muscle groups during a training session and then allow the muscle to recover by training the muscle group every other day. In this training
method muscle tissue is stressed and then permitted to recover for approximately 48 hours. This provides time for nutrients to nourish muscle cells, and they respond by growing more muscle mass. However, as with bone remodeling, there are limits to muscle tolerance. Any tissue, when stressed sufficiently through acute or cumulative means, will fail.
Psychosocial Factors and Injuries
Psychosocial factors, such as pressure to perform, the organization of tasks, and the social context may also contribute to musculoskeletal injuries and attrition among military recruits. Few studies have attempted to understand the causal relationship between psychosocial factors and biomechanical loading of the musculoskeletal system.
Marras and colleagues performed controlled biomechanical assessments of spinal loading under diverse psychosocial conditions. Under the low stress psychosocial condition, subjects were asked to perform precisely controlled spine loading tasks while the experimenter provided a supportive (friendly) environment for the subject. Under the high stress psychosocial conditions, the same spine loading tasks were performed, except the psychosocial environment was unsupportive (unfriendly).
The assessments of spine loadings indicated that some subjects responded to the high stress environment with up to a 27 percent increase in spine loading, while other subjects displayed no difference in spine loading between conditions. Further analyses indicated that those subjects that responded with an increase in spine loading ranked higher on certain personality traits (introverts and intuitors). This study also provided insight into the biomechanical mechanism of increased risk. Even though the same physical task was performed under the high and low stress conditions, those subjects whose spine loads increased (introverts and intuitors) amplified their spine loads by increasing muscle coactivation. This increased muscle coactivation resulted in altered patterns of trunk muscle recruitments under the high stress conditions that were not necessary to perform the task but were a result of the stress environment. This increased coactivation caused the agonist and antagonist trunk muscles to oppose each other, thereby increasing spine loads as well as changing the nature (increased shear) of spine loading.
Further studies by Davis and associates demonstrated that the same mechanism of spine loading increases appeared under conditions in which mental demands and pacing were increased. Here again, greater coactivation was observed, thus increasing the loading of the spine.
Collectively, these studies show that there is a strong interaction among physical requirements of the task, the psychosocial environment, and the personality profile of the person. The personality characteristics
of the individual can interact strongly with the psychosocial environment and lead to increased coactivation of the musculoskeletal system. This coactivation typically increases joint loading and may lead to increases in cumulative tissue degeneration and increased risk of musculoskeletal disorders.
Although very few studies in the military have focused on psychosocial factors and how they may impact musculoskeletal injury, the combination of high physical training, preparing for combat, and intense operational tempo is bound to place psychological stress on military recruits. One study involving U.S. Marines found that decision authority and experienced responsibility for work were significant correlates for musculoskeletal pain intensity (Huang and Feuerstein, 2004). This study also found that increased time pressure and greater cognitive processing were also associated with increased musculoskeletal symptom reporting (Huang and Feuerstein, 2004). Other military studies have suggested that occupational stress and low job satisfaction were correlated with increased risk of musculoskeletal pain and disability (Feuerstein, Berkowitz, and Peck, 1997; Lincoln et al., 2002).
Individual Factors
Physical Activity, Physical Fitness, and BMI As described earlier in this chapter, low physical fitness is a major modifiable risk factor for injury and attrition in military training. Poor physical fitness is correlated with low levels of physical activity (American College of Sports Medicine, 1998). Low-level physical fitness at the time of recruitment is a major risk factor for attrition that is not addressed in current recruitment standards, other than through the assessment of BMI, which is a poor surrogate for measuring physical fitness (this is discussed further in Chapter 5). One study has suggested that BMI is not a strong independent risk factor for injury (Bell et al., 2000); however, research is needed to examine how BMI may modify the effect of low physical fitness. Tables 4-6 and 4-7 demonstrate that the highest risk of injury, for both men and women, is in the group with lowest fitness and lowest BMI—the lean but unfit (Jones, Darakjy, and Knapik, 2004). Thus, higher BMI may be possibly protective of injury in low fitness recruits.
Gender As reported in the analysis above and in the literature (see Table 4-10; Kaufman, Brodine, Shaffer, 2000; Institute of Medicine, 1998), injury rates for women are generally substantially higher than for men during basic training. Numerous biomechanical differences between men and women have been reported in the literature, which collectively may help to explain the differences between these musculoskeletal injury rates.
Studies have identified biomechanically relevant differences between genders in the knee,3 back,4 shoulder,5 hip,6 elbows,7 and fingers.8
While biomechanically related risk is multidimensional, several factors may help to explain the greater risk of musculoskeletal disorders for women. First, differences in muscle mass and the mechanical advantage of the muscles relative to the joint have been reported for the back, with women generally at a biomechanical disadvantage (Janssen et al., 2000; Jorgensen et al., 2001, 2003a; Marras et al., 2001). Differences in muscle line of action are associated with differences in the muscle origin and insertion in women and typically provide less mechanical advantage and greater muscle (and joint) loading (Jorgensen et al., 2001). Similarly, studies of the knee joint muscle mass have also indicated reduced muscle mass and a muscle mechanical advantage in women (Suzuki et al., 1996; Wretenberg et al., 1996; Csintalan et al., 2002; Wojtys et al., 2003).
Second, there are differences in the bone and ligamentous tissue size and response as a function of gender. Within the knee joint, Besier and colleagues (2005) found that the knee contact area of women compared with men was significantly smaller when flexed but similar at full extension. In addition, men have slightly greater cartilage thickness (Eckstein et al., 2001). Similarly, differences in the size and bone density of vertebral bodies have been documented between men and women, with women having reduced size (Gilsanz et al., 1994a, 1994b; Ebbesen et al., 1999; Marras et al., 2001). Ligamentous creep response also appears to differ between men and women, with women exhibiting greater creep (and less stability) especially when the knee is flexed at 35 degrees (Chu et al., 2003).
Significant biomechanical differences in neuromuscular response between genders have also been documented in the literature. Granata and colleagues (2002) have noted reduced stiffness in the quadriceps of equivalently trained women compared with men. This would indicate reduced
leg stability and partially explain the increased risk for women. Shultz and colleagues (2001) identified differences in the timing of muscular recruitment within the quadriceps between men and women. When ligament loading occurs, women have been noted to experience increased muscle spasms and attenuated muscular function (Sbriccoli et al., 2005). Cao and colleagues (1998) have described the differences in gait response time between men and women. Collectively, these differences have been found to impact running gait due to significantly greater hip adduction, hip internal rotation, and knee abduction angle in women (Ferber et al., 2003). These differences have also resulted in greater risk for women participating in sports as well as a poorer ability to recover from a tripping (Wojcik et al., 2001).
Similar differences in neuromuscular functioning have been noted in the low back. Lindbeck and Kjellberg (2001) documented differences in the use of knee and trunk kinematics as a function of gender. These differences, when combined with the structural differences noted earlier, interact and result in differences in the magnitude and nature of spine loading (Marras et al., 2002, 2003). They may be further exacerbated by differences in personality, which are often gender related (Marras et al., 2000) as well as by the level and type of mental workload (Davis et al., 2002).
Race and Age Increasing age and white race are noted as risk factors for overall injury (Table 4-10), for injury resulting in hospital stays for disability and for discharges from the service as result of disability (Accessions Medical Standards Analysis and Research Activity, 2002). Sulsky and colleagues (2000) studied age as a risk factor for disabling knee injury and noted that the effect of age was very different for men and women. Non-Caucasians had a lower risk of knee injury (relative risk, RR, of 0.70 for men, 0.40 for women). In contrast, Launder studied hospitalizations for sports-related and training-related injuries and found the highest rates among younger age groups and black men.
The Accessions Medical Standards Analysis and Research Activity conducts routine analysis of the available data on first-term attrition. It reports a higher risk of hospital admission within a year of accession for older age groups (> age 30 versus ages 17-20, RR = 1.46, 95 percent CI: 1.34, 1.60). Similar relationships are observed for discharges for conditions “existing prior to service” and for discharge for disability. Relative to whites, blacks were at slightly higher risk of hospital admission within a year of accession (RR = 1.04; 95 percent CI: 1.01, 1.06) but at lower risk for discharges for conditions existing prior to service (RR = 0.76, 95 percent CI: 0.76, 0.80) and for disability discharge (RR = 0.80, 95 percent CI: 0.72, 0.89).
It is unknown to what extent age and race may modify the protective effect of high fitness on injury and attrition. The data used by the committee to analyze the combined effect of fitness and BMI on injury and attrition does not contain sufficient numbers to permit further stratification by categories of race and age. Research is needed to address this topic. Whenever possible, associations should be disaggregated by race to assess the extent to which associations are constant within strata of race.
Smoking A history of smoking prior to the start of basic training is a risk factor for injury; this is addressed in Chapter 7. There are a number of plausible biological mechanisms through which smoking may predispose a recruit to injury from the stresses imposed on the body in basic training, including restricted circulatory flow and degraded ability to maintain high-quality bone health. In addition, smoking may be correlated with behavioral factors that are independent risk factors for injury, such as risk-taking behavior.
Previous Injury History A positive injury history is a risk factor for injury during basic training (Table 4-10), and similar findings are reported in the sports medicine literature for athletic populations (Kucera et al., 2005). The mechanism by which a positive history of previous injury is associated with the incidence of injury is currently not well understood. Like smoking, this may reflect a positive correlation with behavioral factors (such as risk-taking) that are predictive of injury. It may also reflect an anatomical weakness in a particular site in the body, such as chronic ankle instability, increased risk due to low physical fitness and fatigue, or poor rehabilitation of an original injury that may predispose that body site to reinjury.
Evaluating Functional Capacities: A Framework for Reducing Risk
The logic behind assessments of functional capacities is that a person’s physical abilities (capacity) can be measured, documented, and evaluated via a standard physical testing procedure and compared with physical exposures that are required to perform a particular task or job. Thus, by matching worker capabilities to task demands in this manner, it is thought that the probability that an individual’s capacity is exceeded by the job requirements can be minimized. Furthermore, it is assumed that if task demands are sustained within the limits of the job demands, the risk of a task-related injury is minimized. These assessments have been successfully employed in numerous industrial situations in an attempt to control the cost of musculoskeletal injuries in the workforce (Key, 1999).
Evaluating functional capacity requires a job analysis that involves a quantitative job description documenting the various physical exposures associated with job demands, such as strength, cardiovascular, and postural demands of the job. The applicant’s capabilities are compared with these essential job functions. If a capacity insufficiency in the applicant’s capabilities is noted relative to the job requirements, he or she may be not be selected for employment, may be placed in a conditioning, strengthening, or body mechanics program, or may be assigned to a less demanding job. For example, Sharkey (2000) reviewed the job demands and the development of a work capacity test for wildland firefighting. The first step was a job analysis of firefighting tasks. Using the Uniform Guidelines for Employee Selection (Federal Register, 1979), the job analysis data were used in combination with past field studies to identify potential job-capacity selection tests. Laboratory studies were used to validate the selected tests, followed by a field evaluation. One of the tests, the pack test, was selected as a valid, job-related test to measure work capacity for these wildland firefighters.
This functional capacity evaluation approach may provide a framework to assess the risk of musculoskeletal disorders associated with exposure to such military tasks as basic training. If the physical requirements of basic training can be documented, the abilities of the incoming recruits could be compared with these training demands, and theoretically it should be possible to predict the percentage of recruits who would be expected to suffer task-related injuries. Given this quantifiable structure, it would also be possible to assess how the characteristics of the incoming recruiting class would need to change so that attrition due to musculoskeletal injury would meet a specific target. In this way it might be possible to optimize youth recruitment so that the maximum number of youths could be recruited with the minimum number of attritions.
APPROACHES TO REDUCING INJURIES AND ATTRITION
Assessment of Physical Fitness Prior to Shipping to Basic Training
All branches of the military require active-duty personnel to meet physical fitness standards, and all the branches provide for administration of physical fitness tests during and after basic training. However, currently none of the military branches systematically tests its recruits for low physical fitness prior to their shipping to basic training. This results in some recruits starting basic training with very low physical fitness, and, as mentioned earlier, these recruits are known to be at significantly elevated risk for injury and attrition. These high-risk recruits could be identified prior to their initiation of basic training if procedures
were adopted for the testing of physical fitness at the MEPS or at some point subsequent to being seen at the MEPS but prior to shipping to basic training.
Although physical fitness has not been included in military recruitment protocols in the past, such procedures are widely used in the private sector and the scientific literature on measurement of physical fitness provides many test options that meet acceptable standards for validity and reliability. Accordingly, it should be possible to develop procedures that would be relatively efficient and valid in the hands of military personnel who are involved in the recruitment processes. That said, addition of a physical fitness testing procedure would add costs to the recruitment process. Presumably, these costs would vary depending on the phase at which the testing procedure is incorporated and on the nature of the fitness test. In addition, there would be some modest increase in risk to the recruits who would be required to complete the physical fitness test.
The primary purpose for adding a physical fitness assessment prior to initiation of basic training would be to identify prospective recruits or accessions whose physical fitness is so low as to place them at substantially elevated risk for injury or attrition. Of course, identifying such persons would be useful only if appropriate actions were taken based on their identification as what we call “low fit.” There are a number of different actions that could be taken, and any or all of them would be expected to reduce injury and attrition in the population of basic trainees and first-term recruits. If a physical fitness test was administered prior to recruitment, those falling below a specified standard could be excluded at that time, provided with guidance on increasing their fitness, retested later, and reaccepted if they subsequently met the standard. This is essentially equivalent to placing recruits in the delayed entry program (DEP) and providing physical training for them. Alternatively, those found to be low fit prior to accession could be accepted into military service and referred to a mandatory training program, which would be completed prior to shipping to basic training. Another alternative, if basic training protocols were modified to allow it, is that low-fit inductees could initiate basic training without delay but complete training procedures that would be scaled to their lower level of fitness.
Physical Training Programs for Low-Fit Recruits Prior to Basic Training
If testing procedures are adopted that identify some recruits as low fit, they could be referred to physical training programs that would be designed to increase their fitness to acceptable levels prior to initiation of standard basic training. As suggested in the preceding section, this fundamental approach could be applied regardless of the phase of the accession
process at which the fitness screen is applied. However, the nature and setting of the training program is likely to depend on the phase of the process at which it is incorporated. For example, if fitness was assessed at any point prior to arrival at basic training, those found to be low fit could be provided with guidelines for self-management of a physical training program, or they could be referred to community-based programs that meet specified standards or criteria. Alternatively, low-fit recruits could be referred to physical training programs that would be delivered by the military branch and completed prior to initiation of basic training.
The body of knowledge in exercise science and widely accepted professional guidelines provide an extensive and solid basis for the design and delivery of physical fitness programs for healthy adults (American College of Sports Medicine, 1998, 2005). This knowledge base indicates that an individual’s physical fitness level is determined by a combination of genetic and environmental factors, with the key environmental factor being recent physical activity participation. The scientific literature on exercise training shows that individuals vary greatly in their adaptations to a particular physical training program; that is, some persons demonstrate pronounced increases in fitness as a result of training, while others show minimal or no change (American College of Sports Medicine, 1998, 2005). However, almost all low-fit persons show some increase in fitness with physical training, and the majority experience substantial increases in fitness with sustained exposure to training. Hence, there is a well-established technology for enhancing physical fitness in healthy young adults, and extensive scientific evidence demonstrates that most young adults can increase their fitness substantially with increased exercise participation (American College of Sports Medicine, 1998, 2005). There seems little question about the efficacy of physical training programs to increase physical fitness in low-fit recruits who would be identified through a fitness test.
As with physical fitness testing procedures, referral of low-fit recruits to exercise training programs would involve additional costs. If the training programs were undertaken prior to induction, these costs could be borne primarily by the individual recruit. However, the costs would be borne by the military branch if recruits are referred to special physical training programs after recruitment but prior to initiation of basic training. Also, exercise training involves some short-term health risks, although these risks are minimal in young, healthy adults.
Modification of Physical Training Procedures in Basic Training
Physical training is a central component of the basic training protocol of all military branches. This component addresses two broad goals. First,
physical training is designed to increase physical fitness so that graduates of basic training are prepared to meet the physical demands of advanced military training and to perform military occupations, including combat specialties. In addition, the physical training component of basic training seemingly contributes to the overall physical and psychological demands of the training process, which are aimed at preparing soldiers for the sometimes extraordinary stresses of military service. Because physical training serves both of these purposes and because of a traditional focus on team-building and unit identification in basic training, physical training protocols in basic training have tended to emphasize group exercise rather than individualized training methods. Typically, all members of a training unit engage in the same types and amounts of exercise without regard to the wide interindividual variability in physical fitness that is seen within units. While this method may serve some important purposes, it represents a violation of one of the most widely accepted tenets of exercise training: exercise intensity and dose should be adjusted in accordance with the initial fitness level of the individual. While it would probably not be practical to provide for total individualization of exercise training programs in basic training, it could be possible to consider the initial fitness status of recruits by grouping trainees for physical training on the basis of their current fitness levels.
Because sustained running is thought to be a problematic activity from the standpoint of increased risk of overuse injury, it would seem to be particularly useful to group trainees on the basis of current fitness for distance running sessions. This idea has been tested and found to be effective in reducing the risk of injury and attrition. Table 4-11 presents a summary of the literature on this topic.
The approaches examined have used modifications to existing training programs, particularly with regard to running, that emphasize grouping individual by fitness levels, matching training levels to individual fitness, and providing a gradual progression in running pace and running distance. In addition, most programs have significantly reduced the number of miles run per week. A complication of these studies is that it is not possible to randomize these programs at the level of the individual, since groups train as a unit; therefore, most studies have used historical cohorts as “controls.” Another feature of some programs is testing and assignment to “remedial” physical training protocols, either at the start of (Knapik et al., 2004a) or during (Knapik et al., 2003a, 2003b, 2004c; Rice et al., 2001) standard basic or advanced training. These programs have produced major reductions in the risk of injury without compromising the level of physical fitness at the completion of training (Almeida et al., 1997; Rice et al., 2001; Knapik et al., 2004c). In addition, at least one program has
TABLE 4-11 Modified Training Programs That Have Been Effective in Reducing Injuries in the Military
|
Intervention Approach |
Supporting Literature |
Intervention Outcome |
|
Reduction of high-impact training |
Scully and Besterman, 1982 |
73 percent reduction in stress fracture incidence |
|
|
Reinker and Ozburne, 1979 |
11 percent reduction in stress fracture rate |
|
|
Pester and Smith, 1992 |
13 percent reduction in stress fracture rate (16 percent in men, 7 percent in women) |
|
Reduction of running mileage and gradual training progression |
Almeida et al., 1997; Jones et al., 2000 |
50 percent reduction in stress fracture rate without a reduction in aerobic fitness |
|
|
Rice et al., 2001 |
Reduced lost-time injuries by 40 percent and musculoskeletal disorders by 49 percent. Fitness test pass rates slightly higher in intervention group |
|
|
Knapik et al., 2004c |
Risk of injury in basic training reduced by 33 percent in men and 40 percent in women |
|
Work-hardening training cycle (gradual increase) |
Reinker and Ozburne, 1979 |
11 percent reduction stress fracture rate |
|
Preconditioning and fitness appropriate training |
Lee et al., 1997 |
55 percent lower attrition rates |
|
Multiple intervention approach |
Kelly and Bradway, 1997 |
35 percent reduction in lost training days 83 percent reduction in overall attrition rate for musculoskeletal disorders |
|
|
Knapik et al., 2004b (Modified Physical Training, Injury Education, Injury Surveillance) |
50 percent reduction in relative risk of a time loss injury |
been subject to a benefit-cost analysis and found to produce annual savings of $14 million in the U.S. Army alone (Knapik et al., 2004a). Pope (2002) studied injury and attrition during training in the Australian army and concluded that introducing a running test to screen out low physical fitness recruits could generate cost savings of over $1 million annually.
|
Intervention Approach |
Supporting Literature |
Intervention Outcome |
|
Special training units for individuals identified as having low physical fitness based on a fitness test at the start of basic training |
Knapik et al., 2004a |
Risk of basic training attrition reduced from 25 to 8 percent in men; from 29 to 19 percent in women; cost savings of $14 million annually in the U.S. Army |
|
|
Knapik et al., 2004c |
No reduction in injury risk |
|
Special training units for individuals identified as having low physical fitness men and 63percent of the end of basic training |
Knapik et al., 2003a, 2003b |
Retention in service after one year of 74 percent of based on a fitness test at women who graduated through the special training unit |
Gender-Specific Physical Training Programs
Risk of overuse injuries to the lower extremities is much higher in female than in male basic trainees (Institute of Medicine, 1998), and it is well documented that fitness is consistently lower in female recruits than in their male counterparts (Sharp et al., 2002). Also, it seems very likely that low fitness is causally related to lower extremity injury and injury-related attrition from first-term military service (Jones et al., 2000). Accordingly, the current practice of integrating female and male recruits in the same basic training units and exposing the two gender groups to the same physical training program is a prescription for producing high injury rates in female trainees. It should not be surprising that rates of overuse injury in female trainees are extremely high. To reduce this risk, physical training procedures for female recruits could be adjusted in accordance with the lower average fitness level of women. Gender could be taken into account in the physical training element of basic training, either by creating separate training units for men and women or by grouping within gender-integrated units on the basis of fitness level. If the latter
approach was adopted, the lower fit subgroups would include disproportionately high percentages of women.
In addition to physical fitness, some of the neuromuscular, biomechanical, and anatomical differences between men and women may also play a role in injury causation in basic training. The higher risk of injury observed in women may be due to an independent contribution of these factors; they may also interact with low physical fitness to elevate the risk of injury in women. There is a need for studies that comprehensively compare risk factors for injury in military men and women.
SUMMARY
Research clearly indicates that low levels of physical fitness are closely linked to musculoskeletal injuries, and that musculoskeletal injuries are a significant problem in first-term military enlistees. These injuries impose devastating consequences to the Services in terms of monetary costs, military readiness, and attrition. However, none of the Services systematically assesses individual physical fitness levels prior to the shipping of recruits to basic training. In an effort to minimize the consequences of injury, previous studies have identified several modifiable risk factors that may synergistically affect injury causality. Some of these promising modifiable factors include the physical demands of unit training, individual physical fitness levels prior to the start of basic military training, and psychosocial stress. However, since musculoskeletal injury causality is multifactorial, it is essential to focus on the interactions of multiple factors in order to better understand the process of injury and disorder. In addition, it is clear that female recruits have a high risk of injury in basic training that is due, at least in part, to their lower physical fitness. Fundamental musculoskeletal, biomechanical, and neuromuscular differences in men and women may also play a role. There is currently limited information on how the training environment could be modified to ameliorate the high risk of injury in women (other than accommodating their differential fitness levels). Finally, military interventions aimed at modifying some of these factors have shown some success and provide a positive direction for future prevention and treatment of musculoskeletal injuries in the military.
CONCLUSIONS AND RECOMMENDATIONS
Recruitment
Currently, none of the Services systematically conducts comprehensive standardized physical fitness testing at the time of recruitment.
Standardized physical fitness testing prior to basic training would permit the identification of recruits at higher risk of injury and attrition. Individuals classified as not meeting a designated physical fitness standard could be assigned to remedial physical training prior to basic training (preship intervention), or to a modified basic training regime, or to both. There are a range of options for a physical fitness test (or tests) that would be valid, reliable, feasible to implement, and likely to be cost-effective.
Recommendation 4-1: A standardized physical fitness test should be selected and routinely implemented at some point prior to the initiation of basic military training.
Pretraining
Preship interventions aimed at improved physical fitness merit consideration. There is clear evidence that such programs would increase physical fitness in most recruits with low fitness, but evidence that these programs would reduce the incidence of injury or attrition in basic training is limited.
Recommendation 4-2: Research should be conducted to examine the relationship between physical training programs prior to basic training and the incidence of injury or attrition during basic training, focusing on recruits who would fall below a designated physical fitness standard at the start of basic training.
Training
Although training outcomes are the result of several interrelated factors, preliminary direct evidence suggests that imposing limited physical demands at entry to military training and increasing physical training demands as fitness levels increase could produce comparable levels of physical fitness to current training regimes, with markedly reduced injury rates. This approach should be considered when redesigning basic training.
Recommendation 4-3: Basic training’s physical and psychological demands should be tailored to broad categories of an individual’s initial fitness level and gradually increased over the duration of the training (in accordance with exercise prescription science and injury prevention principles) so that optimal fitness is achieved with minimal risk of musculoskeletal disorders, traumatic injury, and attrition.
Gender Differences
The literature supports the notion that, due to biomechanical and physical fitness differences, men and women have different risks of musculoskeletal disorders, traumatic injury, and attrition as a function of basic military training. In addition, these differences can impact the path to optimal fitness. Therefore, male and female training protocols should ideally be tailored differently. Female recruits have lower average levels of physical fitness and conditioning, at the initiation of basic training, than male recruits. However, it is currently unclear whether the higher risk of injury during basic training observed in women is entirely a function of their lower (on average) physical fitness, or whether it is also partly driven by the other numerous musculoskeletal, biomechanical, and neuromuscular differences between women and men. It is therefore unknown whether tailoring the demands of basic training to an individual’s fitness level (as per Recommendation 4-3) will fully address the problem of the higher risks of injury and attrition observed in female recruits.
Recommendation 4-4: Research should be undertaken to address the causes of the increased risk of injury and attrition in women. This research should address differences between men and women in physical fitness and should also address musculoskeletal, biomechanical, and neuromuscular factors.


